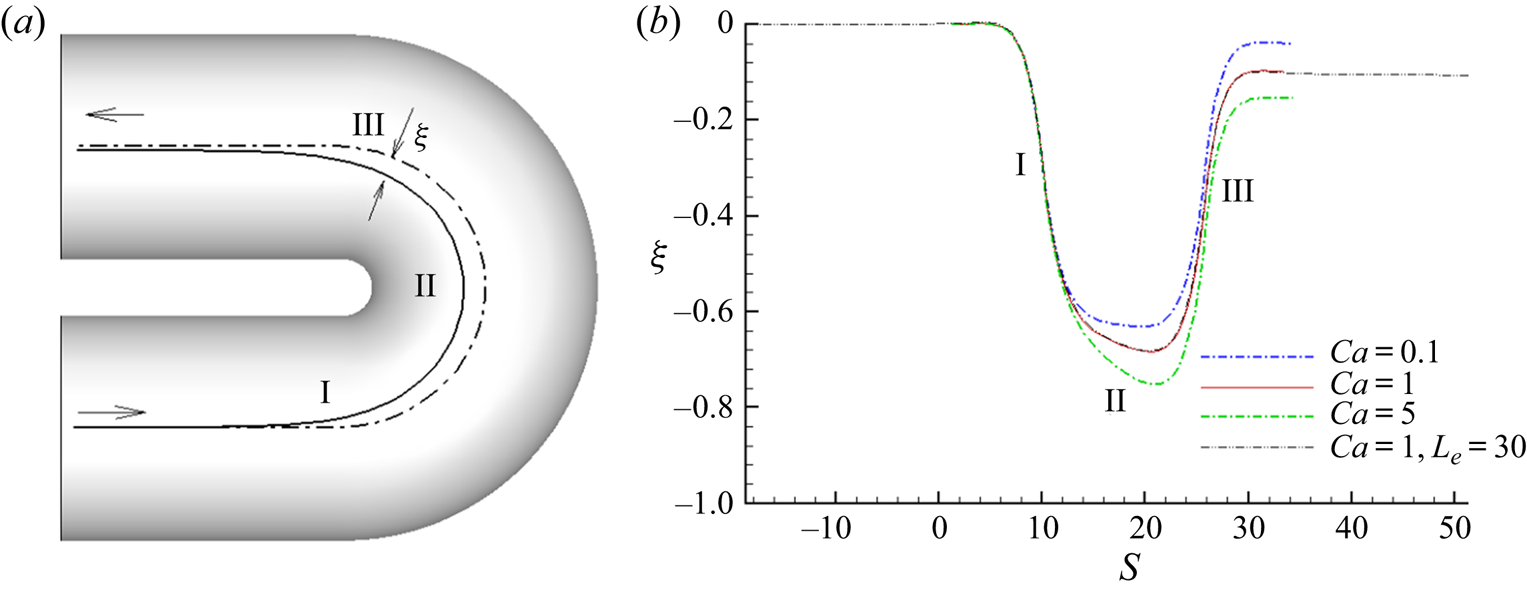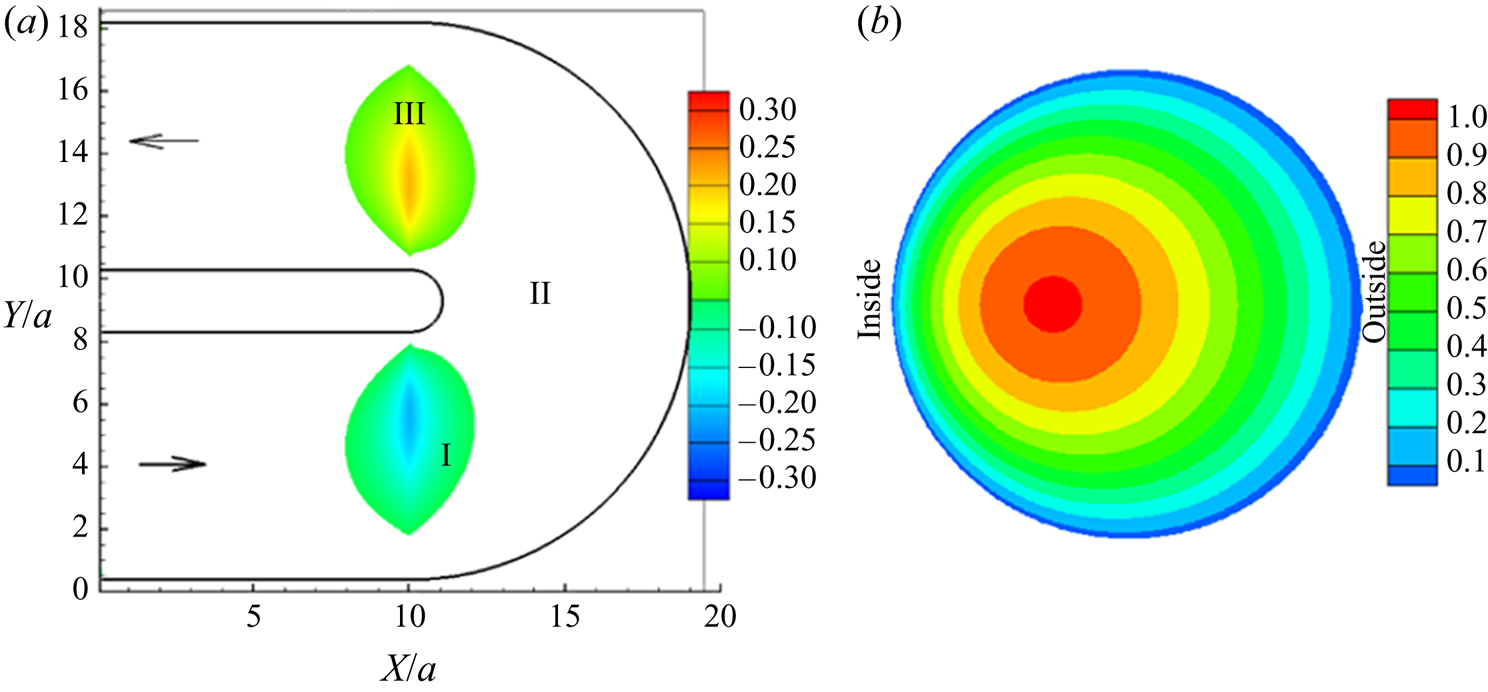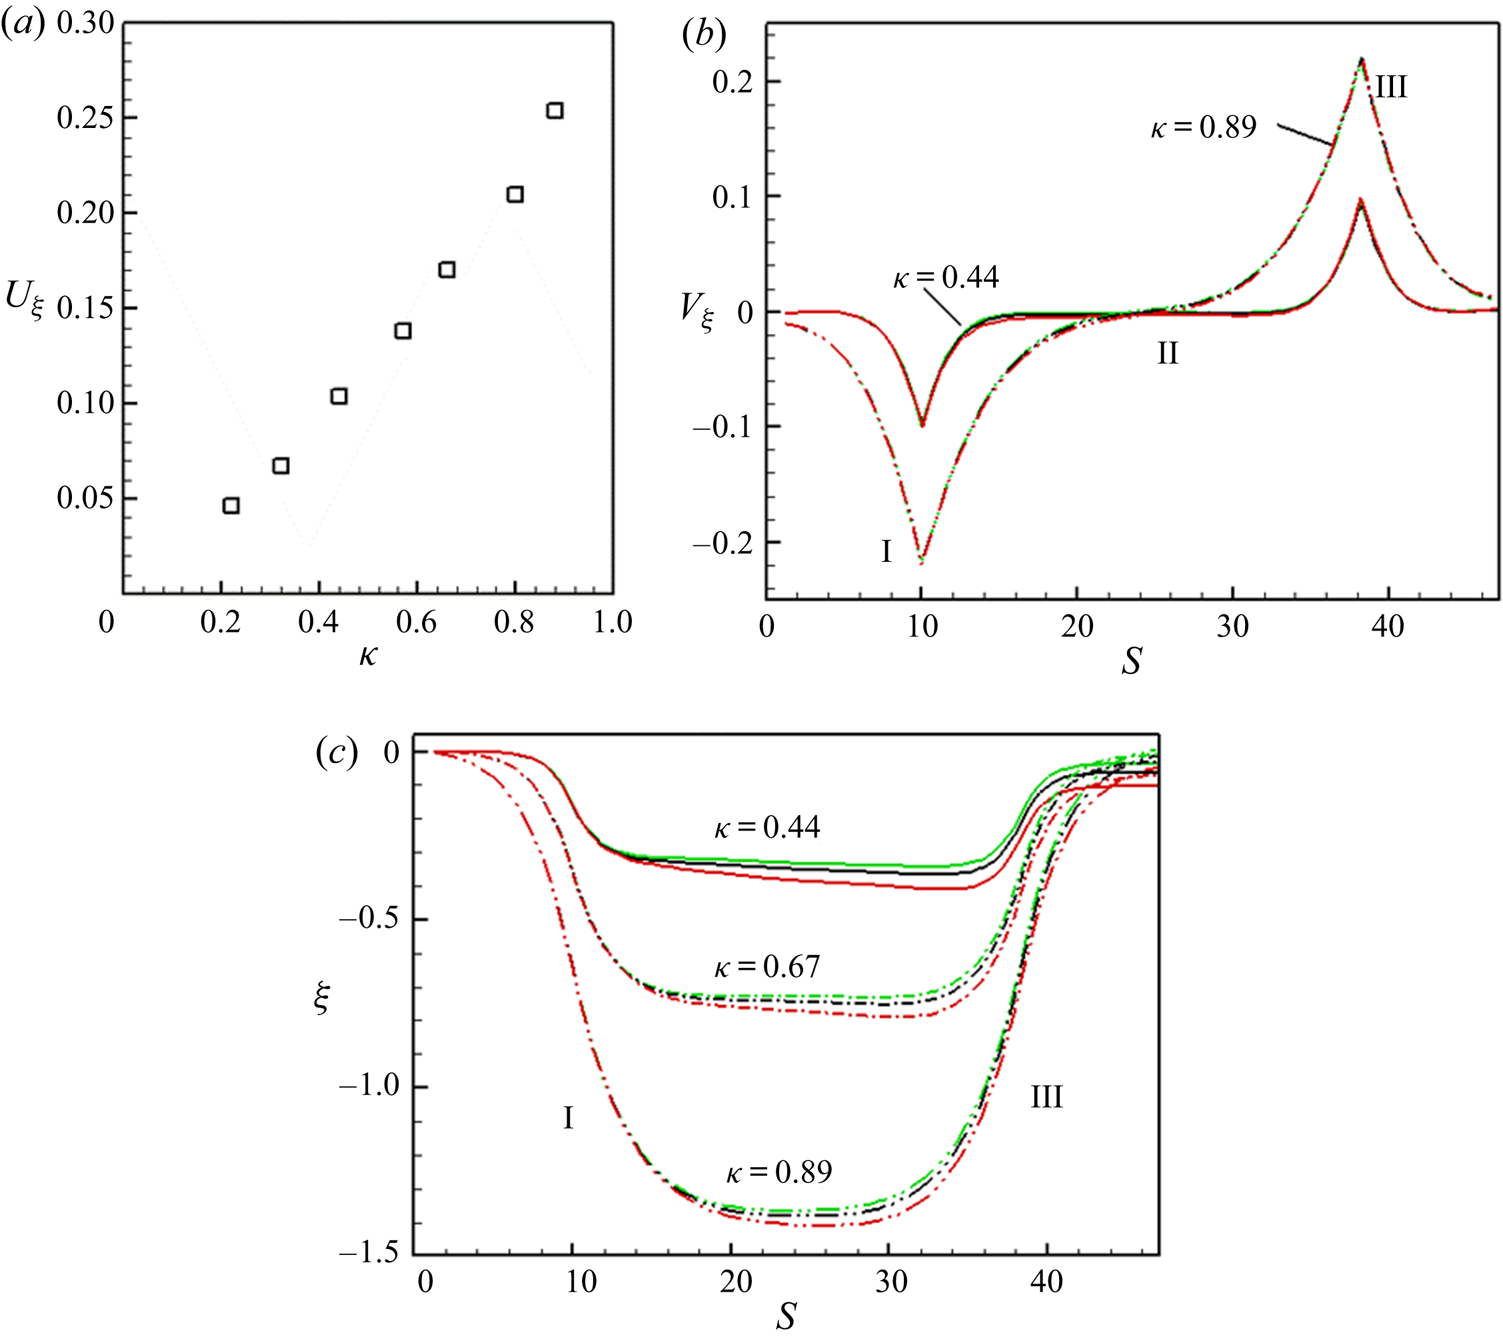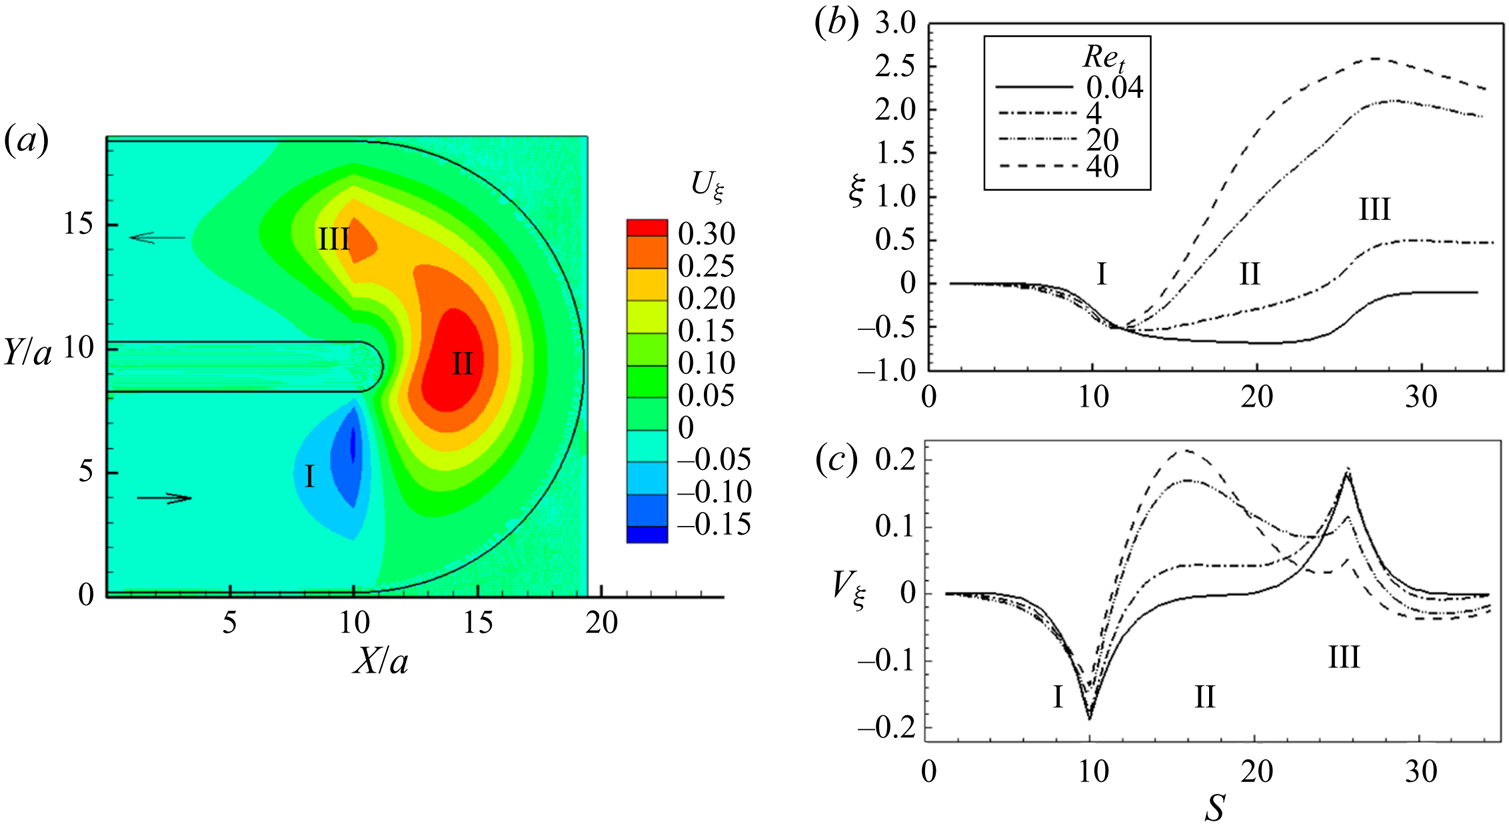



1. Introduction
Flow of particulate and cellular suspensions in a curved microvessel is encountered in physiological and non-physiological applications. A common physiological example is the flow of blood cells in vessels of micrometre-scale diameter, namely, the capillaries, arterioles and venules. These vessels are often curved or tortuous, and their tortuosity tends to increase under diseased conditions, such as hypertension, diabetes, sickle cell disease and tumour (Cheung et al. Reference Cheung, Chen, Larkin, Duong, Ramanujan, Tablin and Wun2002; Vakoc et al. Reference Vakoc, Lanning, Tyrrell, Padera, Bartlett, Stylianopoulos, Munn, Tearney, Fukumura and Jain2009; Han Reference Han2012). A high degree of tortuosity is associated with cerebral, retinal and renal microvessels, even under normal conditions (Wagner, Czymmek & Hossler Reference Wagner, Czymmek and Hossler2006; Cheung et al. Reference Cheung, Zheng, Hsu, Lee, Lau, Mitchell, Wang, Klein and Wong2011; Blinder et al. Reference Blinder, Tsai, Kaufhold, Knutsen, Suhl and Kleinfeld2013). Examples of non-physiological applications are found in the field of biomicrofluidics, where serpentine, spiral and single-curve microchannels have been used for hydrodynamic focusing and sorting of cells and particles (Di Carlo et al. Reference Di Carlo, Irimia, Tompkin and Toner2007; Bhagat, Kuntaegowdanahalli & Papautsky Reference Bhagat, Kuntaegowdanahalli and Papautsky2008; Karimi, Yazdi & Ardekani Reference Karimi, Yazdi and Ardekani2013; Martel & Toner Reference Martel and Toner2014; Warkiani et al. Reference Warkiani, Khoo, Wu, Tay, Bhagat, Han and Lim2016; Gossett & Di Carlo Reference Gossett and Di Carlo2019). While the flow in small blood vessels has negligible inertia, the microfluidic applications may utilise inertial effects. A common feature in both applications is the migration of cells and particles across the flow streamlines. For a deformable particle, such cross-streamline migration can occur irrespective of inertia, while for a rigid particle, it is generally observed in the presence of inertia (Magnaudet Reference Magnaudet2003).
1.1. Cross-stream migration of deformable particle in a straight vessel without inertia
The cross-stream migration can occur in the absence of vessel curvature, and has been studied extensively in straight vessels, such as straight tubes and microchannels. Therefore, before embarking on the topic of migration in curved vessels, a discussion on migration in straight vessels is warranted. In what follows, migration of deformable particles in the absence of inertia is first discussed, followed by rigid and deformable particles in the presence of inertia. In the absence of inertia, the cross-stream migration of a deformable particle occurs due to nonlinearity introduced by asymmetric shape deformation that may be caused either by the presence of a wall, by shear gradient, or both. In this limit, a liquid drop in a linear shear flow bounded by a single wall migrates away from the wall, whereas in a wall-bounded parabolic flow it settles at the vessel centreline or at a location between the centreline and the vessel wall depending on the viscosity of the fluids inside the drop and in the surrounding (Chan & Leal Reference Chan and Leal1979, Reference Chan and Leal1981; Shapira & Haber Reference Shapira and Haber1990; Smart & Leighton Reference Smart and Leighton1991; Uijttewaal & Nijhof Reference Uijttewaal and Nijhof1995; Li & Pozrikidis Reference Li and Pozrikidis2000; Magnaudet, Takagi & Legendre Reference Magnaudet, Takagi and Legendre2003; Griggs, Zinchenko & Davis Reference Griggs, Zinchenko and Davis2007). Apart from liquid drops, cross-stream migration has been studied for red blood cells, which are known for their high deformability under healthy conditions (Goldsmith Reference Goldsmith1971; Grandchamp et al. Reference Grandchamp, Coupier, Srivastav, Minetti and Podgorski2013; Katanov, Gompper & Fedosov Reference Katanov, Gompper and Fedosov2015; Losserand, Coupier & Podgorski Reference Losserand, Coupier and Podgorski2019). Other biomimetic deformable microparticles such as capsules (liquid drops enclosed by elastic membranes) and vesicles (drops with lipid bilayer membranes) are also studied as they exhibit cross-stream migration (Helmy & Barthes-Biesel Reference Helmy and Barthes-Biesel1982; Coupier et al. Reference Coupier, Kaoui, Podgorski and Misbah2008; Doddi & Bagchi Reference Doddi and Bagchi2008; Kaoui et al. Reference Kaoui, Ristow, Cantat, Misbah and Zimmermann2008; Danker, Vlahovska & Misbah Reference Danker, Vlahovska and Misbah2009; Zhao, Spann & Shaqfeh Reference Zhao, Spann and Shaqfeh2011; Kumar & Graham Reference Kumar and Graham2012; Misbah Reference Misbah2012; Farutin & Misbah Reference Farutin and Misbah2013; Aouane et al. Reference Aouane, Thiébaud, Benyoussef, Wagner and Misbah2014; Nix et al. Reference Nix, Imai, Matsunaga, Yamaguchi and Ishikawa2014; Sing, Li & Sarkar Reference Sing, Li and Sarkar2014; Nix, Imai & Ishikawa Reference Nix, Imai and Ishikawa2016). These studies generally show that in the absence of inertia, red blood cells, capsules and vesicles migrate away from the wall, and toward regions of low shear, which in straight vessels occurs at the vessel centreline. One exception is reported for vesicles that were shown to migrate off-centre under contrasting viscosity of the vesicle fluid and suspending medium (Nait-Ouhra et al. Reference Nait-Ouhra, Guckenberger, Farutin, Ez-Zahraouy, Benyoussef, Gekle and Misbah2018). In the microcirculation, the cross-stream migration results in a higher concentration of red blood cells near the centre of the vessel and a cell-depleted region near the wall. It also results in margination of more rigid cells, e.g. inactivated platelets and white blood cells, towards the vessel wall (Eckstein, Bilsker & Tilles Reference Eckstein, Bilsker and Tilles1987; Fedosov et al. Reference Fedosov, Caswell, Popel and Karniadakis2010; Crowl & Fogelson Reference Crowl and Fogelson2011; Fedosov, Fornleitner & Gompper Reference Fedosov, Fornleitner and Gompper2012; Zhao, Shaqfeh & Narsimhan Reference Zhao, Shaqfeh and Narsimhan2012; Henríquez Rivera, Zhang & Graham Reference Henríquez Rivera, Zhang and Graham2016; Mehrabadi, Ku & Aidun Reference Mehrabadi, Ku and Aidun2016; Qi & Shaqfeh Reference Qi and Shaqfeh2017). Such non-uniform distributions have physiological consequences in terms of blood flow resistance, maintenance of homeostasis and immune response, while they are utilised in biomicrofluidic devices for non-inertial cell sorting (Geislinger et al. Reference Geislinger, Eggart, Braunmüller, Schmid and Franke2012).
1.2. Migration of rigid particles in straight vessels in the presence of inertia
When inertia is present, rigid particles can undergo cross-stream migration in straight vessels, and the phenomenon has been studied extensively since its discovery by Segre & Silberberg (Reference Segre and Silberberg1961) in pipe flow. These authors observed that rigid particles settle at a radial location away from the pipe centre. Subsequently, many theoretical and experimental investigations have been carried out on this subject. An extensive review of these studies is not the objective here, and one can refer to, for example, Asmolov (Reference Asmolov1999), Matas, Morris & Guazzelli (Reference Matas, Morris and Guazzelli2004), Schonberg & Hinch (Reference Schonberg and Hinch1989) and Yang et al. (Reference Yang, Wang, Joseph, Hu, Pan and Glowinski2005) for additional literature. These studies have revealed two competing mechanisms underlying the inertial migration of rigid particles, namely, a hydrodynamic lift arising from particle–wall interaction that propels them away from the wall, and a shear gradient-induced lift that drives them away from the vessel centre (Karimi et al. Reference Karimi, Yazdi and Ardekani2013). Particles can accumulate at an intermediate location between the vessel centreline and the wall depending on the strengths of these mechanisms. The term ‘inertial focusing’ is used to describe the preferential accumulation of particles, particularly in microfluidics where it is utilised for inertia-based particle separation (Di Carlo et al. Reference Di Carlo, Irimia, Tompkin and Toner2007; Hur et al. Reference Hur, Henderson-maclennan, Mccabe and Di Carlo2011; Martel & Toner Reference Martel and Toner2014).
1.3. Migration of deformable particles in straight vessels in the presence of inertia
Inertial cross-stream migration is, however, not limited to rigid particles only, and can also occur for deformable particles and cells. Extensive studies also exist in this field on the inertial migration of drops (for example, Mortazavi & Tryggvason Reference Mortazavi and Tryggvason2000; Magnaudet et al. Reference Magnaudet, Takagi and Legendre2003). A discussion of these studies is avoided here for brevity. When both deformability and inertia are present, all underlying mechanisms as noted previously, namely, the wall effect, shear-gradient effect, inertia and deformation, are in place, and the equilibrium position is determined by the relative strengths of these mechanisms. This is evident from recent numerical studies where migration of capsules and deformable particles in straight vessels was considered in the presence of inertia. Migration toward the vessel centreline was noted in Alghalibi, Rosti & Brandt (Reference Alghalibi, Rosti and Brandt2019) and Hur et al. (Reference Hur, Henderson-maclennan, Mccabe and Di Carlo2011), while off-centre equilibrium was reported in Kilimnik, Mao & Alexeev (Reference Kilimnik, Mao and Alexeev2011), Krüger, Kaoui & Harting (Reference Krüger, Kaoui and Harting2014) and Shin & Sung (Reference Shin and Sung2011).
1.4. Migration of deformable particles in curved vessels without inertia
In contrast to a large number of studies on deformable particle migration in straight vessels as noted previously, there have been fewer investigations on migration in curved vessels. As discussed previously for straight vessels, the existing literature on migration in curved vessels will be discussed under two separate categories; first, the studies that neglect inertia will be discussed, followed by those where inertia is considered. Flows in curved vessels fall under the broader field of flows with streamline curvature, which also includes two-dimensional rotating Couette flows. Therefore, migration in such two-dimensional flows will be discussed. One of the early studies in the first category is by Shafer, Laiken & Zimm (Reference Shafer, Laiken and Zimm1974) who considered migration of DNA molecules in rotating Couette flows bounded between two concentric cylinders. They theoretically predicted that DNA molecules migrate toward the inner cylinder due to the curvature effect. This result was further confirmed by several later studies, e.g. Aubert & Tirrell (Reference Aubert and Tirrell1980) and Goh, Phan Thien & Atkinson (Reference Goh, Phan Thien and Atkinson1984). Chan & Leal (Reference Chan and Leal1979) applied their theoretical formulation to an example of liquid drops in rotating Couette flows, and predicted that the curvature effect caused migration toward the inner cylinder. This, in conjunction with the wall effect, would cause a drop to settle at an equilibrium radial position that is in between the centreline and the inner wall. Ghigliotti et al. (Reference Ghigliotti, Rahimian, Biros and Misbah2011) considered numerical modelling of vesicle migration in two-dimensional rotating flows, and predicted that vesicles migrate inward, that is, toward the region of high streamline curvature (which is also the region high shear) in the case of an unbounded flow. This prediction is interesting because of its stark contrast to what happens in straight vessels, where deformable particles would generally migrate toward the region of low shear in absence of inertia, as noted previously. The authors further predicted that in rotating flows bounded by two walls, vesicles settle at an intermediate radial location. In comparison with these studies using two-dimensional flows, there is no study on deformable particle motion in curved three-dimensional vessels in the absence of inertia.
A somewhat related study is the numerical simulations performed by Balogh & Bagchi (Reference Balogh and Bagchi2019) on the flow of red blood cell suspensions in arbitrarily curved vessels in large microvascular networks resembling physiological geometry. They observed that cells move closer to the inner wall (that is, the side with higher curvature) of a vessel. This leads to an asymmetry in the near-wall cell-depleted region over the cross-section of the vessel. The thickness of this region is reduced along the inner wall but increased along the outer wall. They further observed that in addition to the curvature, the rate of change in curvature also affects the asymmetry of the cell-depleted region. This suggests that deformable particle migration is affected not only by the vessel curvature, but also by the change in curvature.
1.5. Migration of particles in curved vessels with inertia
When inertia is present, the flow in a curved vessel is affected by the centrifugal force. In addition to the primary flow, the fluid in the central region of the vessel is driven from the inner to the outer side (that is, from higher to lower curvature). This causes the so-called secondary Dean flow which is characterised by two counter-rotating vortices in the cross-sectional plane of the vessel (Dean Reference Dean1928; Siggers & Waters Reference Siggers and Waters2005). Migration of rigid particles in such flows is dictated, in part, by the balance between the inertial lift and the drag from Dean flow (Di Carlo et al. Reference Di Carlo, Irimia, Tompkin and Toner2007; Bhagat et al. Reference Bhagat, Kuntaegowdanahalli and Papautsky2008; Karimi et al. Reference Karimi, Yazdi and Ardekani2013; Martel & Toner Reference Martel and Toner2014; Warkiani et al. Reference Warkiani, Khoo, Wu, Tay, Bhagat, Han and Lim2016; Gossett & Di Carlo Reference Gossett and Di Carlo2019). If the two forces are of the same order, multiple and distinct equilibrium positions exist. In contrast, if the secondary flow is dominant, particles can be entrained within the vortices. Such secondary flow effects serve as the working principles for particle/cell focusing and sorting in microfluidic devices with curved geometry, such as serpentine channels, spiral channels and U-shaped channels. However, the particles used in many of these studies are either rigid particles or cells showing negligible deformation (e.g. Di Carlo et al. Reference Di Carlo, Irimia, Tompkin and Toner2007). Therefore, it is unknown how the migration behaviour would change when a significant deformation is present. On the numerical front, Ye et al. (Reference Ye, Phan-Thien, Lim and Li2017) simulated the flow of deformable red blood cells in different curved vessels (arch, serpentine, spiral and U-bend) with diameters comparable with the cell diameter. They studied the effect of vessel geometry on the evolution of the cell shape. Ye et al. (Reference Ye, Phan-Thien, Khoo and Li2018) considered flow of single and multiple red blood cells in U-bends and studied the effect of cells on the modification of the secondary flow itself.
From the previous discussions, it can be concluded that for the most inclusive scenario, that is, deformable particles in curved vessels at finite inertia, the following mechanisms for cross-stream migration would exist: (i) particle deformation effect causing a migration likely towards the low-shear region, (ii) wall effects, (iii) inertial lift, which can cause migration away from vessel centre, (iv) curved streamlines effect, which causes migration towards regions of higher streamline curvature and (v) Dean's drag causing particle motion along the secondary flow. Particle trajectory and equilibrium position would depend on the relative strengths of these mechanisms.
Despite the aforementioned studies on the flow of deformable particles in curved vessels, many issues on this topic are still unresolved; for example, how the migration is affected as inertia is varied from negligible to a finite range as the secondary flow gradually emerges. In the limit of negligible inertia, Dean's classic work as well as a number of previous works showed that the velocity profile of the primary flow is skewed toward the inner side of a vessel (Dean Reference Dean1928; Chadwick Reference Chadwick1985; Wang & Bassingthwaighte Reference Wang and Bassingthwaighte2003; Siggers & Waters Reference Siggers and Waters2005; Verkaik et al. Reference Verkaik, Beulen, Bogaerds, Rutten and van de Vosse2009). Accordingly, the low-shear region is located between the centreline and the inner wall. Then, a deformable particle at small inertia is expected to migrate toward this off-centre location. Is this the equilibrium location for a deformable particle in absence of inertia? How does particle deformability affect the settling location in this limit? Is there an additional mechanism in place that arises from the curvature effect? Then, as inertia is gradually increased, the inertial lift, deformation-induced lift, and the drag from Dean flow are all present, and expected to affect particle migration. How does the settling location vary under the combined effects of vessel curvature, inertia and deformation? Further, do these equilibrium locations remain stable in the presence of Dean flow, or the particles start spiralling along the secondary flow, or migrate toward the centres of the vortices? There exists no study that systematically addresses such changes in equilibria as inertia is gradually increased. Furthermore, as predicted by Balogh & Bagchi (Reference Balogh and Bagchi2019) and discussed previously, particle migration seems to be affected not only by the vessel curvature, but also by the change in curvature. There exists no study that considers the effect of curvature change on migration.
Toward that end, in this paper we consider a numerical study of flow of deformable capsules in three-dimensional curved vessels and address the capsule migration under the combined effects of vessel curvature, capsule deformation, and inertia. Two geometries are chosen to consider the effects of curvature and the change in curvature: torus vessels for which the curvature is constant along the vessel length; and U-shaped vessels for which the curvature abruptly changes at one location. While the flow in a closed torus cannot be achieved experimentally, this has been considered in previous works as the limiting case of a tightly wound helix such that adjacent coils are close to each other (Chadwick Reference Chadwick1985). This situation is encountered in the microcirculation when blood vessels buckle. Then, flow in a single coil can be approximated as flow in a torus. The torus is also the limiting case of a tightly would spiral vessel, which is commonly used in inertial microfluidics (Bhagat et al. Reference Bhagat, Kuntaegowdanahalli and Papautsky2008). In the present work, we consider vessels to be circular in cross-section. The curvature ratio, defined as the ratio of the vessel radius to the radius of curvature of the vessel centreline, is varied from about 0.2 to 0.95, implying highly curved vessels. A wide range of inertia varying over three orders is considered: from negligible inertia to the case of significant secondary flows, so as to include a broad range of applications, from the microcirculation to inertial microfluidics. Particle deformability is also varied over nearly two orders.
Organisation of the paper is as follows. Section 2 describes the numerical method, followed by results in § 3. Capsule motion in torus vessels at small inertia is considered in § 3.1, followed by finite inertia in § 3.2. Then, in § 3.3, capsule motion in U-shaped vessels is considered. Conclusions are presented in § 4.
2. Problem set-up and numerical methodology
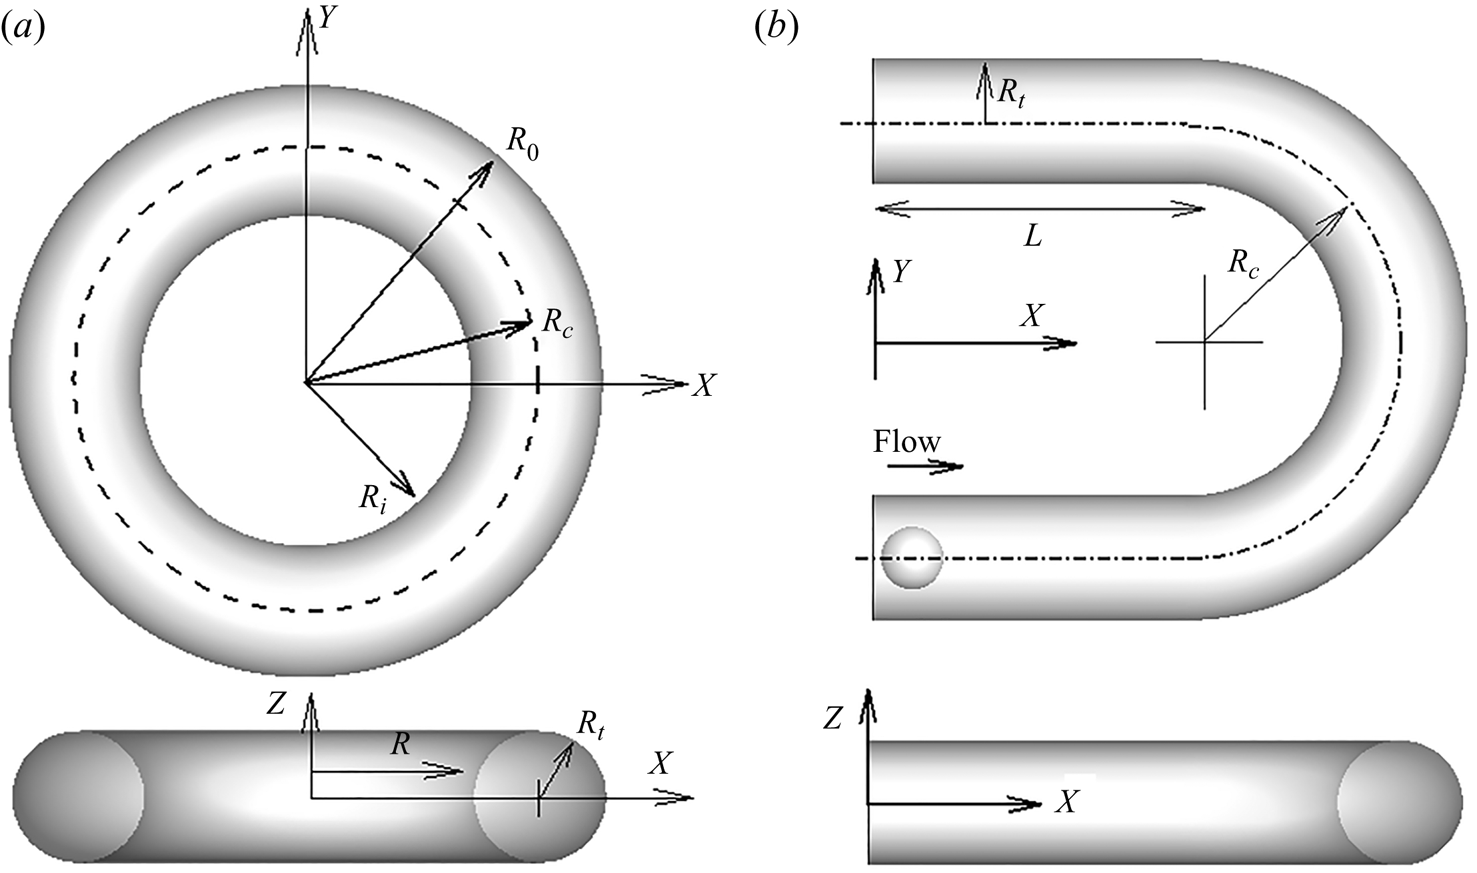
The geometry of the torus and U-shaped vessel is shown in figure 1. For the torus vessel, the torus centre is the origin of the cylindrical coordinate system  $(\tilde{R},\Theta ,\tilde{Z})$, and
 $\tilde{Z} = 0$ is the symmetry (middle) plane. Here
 ${\tilde{R}_t}$ is the vessel radius,
 ${\tilde{R}_C}$ is the radius of curvature of the vessel centreline, and
 ${\tilde{R}_i}$ and
 ${\tilde{R}_o}$ are the radii of the inner and outer most sides of the vessel (measured on the
 $\tilde{Z} = 0$ plane), respectively. Then, the torus can be expressed as
 \begin{equation}{\tilde{Z}^2} = \tilde{R}_t^2 - {({\tilde{R}_C} - \sqrt {{{\tilde{X}}^2} + {{\tilde{Y}}^2}} )^2}.\end{equation}
The U-shaped vessel is made of straight entry and exit segments and half of a torus.  $\tilde{L}$ is the length of the straight segments. For
 $\tilde{X} \gt \tilde{L}$, the curved segment of the U-tube is given by half the torus. For the torus vessel, curvature is constant along the vessel length. For the U-tube, curvature is zero for
 $\tilde{X} \lt \tilde{L}$, but finite for
 $\tilde{X} \gt \tilde{L}$, and it changes abruptly at
 $\tilde{X} = \tilde{L}$.
Geometric parameters and coordinates for (a) a torus vessel and (b) a U-shaped vessel. Notation used represent dimensionless variables. Here  $(R,\Theta ,Z)$ are the cylindrical polar coordinates with respect to the torus centre, the X–Y plane is the symmetry
 $(Z = 0)$ plane,
 ${R_c}$ is the radius of curvature of the vessel centreline,
 ${R_t}$ is the vessel radius,
 ${R_i}$ and
 ${R_0}$ are the inner and outer radius on the symmetry plane and L is the length of the straight part of the U-tube. All lengths shown are scaled by the capsule radius.

The fluid is assumed to be incompressible and Newtonian, and follows the continuity and the Navier–Stokes equations
 \begin{gather}\boldsymbol{\nabla} \boldsymbol{\cdot}\tilde{\boldsymbol{u}} = 0,\end{gather}
 \begin{gather}\rho \frac{{\textrm{D}\tilde{\boldsymbol{u}}}}{{\textrm{D}t}} = - \boldsymbol{\nabla}p + \mu {\nabla ^2}\tilde{\boldsymbol{u}},\end{gather}
where  $\tilde{\boldsymbol{u}}$ is the fluid velocity. The fluid in the torus is driven by a steady axial pressure gradient
 $(1/{\tilde{R}_C})(\textrm{d}P/\textrm{d}\Theta ) = - 4\mu {\tilde{U}_0}/\tilde{R}_t^2$ where
 ${\tilde{U}_0}$ is the centreline (maximum) velocity (Poiseuille's flow) that would occur in a straight tube having the same radius
 ${\tilde{R}_t}$, and length equal to the arc length of the torus measured along its centreline. For the U-tube, a pressure difference
 ${\Delta }P$ is applied between the inlet and outlet in the same spirit such that
 ${\Delta }P = - 4\mu \tilde{S}{\tilde{U}_0}/\tilde{R}_t^2$ where
 $\tilde{S}$ is the total arc length along the tube centreline. The fluid must also satisfy the no-slip boundary condition along the surface of the vessel. One option to solve the discretised form of the governing equation and satisfy the no-slip boundary condition is to use a surface-conforming curvilinear mesh. An alternative and more versatile approach is to use a non-surface-conforming mesh, such as a rectangular mesh, and a suitable computational domain within which the vessel is ‘immersed’. A constraint is then applied such that the no-slip condition is satisfied along the vessel wall. This is the basic premise of the sharp-interface immersed-boundary method that is implemented in the current study. Specifically, the ghost-node immersed-boundary method is utilised as detailed in Balogh & Bagchi (Reference Balogh and Bagchi2017).
The computational domain considered here is a cuboid encompassing the vessel of interest. The Eulerian mesh used to discretise the domain is a uniform rectangular mesh. A staggered arrangement of the flow variables in the Eulerian domain is used by defining the velocity components at the faces of a computational cell, and the pressure at the cell centre. A mesh discretising the rigid surface is also often needed if the surface geometry is complex. This surface mesh defines the region of interest, which is the fluid region inside a vessel, and distinguishes it from the outside region. When the surface can be expressed analytically, as in the present geometry, the use of the surface mesh not needed. The Eulerian nodes outside the vessel that have at least one neighbouring interior node are marked as ghost nodes (GNs). For each GN, its nearest point on the surface is defined as a boundary intercept (BI), and the mirror image of GN across the BI and within the vessel is obtained as the image point (IP). The no-slip condition on the vessel surface is satisfied by its application at the BI points. This is done by specifying a velocity at the GN that is equal and opposite to that of the IP,  ${\tilde{\boldsymbol{u}}_{GN}} = - {\tilde{\boldsymbol{u}}_{IP}}$. In general, the IP need not coincide with the Eulerian nodes, and
 ${\tilde{\boldsymbol{u}}_{IP}}$ is obtained by interpolating from surrounding nodes.
A projection-based method is used to obtain the velocity and pressure fields. This method consists of first solving an equation consisting of the advection and diffusion terms of the Navier–Stokes equations, and then solving a Poisson-type equation to enforce the divergence-free condition. The semi-implicit Crank–Nicolson scheme is used for time discretisation of the viscous terms, and Adams–Bashforth scheme for the nonlinear terms in the Navier–Stokes equations. All spatial derivatives are treated using second-order differencing. To take advantage associated with tri-diagonal matrix inversion, the advection–diffusion equation is solved using an alternating direction implicit (ADI) scheme. The no-slip boundary condition is implemented at this step. To attain a fast computation of the Poisson equation, the computational domain is made periodic in  $\tilde{Z}$ direction and the Fourier transform is used. Then, the Poisson equation is converted into a two-dimensional problem in Fourier space, and can be solved using a fast, direct matrix inversion.
A single capsule of undeformed spherical shape flowing in the vessels is considered. Capsules are modelled as liquid drops surrounded by two-dimensional (zero-thickness) hyperelastic membranes. The fluid inside the capsule is assumed to have the same viscosity and density as that of the outside fluid. The capsule membrane exerts a resistance against shearing deformation, area dilation and bending. The shearing deformation and area dilation are modelled using the strain energy function developed by Skalak et al. (Reference Skalak, Tozeren, Zarda and Chien1973),
 \begin{equation}{W_S} = \frac{{{G_S}}}{4}[(I_1^2 + 2{I_1} - 2{I_2}) + CI_2^2],\end{equation}
where  ${G_S}$ is the membrane shear elastic modulus, C is a dimensionless parameter that controls area dilation,
 ${I_1} = \varepsilon _1^2 + \varepsilon _2^2 - 2$ and
 ${I_2} = \varepsilon _1^2\varepsilon _2^2 - 1$ are the strain invariants of the Green strain tensor, and
 ${\varepsilon _1}$ and
 ${\varepsilon _2}$ are the principal stretch ratios. The principal elastic tensions in the membrane are obtained as
 \begin{equation}{\tau _1} = \frac{1}{{{\varepsilon _2}}}\frac{{\partial {W_S}}}{{\partial {\varepsilon _1}}}\quad \textrm{and}\quad {\tau _2} = \frac{1}{{{\varepsilon _1}}}\frac{{\partial {W_S}}}{{\partial {\varepsilon _2}}}.\end{equation}
The capsule surface is discretised using triangular elements (see supplementary figure 1 available at https://doi.org/10.1017/10.1017/jfm.2020.831). In general, each surface node is surrounded by five or six elements. A finite-element method is used to compute  ${\tau _1}$ and
 ${\tau _2}$ in each element. Here we assumed that the elements remain flat upon deformation, and the displacement field
 $\hat{\boldsymbol{x}}$ varies linearly inside each element so that
 $\hat{\boldsymbol{x}} = \sum {N_i}{\hat{\boldsymbol{x}}_i}$, where
 $i = 1,2,3$ denote three vertices of an element,
 ${\hat{\boldsymbol{x}}_i}$ is displacement if each vertex and
 ${N_i}$ is the linear shape function for the vertex i that can be expressed as used in finite elements as
 ${N_i} = {a_i}\check{x} + {b_i}\check{y} + {c_i}$ with
 $\check{x} ,\check{y} $ being a local coordinate attached to and in the plane of each element (see Doddi & Bagchi Reference Doddi and Bagchi2008 for more details). This enables the calculation of the deformation gradient of the current membrane configuration
 $\hat{\boldsymbol{x}}$ relative to the undeformed configuration
 $\hat{\boldsymbol{X}}$, defined as
 $\boldsymbol{F} = \partial \hat{\boldsymbol{x}}/\partial \hat{\boldsymbol{X}}$. Now,
 ${\varepsilon _1}$ and
 ${\varepsilon _2}$ can be obtained because their squares are the eigenvalues of the left Cauchy–Green deformation tensor
 $\boldsymbol{F}\boldsymbol{\cdot}{\boldsymbol{F}^\textrm{T}}$. Then, using the principle of virtual work, the in-plane force at the vertex i of an element in the local (element-attached) coordinate is expressed as
 \begin{equation}\boldsymbol{f}_i^\Delta = \frac{{\partial {W_S}}}{{\partial {{\hat{\boldsymbol{x}}}_i}}} = \left( {\frac{{\partial {W_S}}}{{\partial {\varepsilon_1}}}} \right)\left( {\frac{{\partial {\varepsilon_1}}}{{\partial {{\hat{\boldsymbol{x}}}_i}}}} \right) + \left( {\frac{{\partial {W_S}}}{{\partial {\varepsilon_2}}}} \right)\left( {\frac{{\partial {\varepsilon_2}}}{{\partial {{\hat{\boldsymbol{x}}}_i}}}} \right).\end{equation}
This local force is then transferred to the global coordinate using the transformation matrix  $\boldsymbol{R} = {\boldsymbol{e}^0}{\boldsymbol{e}^d}$ as
 $\boldsymbol{f} = {\boldsymbol{R}^\textrm{T}}\boldsymbol{f}_i^\Delta $ where
 ${e^d}$ and
 ${e^0}$ are unit vectors attached to the deformed element and the global coordinate. The resultant elastic force
 ${\boldsymbol{f}_e}$ at any vertex is obtained by vector resultant of the forces contributed by all the surrounding elements that share that vertex. Alternatively, the resultant elastic force at a vertex can be expressed as
 \begin{equation}{\boldsymbol{f}_e} = \sum {\int_{{A_e}} {\frac{{\partial \boldsymbol{N}}}{{\partial \hat{\boldsymbol{X}}}}\boldsymbol{\cdot}\boldsymbol{P}\,\textrm{d}{A_e}} } ,\end{equation}
where  $\boldsymbol{N}$ represents the vector of linear shape functions,
 $\boldsymbol{P} = {\varepsilon _1}{\varepsilon _2}\boldsymbol{\tau }\boldsymbol{\cdot}{\boldsymbol{F}^{ - \textrm{T}}}$ is the first Piola–Kirchhoff stress tensor,
 $\boldsymbol{\tau } = {\tau _1}{\boldsymbol{e}_1} \otimes {\boldsymbol{e}_1} + {\tau _2}{\boldsymbol{e}_2} \otimes {\boldsymbol{e}_2}$ is principle stress,
 ${\boldsymbol{e}_1}$ and
 ${\boldsymbol{e}_2}$ are the unit eigenvectors of the left Cauchy–Green deformation tensor,
 ${A_e}$ is area of each triangular element surrounding that vertex, and the summation is over all the surrounding five or six elements of that vertex (see Yazdani & Bagchi Reference Yazdani and Bagchi2013).
The membrane bending resistance is modelled by a force density that can be obtained from Zong-can & Helfrich (Reference Zong-Can and Helfrich1989) as
 \begin{equation}{\boldsymbol{f}_b} = {E_b}[(2{k_m} + {c_0})(2k_m^2 - 2{k_g} - {c_0}{k_m}) + 2{{\Delta }_{LB}}{k_m}]\boldsymbol{n},\end{equation}
where  ${E_b}$ is the bending modulus,
 ${k_m}$,
 ${k_g}$ and
 ${c_0}$ respectively are the mean, Gaussian and spontaneous curvatures of the membrane,
 ${\Delta _{LB}}$ is the Laplace–Beltrami operator and
 $\boldsymbol{n}$ is the unit normal vector. Then, the net membrane force
 ${\boldsymbol{f}_m}$ is the vector sum of the elastic and bending forces,
 ${\boldsymbol{f}_m} = {\boldsymbol{f}_e} + {\boldsymbol{f}_b}$.
The coupling between the deforming capsule and the fluid motion is done by the continuous-forcing immersed-boundary method. In this approach, the membrane force is added to the right-hand side of the fluid momentum equations (2.3) as a body force term using the three-dimensional Dirac delta function  $\boldsymbol{\delta }$ as
 \begin{equation}\boldsymbol{F}_{m} = \int_A {\boldsymbol{f}_m}\boldsymbol{\delta}(\mathop{\boldsymbol{X}}\limits^{\prime} - \tilde{\boldsymbol{X}})\,\textrm{d}A,\end{equation}
where  $\tilde{\boldsymbol{X}}$ and
 $\mathop{\boldsymbol{X}}\limits^{\prime} $ represent, respectively, the coordinates of a point in the fluid and on the capsule surface, and A is the surface area of the capsule. Thus, the force exists at the instantaneous membrane location, and it is zero elsewhere. A cosine function spanning over two Eulerian points on each side of the capsule membrane is used as a numerical approximation of the delta function,
 \begin{align}\left. {\begin{aligned} {\tilde{\boldsymbol{\delta }}(\mathop{\boldsymbol{X}}\limits^{\prime} - \tilde{\boldsymbol{X}}) = \dfrac{1}{{64\Delta_E^3}}\prod_i^3 \left( {1 + \cos \dfrac{{\rm \pi} }{{2{\Delta_E}}}({{\mathop X\limits^{\prime} }_i} - {{\tilde{X}}_i})} \right)\quad \textrm{for}\,|{{\mathop X\limits^{\prime} }_i} - {{\tilde{X}}_i}|\le 2{\Delta_E},\quad i = 1,2,3}\\ {\tilde{\boldsymbol{\delta }}(\mathop{\boldsymbol{X}}\limits^{\prime} - \tilde{\boldsymbol{X}}) = 0,\quad \textrm{otherwise}} \end{aligned}} \right\},\end{align}
where  ${\Delta _E}$ is the Eulerian mesh size. In discrete form, (2.9) can be written as
 ${F_m}({\tilde{\tilde{\boldsymbol{X}}}_j}) = \sum\nolimits_i {\tilde{\boldsymbol{\delta }}({{\mathop{\boldsymbol{X}}\limits^{\prime} }_i} - {{\tilde{\boldsymbol{X}}}_j}){\boldsymbol{f}_m}({{\mathop{\boldsymbol{X}}\limits^{\prime} }_i})}$, where i and j represents Lagrangian and Eulerian nodes, respectively.
Once the fluid velocity is known at each time step, the velocity  ${\boldsymbol{u}_m}$ of the Lagrangian nodes on the capsule surface is obtained from the fluid velocity at neighbouring Eulerian nodes using the three-dimensional Dirac delta function as
 \begin{equation}{\tilde{\boldsymbol{u}}_m} = \int_V {\tilde{\boldsymbol{u}}\, \boldsymbol{\delta }(\mathop{\boldsymbol{X}}\limits^{\prime} - \boldsymbol{X})\,\textrm{d}V} ,\end{equation}
where the integral is over the fluid volume. Then, the Lagrangian nodes are advected as massless marker points using a second-order Runge–Kutta scheme.
Results will be presented in dimensionless form. The radius of the undeformed capsule is denoted by a, and used to make lengths dimensionless. In dimensionless form, the radial distance is denoted as R, geometric parameters as  ${R_C},\, {R_t,}\,{R_o},\, {R_i},\, L$, and coordinates as
 $X,Y,Z$. Velocities are scaled by
 ${\tilde{U}_0}$ (which was defined before), and time by
 $a/{\tilde{U}_0}$. Major dimensionless parameters are as follows: capillary number
 $Ca = \mu {\tilde{U}_0}/{G_S}$ represents the ratio of the viscous force to the membrane elastic force; the capsule Reynolds number
 $R{e_c} = \rho a{\tilde{U}_0}/\mu $; the tube Reynolds number defined as
 $R{e_t} = \rho {\tilde{R}_t}{\tilde{U}_0}/\mu = {R_t}R{e_c}$; the curvature ratio
 $\kappa = {R_t}/{R_c}$; and the Dean number
 $De = R{e_t}\sqrt \kappa $. For the U-shaped vessels,
 $\kappa $ is the curvature ratio for the curved segment of the vessels. The range of
 $Ca$ is varied from 0.1 to 10, and
 $R{e_t}$ from 0.02 to 40. The vessel parameters are varied as
 ${R_c} = 3$ to 9,
 ${R_t} = 1.5$ to 8; this gives
 $\kappa $ in the range of ~0.2 to 0.95 representing highly curved vessels. Depending on specific choice of vessel parameters, the Dean number ranges from about 0.02 to 36. Note that the highest
 $De$ considered is significantly below the critical Dean number above which multiple steady solutions were shown to exist (Siggers & Waters Reference Siggers and Waters2005). The dimensionless bending modulus
 $E_b^\ast = {E_b}/{a^2}{G_s}$ is kept constant at 0.01. This value is close to that for an erythrocyte membrane for which
 ${E_b}\sim {10^{ - 19}}\ \textrm{J}$,
 $a\sim 3\,\mu\ \textrm{m}$, and
 ${G_S}\sim 3\,\textrm{N}\ {\textrm{m}^{ - 2}}$. The parameter C in (2.4), which is the ratio of area dilation to shear moduli, is taken as 10. For an erythrocyte, C takes a very large value because the membrane is nearly incompressible. However, for an initially spherical capsule, taking a large value of C would lead to nearly no deformation, and cause numerical instability. The selected value does not lead to any numerical instability but provides large deformation.
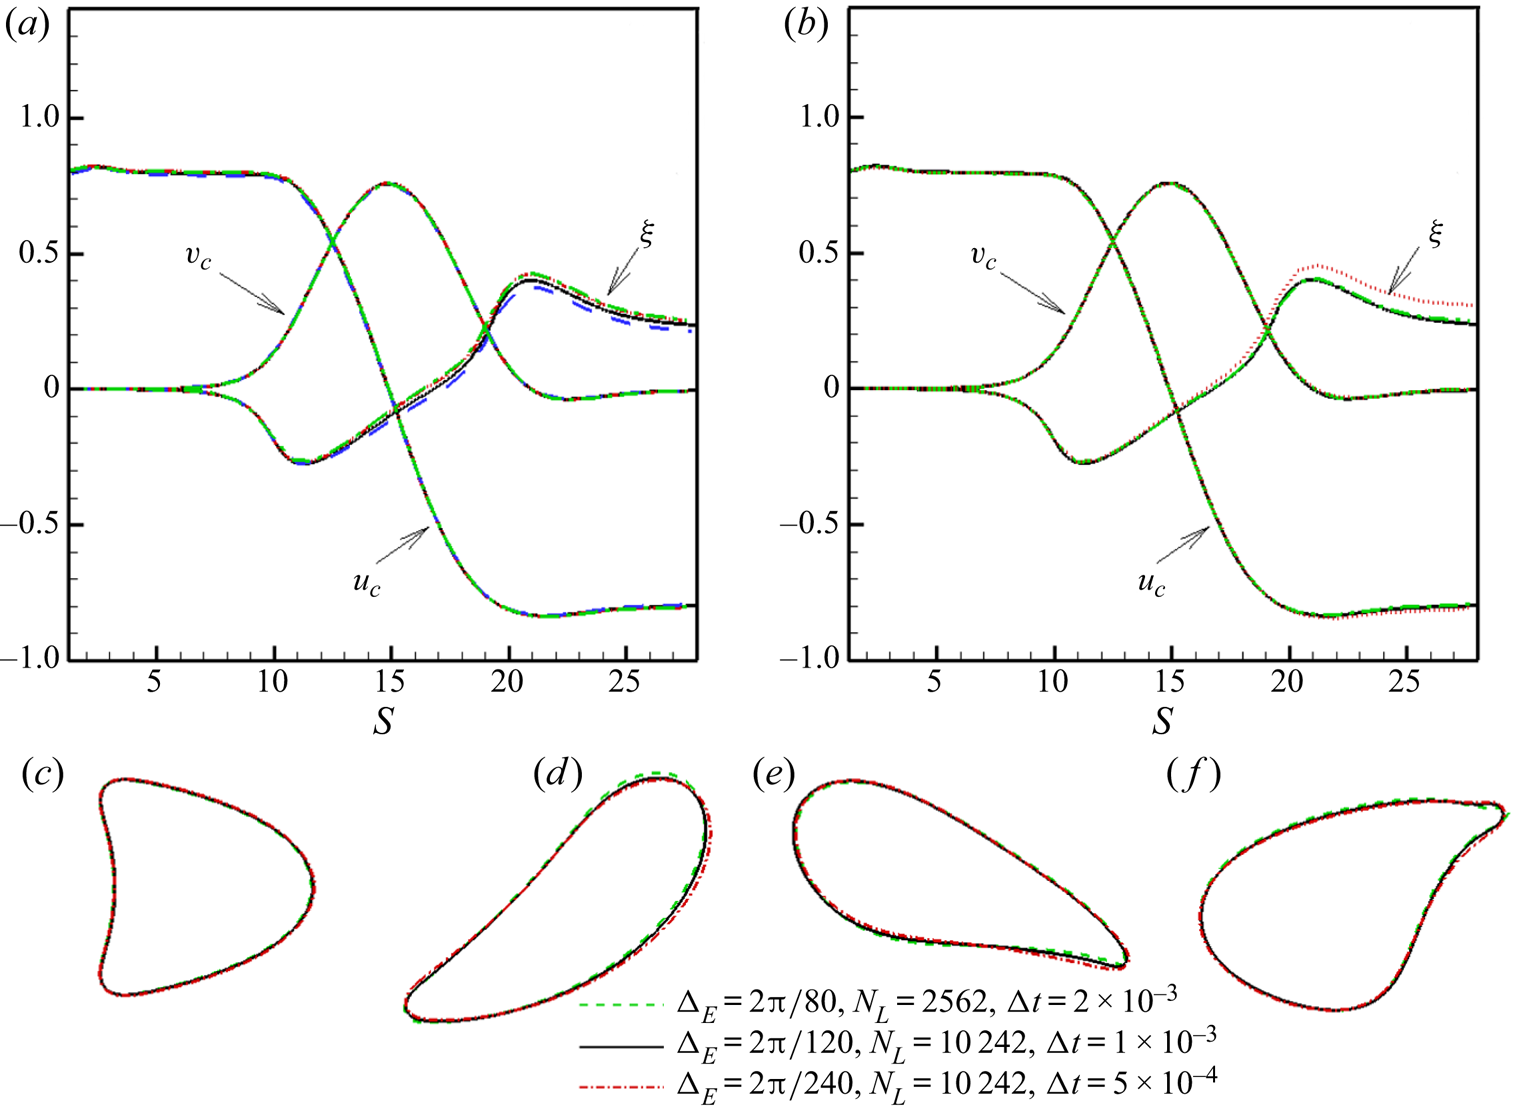
Extensive validation of the methodology has been done in previous studies (Doddi & Bagchi Reference Doddi and Bagchi2008; Balogh & Bagchi Reference Balogh and Bagchi2017). Additional validation for the flow in torus vessels is presented in § 3.1. A numerical grid-independence study is presented in figure 2 for a capsule motion in a U-bend  $(L = 10,\, {R_c} = 3,\, {R_t} = 2)$ at large deformability
 $(Ca = 5)$, high curvature ratio
 $(\kappa = 0.67)$ and finite inertia
 $(R{e_t} = 20,\, De = 16.33)$. The influence of Eulerian resolution is considered in figure 2(a) by varying the Eulerian mesh size as
 $\Delta_{\boldsymbol{E}} = 2{\rm \pi} /80$,
 $2{\rm \pi} /120$,
 $2{\rm \pi} /240$,
 $2{\rm \pi} /320$, while keeping the Lagrangian resolution fixed at 10242 vertices. Figure 2(b) shows the influence of Lagrangian resolution which is varied as
 ${N_L} = 642,\, 2562,\, 10242$, while keeping Eulerian resolution fixed at
 $2{\rm \pi} /120$. Figure 2(c–f) compares capsule shapes using two-dimensional slices for three different cases by varying the Eulerian mesh spacing
 $({\Delta _E})$, the number of Lagrangian points
 $({N_L})$ and time step
 $({\Delta }t)$. For the lowest resolution,
 ${\Delta _E} = 2{\rm \pi} /80$,
 ${N_L} = 2562$,
 ${\Delta }t = 2 \times {10^{ - 3}}$; for the intermediate resolution,
 ${\Delta _E} = 2{\rm \pi} /120$,
 ${N_L} = 10242$,
 ${\Delta }t = 1 \times {10^{ - 3}}$; for the finest resolution,
 ${\Delta _E} = 2{\rm \pi} /240$,
 ${N_L} = 10242$,
 ${\Delta }t = 5 \times {10^{ - 4}}$. As seen in figure 2, the difference between the three cases is small. We thus use the intermediate resolution (
 ${\Delta _E} = 2{\rm \pi} /120$,
 ${N_L} = 10242$) for all simulations. For a torus geometry of
 ${R_c} = 5,\, {R_t} = 4$, the number of Eulerian points used are 350 × 350 × 159 in the x,y,z directions, respectively.
Numerical resolution effect studied for a capsule motion in a U-bend for  ${R_t} = 2$,
 $\kappa = 0.67$,
 $Ca = 5$. (a) Effect of varying Eulerian mesh size
 ${\Delta _E} = 2{\rm \pi} /80$ (green, dash-dotted),
 $2{\rm \pi} /120$ (black, solid),
 $2{\rm \pi} /240$ (red, dash-dotted),
 $2{\rm \pi} /320$ (blue, dashed). (b) Effect of varying Lagrangian resolution
 ${N_L} = 642$ (red, dotted), 2562 (green, dash-dotted), 10 242 (black, solid). The X- and Y-components of capsule centre-of-mass velocity (
 ${u_c}$ and
 ${v_c}$, respectively), and deviation of the centre-of-mass from the centreline of the vessel
 $(\xi )$, plotted over arc length S. (c–f) Superimposed two-dimensional slices of capsule shapes at
 $Z = 0$ symmetry plane taken at four different times obtained using three different resolutions.

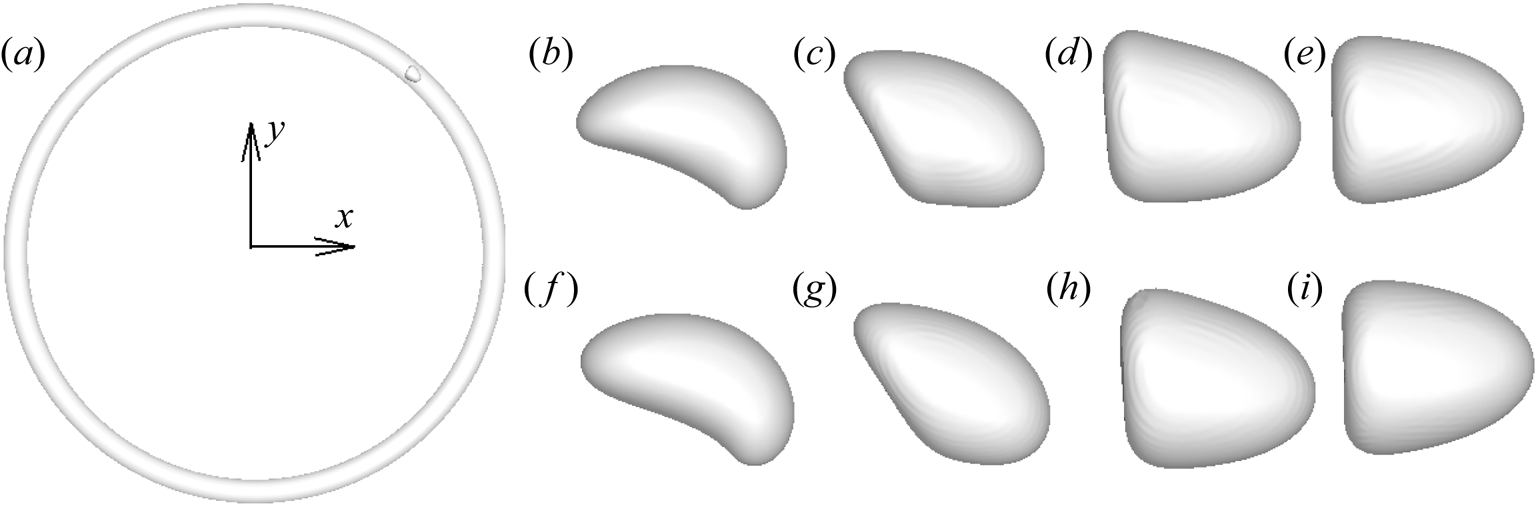
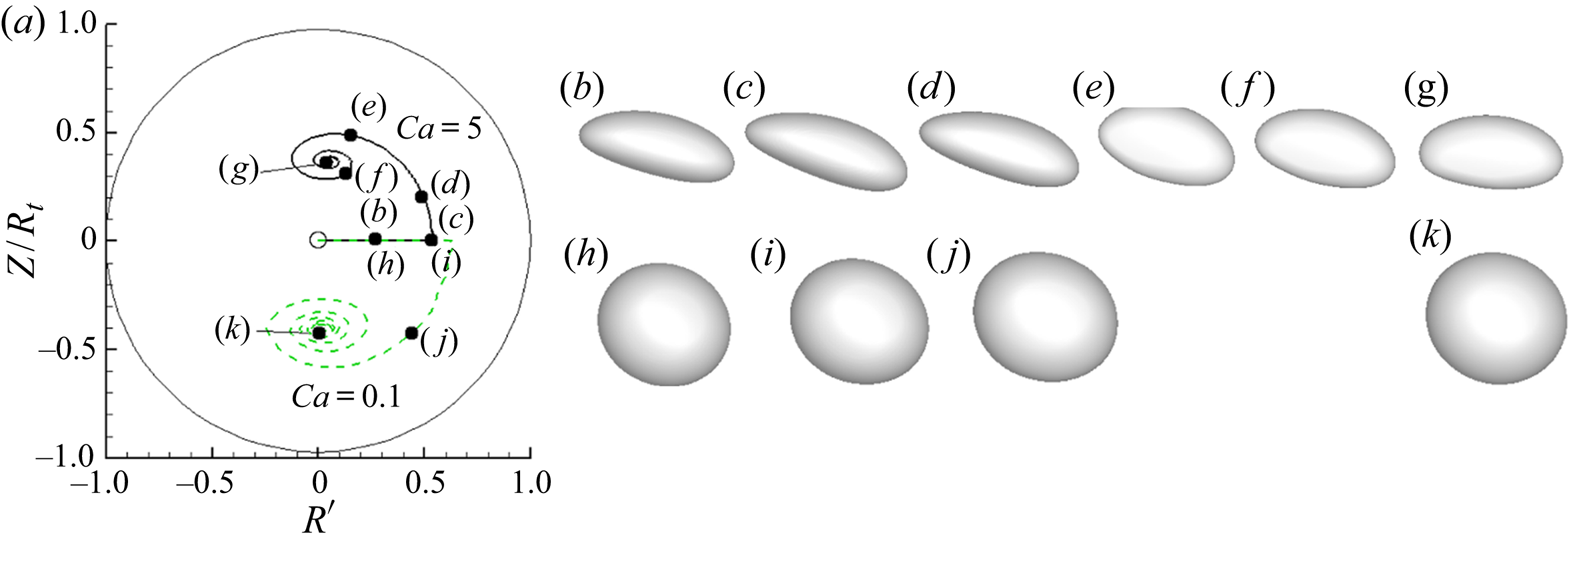
Figure 3 shows the shape evolution of a capsule as  $\kappa \to 0$ for both small (
 $R{e_t} = 0.04$) and finite
 $(R{e_t} = 10)$ inertia. Results are shown for curvature ratio varying as
 $\kappa = 0.9,\, 0.5,\, 0.05,\, 0$. Instantaneous shapes are shown when the capsule centre of mass is located along the vessel centreline. As seen here, for both small as well as finite inertia, capsule shapes show significant asymmetry at large curvature ratio, but at
 $\kappa = 0.05$ they are close to those obtained in straight vessels
 $(\kappa = 0)$. Additional comparisons of capsule shapes in torus vessels and in straight tubes for different geometry and at different radial locations in the vessels are presented in figures 10 and 19.
Shape evolution of capsule as  $\kappa \to 0$: (a) torus of
 $\kappa = 0.05$, where a capsule is also shown; (b–e)
 $R{e_t} = 0.04$; (f–i)
 $R{e_t} = 10$; (b,f)
 $\kappa = 0.9$; (c,g)
 $\kappa = 0.5$; (d,h)
 $\kappa = 0.05$; (e,i)
 $\kappa = 0$. Here
 ${R_t} = 1.5$ is fixed.

3. Results
3.1. Capsule motion in torus vessels at small inertia
First, the motion of a capsule in a torus in the case of small inertia is considered. Since the numerical methodology solves the full Navier–Stokes equations, a small value of capsule Reynolds number  $R{e_c} = 0.01$ is considered. Simulations are performed by varying
 ${R_t}$ and
 ${R_c}$ as noted before; accordingly,
 $R{e_t}$ varies from
 $0.02$ to
 $0.08$, and the Dean number remains
 $De \lt 0.1$. Hence, inertial effects are small for the results presented in this section.
Before considering capsule motion, we present some results on the flow characteristics in a torus in the limit of small inertia and in absence of a capsule (undisturbed flow). For a fully developed, steady, laminar flow driven by a constant axial pressure gradient  $(1/{\tilde{R}_C})(\textrm{d}P/\textrm{d}{\Theta })$ in a curved pipe, the analytical solution is given by the well-known Dean's solution (Dean Reference Dean1928). In the limit of small curvature and Dean number (
 $\kappa \ll 1$ and
 $De \ll 1$), the secondary flow is negligible, and the leading-order solution for the dimensionless axial velocity component
 ${U_A}$ can be expressed as
 \begin{align} {U_A} & = \left( {1 - {{\left( {\dfrac{r}{{{R_t}}}} \right)}^2}} \right) - \dfrac{{3\kappa }}{4}\left( {\dfrac{r}{{{R_t}}}} \right)\left( {1 - {{\left( {\dfrac{r}{{{R_t}}}} \right)}^2}} \right)\cos \theta \nonumber\\ & \quad + \dfrac{{{\kappa ^2}}}{{32}}\left( {1 - {{\left( {\dfrac{r}{{{R_t}}}} \right)}^2}} \right)\left( { - 3 + 11{{\left( {\dfrac{r}{{{R_t}}}} \right)}^2} + 10{{\left( {\dfrac{r}{{{R_t}}}} \right)}^2}\cos 2\theta } \right) + {O}({\kappa ^3}), \end{align}
where  $(r,\theta )$ are the polar coordinates in the cross-sectional plane of the torus with the origin located at the centreline (Siggers & Waters Reference Siggers and Waters2005). The outermost edge of the torus is at
 $\theta = 0$, and the innermost edge at
 $\theta = {\rm \pi}$. The first term on the right-hand side is the Poiseuille flow in a straight tube, and the remaining terms account for the curvature effects. A key feature of the flow in this limit, as evident from above equation, is that the axial velocity profile is not symmetric about the centreline, but skewed toward the inner edge. As pressure is constant over each cross-section, the axial pressure gradient
 $(1/\tilde{R})(\textrm{d}P/\textrm{d}\Theta )$ is larger for fluid that is closer to the inner side causing it to move at a higher speed, resulting in the axial velocity being skewed toward the inner edge. In other words, the location of the maximum velocity happens between the centreline and the inner edge. This result at
 $De \ll 1$ is opposite to that in flows with large
 $De$, in which case the velocity profile is skewed toward the outer edge because of the presence of the secondary flow.
For convenience, we now introduce a dimensionless radial distance from the Z-axis defined as
 \begin{equation}R^{\prime} = (R - {R_c})/{R_t},\end{equation}
such that  $R^{\prime} = - 1,\, 0,\, 1$ represent, respectively, the innermost edge, vessel centreline, and the outermost edge. Following Siggers & Waters (Reference Siggers and Waters2005), the location of the maximum axial velocity, which occurs in the symmetry plane, can be expressed in terms of
 $R^{\prime}$ as
 \begin{equation}{R^{\prime}_U} = - \frac{{3\kappa }}{8} + {O}({\kappa ^3}).\end{equation}
The negative sign indicates that the location is shifted towards the inner edge. As curvature is increased, this location is progressively shifted further inside.
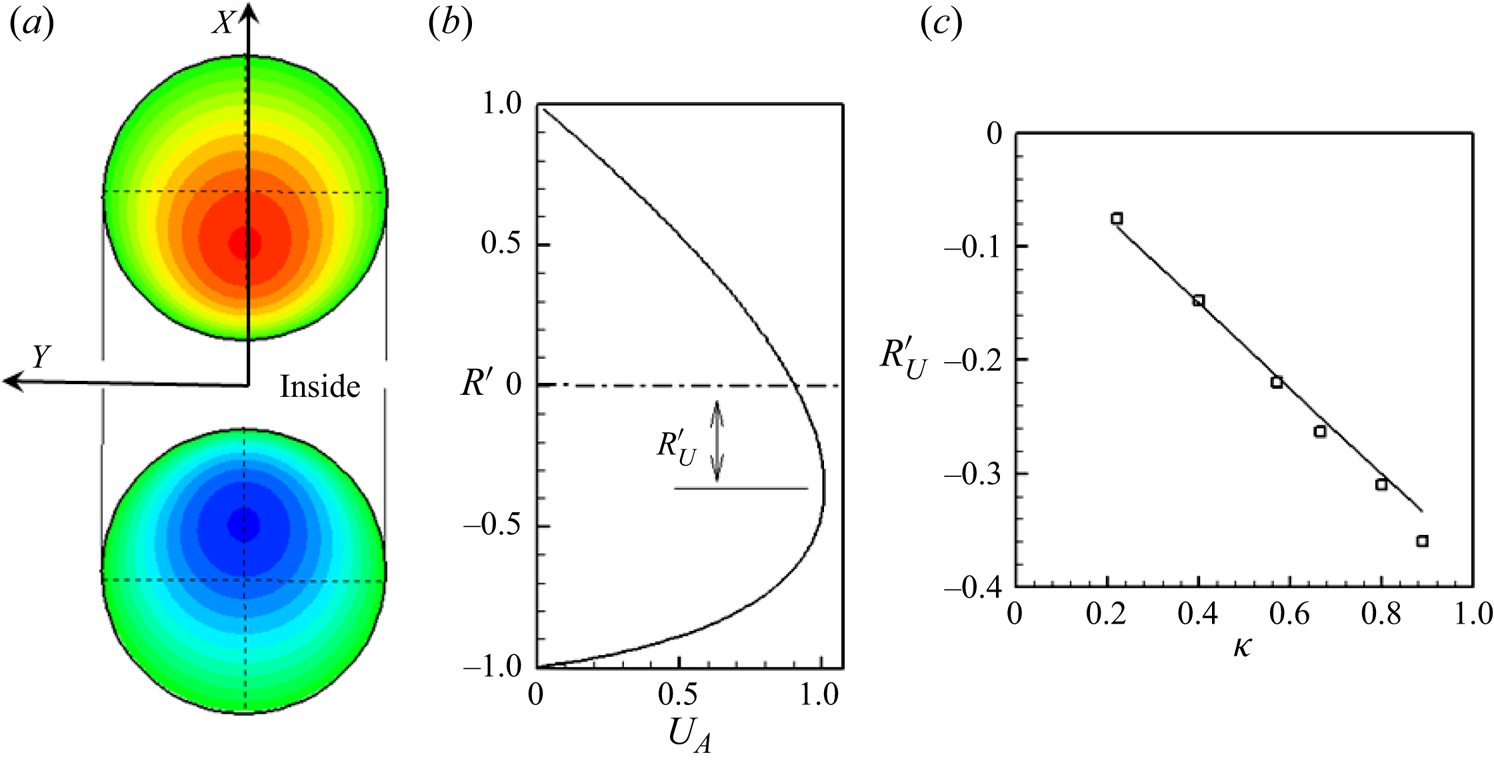
We simulate the flow in a torus without capsules for  $De \lt 1$ but at finite curvature using the current numerical methodology. The results are shown in figure 4. The computed axial velocity contours (figure 4a), and the velocity profile in the symmetry plane (figure 4b) show that the profile is asymmetric, and shifted toward the inside wall, in agreement with Dean's solution. The numerically predicted location of the maximum velocity,
 ${R^{\prime}_U}$, is compared against Dean's solution in figure 4(c), which shows good agreement between the two, validating the current methodology.
Flow field in a torus at small inertia. (a) Axial velocity contours. The flow is directed toward the reader in the top part and away from the reader in the bottom part. The location of maximum axial velocity is displaced toward the inside wall. (b) Axial velocity profile  ${U_A}$ on the symmetry plane (
 $Z = 0$) for a curvature ratio
 $\kappa = {R_t}/{R_c} = 0.89$. Dash-dotted line indicates the tube centreline. (c) Location of the velocity maximum
 ${R^{\prime}_U}$ is shown as a function of
 $\kappa $. Straight line represents Dean's solution (3.3), and symbols are the numerical predictions from current simulations.

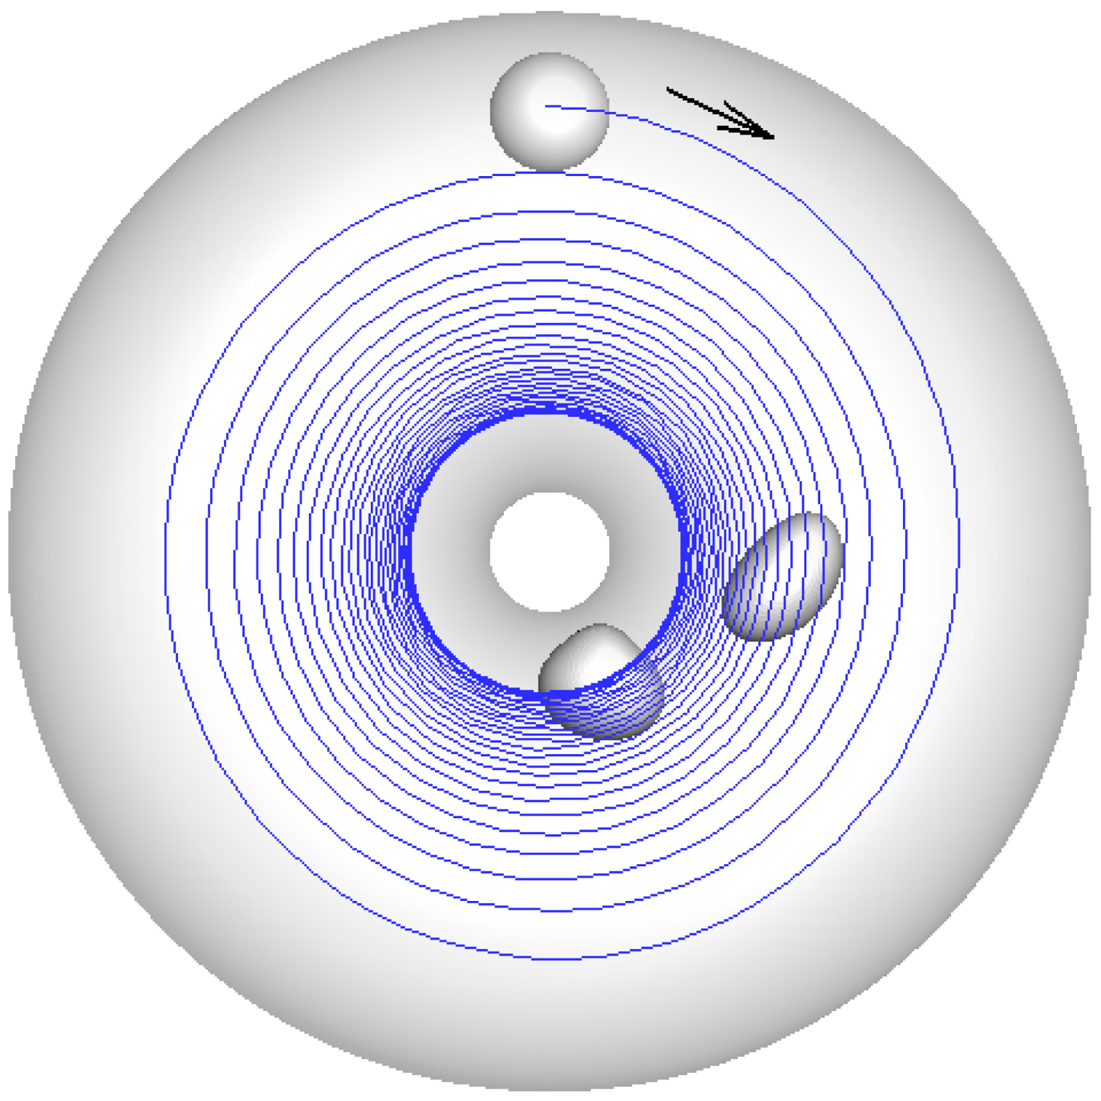
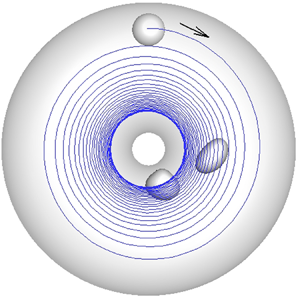
The motion of a capsule in a torus vessel is considered next. Figure 5 shows a representative simulation result. Here the capsule is initially released closer to the outermost edge with its centre-of-mass in the symmetry plane  $(Z = 0)$. As seen in the figure, while moving in the flow direction, the capsule also migrates radially across the flow streamlines and towards the inner wall. Eventually it settles at a radial location that is close to but a certain distance away from the inner wall. This result is significant, because at
 $De \ll 1$ there is no secondary velocity in the undisturbed flow that can drive the cell inward.
Representative capsule trajectory and a few instantaneous shapes at small inertia for  ${R_c} = 5,\, {R_t} = 4,\, Ca = 1$. The capsule of undeformed spherical shape is released closer the outermost edge on the symmetry plane. The arrow indicates flow direction. The capsule deforms, and while moving axially it also migrates cross-stream towards the inner wall, and settles close to the inner wall.

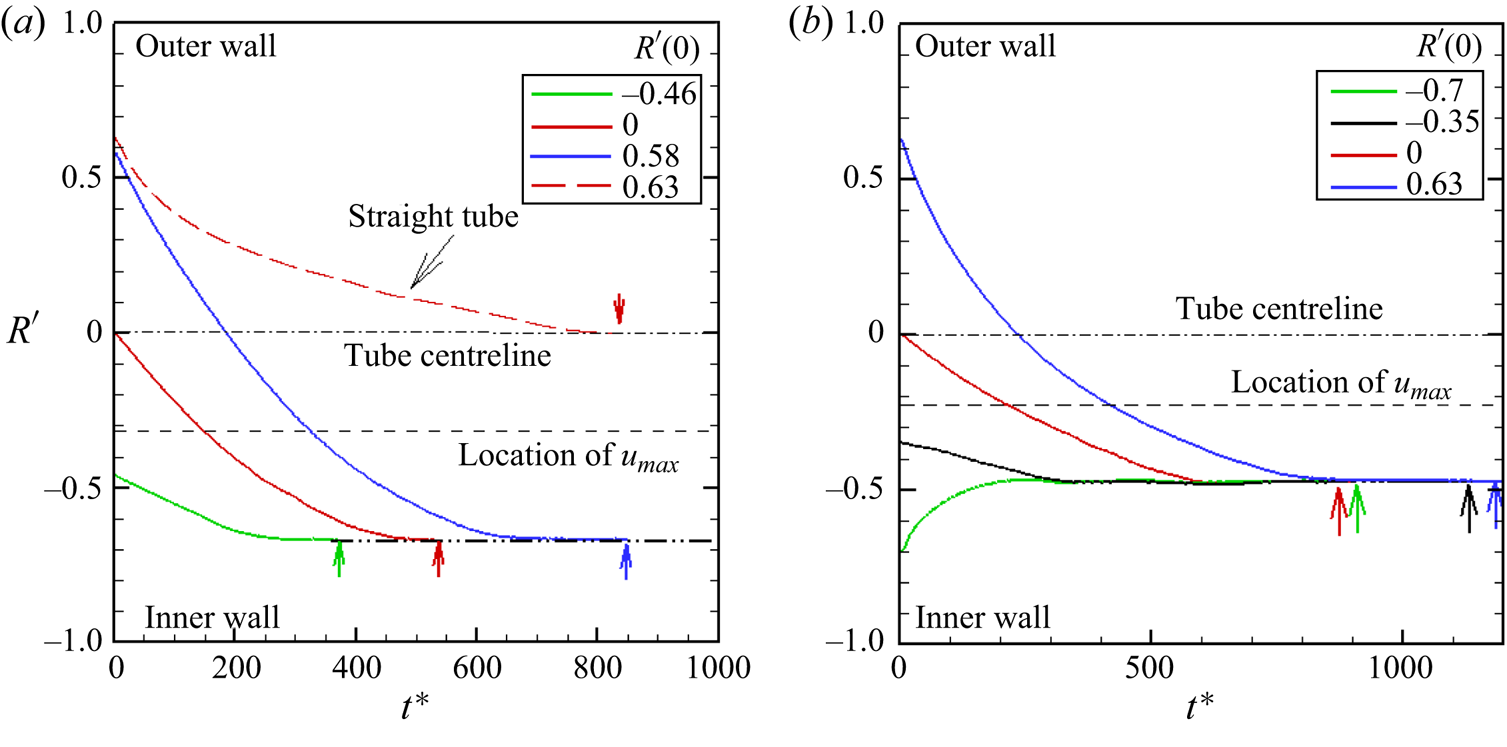
Figure 6 shows the effect of different initial release locations. Here the capsules are released at different radial distances, but on the symmetry plane  $Z = 0$. A fixed deformability
 $Ca = 1$ is considered. The time history of the radial location of the capsule centre-of-mass in terms of
 $R^{\prime}$ is shown. The centreline of the vessel and the location of the maximum fluid velocity
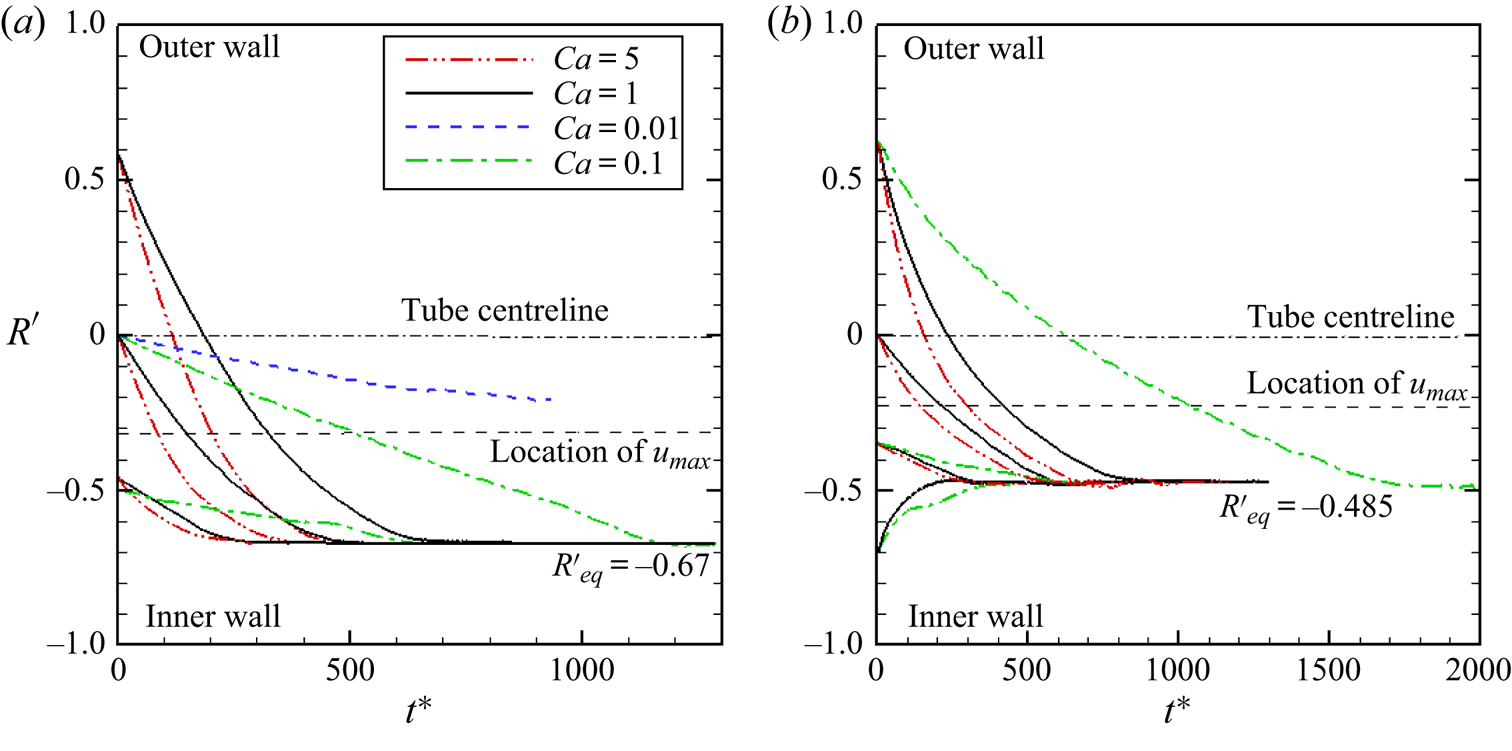
 ${U_{max}}$ are marked in the figure. As seen here, for all cases, capsules settle at the same final radial location. This equilibrium location is between the location of
 ${U_{max}}$ and the innermost wall of the vessel. It may also be noted, as seen in figure 6(b), that depending on the initial location of the capsule and the geometry of the torus, the cross-stream migration is either towards the inner wall or away from it.
Cross-stream migration of capsules at small inertia: (a) and (b) are for  ${R_C} = 5, {R_t} = 4$ and
 ${R_C} = 7,\, {R_t} = 4$, respectively. Here
 $Ca = 1$ is fixed. Shown here is the radial position of the capsule centre (solid lines in colour) in terms of
 $R^{\prime}$ as a function of time. Capsules are released at time
 ${t^\ast } = 0$ at different locations but on the symmetric
 $Z = 0$ plane. The initial location
 $R^{\prime}(0)$ for each curve is given in the figure. Marked on the figure are the vessel centreline (‒•‒), location of maximum fluid velocity
 ${U_{max}}$ (‒ ‒ ‒), and the final equilibrium location of the capsule (‒••‒, arrow). Also shown in (a) is the radial trajectory of a capsule in a straight tube of
 ${R_t} = 4$ and
 $Ca = 1$. Coloured arrows indicate the end of a simulation.
 ${R^{\prime}_{eq}}$ is reported for all cases.

Also shown in figure 6(a) is the radial trajectory of a capsule in a straight tube of same diameter. For this case, the capsule is observed to settle at the tube centreline. Additional simulations were done with different tube diameters. For all straight tube simulations, the centreline is observed to be the final equilibrium position. Therefore, the equilibrium positions of a capsule in a straight tube and in a torus are different, and this difference is noteworthy. In a straight tube, the capsule migrates towards and settles at the tube centre that is also the location of  ${U_{max}}$ and zero shear rate. In contrast, for a torus the equilibrium position is neither at the vessel centreline nor at the location of
 ${U_{max}}$ (zero shear rate), but in between the location of
 ${U_{max}}$ and the innermost wall, where the shear rate is not zero.
Multiple simulations are performed by varying the torus geometry (varying  ${R_C}$ and
 ${R_t}$) to obtain its effect on the equilibrium radial location of the capsule. These results are presented in figure 7 for a fixed
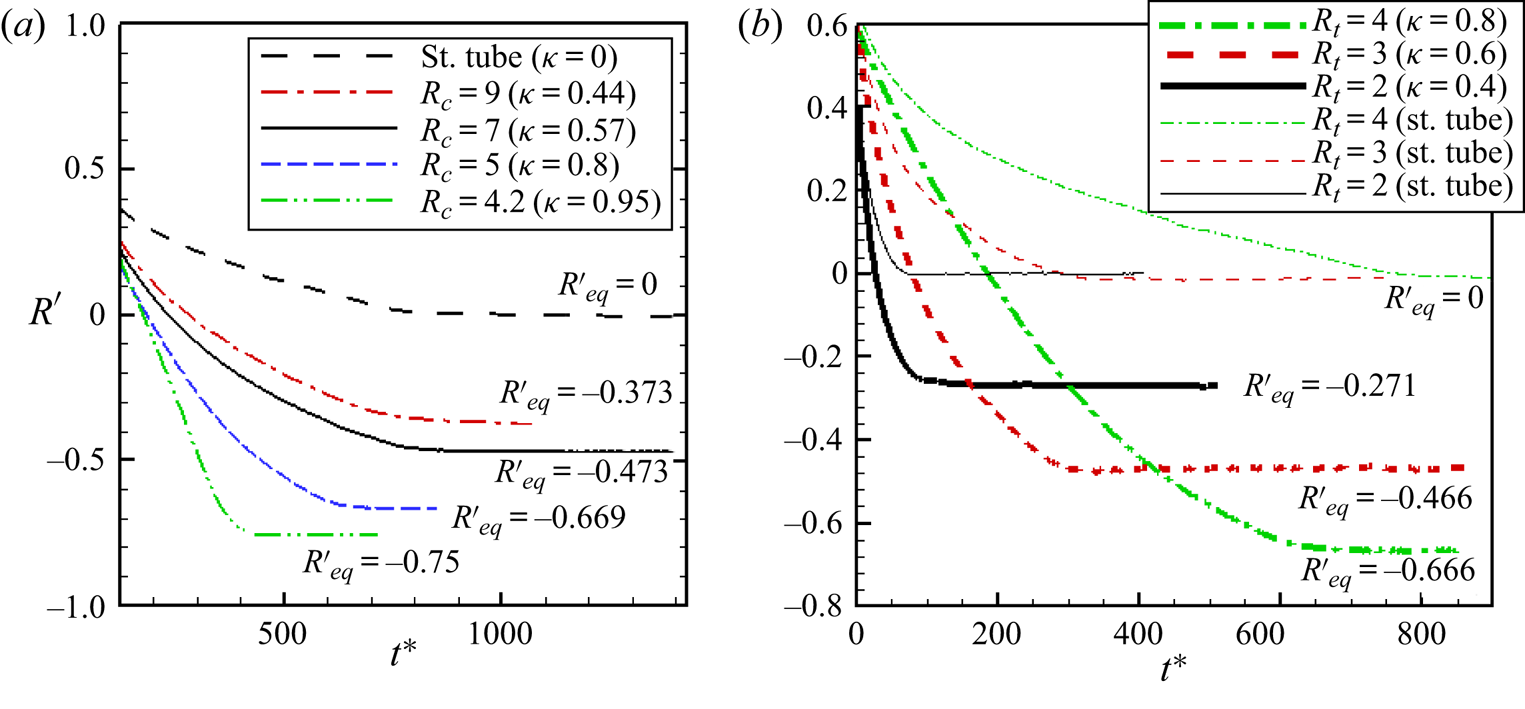
 $Ca = 1$. For each case, the straight tube result for the same tube radius is also shown. The effect of
 ${R_C}$ is considered in figure 7(a) keeping
 ${R_t} = 4$ fixed. Decreasing
 ${R_C}$ for a fixed
 ${R_t}$ (i.e. increasing the vessel curvature
 $\kappa $) results in the equilibrium position being increasingly closer to the inner edge of the torus. The effect of
 ${R_t}$ is shown in figure 7(b) keeping
 ${R_C} = 5$ fixed. This shows that with increasing
 ${R_t}$ at fixed
 ${R_C}$, which also results in increasing
 $\kappa $, leads to the equilibrium position being further closer to the inner edge.
Cross-stream migration of capsules in the torus at small inertia. (a) Influence of  ${R_C}$ is considered keeping
 ${R_t} = 4$ fixed. Radial trajectories of the capsule centre are shown for varying
 ${R_C}$ and for the straight tube of the same radius. Values of
 ${R_C}$ and
 $\kappa $ are shown in the legend. (b) Influence of
 ${R_t}$ is considered keeping
 ${R_C} = 5$ fixed. Here thick lines represent torus results, and thin lines represent straight tubes of the same radii. We report
 ${R^{\prime}_{eq}}$ for all cases.

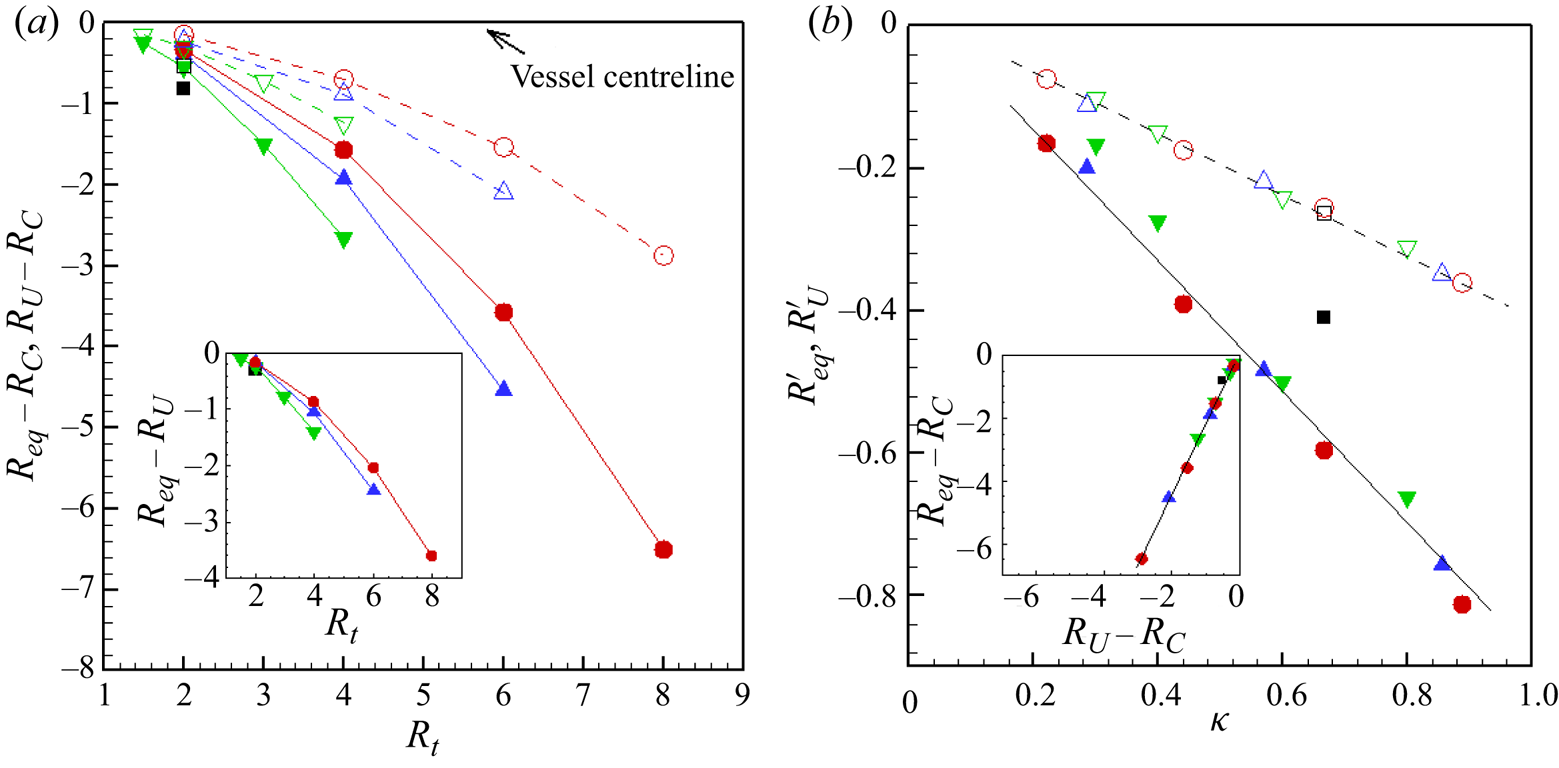
These results are summarised in figure 8 where the equilibrium radial location, denoted as  ${R_{eq}}$, is plotted as a function of
 ${R_t}$ and
 $\kappa $. Of specific interest is how
 ${R_{eq}}$ differs from the vessel centreline that is at a radial location
 ${R_C}$, and the location of maximum fluid velocity
 ${U_{max}}$ that is denoted by
 ${R_U}$. Figure 8(a) provides the results in terms of
 $({R_{eq}} - {R_C})$, and
 $({R_U} - {R_C})$. The inset of this figure shows
 $({R_{eq}} - {R_U})$. As seen here,
 ${R_U} - {R_C} \lt 0$, implying that the fluid velocity profile is shifted toward the inner side of the torus, as also noted previously. For all values of
 ${R_C}$ and
 ${R_t}$ considered,
 ${R_{eq}} - {R_C} \lt 0$, and
 $({R_{eq}} - {R_C}) \lt ({R_U} - {R_C})$. Therefore, for all torus geometry, the capsule equilibrium location is between the location of
 ${U_{max}}$ and the innermost wall. The deviation of the equilibrium location from the centreline and
 ${U_{max}}$ location is significant, as for several cases,
 $({R_{eq}} - {R_C})$ and
 $({R_{eq}} - {R_U})$ could be several capsule radii. It is noted that both
 $({R_{eq}} - {R_C})$ and
 $({R_{eq}} - {R_U})$ decrease with increasing
 ${R_t}$, meaning that the capsule settles increasingly further away from the vessel centreline, as well as from the location of
 ${U_{max}}$. Furthermore,
 $({R_{eq}} - {R_C})$ and
 $({R_{eq}} - {R_U})$ decrease with decreasing
 ${R_C}$, implying that an increasing curvature also results in an equilibrium location further toward the inner edge.
Equilibrium locations of capsules  $(Ca = 1)$ in the torus at small inertia: (a)
 $({R_{eq}} - {R_C})$ (filled symbols, solid lines) and
 $({R_U} - {R_C})$ (open symbols, dash lines) versus
 ${R_t}$ for
 ${R_C} = 3$ (black square), 5 (green gradient), 7 (blue delta) and 9 (red circle); the inset shows
 $({R_{eq}} - {R_U})$ versus
 ${R_t}$ for different
 ${R_C}$; (b)
 ${R^{\prime}_{eq}}$ (filled symbols) and
 ${R^{\prime}_U}$ (open symbols) versus
 $\kappa $; the inset shows
 $({R_{eq}} - {R_C})$ versus
 $({R_U} - {R_C})$. Symbols indicate same values of
 ${R_C}$ and
 ${R_t}$ as in (a).

It was mentioned previously that both the numerical simulation and Dean's solution predicted that the location of  ${U_{max}}$ when expressed as
 ${R^{\prime}_U} = ({R_U} - {R_C})/{R_t}$ varied linearly with the curvature ratio
 $\kappa $. To see whether a similar variation is present for the capsule equilibrium location, we define
 ${R^{\prime}_{eq}} = ({R_{eq}} - {R_C})/{R_t}$, and plot it in figure 8(b) as a function of
 $\kappa $. An apparent linear variation of
 ${R^{\prime}_{eq}}$ w.r.t
 $\kappa $ can be suggested by this plot, despite some scatter of the data. The data points that do not fall on the straight line are for smaller values of
 ${R_C}$ and
 ${R_t}$, for example
 ${R_C} = 3,\, {R_t} = 2$. For such cases, the equilibrium location appears to be too close to the inner surface of the torus (within less than one capsule radius), and the capsule hits the inner surface before reaching the equilibrium. For most cases, however, the equilibrium location is sufficiently away from the inner wall so that there is a sufficient gap between the capsule membrane and the inner surface. The numerical data supports the fact that
 ${R^{\prime}_{eq}} \to 0$ as
 $\kappa \to 0$ (straight tube limit), whereas in the other limit as
 $\kappa \to 1$,
 ${R^{\prime}_{eq}}$ approaches
 $- 1 + 1/{R_t}$ for a nearly spherical capsule because of the volume exclusion effect. When
 $({R_{eq}} - {R_C})$ is plotted against
 $({R_U} - {R_C})$, as in the inset of figure 8(b), a linear variation can be seen. The slope is higher than unity indicating that
 ${R^{\prime}_{eq}}$ drops at a faster rate than
 ${R^{\prime}_U}$ with respect to
 $\kappa $.
The mechanisms of radial migration at small inertia are discussed next. As noted in § 1, there are two mechanisms underlying capsule migration in a straight vessel in absence of inertia: the wall effect and deformation. The wall effect generally causes a migration away from the wall, and the deformation effect causes a migration towards the region of low shear. Their combined effect results in migration toward and settling at the tube centreline in straight vessels. These two mechanisms are also present in the toroidal vessel: the wall effect causes an inward migration for  $R^{\prime} \gt 0$, and an outward migration for
 $R^{\prime} \lt 0$. For the torus flow, the zero shear rate occurs at
 ${R^{\prime}_U}$. Hence, the deformation effect causes an inward migration for
 $R^{\prime} \gt \, {R^{\prime}_U}$, but an outward migration for
 $R^{\prime} \lt \, {R^{\prime}_U}$. However, these two mechanisms alone cannot account for the equilibrium position as predicted to be in the region
 ${R_i} \lt {R_{eq}} \lt \, {R_U}$. The additional mechanism that is also present is a curvature-induced migration, as was observed for two-dimensional rotating flows by previous authors (Shafer et al. Reference Shafer, Laiken and Zimm1974; Chan & Leal Reference Chan and Leal1979; Ghigliotti et al. Reference Ghigliotti, Rahimian, Biros and Misbah2011). This curvature effect always causes an inward migration, that is, from the region of low to higher streamline curvature. Hence it is in opposite direction to the deformation effect for
 $R^{\prime} \lt \, {R^{\prime}_U}$, and wall effect for
 $R^{\prime} \lt 0$, resulting in the equilibrium location in
 ${R_i} \lt {R_{eq}} \lt \, {R_U}$. As
 ${R_U}$ approaches
 ${R_i}$ as
 $\kappa $ increases (figure 6),
 ${R_{eq}}$ also moves increasingly closer to the inner wall, explaining the trends noted in figure 7. It may be noted that a pure rotation flow
 $({V_\theta }\, \sim \, R)$ in absence of inertia does not cause a capsule migration since there is no deformation.
The rate of radial migration can be inferred from figure 7. Figure 7(a) suggests that for a constant  ${R_t}$, the migration rate increases with decreasing
 ${R_C}$, and, hence, with increasing
 $\kappa $. As such, the migration rate is the lowest for a straight tube of the same diameter. Previous studies on deformable drops, capsules and vesicles in straight tubes and channels have shown that the migration velocity is dependent on the local shear rate
 $\dot{\gamma }$ of the undisturbed flow, and it increases with increasing
 $\dot{\gamma }$. It is of interest to see how
 $\dot{\gamma }$ varies with the vessel curvature, and whether the dependence of the migration rate on
 $\kappa $ can be inferred from
 $\dot{\gamma }$. First, it can be noted in figure 4(b) that near the outer edge
 $(R^{\prime} \to 1)$,
 $\dot{\gamma }$ for the torus is less than that for the straight vessel, because the location of
 ${U_{max}}$ has moved toward the inner edge. This is also supported by (3.1), which gives
 $\dot{\gamma }(r = {R_t}) = ( - 16 + 12\kappa - 9{\kappa ^2})/8{R_t}$ with the limiting values of
 $- 2/{R_t}$ for
 $\kappa = 0$ and
 $- 13/8{R_t}$ for
 $\kappa = 1$. Therefore, (3.1) as well as the numerical simulations suggest that
 $\dot{\gamma }$ near the outer wall decreases with increasing curvature. Yet, the migration rate is observed to be higher than that in the straight tube, and it increases with increasing
 $\kappa $ as suggested by the slopes of the trajectories in figure 7(a). This clearly indicates the presence of the curvature-induced inward migration, and that the rate of such migration increases with increasing vessel curvature.
We now consider the influence of  $Ca$. This is shown in figure 9 where radial location in terms of
 $R^{\prime}$ is plotted against time for different values of
 $Ca$ in the range 0.01 to 5. Surprisingly, we find that for a given geometry, capsules settle at the same equilibrium location independent of
 $Ca$ considered.
Effect of  $Ca$ at small inertia in the torus. Shown here is the radial position of the capsule centre as a function of time and for different
 $Ca$: (a) for
 ${R_C} = 5,\, {R_t} = 4$ and (b) for
 ${R_C} = 7,\, {R_t} = 4$. Capsules migrate to the same radial location that is independent of
 $Ca$. Capsules of same
 $Ca$ are shown using the same colour and line patterns. Capsules of the same
 $Ca$ are considered for multiple initial release positions, which can be read from the figure as
 $R^{\prime}({t^\ast } = 0)$. We report
 ${R^{\prime}_{eq}}$ in the figure, which is independent of
 $Ca$ and initial release locations. The simulation for
 $Ca = 0.01$ is terminated before equilibrium is reached because the migration rate is slow, and the general trend is consistent with other cases and rigid particle (see text).

The rate of migration is however dependent on  $Ca$, and it increases with increasing
 $Ca$ as is the case for straight vessels. In the limit of small deformation, previous studies have shown that dimensionless migration velocity varies linearly with
 $Ca$ in straight vessels or in unbounded flow with straight streamlines (Chan & Leal Reference Chan and Leal1979; Helmy & Barthes-Biesel Reference Helmy and Barthes-Biesel1982; Shapira & Haber Reference Shapira and Haber1990). The current result that the same equilibrium location occurs for a range of
 $Ca$ suggests that the curvature-induced migration depends in a similar manner on
 $Ca$ as do the gradient-induced and wall-induced migration. Note that in the limit of a rigid particle, there is no lateral migration in the absence of inertia. We consider the case of
 $Ca = 0.01$ in figure 9(a) for which deformation is very small. As seen for this case, migration is extremely slow. Therefore, one can conclude that in the limit of
 $Ca \to 0$, the migration rate will approach zero, and there is no cross-stream movement. Also note that even a small
 $Ca$ will cause capsule deformation and break the linearity causing a lateral migration, unlike a perfectly rigid particle.
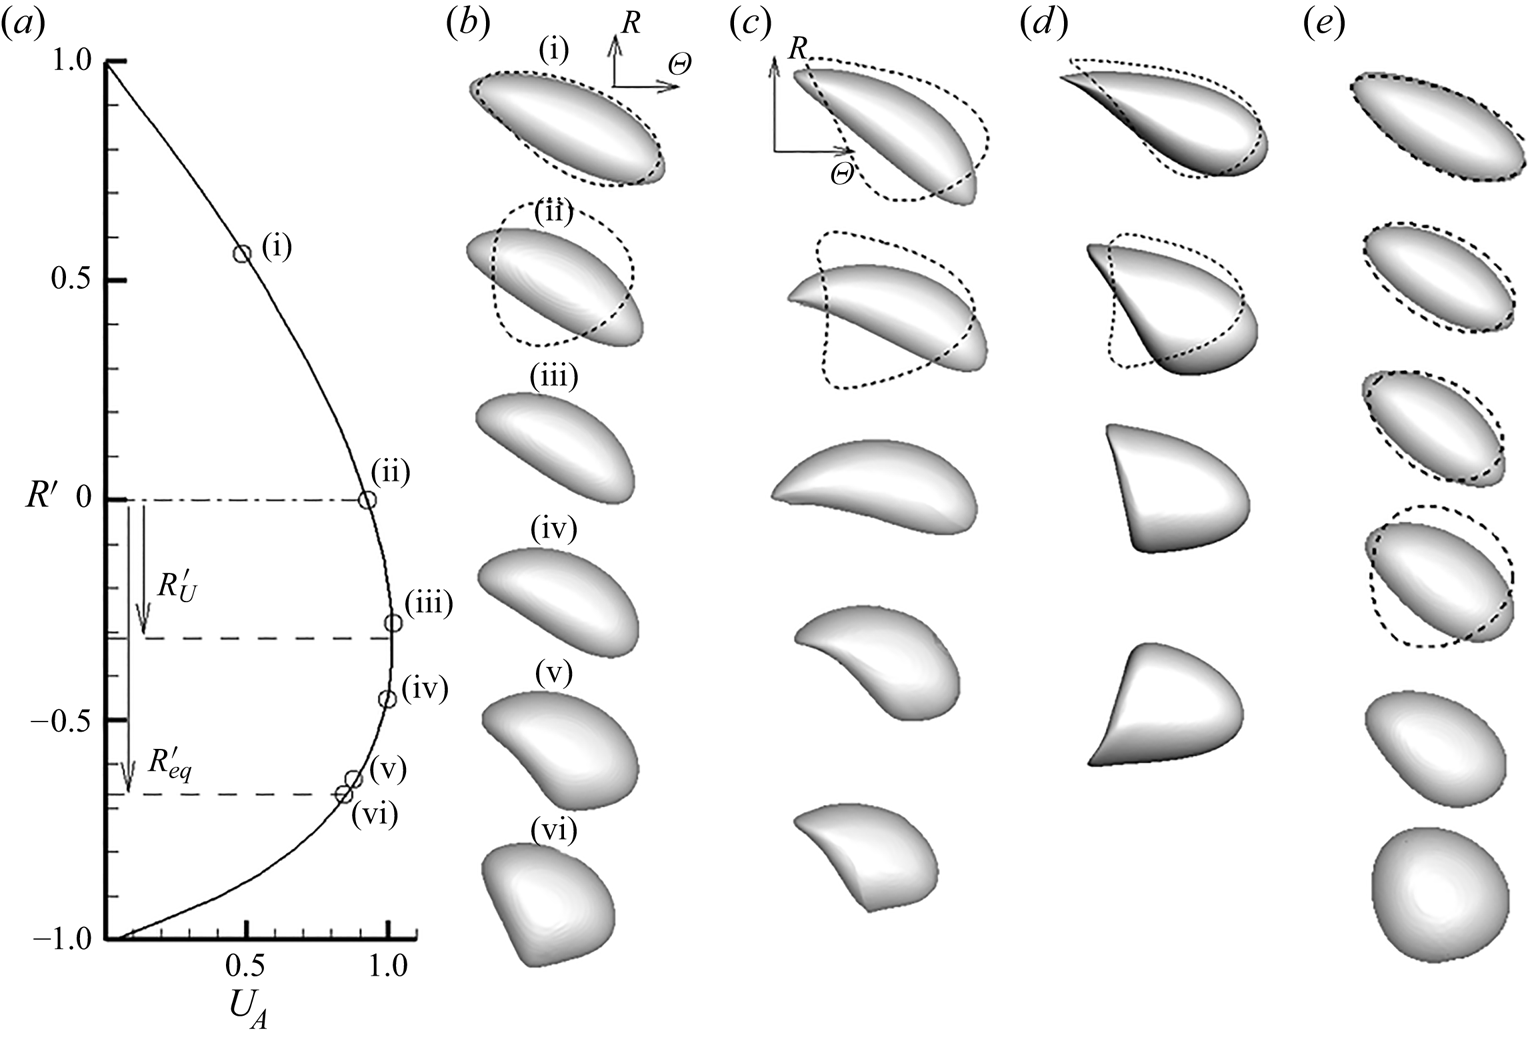
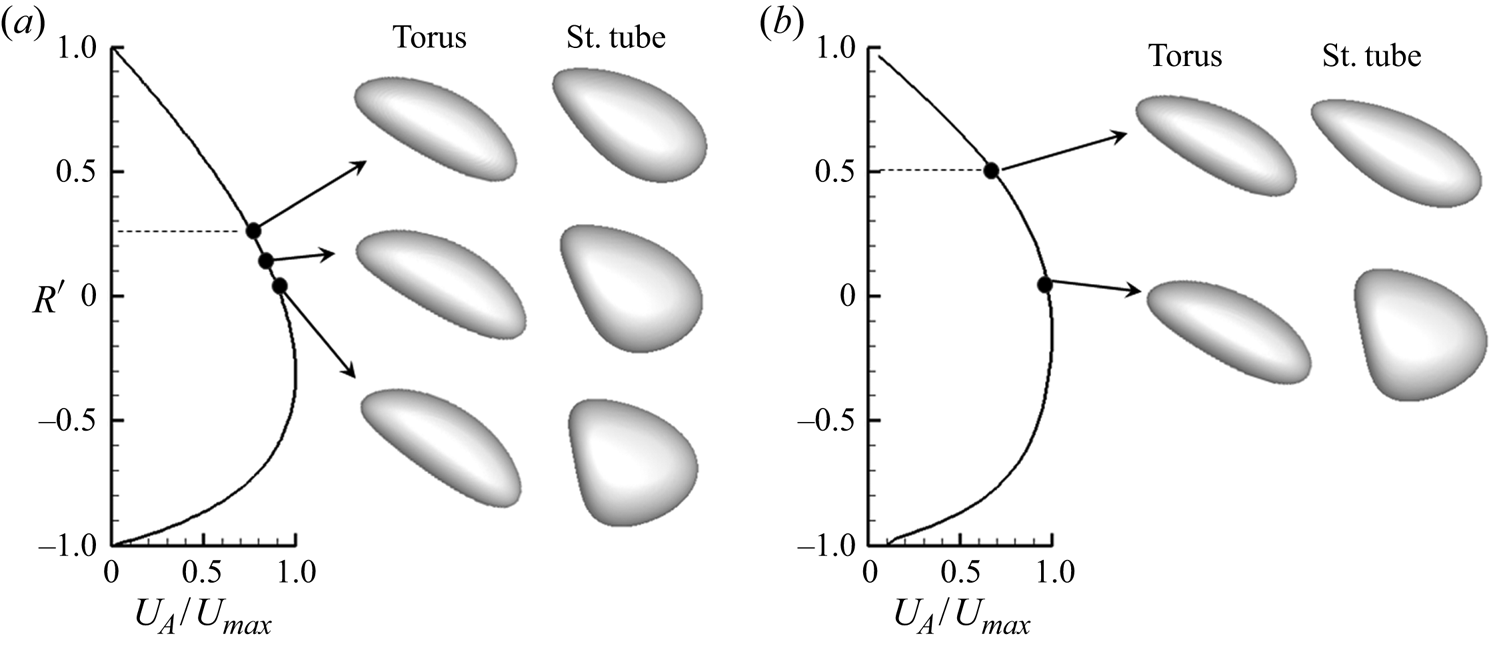
Figure 10 shows the capsule shape evolution over radial distance for different geometry. Results are compared with the shapes predicted in straight tubes of the same diameter. Highly asymmetric shapes are observed that arise due to the combined effect of streamline curvature, velocity gradient and the wall. Shapes depend on both  ${R_c}$ and
 ${R_t}$. For smaller
 ${R_c}$, a crescent shape is observed in the region
 $R^{\prime} \gt \, {R^{\prime}_U}$, with the outward surface of the capsule curving more than the inward surface. The curvature of the crescent is higher at smaller values of
 ${R_c}$ and
 ${R_t}$. As the equilibrium location is approached, a rapid change in shape occurs, and the inward surface curves in, eventually leading to an asymmetric bullet shape.
Capsule shape evolution in the torus at small inertia and as a function of radial locations for  $Ca = 5$. Three-dimensional shapes shown in greyscale are obtained in the torus. The capsule is released close to the outer wall. For each case, time progression is from top to bottom. Shapes shown by dashed lines as two-dimensional slices are those obtained in a straight tube of the same radius, and at the same location with respect to the tube centreline: (a,b)
 ${R_C} = 5,\, {R_t} = 4$; undisturbed velocity profile is shown, and radial locations are marked by (i)–(vi); (c)
 ${R_C} = 3,\, {R_t} = 2$; shapes are given for
 $R^{\prime} = 0.155,\, - 0.015,\, - 0.19,\, - 0.36,\, - 0.39$; (d)
 ${R_C} = 9,\, {R_t} = 2$; shapes are given for
 $R^{\prime} = 0.185,\, 0,\, - 0.1,\, - 0.21$; (e)
 ${R_C} = 9,\, {R_t} = 6$; shapes are given for
 $R^{\prime} = 0.75,\, 0.5,\, 0,\, - 0.36,\, - 0.57$.

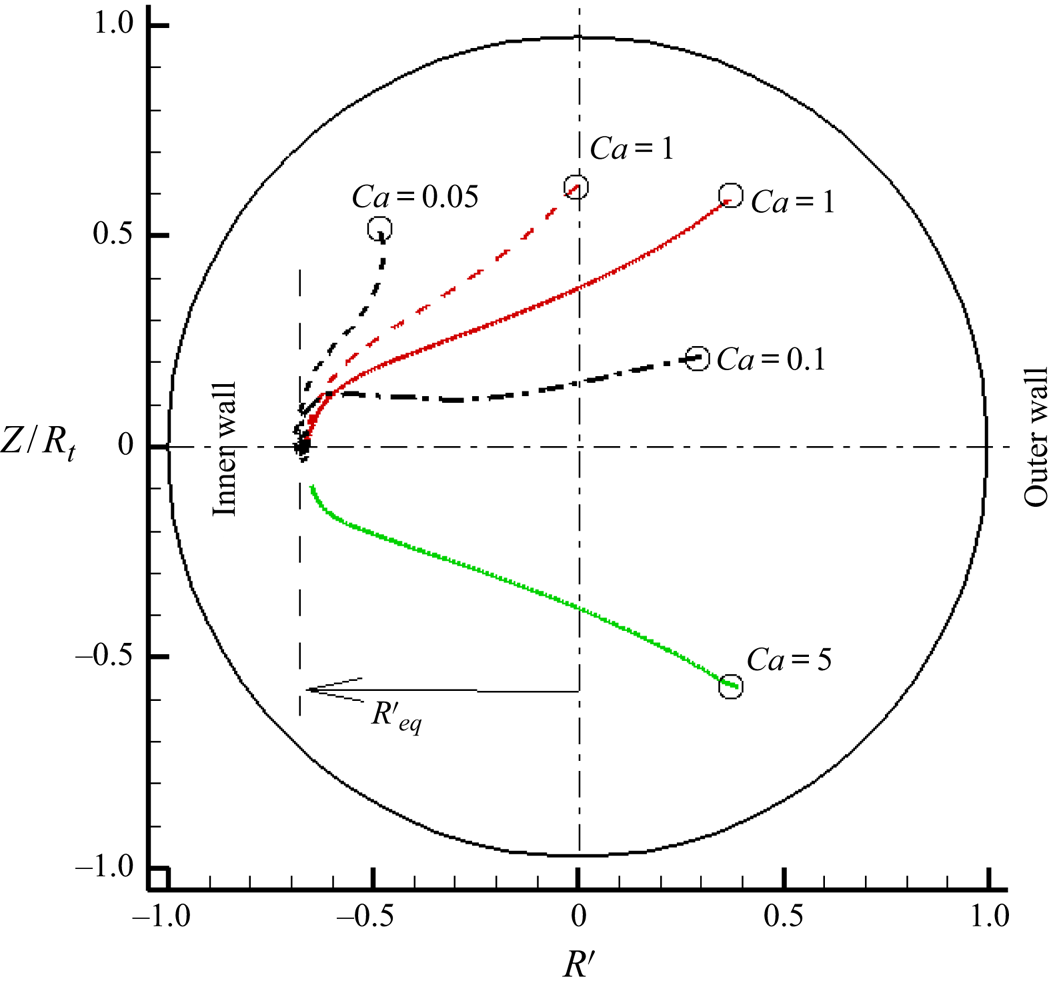
Results presented so far considered capsules released at the symmetry plane  $Z = 0$. As there is no out-of-plane force, the capsule remains in this plane. We now consider capsules released at different Z locations. Figure 11 shows trajectories for different initial locations and
 $Ca$. For all cases, capsules migrate to the symmetry plane, and to the same equilibrium locations. As the flowfield is symmetric about
 $Z = 0$, there are only wall effect and deformation effect in this direction. These two mechanisms drive the capsule toward the symmetry plane, while the curvature effect drives it toward
 $R = {R_{eq}}$.
Capsule migration in torus at small inertia for different initial release locations with respect to the symmetric  $Z = 0$ plane. Trajectories are shown in the cross-sectional plane. Initial locations are marked by ‘O’. Capsules migrate and settle at
 $R = {R_{eq}}$ on
 $Z = 0$ plane. Here
 ${R_C} = 5,\, {R_t} = 4$.

3.2. Capsule motion in torus vessels at finite inertia
We now consider the effect of inertia. To reduce parameter variations, in this section we consider a fixed torus geometry of  ${R_C} = 5,\, {R_t} = 4$. Results are presented in terms of tube Reynolds number
 $R{e_t}$. As the curvature ratio
 $\kappa = 0.8$ is fixed, the Dean number can be readily obtained using
 $De = R{e_t}\sqrt \kappa $.
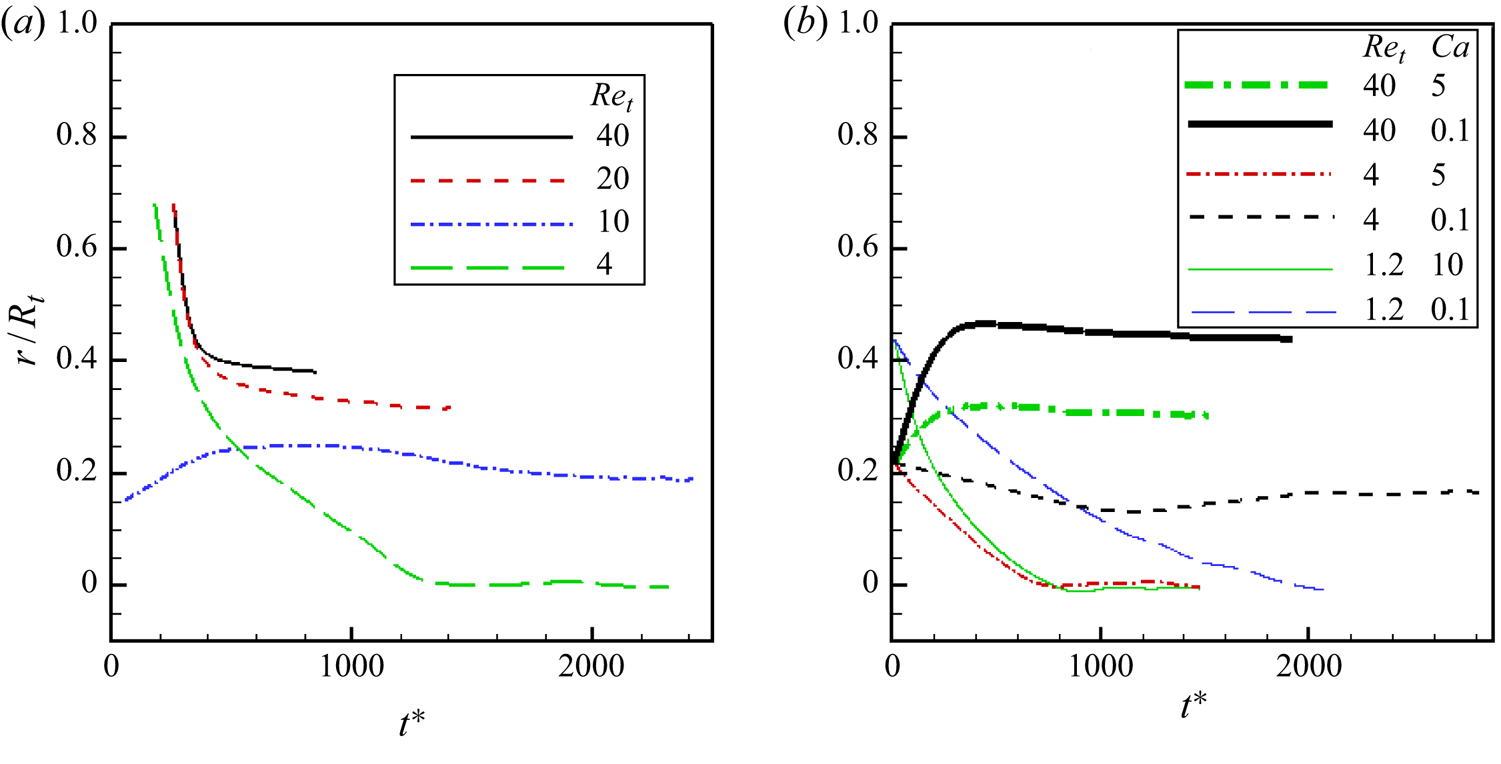
Before considering the torus vessel, we present results on migration in a straight tube of the same radius at finite inertia. Figure 12(a) shows radial trajectories in the straight tube for constant  $Ca = 1$, but varying
 $R{e_t}$ from 4 to 40. This shows that for a fixed
 $Ca$, the equilibrium radial location in a straight tube is dependent on
 $R{e_t}$. For
 $Ca = 1$, the capsule settles at the tube centre if
 $R{e_t} \le 4$, but it settles increasingly further away from the centre as
 $R{e_t}$ increases above
 ${\sim}4$. The effect of varying
 $Ca$ for fixed values of
 $R{e_t}$ is considered in figure 12(b), which shows that capsules settle closer to the tube centre as
 $Ca$ increases. These results show the competing effects of deformation and inertial lift. While the deformation effect causes a migration toward the tube centre, the inertial effect causes migration away from the centre.
Finite inertia results for capsule migration in a straight tube of  ${R_t} = 4$. Radial trajectories (
 $r/{R_t}$; 0 represents tube centreline) are shown in (a) for a fixed
 $Ca = 1$ but varying
 $R{e_t}$, and (b) for fixed values of
 $R{e_t}$ but varying
 $Ca$.

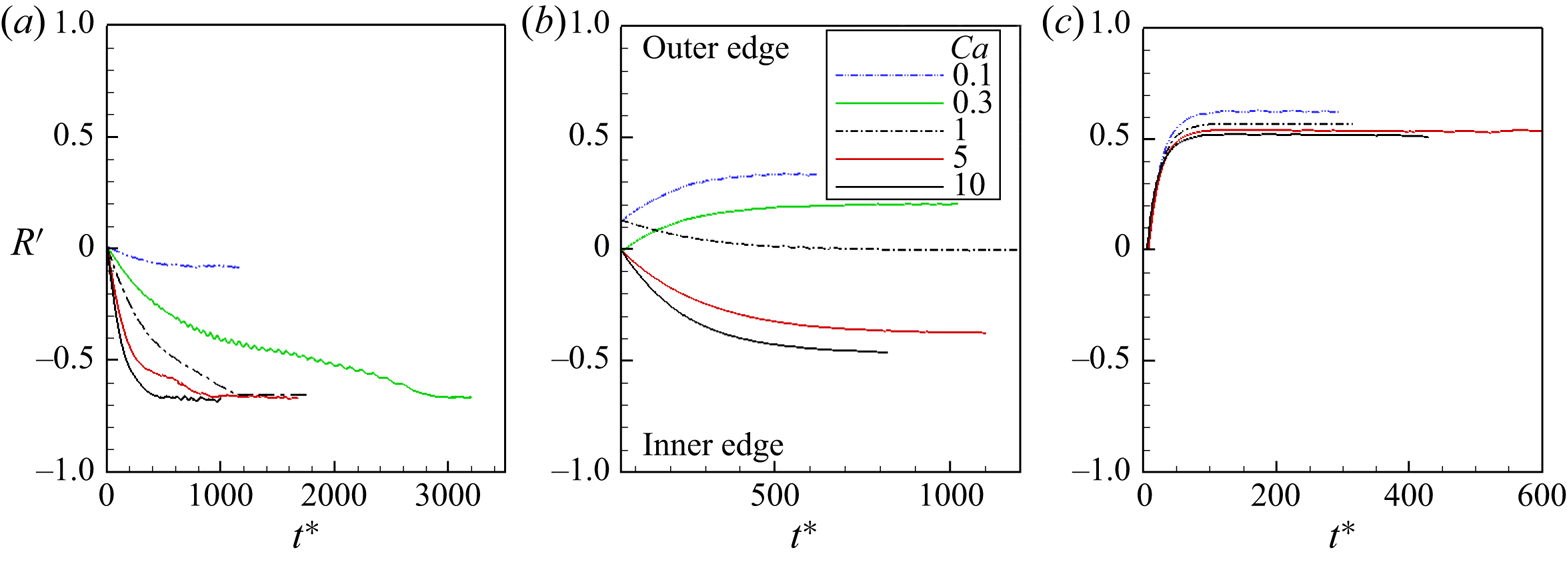
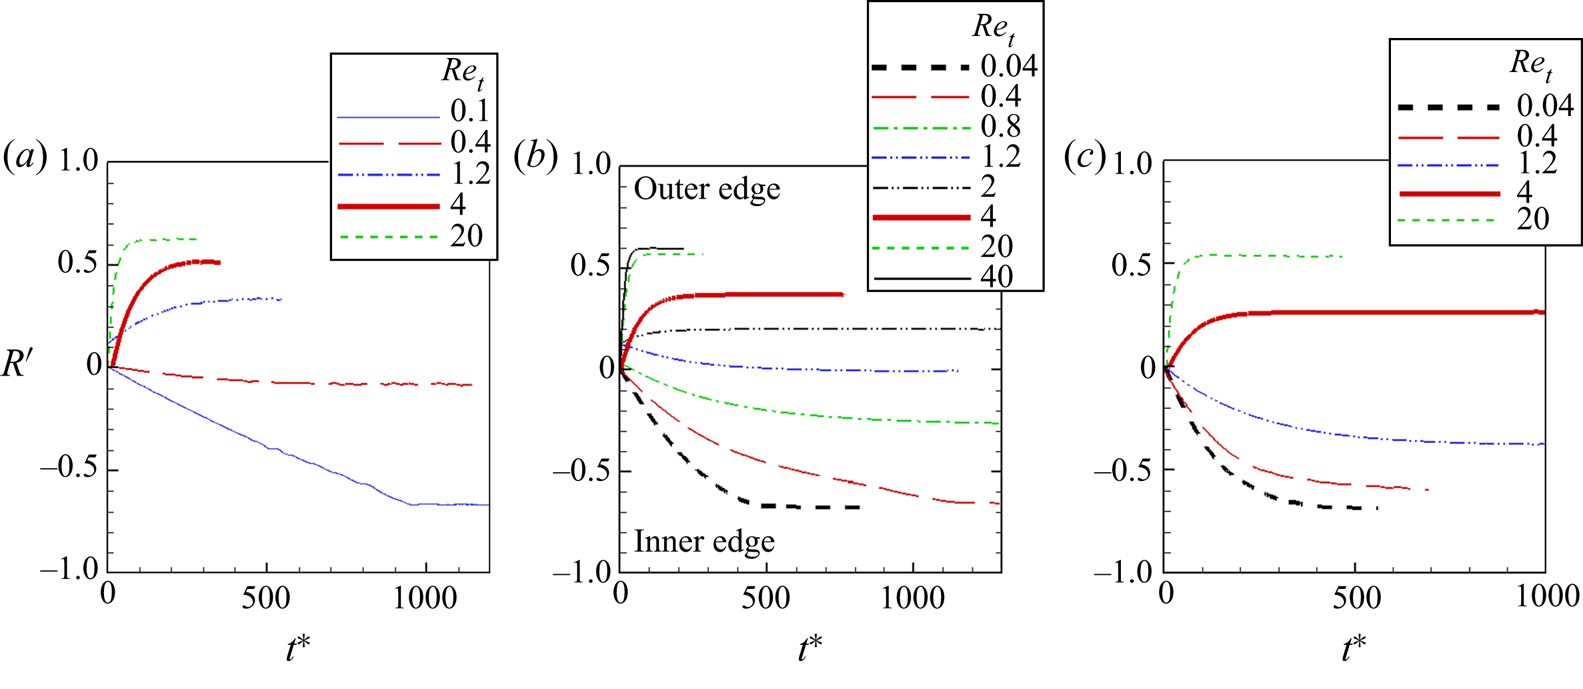
Finite inertia results for the toroidal vessel are shown in figures 13 and 14 for varying  $Ca$ and
 $R{e_t}$ spanning over a range of two orders. In these simulations, capsules are released in the torus symmetry plane
 $(Z = 0)$. It is seen that the direction of capsule migration can be either towards the inner edge or outer edge. Accordingly, the equilibrium position at finite inertia is dependent on
 $Ca$ and
 $R{e_t}$. This is in stark contrast to what was observed at small inertia in the previous section, where the equilibrium position was found to be independent of
 $Ca$. In general, capsules settle closer to the inner edge at smaller values of
 $R{e_t}$ and larger
 $Ca$, whereas they settle closer toward the outer edge at higher values of
 $R{e_t}$ and smaller
 $Ca$. Figure 13 shows that for
 $R{e_t} = 0.4$, capsules settle in region
 $R^{\prime} \lesssim 0$, with higher
 $Ca$ settling closer toward the inner edge. For
 $R{e_t} = 1.2$, capsules with
 $Ca \lt 1$ settle in region
 $R^{\prime}\gtrsim 0$, while
 $Ca \simeq 1$ settle near the centreline, and larger
 $Ca$ settle in
 $R^{\prime}\lesssim 0$. For
 $R{e_t} = 20$, all
 $Ca$ cases settle closer to the outer edge. Similar conclusion is made from figure 14, where the effect of
 $R{e_t}$ is considered for fixed
 $Ca$. When
 $Ca = 0.1$ is considered, capsules settle in region
 $R^{\prime}\lesssim 0$ for
 $R{e_t}\lesssim 0.4$, and in
 $R^{\prime}\gtrsim 0$ for
 $R{e_t} \gt 0.4$. When
 $Ca$ is increased to 1, capsules settle in
 $R^{\prime}\lesssim 0$ for
 $R{e_t}\lesssim 1.2$, and in
 $R^{\prime}\gtrsim 0$ for
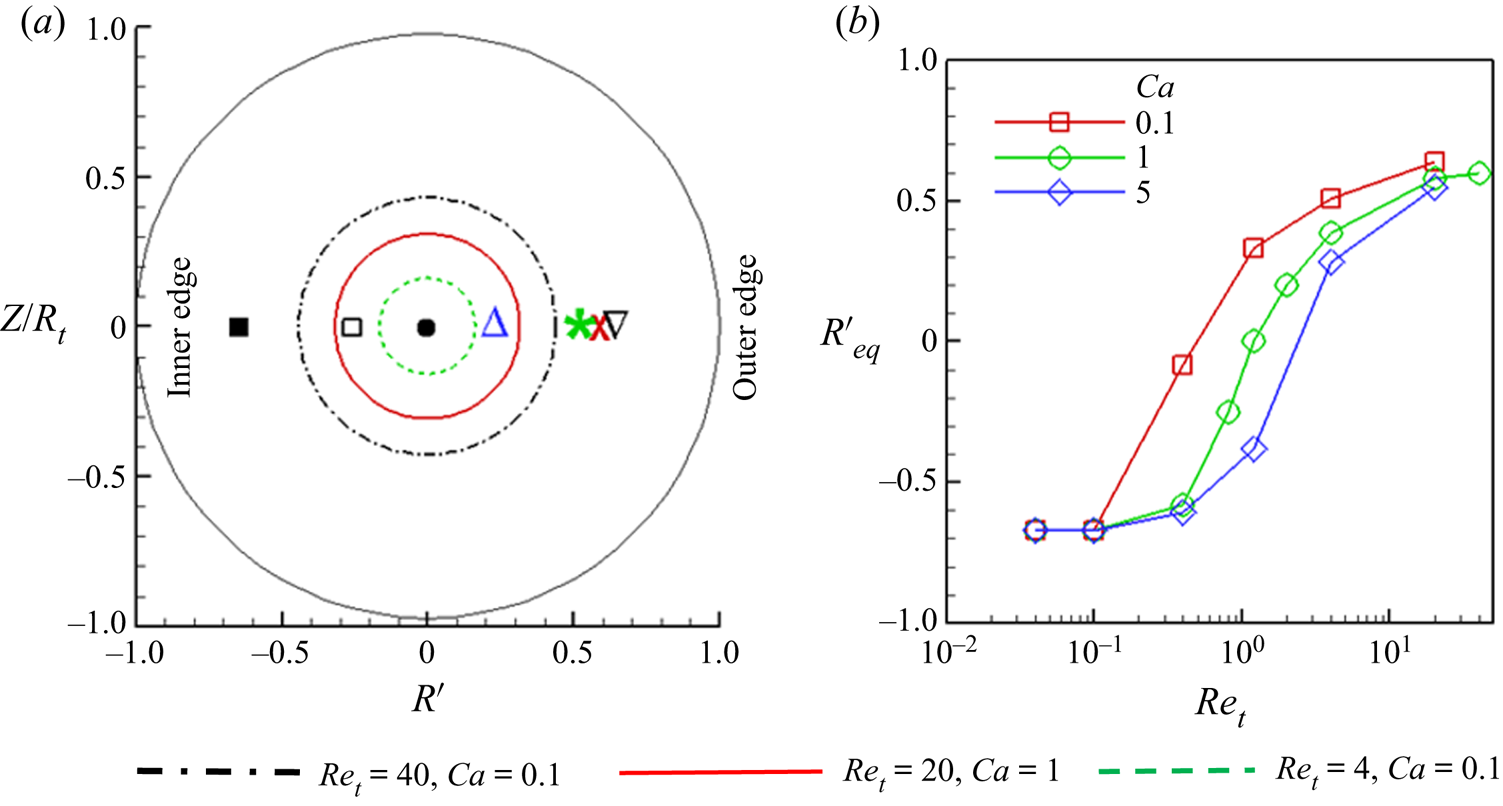
 $R{e_t}\gtrsim 1.2$. Figure 15(b) summarises all the equilibrium locations by plotting
 ${R^{\prime}_{eq}}$ as a function of
 $R{e_t}$ and
 $Ca$.
Finite inertia results for capsule migration in a torus of  ${R_C} = 5,\,{R_t} = 4$. Capsules are released in the symmetry plane
 $(Z = 0)$. Radial trajectories in terms of
 $R^{\prime}$ are shown for
 $R{e_t} = 0.4$ (a), 1.2 (b), and 20 (c) for varying
 $Ca$. Parts (a) and (c) have the same legend as (b).

Finite inertia results for capsule migration in a torus of  ${R_C} = 5,{R_t} = 4$. Capsules are released in the symmetry plane
 $(Z = 0)$. Radial trajectories in terms of
 $R^{\prime}$ are shown for
 $Ca = 0.1$ (a), 1 (b) and 5 (c) for different
 $R{e_t}$.

(a) Comparison of finite inertia results for torus  $({R_C} = 5,{R_t} = 4)$ and straight tube
 $({R_t} = 4)$. Equilibrium radial positions are shown in the cross-section plane. Straight tube results are shown by circles. Black dash-dot,
 $R{e_t} = 40,\, Ca = 0.1$; solid red,
 $R{e_t} = 20,Ca = 1$; green dashed,
 $R{e_t} = 4,\, Ca = 0.1$;
 ${\bullet}\,\, R{e_t}\lesssim 1$. Torus results are shown by symbols:
 $\boldsymbol{\nabla}R{e_t} = 40,Ca = 0.1$; X, red
 $R{e_t} = 20,Ca = 1$;
 $*$, green
 $R{e_t} = 4,\, Ca = 0.1$; Δ, blue
 $R{e_t} = 2,Ca = 1$; □
 $R{e_t} = 0.8,\, Ca = 1$; ■
 $R{e_t} \le 0.4,\, Ca = 1$. (b) Plot of
 ${R^{\prime}_{eq}}$ as a function of
 $R{e_t}$ and
 $Ca$.

The equilibrium locations for the torus and straight tube are compared in figure 15 for a few cases. The main characteristics to be noted here are that for the straight tube, the equilibrium locations are concentric circles with radii depending on  $Ca$ and
 $R{e_t}$. For a specific
 $Ca$ and
 $R{e_t}$, a capsule can settle at any point on this circle. In contrast, the equilibrium locations for the tours are along the symmetry plane; hence, a specific
 $Ca$ and
 $R{e_t}$ has a unique settling location. For straight tubes, the equilibrium radius increases with increasing
 $R{e_t}$ and decreasing
 $Ca$. In the limiting case of
 $R{e_t} \ll 1$, vessel centre is the equilibrium location. For the torus, settling location spans from the inner edge to outer edge along the symmetry plane
 $Z = 0$; it is closer toward the inner edge for smaller
 $R{e_t}$ and larger
 $Ca$, and toward the outer edge for larger
 $R{e_t}$ and smaller
 $Ca$. For
 $R{e_t} \gg 1$, the equilibrium location in a torus can be further away from the vessel centreline than in a straight tube.
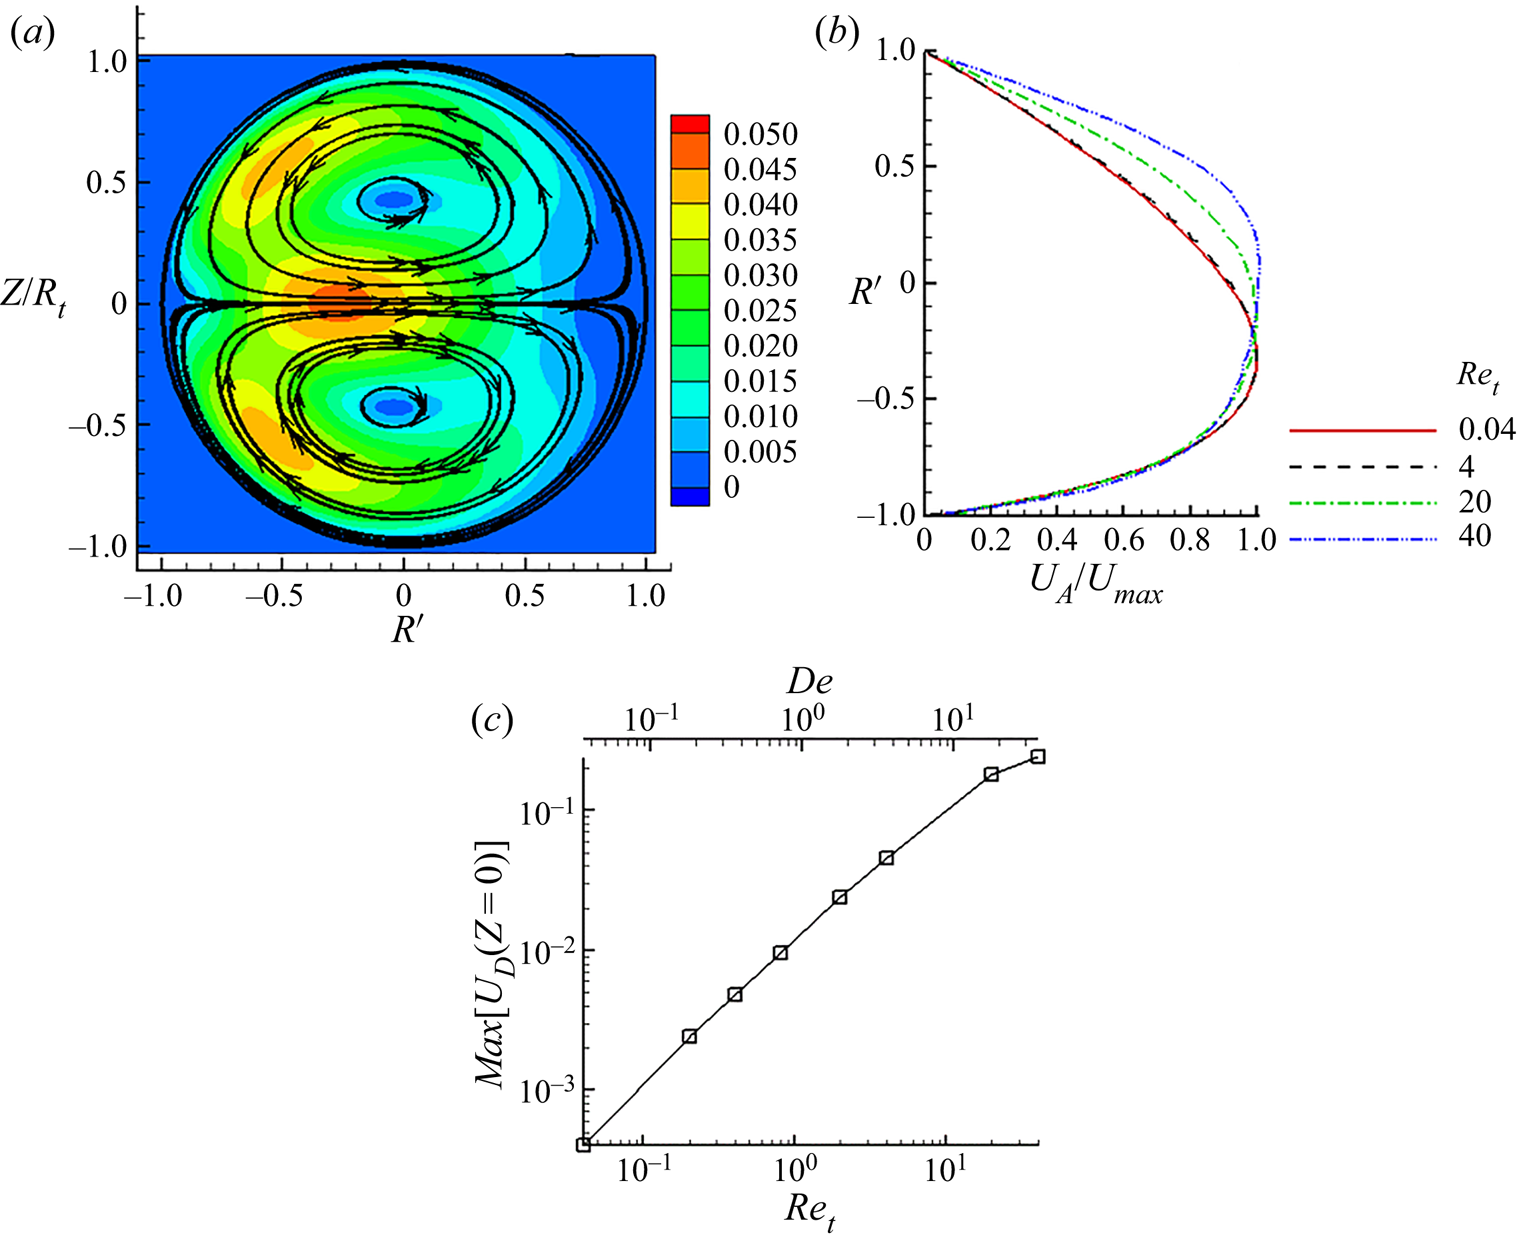
To explain these results, the flow field in the torus at finite inertia is considered. Figure 16(a) shows the flow field in the cross-sectional plane for  $R{e_t} = 4$. A secondary flow characterised by two counter-rotating vortices (Dean's vortex) is observed. The fluid near the symmetry plane moves from inner to the outer edge, whereas the fluid along the vessel wall moves from the outer to the inner edge. Figure 16(b) shows the axial velocity profiles in the symmetry plane for varying
 $R{e_t}$. The figure shows that the velocity profiles are nearly identical for
 $R{e_t}\lesssim 4$ for which it is skewed towards the inner edge as is the case at small inertia. As
 $R{e_t}$ increases above this value, the profile becomes skewed toward the outer edge. This trend agrees with Dean's solution at finite inertia. Interestingly, Figure 16(b) also shows that at
 $R{e_t} = 20$ the velocity profile becomes less shifted, which is similar to that reported in Verkaik et al. (Reference Verkaik, Beulen, Bogaerds, Rutten and van de Vosse2009). Figure 16(c) shows the maximum of the secondary velocity
 ${U_D}$ obtained at the symmetry plane. It is seen that
 ${U_D}$ increases in proportion with increasing
 $R{e_t}$ and
 $De$. Dean's theory predicts that
 ${U_D}\sim {O}(De)$ (Siggers & Waters Reference Siggers and Waters2005). The trend of the numerical results, therefore, is in qualitative agreement with the theory. It may be noted that in the simulations, the full Navier–Stokes equations are solved including the inertial terms; therefore, the secondary velocity, although very small
 ${U_D} \lt {O}({10^{ - 3}})$, exists even for the lowest
 $R{e_t} = 0.04$ considered.
(a) Secondary flow at finite inertia.  $R{e_t} = 4$ is considered as an example. Colour contours show the magnitude of secondary velocity
 ${U_D} = \sqrt {u_R^2 + u_Z^2} $. (b) Axial velocity profiles on the symmetry plane for different
 $R{e_t}$. (c) Maximum of the secondary velocity at the torus symmetry plane (
 $Z = 0$), scaled by the maximum axial velocity, as a function of
 $R{e_t}$, and
 $De$.

At finite inertia, the capsule equilibrium position is dictated by five underlying mechanisms: wall effect, deformation-induced migration, curvature-induced inward migration, inertial lift due to shear gradient and centrifugal force. The first three mechanisms are present even when inertia is small, as seen in the previous section. A comment should be made about the deformation-induced migration, which drives the capsule toward the region of the lowest shear (i.e. region of maximum axial velocity). When inertia is small, this region is located closer to the inner edge; therefore, in this limit, deformation causes the capsule to migrate from outer toward inner edge. As inertia increases, the region of the lowest shear gradually shifts away from the inner edge with increasing  $R{e_t}$, as seen in figure 16(b). Hence, at finite inertia, deformation alone can cause a migration toward either the inner or the outer edge. Second, the inertial lift is present even in a straight vessel, and it causes the capsule to settle at a radial location between the vessel wall and centreline. This mechanism is also expected to cause a similar effect in the torus vessel. Finally, the centrifugal force results in the secondary flow which imparts a drag (Dean's drag, as referred to in Di Carlo et al. Reference Di Carlo, Irimia, Tompkin and Toner2007; Karimi et al. Reference Karimi, Yazdi and Ardekani2013; Martel & Toner Reference Martel and Toner2014; Gossett & Di Carlo Reference Gossett and Di Carlo2019) on the capsule driving it from the inner toward outer edge. Dean's drag is expected to increase with increasing
 ${U_D}$, and hence with increasing
 $R{e_t}$. In the case of a rigid particle with radius much smaller than the vessel radius, the equilibrium position is determined by a balance of the inertial lift and the Dean's drag (Di Carlo et al. Reference Di Carlo, Irimia, Tompkin and Toner2007; Karimi et al. Reference Karimi, Yazdi and Ardekani2013; Martel & Toner Reference Martel and Toner2014; Gossett & Di Carlo Reference Gossett and Di Carlo2019). In the case of a deformable capsule, it is determined by the balance of the above five mechanisms, and hence it is dependent on
 $Ca$ and
 $R{e_t}$. For
 $R{e_t} \ll 1$, the maximum migration velocity due to the deformation and curvature-induced inward migration alone can be estimated from § 3.1 (e.g. figure 7) as
 ${V_m}\sim {O}({10^{ - 2}})$. In this limit, figure 16(b) gives
 ${U_D} \lt {O}({10^{ - 3}})$. Hence, in this limit,
 ${V_m} \gt {U_D}$ which results in a migration toward the inner edge. As
 $R{e_t}$ increases to
 $R{e_t}\lesssim {O}(1)$, figure 16(c) shows that
 ${U_D}\sim {O}({10^{ - 2}})$. Hence, in this range, Dean's drag, though small, can balance the effect of deformation and curvature-induced inward migration. Further, the results of § 3.1 suggest that
 ${V_m}$ increases with increasing
 $Ca$. Therefore, in the range of
 $R{e_t}\lesssim {O}(1)$, the effect of deformation and curvature-induced inward migration can dominate over the secondary flow effect for large values of
 $Ca$. Hence, in this range, a capsule with a larger
 $Ca$ can settle closer to the inner edge, and a smaller
 $Ca$ settle toward the outer edge. The equilibrium locations in this range of
 $R{e_t}$ are highly sensitive to
 $Ca$ as also seen in figure 13(a,b). Finally, in the range
 $R{e_t} \gg 1$, figure 16(c) shows that
 $({U_D}\gtrsim {O}({10^{ - 1}}))$; hence in this range Dean's drag dominates, and capsules settle closer toward the outer edge. As such, the
 $Ca$-dependence of the equilibrium location is relatively weak in this limit as also seen in the figure.
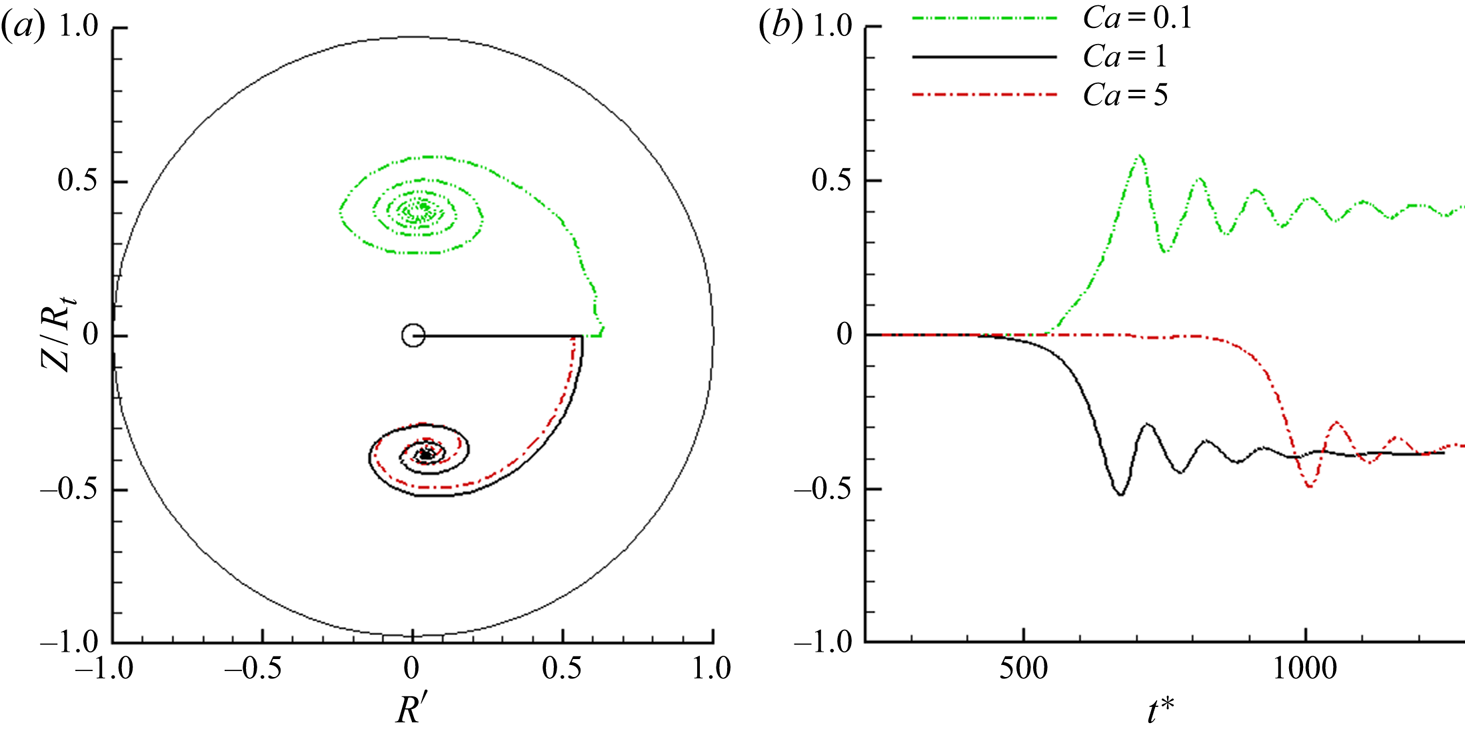
The equilibrium locations at finite inertia as presented so far, and located on the symmetry plane of the torus, may, however, be unstable equilibria. If simulations are continued for a long time, capsules may start migrating out of the symmetry plane. This is shown in figure 17 where trajectories are presented for  $R{e_t} = 20$, and
 $Ca = 0.1,\, 1,\, 5$. Capsules are initially released at the symmetry plane. All of them first migrate toward the outer edge of the torus and reach unstable equilibria. Over a longer time, they move out of the symmetry plane and set on a spiralling motion toward the centres of Dean's vortices. Eventually they settle near the vortex centres. The direction of capsule motion follows that of the secondary flow.
Migration of capsules out of the symmetry plane at finite inertia. Capsules are released at the symmetry plane and at the centreline of the torus  $(R^{\prime} = 0,\, Z = 0)$. Here
 $R{e_t} = 20$, and
 $Ca$ is varied as
 $0.1,1$ and
 $5$. (a) Trajectories on cross-section plane are shown. Initial capsule location is marked by ‘o’. (b) Plot of Z versus
 ${t^\ast }$.

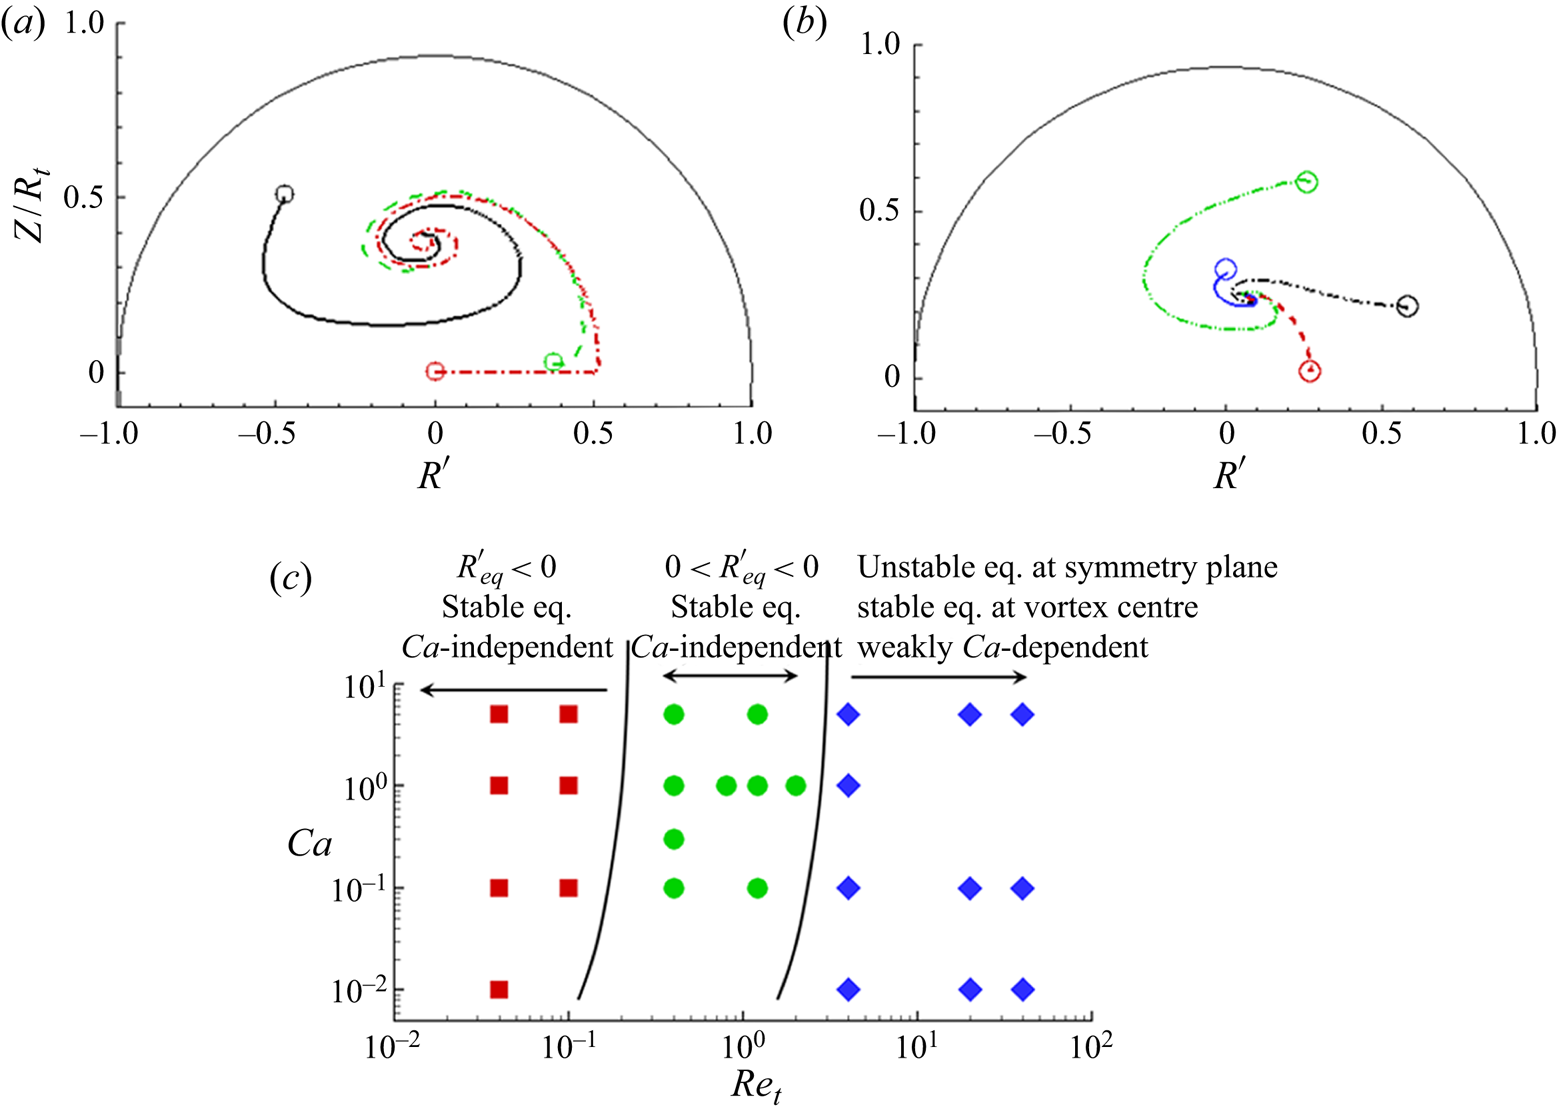
Multiple simulations were performed at  $R{e_t} \gt 1$ by releasing the capsules at different off-symmetry plane locations. Figure 18 shows the trajectories in the cross-sectional plane for
 $R{e_t} = 4$ and varying
 $Ca$. As shown here, all cases migrate toward the vortex centre. This is also in stark contrast to small inertia cases as noted in figure 11 where capsules released at different off-plane initial locations migrate toward the symmetry plane. Therefore, the symmetry plane is the stable equilibrium at small inertia; but at finite inertia the stable equilibrium can move toward the centres of Dean's vortex.
Migration of capsules towards the vortex centre from different initial locations, with  $R{e_t} = 4$: (a)
 $Ca = 0.1$; (b)
 $Ca = 5$. Initial locations are marked by ‘o’. Different colours and line patterns are used to indicate different initial release locations. (c) State diagram summarising capsule behaviour in the torus.

Whether a capsule that is initially released on the symmetry plane will move out of this plane depends on the location of the unstable equilibrium. The secondary flow as seen in figure 16(a) is a converging-type flow near the inner edge of the torus. If the capsule migrates to  $R^{\prime} \lt 0$, this converging flow makes the symmetry plane a stable equilibrium. In contrast, the secondary flow near the outer edge is a diverging flow. Therefore, if the capsule moves to
 $R^{\prime} \gt 0$ this diverging flow makes the symmetry plane unstable equilibrium. For
 $R{e_t} \gg 1$, a strong secondary flow
 $({U_D}\gtrsim {O}({10^{ - 1}}))$ causes the capsule to quickly move out of the symmetry plane and reach the vortex centre. For
 $R{e_t}\sim {O}(1)$, capsule takes longer to move toward the vortex centre due to a weaker secondary flow.
Another subtle feature noted in figure 18 is that the stable equilibrium location is closer to the symmetry plane for  $Ca = 5$ than for
 $Ca = 0.1$. This is attributed to the combined effect of deformation, wall effect and inertial lift. There is no curvature and centrifugal effects in the Z direction; only deformation, wall effect and inertial lift are present. As a result, the velocity profile is symmetric in the Z direction with the zero-shear rate occurring at
 $Z = 0$. Therefore, under the influence of deformation, wall effect and inertia alone, a capsule with a higher
 $Ca$ settles closer to the symmetry plane, and a lower
 $Ca$ settles further away. Irrespective of this small difference, it is clear that the final equilibrium location at sufficient inertia is near the centre of the Dean vortex for any
 $Ca$. This is also the equilibrium position of a rigid particle that is driven by inertial lift and Dean's drag only.
Figure 18(c) shows a state diagram summarising capsule behaviour in the torus. As shown, three regimes exist: at small inertia, capsules at all Ca settle at an equilibrium that is on the symmetry plane and close to the inner surface; at sufficient inertia, capsules at all Ca eventually settle at the centre of Dean's vortex; at intermediate inertia, the equilibrium position is on the symmetry plane but dependent on Ca.
Capsule shape evolution at finite inertia is considered next. Figure 19 shows capsule shapes at different locations with respect to the fluid velocity profiles for  $R{e_t} = 4$ and 20. Interestingly, these shapes are not significantly different from those observed at small inertia when similar locations are considered (see figure 10). This suggests that inertia does not significantly affect capsule shape. However, as discussed previously, inertia results in the so-called inertial lift, which affects the migration direction. This is expected as the inertial lift is present even for a rigid sphere as discussed in § 1. Also compared in figure 19 are capsule shapes in straight tubes at the same radial locations. This comparison also leads to similar results as observed earlier in figure 10 for small inertia. Inertia seems to have only a marginal effect on the shape even for a straight tube. However, as observed in figure 10 for small inertia, here also we see that the capsule approaches a bullet shape near the centre of the straight vessel owing to the symmetry of the velocity profile, while in the torus the shape is asymmetric because of the asymmetry of the velocity profile about the centre, and due to the streamline curvature.
Comparison of migrating capsule shapes  $(Ca = 5,\, {R_c} = 5,\, {R_t} = 4)$ at finite inertia: (a)
 $R{e_t} = 4$; and (b)
 $R{e_t} = 20$. Streamwise velocity profiles are shown for each case. Capsules shapes are shown at specific locations identified by dots on the velocity profiles. Also shown are the shapes of capsules in straight tubes
 $({R_t} = 4)$ at the same radial locations. The dotted lines indicate the equilibrium position in torus.

Figure 20 considers the effect of  $Ca$ on capsule shapes at finite inertia as it approaches near the centre of Dean's vortex. As before, the
 $Ca = 5$ case shows a significant deformation with a crescent-like shape. For the most part, the capsule shape at a fixed
 $Ca$ remains nearly unchanged. For
 $Ca = 5$, a small decrease in capsule deformation is seen as it approaches near the vortex centre. This is because the velocity profile is symmetric about the Z-axis. In contrast,
 $Ca = 0.1$ barely shows any significant deformation. Interestingly, despite the large difference in shapes observed for
 $Ca = 5$ and 0.1, the equilibrium positions for both cases are near the vortex centre. This again corroborates the conclusion drawn above that at this range of inertia, the capsule trajectory and final equilibrium position are primarily dictated by Dean's flow. However, as also noted above, the final Z location for
 $Ca = 5$ is slightly closer to the symmetry plane than for
 $Ca = 0.1$. This difference can be attributed to the lift coming from the shape deformation effect, since a higher deformation would cause the capsule to migrate toward the low-shear region, which along the Z-axis is located at the symmetry plane.
Comparison of migrating capsule shapes  $({R_c} = 5,\, {R_t} = 4)$ at finite inertia but varying
 $Ca$. (a) Trajectories are shown in the cross-sectional plane for
 $Ca = 5$ (black, solid line) and 0.1 (green dashed line). (b–g) Capsule shapes for
 $Ca = 5$ at different locations along the trajectory identified by dots in (a). (h–k) Capsule shapes for
 $Ca = 5$ at different locations along the trajectory identified by dots in (a).

3.3. Capsule motion in a U-shaped tube
In this section, the effect of change in vessel curvature is considered by simulating capsule motion through a U-shaped tube (figure 1b). As in the case of a torus, we first consider  $R{e_c} = 0.01$, for which the inertial effect was shown to be negligible in § 3.1. The effect of inertia will be considered later. The length of the straight segments of the tube is taken as
 $\tilde{L} = 10a$, unless otherwise mentioned. The curved section of the vessel is of constant curvature denoted by
 $\kappa $ as defined in § 2. Attention is restricted to capsules released in the symmetry plane only, and on the centreline near the vessel inlet.
Figure 21(a) shows a sample trajectory. In the case of a straight tube, the capsule released at the centreline would simply move along the centreline. However, as seen in the figure, the capsule trajectory deviates from the centre and it moves closer to the inside edge of the bend. The deviation of the capsule trajectory from the vessel centreline in the radial direction will be denoted by  $\xi $ (scaled by capsule radius). Figure 21(b) shows
 $\xi $ versus arc length S measured along the centreline of the vessel. As shown here, the capsule moves along the centreline for the most part of the straight section of the vessel. Then, in the region marked as ‘I’ in the figure, it abruptly deviates away from the centreline. The negative value of
 $\xi $ implies that the capsule moves radially inward toward the inside edge. In region ‘II’, the rate of migration toward the inner edge slows down. Then, in region ‘III’, the capsule rapidly moves radially outward and back toward the centreline.
Motion of capsules in a U-bend at small inertia. (a) Capsule trajectory is shown by a solid line. Dash-dotted line is the vessel centreline. The deviation of the capsule trajectory from the centreline in radial direction is denoted by  $\xi $. (b) Pot of
 $\xi $ versus arc length S along the centreline is plotted for various capillary numbers. Regions I, II and III are marked and discussed in the text. Also shown is the result for a U-bend with a longer entry length. Here
 ${R_c} = 5,\, {R_t} = 4$.

Results for a range of  $Ca$ are shown in figure 21(b), and all of them show similar abrupt shifts in trajectories in regions I and III. Also shown in the figure is a comparison of the results obtained using
 $\tilde{L} = 10a$ and
 $30a$ to assess the effect of the entry length. No difference can be seen between the two cases, implying the effect of the entry length is negligible.
The reason for the abrupt trajectory shift is now explored. Regions I and III where the trajectory abruptly deviates from the vessel centreline correspond to the locations where the curvature of the vessel changes from zero to a finite value ( $\kappa = 0.8$ for cases in figure 21). This change in curvature causes a radial component in fluid velocity in these regions, even in absence of inertia. This is shown in figure 22(a). As seen here, this radial velocity component in region I is directed toward the inside edge of the vessel, while in region III it is directed toward the outer edge. This component arises because of the shifted axial velocity near region II. Note that the region II is part of a torus with a constant curvature. Therefore, similar to what was observed in § 3.1, and in agreement with Dean's solution, the axial velocity profile in region II is shifted toward the inside edge. To account for the shifted velocity profile, streamlines must rapidly bend toward the inner edge in region I and toward the outer edge in region III, leading to the observed radial velocity components. These velocity components exert a drag on the capsule resulting in the abrupt trajectory shifts in regions I and III. Since the trajectory shift is caused by fluid drag,
 $Ca$ does not have much influence in region I as was noted in figure 21(b). In contrast, in region II the capsule migration toward the inner edge follows the mechanisms discussed in § 3.1, and hence the migration rate in this region increases with increasing
 $Ca$.
(a) Radial velocity components in a U-bend near regions I and III (scaled by  ${U_0}$ as noted in § 2). Contours are shown in the symmetry plane. Positive and negative values indicate radially outward and inward velocities, respectively. (b) Axial velocity contour in region II. Velocity is shifted toward the inner edge as in Dean's solution for small inertia.

As can be further noted from figure 22(a), the magnitude of the radial velocity components in regions I and III can be significant in comparison with the axial component. Figure 23(a) shows the maximum of the radial velocity component  ${U_\xi }$ as a function of the vessel curvature. As shown here,
 ${U_\xi }$ increases with increasing
 $\kappa $ owing to more rapid changes in the curvature.
(a) Maximum radial fluid velocity magnitude in regions I and III as a function of vessel curvature. (b) Capsule radial migration velocity  ${V_\xi }$ over axial path length S for vessel curvature
 $\kappa = 0.44$ and 0.89. Results for various
 $Ca$ are shown. (c) Influence of
 $\kappa $ on radial displacement
 $\xi $ for a range of
 $Ca$ (0.1, green; 1, black; 5, red).

Figure 23(b) shows the radial migration velocity  ${V_\xi }$ of the capsule along the axial path S for
 $\kappa = 0.44$ and 0.89. Regions I–III are marked in the figure. Magnitude of
 ${V_\xi }$ reaches its peak value near
 $S = 10$ and 40, which correspond to the locations of curvature change (regions I and III). The peak magnitude of
 ${V_\xi }$ which is
 ${\sim }{O}({10^{ - 1}})$, is close to that of
 ${U_\xi }$ implying that the capsule in regions I and III are driven by the radial fluid velocity. This can be further seen in figure 23(c) where the radial displacement
 $\xi $ is plotted for different values of
 $\kappa $ and
 $Ca$. With increasing
 $\kappa $ the abrupt change in
 $\xi $ in regions I and III increases significantly. This is because
 ${V_\xi }$ in regions I and III is of the order of
 ${U_\xi }$ which increases with increasing
 $\kappa $. In contrast, the rate of radial migration in region II is significantly smaller as there is no secondary flow, and the capsule is driven by the combined influence of wall, deformation and curvature.
We now consider the effect of inertia. In this condition, in addition to the radial velocity induced by the curvature change, there is also Dean's secondary flow. The radial velocity field at finite inertia is shown in figure 24(a). Similar to the case of small inertia, the curvature change in region I causes an inward radial velocity (shown by negative values in the figure). In region II, Dean's flow develops, which in the symmetry plane is directed outward. Thus, while at small inertia there is no radial flow in region II, at finite inertia there is a strong outward radial flow. Finally, in region III the curvature change causes outward radial flow, similar to the case of small inertia. Thus, the curvature change effect is present irrespective of inertia. The capsule trajectories are shown in figure 24(b) for different  $R{e_t}$. Influence of inertia is negligible at region I, where the capsule is directed toward the inner edge of the tube due to inward radial velocity. As the capsule enters in region II, the effect of inertia becomes evident. As the secondary Dean's flow is outward, the capsule is also directed outward. In addition, the secondary velocity increases with increasing
 $R{e_t}$ as discussed in the previous section. Hence, the capsule's outward deflection increases with increasing
 $R{e_t}$ in region II. The radial migration velocity of capsule is plotted in figure 24(c) which also supports this behaviour. Region III also shows inertia-dependent dynamics. At small inertia, the outward radial velocity at region III is equal and opposite to that at region I. Hence, capsules deflect outward by the same amount that they deflect inwards in region I. However, with increasing inertia, Dean's flow overpowers the radial flow at region III, resulting in reduced deflection of capsules. In conclusion, at finite inertia the trajectory is affected by both the radial flow induced by curvature change and Dean's flow.
(a) Finite inertia results for a U-shaped tube. (a) Radial fluid velocity contours  $(R{e_t} = 10)$. Negative and positive values indicate radial velocity directed toward the inner and outer side, respectively. Regions I and III correspond to the location of curvature change. Region II is where Dean's flow develops. (b) Radial displacement of the capsule for different
 $R{e_t}$ at fixed
 $Ca = 1$. Regions I–III are marked. (c) Radial migration velocity of the capsule for different
 $R{e_t}$.

4. Conclusions
Vessel curvature and change in curvature are shown to affect the cross-streamline migration of deformable capsules over a wide range of inertia. This effect arises because of the way curvature and change in curvature affect the undisturbed flow. In toroidal vessels for which the curvature is constant, the fluid velocity profile at negligible inertia is shifted toward the inner surface of the vessel, and no secondary flow exists. In this limit, the settling location of capsules is found to be between the location of the maximum fluid velocity and the innermost surface. The shear rate at this equilibrium position is non-zero. This is in stark contrast to the capsule migration in straight tubes at negligible inertia where it settles at the tube centre where the shear rate is zero. Increasing the vessel curvature results in the equilibrium position being increasingly closer to the inner surface. The deviation of the equilibrium position from the torus centreline, when scaled by the torus radius, varies linearly with curvature. Furthermore, at negligible inertia, the equilibrium position is independent of capillary number  $Ca$. The results suggest the presence of a curvature-induced cross-streamline migration that drives the capsule continuously toward the inner surface. Near the outer surface, this mechanism acts in the same direction as the wall-induced and deformation effects, thereby increasing the rate of migration. Near the inner surface, it opposes the wall and deformation effects, resulting in the equilibrium. The equilibrium locations are on the symmetry plane of the torus, and are stable equilibria when inertia is negligible.
At finite inertia, capsules released on the symmetry plane first settle at an unstable equilibrium on this plane. The equilibrium location now depends on both  $Ca$ and tube Reynolds number
 $R{e_t}$ (or, alternatively, on Dean's number). It is closer to the inner edge of the torus for smaller
 $R{e_t}$ and larger
 $Ca$, and toward the outer edge for larger
 $R{e_t}$ and smaller
 $Ca$. The similarity and distinction between the torus results and the straight tube results at finite inertia are also worth emphasising. For straight tubes, the equilibrium locations also depend on
 $Ca$ and
 $R{e_t}$; capsules settle closer to the centreline for smaller
 $R{e_t}$ and larger
 $Ca$, but away from the centreline for larger
 $R{e_t}$ and smaller
 $Ca$. Each equilibrium in straight tubes is a circle, and a capsule can settle at any location on this circle. In contrast, for a torus each equilibrium location is a unique location on the symmetry plane for a given
 $Ca$ and
 $R{e_t}$, and collectively these equilibria are spanned from the inner edge to outer edge. The
 $Ca$ and
 $R{e_t}$ dependence of the equilibrium positions in the torus arises due to the emergence of the secondary flow, which opposes the curvature-induced inward migration. The equilibrium locations on the symmetry plane may, however, be unstable equilibria. If the secondary flow is weaker, capsules migrate toward the inner edge where the secondary flow is a converging-type flow and the resulting equilibria are stable. In contrast, a stronger secondary flow drives the capsule toward the outer edge where the flow is a diverging type, rendering the equilibria unstable. For such unstable equilibria, capsules after some time depart the symmetry plane, and set on to a spiralling motion following Dean's vortex, eventually settling near the vortex centre.
The influence of change in vessel curvature is studied by considering the U-shaped vessels. A curvature change is shown to give rise to a ‘secondary’ radial velocity component. This velocity is directed toward the inner side of the vessel at a location where the curvature increases, but toward the outer side where the curvature decreases. The magnitude of this radial component is significant, and it increases with increasing vessel curvature. It causes large and rapid shifts in capsule trajectory over a short axial length. Capsules move inward where the curvature increases, but outward where the curvature decreases. The trajectory shifts increase with increasing vessel curvature.
These findings have implications and usefulness in both the microcirculation and microfluidics. In the microcirculation where inertia is small, the results suggest that highly deformable red blood cells would flow closer to the inner surface of a curved vessel. Consequently, the cell distribution would be asymmetric over any cross-section of the vessel. This can contribute to cell-plasma phase separation, and the so-called plasma skimming. This would also result in an asymmetric distribution of the cell-depleted region that develops near the wall, with a smaller thickness near the inner surface but a larger thickness near the outer surface (Balogh & Bagchi Reference Balogh and Bagchi2019). Furthermore, the asymmetric cell distribution could affect the undisturbed flow, which, in turn, can create a difference in the wall shear stress between the inner and outer edges. The endothelial cells are known to sense and respond to such stress gradients. Since the inward migration rate depends on cell deformability, a higher concentration of more rigid cells, such as white blood cells and platelets, is expected to develop toward the outer side of the vessels. Thus, the deformability-based phase separation of different cells may be further enhanced by the curvature effect (Hur et al. Reference Hur, Henderson-maclennan, Mccabe and Di Carlo2011; Henríquez Rivera et al. Reference Henríquez Rivera, Zhang and Graham2016). This can also be utilised for cell separation in microfluidic devices with curved vessels operating under non-inertial conditions. Most microfluidic applications with curved geometry, however, operate in the inertial regime to take advantage of Dean's drag for particle focusing (Di Carlo et al. Reference Di Carlo, Irimia, Tompkin and Toner2007; Bhagat et al. Reference Bhagat, Kuntaegowdanahalli and Papautsky2008; Karimi et al. Reference Karimi, Yazdi and Ardekani2013; Martel & Toner Reference Martel and Toner2014; Gossett & Di Carlo Reference Gossett and Di Carlo2019). Results in § 3.2 in the range of moderate inertia show that the benefit of using curved vessels is because the equilibrium locations are more restricted there than in straight vessels. Furthermore, these equilibria at finite inertia are highly sensitive to particle deformability, thereby raising the prospect of efficient particle focusing and sorting by the combined effects of deformability, curvature and inertia. In addition, § 3.3 suggests that rapid particle separation may be possible even in the non-inertial regime by utilising a geometry with a rapid change in curvature.
In summary, this study has shown that both curvature and curvature change affect particle migration, and their effect can be opposite depending on whether the flow regime is small inertia or finite inertia. It provides specific results on the equilibrium position of particles in curved vessels, which will be useful in microfluidics to validate experimental results, and in the microcirculation to provide insights on blood cell motion. It also provides an explanation for these novel findings.
Acknowledgements
This work was supported by a grant from the National Science Foundation (CBET 1604308).
Declaration of interests
The authors report no conflict of interest.
Supplementary material
Supplementary material is available at https://doi.org/10.1017/jfm.2020.831.