Implications
Studies that assess the effects of nutritional strategies along more than one phase of cattle production and their interactions and effects on carcass and meat characteristics are limited. The current research provides information on integration among cow–calf and stocker phases on carcass and meat characteristics. The results can help the livestock industry decide which nutritional strategy is best suited to its production system. The adoption of the adequate nutritional strategy can improve the productive indices and carcass characteristics, resulting in animals with increased muscular development and decreased slaughter age, leading to economic, environmental and social benefits.
Introduction
Meat is one of the most important foods in the world and in some countries, it is considered an essential product with very high consumption rates (Food and Agricultural Policy Research Institute, 2017). For many people around the world meat provides valuable amounts of protein, fatty acids, vitamins, minerals and other bioactive compounds. However, meat varies with respect to numerous intrinsic and extrinsic factors of the animal. These include pre- and post-slaughter technology and factors related to consumer sciences, such as sociology, acceptability, economy and marketing. Animal diet is an extrinsic factor and it is the most easily manipulated, with the most profound effects on meat composition (Guerrero et al., Reference Guerrero, Valero, Campo and Sañudo2013a). Because of the increased demand for meat, several segments of the beef industry are striving to increase product quality, efficiency and economic returns. It is well known that these variables may be determined by different growth paths during early and later stages in the life of the animals. Cattle nutrition and growth after birth have a great influence on feed intake, feed efficiency, carcass characteristics and meat quality. Furthermore, growth patterns can be affected by climate, availability and quality of the pasture, and the entire offered diet (Brito et al., Reference Brito, Julián, Manna, Campo, Montossi, Banchero, Chalkling and Lima2014). According to Dunne et al. (Reference Dunne, Monahan, Mara and Moloney2009) beef production systems depend on climatological and socioeconomic factors which frequently dictate management practices and decisions, and thus are a composite of interacting factors that influence the biology of the bovine.
The effect of the production system on meat quality has been looked at from many different points of view since it may be considered the result of multi-causal factors (Guerrero et al., Reference Guerrero, Valero, Campo and Sañudo2013a). However, scientific literature still has only a few studies that have assessed the effects of different nutritional strategies along more than one phase of production of cattle on carcass characteristics and meat quality.
Thus, the aim of the current study was to evaluate the carcass characteristics and meat quality of bulls submitted to different nutritional strategies during cow–calf and stocker phase. It was hypothesized that carcass characteristics and meat quality of bulls may be influenced by better nutritional support during both phases of production. Besides that, it was also hypothesized that certain phases would exert higher or lower influence on carcass and meat characteristics.
Material and methods
The study was approved by the Ethics Committee on Animal Use of the School of Veterinary Medicine and Animal Science of University of São Paulo, under protocol number 2833/2012.
Experimental place
The experiment was conducted in two phases of production, cow–calf and stocker phases at Figueira’s Farm (Experimental Station Hildegard Georgina Von Pritzelwitz) located at 105 Londrina, Paraná State, Brazil south with latitude of 23°34′25″S, longitude 50°58′17″W and altitude of ~560 m. According to Köppen and Geiger (Reference Köppen and Geiger1928) global climate classification, the region climate is type Cfa, being humid subtropical with an annual mean precipitation of 1626 mm and annual mean temperature of 21.1°C. Droughts may occur in the winter period (Instituto Agronômico do Paraná, 2017), as occurred during this experiment.
Animals and treatment groups
From a herd of 498 pregnant cows (6.89±0.23 years old; mean±SEM), Nellore similar calves born between November and December (wet season) 2010 were selected. The first phase (Phase I – cow–calf) began when the calves were 99.6±2.72 days old and weighed 109.7±2.99 kg. The cow–calf pair was assigned randomly into two treatment groups: (1) cow–calf mineral supplement (CM; n=40) or (2) cow–calf creep-feeding (CC; n=40). The calves from the CM group received mineral supplement (BellMais; Bellman®, Brazil) ad libitum in the same trough as the cows and the CC group received supplement (BellPeso; Bellman®, Mirassol, Brazil) ad libitum in creep-feeding system. The mineral supplement (BellMais) content for each kg was: Ca, 164 g; P, 60 g; Mg, 10 g; S, 40 g; Na, 140 g; Cu, 1010 mg; Mn, 780 mg; Zn, 3750 mg; I, 75 mg; Co, 60 mg; Se, 19 mg. The content for each kg of supplement (BellPeso) offered in creep-feeding system was: Ca, 26 g; P, 6 g; Mg, 1 g; S, 3.6 g; Na, 4 g; Cu, 35 mg; Mn, 100 mg; Zn, 128 mg; I, 2.6 mg; Co, 2.1 mg; Se, 0.7 mg; monensin, 48 mg; vitamin A, 10 000 IU; vitamin D3, 1400 IU; vitamin E, 100 IU; dry matter total, 880 g; CP, 220 g; ether extract, 1 g; NDF, 180 g; estimated total digestible nutrients, 620 g; mineral, 250 g.
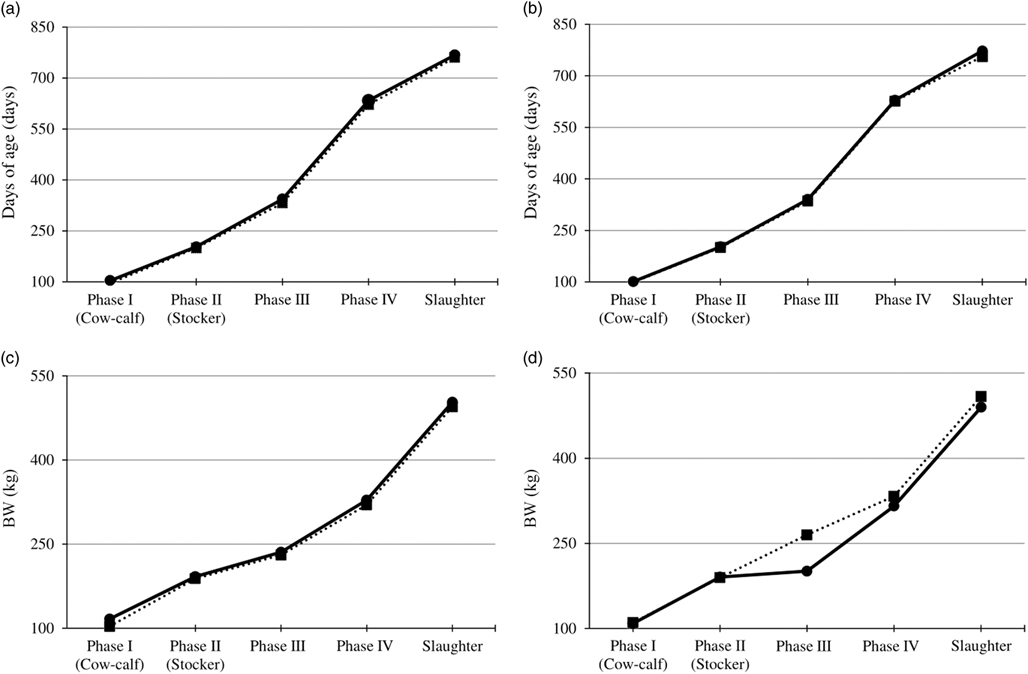
For the CM group, there were two creep systems available; which were placed inside the management centers, close to the troughs for mineral supplement and drinkers. In each creeper, where only calves had free access, there were two troughs of 2.63 m of length; 0.42 m of width and 0.3 m of depth. Marking, vaccination and deworming of the animals was realized according to the routine of the farm and recommendations of the local Agricultural Defense Agency. Until the end of Phase I all animals were allocated on pasture of Panicum maximum cv. Tanzania with estimated content: dry matter total, 23.3%; CP, 9.6%; ether extract, 2.6%; NDF, 72.2%; estimated total digestible nutrients, 49.1%; mineral, 9.9%. A pasture rotation between both groups was realized every 30 days to avoid the effect of pasture variation. The calves remained at these treatments (CM and CC) for 101.6±1.33 days, coinciding with weaning which occurred around 6.7±0.07 months of age. The second phase (Phase II – stocker) started after weaning (beginning of stocker phase) which occurred in June and July (dry season) 2011 when the calves were on average 201.2±2.11 days of age and 190.2±3.37 kg. A total of twenty calves from each previous group, CM and CC, were assigned randomly into another two treatment groups: (1) stocker pasture (SP; n=40) or (2) stocker feedlot (SF; n=40). Animals from the SP group were allocated on pasture receiving only mineral supplement (BellMais) and the animals from the SF group were fed seven in a feedlot system with a diet formulated for a gain of 0.7 kg/day. The pasture was composed mainly of P. maximum cv. Colonião and Brachiaria brizantha cv. Marandu. The chemical analysis of forage in the entry of Phase II was: dry matter total, 27.6%; CP, 11.2%; ether extract, 2.9%; NDF, 52.0%; mineral, 10.4%. A pasture rotation inside the SP group was realized every 30 days to avoid the effect of pasture variation. The feedlot diets were provided twice a day (0730 and 0400 h) in sufficient quantity to maintain orts among 5% and 10% of the offered. In the feedlot area, there were drinkers and 30 cm of trough line per animal. The ingredients used in the feedlot diet were (as fed basis): 63.5% of grain sorghum silage; 20.3% corn meal; 15.2% of soybean meal and 1.0% mineral supplement (BellMais) and the feed nutritive value was: dry matter, 38.5%; CP, 16.3%; ether extract, 3.6%; NDF, 57.4%; estimated total digestible nutrients, 66.5% and mineral, 1.3%. The calves remained at these treatments for 136.6±2.07 days, until November (wet season) 2011. After that, all 80 animals were allocated to a pasture system (Phase III) receiving only mineral supplement for 290 days, followed by a finishing phase in a feedlot system (Phase IV) for more 135 days. The diet and the management were the similar for both groups on pasture phase and feedlot phase. The cattle were weighted using an electronic scale (SOLO 900®; Beckhauser, Paranavaí, Paraná, Brazil) at the beginning of Phase I, Phase II, Phase III, Phase IV and also at slaughter. The average daily gain was calculated for Phase I and Phase II. Days of age and initial BW of each group (CM, CC, SP and SF) from Phase I until harvest are presented in Figure 1.
Days of age and BW of each bovines group (cow–calf mineral supplement, cow–calf creep-feeding, stocker pasture and stocker feedlot) in the beginning of Phase I (cow–calf), Phase II (stocker), pasture phase, feedlot phase and at slaughter. (a) Days of age of cow–calf groups; solid line=mineral supplement group; dotted line=creep-feeding group; (b) days of age of stocker groups; solid line=pasture group; dotted line=feedlot group; (c) initial body weight of cow–calf groups; solid line=mineral supplement group; dotted line=creep-feeding group; (d) initial body weight of stocker groups; solid line=pasture group; dotted line=feedlot group.

Slaughter and analysis
The time for slaughter was determined using visual estimation of the fat deposition at the tail head of each animal. At the end of the finishing period, cattle were shipped to a commercial abattoir at Apucarana, Paraná, Brazil, where they were slaughtered at 764.3±3.06 days of age and 499.2±3.33 kg of final BW. The animals were stunned using a pneumatic penetration pistol and were then immediately exsanguinated and the carcass and meat analyses proceeded. The left half of the carcass of each animal was identified with a plastic label. Hot carcass weight was taken, and dressing percentage was calculated by dividing the hot carcass weight by the final BW and expressed as a percentage. After a 24-h chilling period, the hydrogenionic potential (pH) was measured on longissimus thoracis muscle between the 12th and 13th ribs using a digital potentiometer (Testo 205®, Testo SE & Co. KGaA, Lenzkirch, Germany). At this moment, the carcass length and carcass width were also measured, and carcasses were classified according to conformation degree using a photographic standard, in which 1 is inferior and 5 is superior, and classified according to fatness scores, in which 1 is low fat and 5 is very fat (Comunidad Económica Europea, 1981). After, the left halves of the carcasses were cut between the 12th and 13th ribs to expose the longissimus thoracis muscle and then the longissimus muscle area, and muscle depth and fat thickness were measured (United States Department of Agriculture, 1996). The Hankins and Howe or HH section (10th, 11th and 12th ribs) was removed from the left half of the carcass and a physical separation of muscle (M), fat (F) and bone (B) was carried out. Finally, these three portions were weighed to determine their percentages in the HH section. Then, the percentages of muscle, fat and bone of the carcass were calculated according to Hankins and Howe (Reference Hankins and Howe1946) adapted by Müller et al. (Reference Müller, Maxson, Palmer and Carpenter1973) using the following formulas: muscle (%)=15.56+0.81×M; fat (%)=3.60+0.82×F; bone (%)=4.30+0.61×B. The longissimus thoracis muscle of each animal was split into sub-samples (obtained along the caudal–cranial axis) for meat quality evaluations. The first sub-sample (2 cm width) obtained was used to evaluate marbling, water holding capacity, meat color and fiber diameter. Marbling was evaluated using a marbling photographic standard, in which 1 represents no marbling and 10 represents abundant marbling (USDA, 1996). In the same sub-sample, the water holding capacity was determined by water loss caused by physical pressure (Hamm, Reference Hamm1960). Fat color was measured around the 12th rib and the meat color was evaluated in the longissimus thoracis muscle. Both measurements were performed in triplicate using a portable colorimeter (Minolta CR10, Konica Minolta, Osaka, Japan) which provides the values of L* (lightness), a* (redness) and b* (yellowness) by the CIELAB system (Commission Internationale de L’eclairage, 1978); in which L* runs from 0 (black) to 100 (white), a* runs from negative (green) to positive (red) and b* runs from negative (blue) to positive (yellow). The sub-sample for fiber diameter analysis was cut in three sub-sub-samples (1 cm3 each), placed for 24 h in Bouin solution, and washed and stored in 70% alcohol solution. The material was then dehydrated, immersed in paraffin, roughly trimmed, placed on a microscope slide and colored by hematoxylin and eosin assay. For the determination of fiber diameter, 10 fields were captured for each microscope slide and the 15 lowest diameters per field were measured, totalling 150 fibers per microscope slide. The sub-samples for shear force and meat composition were stored at the Animal Nutrition Laboratory at Universidade Estadual de Londrina after being individually packed in plastic bags and immediately frozen at −18°C pending further analyses. The second sub-sample (3 cm width) was used to determinate the meat shear force. The sub-samples were thawed at 4°C for around 24 h before cooking. After thawing, they were cooked to an internal temperature of 71°C and then chilled overnight at 4°C before coring. In all, six round cores (1.27 cm diameter) were removed parallel to the longitudinal orientation of the muscle fibers. The shearing action was perpendicular to the longitudinal orientation of the muscle fibers, using a Warner-Bratzler blade (CT3 Texture Analyzer, AMETEK Brookfield , Middleborough, MA, USA) (Wheeler et al., Reference Wheeler, Shackelford and Koohmaraie1996; American Meat Science Association, 2015). The third sub-sample (1 cm width) obtained was used to determinate the percentage of dry matter, ether extract, CP and mineral matter of the sample (Association of Official Agricultural Chemists, 1995).
Experimental design
The statistical model design used was completely randomized in a 2×2 factorial arrangement, with two treatment groups in the cow–calf phase (mineral supplement and creep-feeding) and two treatment groups in the stocker phase (pasture and feedlot). The single effects between the groups in each phase and the interactions between both phases (cow–calf v. stocker) were analyzed. The experimental unit was composed by each animal, totalling 20 experimental units for each treatment group. All statistical procedures were performed adopting 0.05 as the critical level of probability. The results were expressed as mean and were compared by Fisher’s test. The statistical analysis was performed using the R statistical software (R Development Core Team, 2015).
Results
Interactions effect
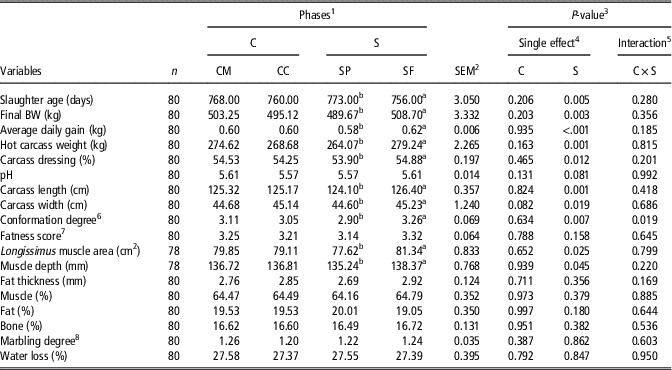
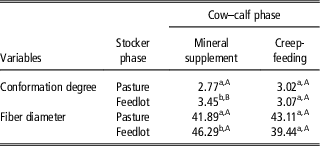
There were (P<0.05) cow–calf and stocker phase interactions; but only for conformation degree (Table 1) and fiber diameter (Table 2). For all other variables, there were no interactions (P>0.05) between phases. For carcass conformation degree and for fiber diameter the mean of mineral supplement and feedlot interaction was greater than creep-feeding and feedlot interaction (Table 3). Besides that, only for conformation degree was the mean of mineral supplement and feedlot interaction greater than mineral supplement and pasture interaction (Table 3).
Effect of different nutritional strategies during cow–calf (C, mineral supplement v. creep-feeding groups) and stocker (S, pasture v. feedlot groups) phases on performance and carcass traits of Nellore bulls

a,bFor each variable, within a row, means without a common superscript letter are significantly different.
1 CM=cow–calf mineral supplement; CC=cow–calf creep-feeding; SP=stocker pasture; SF=Stocker feedlot.
2 Standard error of the mean.
3 Significant differences at 5% probability (P⩽0.05).
4 C=main effect during cow–calf phase; S=main effect during stocker phase.
5 C×S= cow–calf×stocker phases group interaction.
6 Conformation degree=(1) inferior and (5) superior.
7 Fatness score=(1) low and (5) very fat.
8 Marbling degree=(1) no marbling and (10) abundant marbling.
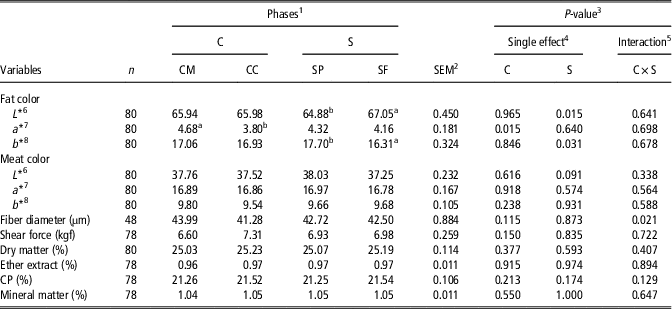
Effect of different nutritional strategies during cow–calf (C, mineral supplement v. creep-feeding groups) and stocker (S, pasture v. feedlot groups) phases on meat and fat quality parameters of Nellore bulls

a,bFor each variable, within a row, means without a common superscript letter are significantly different.
1 CM=cow–calf mineral supplement; CC=cow–calf creep-feeding; SP=stocker pasture; SF=Stocker feedlot.
2 Standard error of the mean.
3 Significant differences at 5% probability (P⩽0.05).
4 C=main effect during cow–calf phase; S=main effect during stocker phase.
5 C×S= cow–calf×stocker phases group interaction.
6 L*=zero (black) and 100 (white).
7 a*=negative (green) and positive (red).
8 b*=negative (blue) and positive (yellow).
Interaction effect with cow–calf (mineral supplement v. creep-feeding groups) by stocker (pasture v. feedlot groups) phases groups for conformation degree and fiber diameter

a,bFor each variable, within a row, means without a common superscript letter differ at P<0.05.
A,BFor each variable, within a column, means without a common superscript letter differ at P<0.05.
Performance and carcass characteristics
Data describing the single effect of different nutritional strategies during cow–calf and stocker phases on carcass characteristics of bulls is presented in Table 1. Cow–calf phase did not influence (P>0.05) any variables of carcass characteristics. On the other hand, stocker phase influenced (P<0.05) slaughter age, final BW, average daily gain, hot carcass weight, dressing percentage, carcass length, carcass width, longissimus muscle area and muscle depth (Table 1). Bulls fed in feedlot system in Phase II were slaughtered 17 days earlier, with an additional 19.0 kg (3.8%) of final BW, 15.2 kg (5.7%) of hot carcass weight, 0.04 kg (6.9%) of average daily gain and 0.98% of dressing percentage than those fed on pasture. The feedlot group also had higher carcass length (1.8%), carcass width (1.5%), longissimus muscle area (4.8%) and muscle depth (2.3%) when compared with the pasture group during Phase II (Table 1).
Meat and fat quality
Data describing the single effect of different nutritional strategies during cow–calf and stocker phases on meat and fat quality of bulls is presented in Table 2. Color fat parameters were influenced by cow–calf and stocker phases (Table 2). For fat color, feedlot group in relation to pasture group had higher L* value (67.0 v. 64.9) and lower b* value (16.3 v. 17.7). The creep-feeding group had lower a* value compared with the mineral supplement group (3.8 v. 4.7) for fat color.
Discussion
Interactions effect
As previously mentioned, a cow–calf by stocker phase interaction occurred for carcass conformation degree and fiber diameter. The results obtained for conformation degree were possibly a consequence of the result obtained for fiber diameter, because muscle mass (such as carcass conformation) is largely determined by the size of the muscle fibers (Picard et al., Reference Picard, Jurie, Duris and Renand2006). At the cellular level, muscle accretion can be defined as the increase in myofiber diameter (hypertrophy) (Bonnet et al., Reference Bonnet, Cassar-Malek, Chilliard and Picard2010).
Performance and carcass characteristics
Due to the better nutritional support received, it was expected that the creep-feeding group would have better carcass characteristics than the mineral supplement group in the cow–calf phase; however, there were no differences observed between two groups. A possible reason for do not find difference between these groups, is that probably the animals in mineral supplement group had a compensatory gain, which is a very constant feature after a period of undernutrition and restricted development, leading to reach the weight of animals whose growth was not affected (Hornick et al., Reference Hornick, Van Eenaeme, Gérard, Dufrasne and Istasse2000). However, on stocker phase the higher final BW reached in fewer days by the feedlot group, when compared with pasture group, is explained by the greater daily gain observed for the feedlot group during Phase II, which possibly is due to the fact that in feedlot the animals receive higher energy diet and lose less energy from moving because of the restricted size of the pens (Rotta et al., Reference Rotta, Prado, Prado, Valero, Visentainer and Silva2009). The higher dressing percentage for the feedlot animals (54.9%) v. pasture animals (53.9%) was expected since dressing percentage is based on the relationship between hot carcass weight and final BW, both significant different between feedlot and pasture group. Superior carcass dressing percentages for animals fed with concentrate when compared with those fed on pasture is consistently reported in the literature (Neel et al., Reference Neel, Fontenot, Clapham, Duckett, Felton, Scaglia and Bryan2007; Esterhuizen et al., Reference Esterhuizen, Groenewald, Strydom and Hugo2008; Duckett et al., Reference Duckett, Neel, Lewis, Fontenot and Clapham2013). It is known that cattle raised in a feedlot system will grow faster and produce a larger carcass than cattle raised on conventional pastures (Esterhuizen et al., Reference Esterhuizen, Groenewald, Strydom and Hugo2008) indicating that a pasture system does not meet the nutrient requirements for maximum growth and tissue accretion (Brown et al., Reference Brown, Camfield, Baublits, Pohlman, Johnson, Brown, Tabler and Sandelin2006). According to Webb and Erasmus (Reference Webb and Erasmus2013), grass feeding normally results in slower growth rates because feed supplements are usually limited to strategic mineral, energy and protein supplements. However, even if the same energy input is provided in a feedlot in comparison with equivalent animals on pasture, one should expect higher gains in the feedlot because the animals at pasture have higher maintenance expenditures due to grazing activity. According to Kaufmann et al. (Reference Kaufmann, Münger, Rérat, Junghans, Görs, Metges and Dohme-Meier2011), there is a positive correlation between energy expenditure and time eating and/or walking, confirming that the higher energy expenditure of pasture cattle is influenced by feeding behavior and greater physical activity required to forage.
In the stocker phase, as shown by the results of carcass length, carcass width, conformation degree, longissimus muscle area and muscle depth, the feedlot group had greater lean body mass than the pasture group. This may be in response to the higher final BW, because researchers have shown that body protein mass closely correlates with BW increasing linearly; whereas the mass of body fat increases quadratically with BW (Owens et al., Reference Owens, Gill, Secrist and Coleman1995). Besides that, according to Rotta et al. (Reference Rotta, Prado, Prado, Valero, Visentainer and Silva2009) the carcass conformation can be a result of its positively correlated with several characteristics that express muscle quality, such a carcass length and longissimus muscle area. Also, Rashid et al. (Reference Rashid, Huque, Sarker and Bhuiyan2015) explain that a concentrate diet is more digestible than forage, decreasing the animal maintenance requirement, leaving more nutrients for muscle growth, as can be observed in the present study for feedlot group. In agreement with the current research, evaluating the effects of post-weaning feeding strategy on live performance, carcass characteristics and meat quality, Koch et al. (Reference Koch, Bowen, Milopoulos, Lagreca and Duckett2016) also found that cattle consuming concentrate had a larger longissimus muscle area than those that consume pasture. This is further confirmed by Neel et al. (Reference Neel, Fontenot, Clapham, Duckett, Felton, Scaglia and Bryan2007) who also observed an increased longissimus muscle area in feedlot animals (79.4 cm2) than for pasture (66.2 cm2). It is possible that because the pasture group had a lower supply of nutrients they consequently accumulated a smaller protein body mass (as mentioned in the carcass data previously). According to Owens et al. (Reference Owens, Gill, Secrist and Coleman1995) longer grazing periods, and perhaps a protein shortage during backgrounding tends to lead to a slower protein growth rate during finishing. Moreover, it could be deleterious to the future performance of the animal if grazing expands the internal organs, decreases digestibility or increases maintenance requirements, as it usually happens (Owens et al., Reference Owens, Dubesk and Hansont1993).
Even assuming that the feedlot group received a higher energy content diet due to the inclusion of grains in relation to the pasture group, higher amounts of fat variables (fat score, fat thickness and fat percentage) for the first group were not observed (P>0.05). This result can be explained probably because these nutritional strategies were adopted in Phase II (around puberty) before the animals had reached the higher point of fat tissue deposition (the latest to occur; at sexual maturity) (Owens et al., Reference Owens, Dubesk and Hansont1993) and also because the feedlot diet was formulated for a low level of gain (0.7 kg/day).
Meat and fat quality
Higher L* value and lower b* value for fat color in the stocker phase indicates that fat from feedlot animals is clearer (whiter) and less yellow than fat from pasture animals. Pasture systems are associated with higher levels of antioxidants (α-tocopherol and β-carotene) (Insani et al., Reference Insani, Eyherabide, Grigioni, Sancho, Pensel and Descalzo2008), which can delay the onset of lipid oxidation, avoiding discoloration and drip losses (Suman et al., Reference Suman, Hunt, Nair and Rentfrow2014). On the other hand, probably, the clearer fat (higher L*) found for feedlot group is due to less amount of natural antioxidants, leading to lipid oxidation, discoloration and water losses, that reflects on higher L* value. Guerrero et al. (Reference Guerrero, Sañudo, Albertí, Ripoll, Campo, Olleta, Panea, Khliji and Santolaria2013b) also found a higher L* value for cattle fed a concentrated diet (72.0) than for cattle fed on pasture (69.7), showing similarity between both studies. The darker and more yellow fat observed on pasture group can be attributed also to the high concentrations of yellow pigments, identified as carotenoids, with β-carotene being the major component present in fresh pastures, responsible for causing yellow color to develop in the fat of bovines when such forages are eaten regularly (Commonwealth Scientific and Industrial Research Organisation, 1993; Dunne et al., Reference Dunne, Monahan, Mara and Moloney2009; Guerrero et al., Reference Guerrero, Sañudo, Albertí, Ripoll, Campo, Olleta, Panea, Khliji and Santolaria2013b). According to CSIRO (1993) lush green pasture may have as much as 500 ppm carotenoids in its dry matter; whereas most grains contain only a small concentration of carotenoids (usually <5 ppm dry matter). Supporting our results, Descalzo et al. (Reference Descalzo, Rossetti, Sancho, García, Biolatto, Carduza and Grigioni2008) observed that a decline of yellowness (b* parameter) is associated with a decrease on β-carotene content. Besides that, the results found for fat color (L* and b*) in the current study are in accordance with Dunne et al. (Reference Dunne, Monahan, Mara and Moloney2009) that confirm the long recognized relationship that exists between carotenoid concentration in subcutaneous adipose tissue and its yellow color. This way, it is well reported in literature that pasture-fed animals has higher b* value in subcutaneous fat, indicating more yellowness compared with fat from the grain-fed animal (Realini et al., Reference Realini, Duckett, Brito, Rizza and Mattos2004; Varela et al., Reference Varela, Oliete, Moreno, Portela, Monserrat, Carballo and Sánchez2004; Del Campo et al., Reference Del Campo, Brito, Lima, Martins, Sañudo, Julián, Hernández and Montossi2008; Guerrero et al., Reference Guerrero, Sañudo, Albertí, Ripoll, Campo, Olleta, Panea, Khliji and Santolaria2013b).
The higher a* value found in the fat for the mineral supplement group in the cow–calf phase could be because they received only the mineral supplement when on pasture; while the other group received a concentrate diet in the creep-feeding system plus pasture. It is possible that the last group ate less pasture and consequently, due to the lower consumption of antioxidants found on pasture diets, had fewer pigments and more discoloration (Insani et al., Reference Insani, Eyherabide, Grigioni, Sancho, Pensel and Descalzo2008; Suman et al., Reference Suman, Hunt, Nair and Rentfrow2014). Probably, the lack of differences for fat color (L* and b* values) between groups in the cow–calf (CM v. CF) phase (Table 2) may be due to the composition of the diets offered in this phase, which were not that different from the diet fed in the stocker phase, between the pasture and the feedlot groups.
With the data collected it was shown that the stocker phase, when compared with the cow–calf phase, exerted the greatest influence on carcass characteristics, possibly due to a higher difference in feed composition between the treatments in this phase. Bulls in the feedlot during the stocker phase had greater growth and muscle development compared with those on pasture, showing that keeping animals in a feedlot diet during the stocker phase may be an alternative method to obtain heavier animals at slaughter with greater muscle development in their carcasses.
Acknowledgement
The authors acknowledge the experimental support of Escola Superior de Agricultura ‘Luiz de Queiroz’ – USP and Fazenda Figueira. The first author gratefully acknowledges the International Program CAPES (Brazilian Federal Agency) for the receipt of sandwich doctorate scholarship, developed at UC Davis University, CA, USA.
Declaration of interest
The authors declare that there is no conflict of interest in this article.
Ethics statement
All institutional and national guidelines for the care and use of animals were followed.
Software and data repository resources
None of the data were deposited in an official repository.