1 Introduction
In Reference Kohn, Corrigan and Donaldson2000, an Institute of Medicine (IOM) report, To Err Is Human, concluded that between 44,000 and 98,000 deaths occur annually in U.S. hospitals from preventable medical errors, including medication errors. The report identified medication errors as the most common type of error in health care. A correct medication event should involve the right drug, in the right dose, via the right route of administration, given to the right patient at the right time. A failure of one or more of these five “rights” could lead to adverse reactions, possibly including the patient’s death. In response to the report, health care policy makers and professionals proposed many reforms and new practices to reduce errors, including accreditation, enhanced reporting, workforce training, and health information technology. The proposed technology that directly affected safety was the use of bar codes to administer drugs to patients.
While barcoding technology has its applications in inventory and supply chain management, bar code medication administration is an application of health information technology designed to prevent medication errors that occur during the dispensing and administration stages. This technology, also known as bedside bar code administration, is a system in which before administering medication healthcare professionals use handheld devices to scan machine-readable bar codes on a patient’s identification bracelet and on a drug label to electronically verify against a patient’s electronic medication record that the correct medication is being given.
Despite its potential to improve the quality of care, adoption of bar code technology was slower than anticipated. As with other types of health information technology, bar code medication administration requires investments in equipment, infrastructure, and training. Specifically, a bar code medication administration system requires bar code printers, personal digital assistants, wireless computing server technology, and software. In addition, it also requires that drug packages be labeled with a machine-readable bar code bearing identifying information.
In support of initiatives to encourage adoption of bar code medication administration as a means of reducing the number of medication administration errors, the Food and Drug Administration (FDA) issued a final regulation in 2004 that requires pharmaceutical manufacturers to place linear bar codes on certain human drug and biological products (Federal Register, 2004). Linear bar codes were required no later than 60 days after approval or April 26, 2006 – whichever was later – to appear on commercial product packages and unit-dose blister packages sold to hospitals and to contain the drug’s National Drug Code (NDC) number, which represents the product’s identifying information. By requiring commercial drug product packages and unit-dose blister packages to carry linear bar code labels, FDA anticipated that the rule would stimulate widespread voluntary adoption of bar code medication administration technology among hospitals and other facilities, thereby generating public health benefits in the form of averted medication errors.
FDA estimated the benefits and costs of its bar code requirement before issuing the rule; the key to the prospective estimate of the effects of the bar code rule was its forecast of the adoption of bar code medication administration in response to the rule. The rule requires drug labels to have bar codes but does not require hospitals to use them to administer drugs, so much of the rule’s estimated benefits and costs depended on how much the rule would influence hospital investments in barcoding technology. In the years that have elapsed since the bar code rule became final, bar code technology uptake was slower than FDA predicted in 2004. For example, the regulatory impact analysis (RIA) predicted over 50% adoption by 2008 and over 90% adoption by 2010; however, survey data revealed these thresholds were not met until 2011 and 2015 (Pedersen, Schneider & Schekelhoff, Reference Pedersen, Schneider and Schekelhoff2012 and Reference Pedersen, Schneider and Schekelhoff2016). In this retrospective analysis, we recalculate the costs and benefits of the rule in light of the new data on adoption and use of bar code medication administration. We estimate that the slower adoption rate would reduce the estimated net benefits from $5.3 billion in the 2004 RIA to $2.7 billion.
In addition to using FDA’s ex ante baseline, we consider alternative baselines for uptake without the rule to reassess the rule’s costs and benefits. We also review and update key inputs in light of more recently available published estimates, with a focus on developing plausible bounds on the estimated impact of the rule on hospital adoption of bar code medication administration.
While new health care technologies may lead to improved outcomes, they may also increase costs. The original benefit-cost analysis (BCA) attempted to include all the benefits and costs but some costs and benefits were missed. Including all the benefits and costs matters because in predicting the impact on adoption, it is important to recognize that hospitals will only adopt the technology if it is profitable from their perspective; that is, if the revenues exceed the costs of adoption, adoption will occur. Key to estimating the effect of the rule on technology adoption is to consider the mechanisms through which the rule would change either side of that equation. This exercise is challenging because the profitability of bar code medication administration is highly variable and heterogeneous across hospitals, with potentially fewer gains for smaller hospitals.
Because the rule requires manufacturers to place bar codes on the unit-dose packages, a direct effect of the rule is to reduce the overall cost of adoption from the hospital perspective. However, the labeling costs from the hospital’s perspective associated with bar code medication administration adoption are small compared with the overall potential start-up and ongoing costs of capital and labor. Additionally, as noted by Barlas (Reference Barlas2012), “[a]lmost every hospital in the U.S. has a drug-repackaging operation, either in-house or in a separate location, or it contracts with an outside repackager.” So, cost savings likely only explain a small portion of the adoption rate. Furthermore, hospitals may have borne some or all of the costs for updating labeling from manufacturers in the form of higher prices. While our estimates of the total cost would remain the same, there may be distributional effects associated with cost pass-through that we have not explored.
Another potential mechanism through which it may affect technology adoption decisions is that the rule specifies the bar code must be in linear format. There are potential cost savings associated with a national standardized format and coding for drugs. This uniformity also likely reduced hospitals’ uncertainty over the range of possible industry standards that could have arisen without the Bar Code Rule, such as alternative symbols on the labels. The rule made it safer to invest in technology systems with linear bar code scanners.
Given limitations in the available data, the focus of this retrospective BCA will be to reassess a key input – the impact of the rule on hospital adoption of bar code medication administration. While we have data on actual adoption of bar code medication administration following implementation of the rule, it is still difficult to determine the counterfactual adoption rate. Even from a retrospective standpoint, the challenge remains in isolating the effect of the rule on adoption rates from numerous confounders that may have contributed to the adoption. For example, hospital bar code systems are now frequently bundled with other technology including electronic health records. Changes in reimbursement rates for hospitals that utilize bar code technology may also have contributed to widespread adoption. We therefore explore a variety of counterfactual scenarios and discuss the assumptions and findings for each. Despite the empirical challenges with isolating the effect of the bar code rule when there are likely many other initiatives encouraging adoption of the technology occurring in parallel, it is instructive to evaluate the effectiveness of a policy after implementation as part of the regulatory review process.
2 FDA’s prospective regulatory impact analysis
In 2004, FDA estimated the regulation’s effect on pharmaceutical and biologics manufacturers, hospitals, and patients. Because the final regulation required manufacturers to add linear bar codes to commercial product packages that lacked them and to the unit-dose blister packages sold to hospitals, manufacturers were estimated to incur costs ranging from five hundred to several thousand dollars per stock-keeping unit (SKU) to revise artwork, discard old label inventory and perform other compliance-related actions. Based on a report by ERG (2003), FDA estimated the total cost to manufacturers to be $48.0 million upfront and $630,000 per subsequent year (in 2004 dollars), which would be $59.1 million and $775,977 in 2015 dollars (all inflation calculations apply values from the Bureau of Economic Analysis, 2016).
The 2004 Bar Code Rule does not require that hospitals use bar codes on drug labels; however, FDA expected the bar code requirement to lead to changes in medication administration in hospitals and other health care facilities. Indeed, the principal purpose of the required labeling was to encourage use of bar code readers by requiring bar codes on labels. The largest costs of the rule, as well as its public health benefits, were therefore associated with new adoptions of bar code technology to administer medicines. Specifically, hospitals implementing bar code medication administration would need to purchase personal digital assistants with scanners for use by nurses and would also need to install wireless server computer technology throughout their facilities; they would also experience substantial nursing productivity losses, at least in the short run, as learning the new technology takes time. FDA estimated that a typical hospital adopting the technology would incur an initial cost of $448,000 (or $552,000 in 2015 dollars). Additionally, adopters would face annually recurring costs of $556,000 (or $685,000 in 2015 dollars), which captures operating and maintenance expenses, as well as productivity losses. These hospital costs could be partly offset by efficiency improvements, such as those generated by the automatic creation of medication administration records. However, the costs of acquiring bedside bar code scanners far outstripped the direct savings from reduced unit-dose labeling. ERG (2003) estimated these savings at about $11 million, or about $3,000 per hospital in 2015 dollars.
Meanwhile, any rule-induced adoption of bar code medication administration would have improved health care outcomes by reducing adverse drug events (ADEs) and acute hemolytic transfusion reactions (AHTRs) associated with medication errors and transfusion errors in hospitals. The 2004 Final Regulatory Impact Analysis (FRIA) included an estimate of the value of the resulting life years saved and pain and disability avoided. To summarize the 2004 FRIA’s estimates, the rule was expected to result in 501,294 fewer ADEs and 693 fewer AHTRs over a 20-year period, with a weighted average value per avoided ADE of $185,800 and AHTR of $103,500 ($221,727 and $119,832 in 2015 dollars, respectively). These valuations explicitly relied on a Value of Statistical Life of $5 million (or $6.2 million in 2015 dollars).Footnote 1 The annualized value of these improvements to public health over the implementation period was estimated at $4.9 billion using a 3% discount rate or $5.2 billion using a 7% discount rate, both reported in 2004 dollars. In 2015 dollars, this amounts to $6.0 billion and $6.4 billion under the two discount-rate scenarios.
In summary, the FDA projected that bar code medication administration would diffuse to 100% of U.S. hospitals within ten years in the presence of the rule, as opposed to 100% diffusion over twenty years in the absence of the rule. This acceleration of adoption would generate both benefits and costs in the intervening years, with annualized net benefits to society totaling $4.3 billion (with a 3% discount rate) or $4.5 billion (with a 7% discount rate), both reported in 2004 dollars. These net benefits are approximately $5.3 billion and $5.5 billion in 2015 dollars. Note that the bulk of the cost and benefit estimates described above depended not on manufacturer’s direct adherence to the bar code rule but on the effect of the rule on hospital technology adoption.
3 The impact of the bar code rule on bar code technology adoption
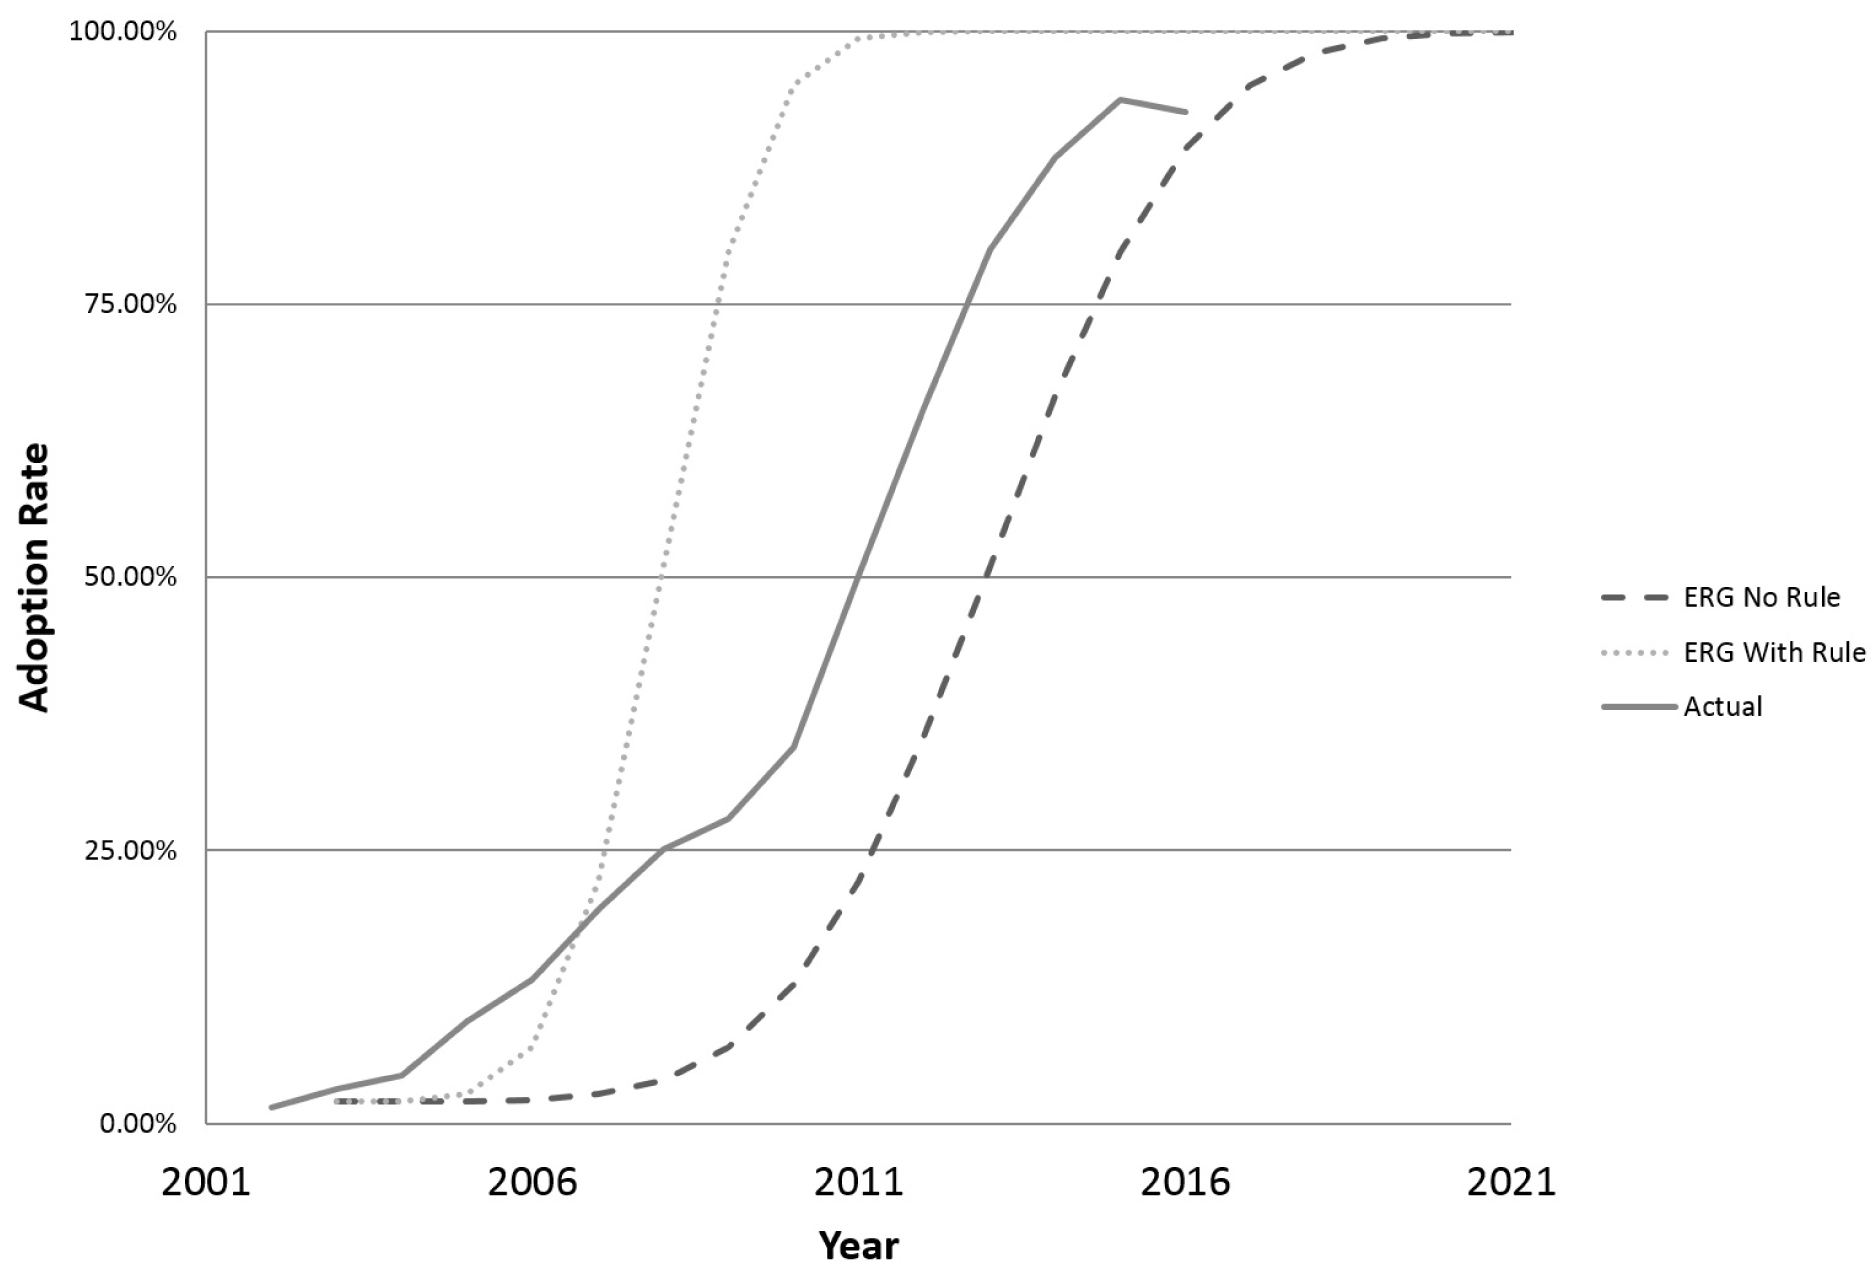
As described earlier, one of the key parameters affecting the cost and benefit calculation in the original regulatory impact analysis is hospitals’ voluntary adoption rate of bar code medication administration. The ability of bar codes to reduce medication errors depends on the ability of hospitals to scan and use the bar codes. At the time the RIA was drafted, FDA was tasked with determining a baseline adoption rate without the bar code rule and an adoption rate under the rule. The forecasts that the FDA used the in the 2004 prospective analysis (Federal Register, 2004) and the actual historical experience are depicted in Figure 1. The line labeled “Actual” reflects data from ASHP’s National Survey of Pharmacy Practice in Hospital Settings (Pedersen et al., Reference Pedersen, Schneider and Santell2001–Reference Pedersen, Schneider and Schekelhoff2017), with responses from hundreds of hospitals. The original forecast and baseline are labeled “ERG No Rule” and “ERG With Rule,” since the FDA forecasts relied on a study prepared by Eastern Research Group, Inc. (ERG, 2003). The original FDA analysis, this retrospective, and the ASHP survey data all exclude federal hospitals.Footnote 2
Adoption rate forecasts.

Note that the data show that, beginning in 2007, bar code medication administration adoption occurred more slowly than the with-rule forecast beginning in 2007. A second observation from Figure 1 is that, while adoption occurred slower than expected under the rule, bar code medication administration adoption has exceeded the “without-rule” baseline. In other words, the original projections were in retrospect overly optimistic. As a direct consequence, the predicted costs and benefits of the rule estimated in the original RIA are both overstated, even if all bar code adoption above the baseline can be attributed to the rule.
Of course, multiple factors beyond the 2004 rule influenced the adoption of bar codes, including the adoption of technology and the potential bundling of bar codes with other electronic health care technology. The bar code rule could have represented the tipping point that led to adoption, but was not the stand-alone explanation.
Although the FDA clearly overestimated the overall hospital adoption of bar code technology, there is more to investigate. If the original counterfactual adoption forecast was correct, then we can conclude the FDA overestimated the incremental effect of the FDA’s bar code rule. Another possibility is that the FDA got the original counterfactual wrong. If the incremental effect of the bar code rule was estimated correctly relative to an incorrect baseline, then the final forecasted adoption rate would also be incorrect. Baselines always matter, especially when they are dynamic, as is the case for technology adoption. The uncertainty respecting the counterfactual adoption rate means that, although we can estimate the benefits and costs of the adoption since 2004, we are unable to estimate the incremental effects of the bar code rule since the net effect depends on an uncertain baseline. In this retrospective analysis, we therefore explore alternative baselines and their implication for the benefits and costs of the bar code rule.
4 Counterfactual bar code adoption rates without the rule
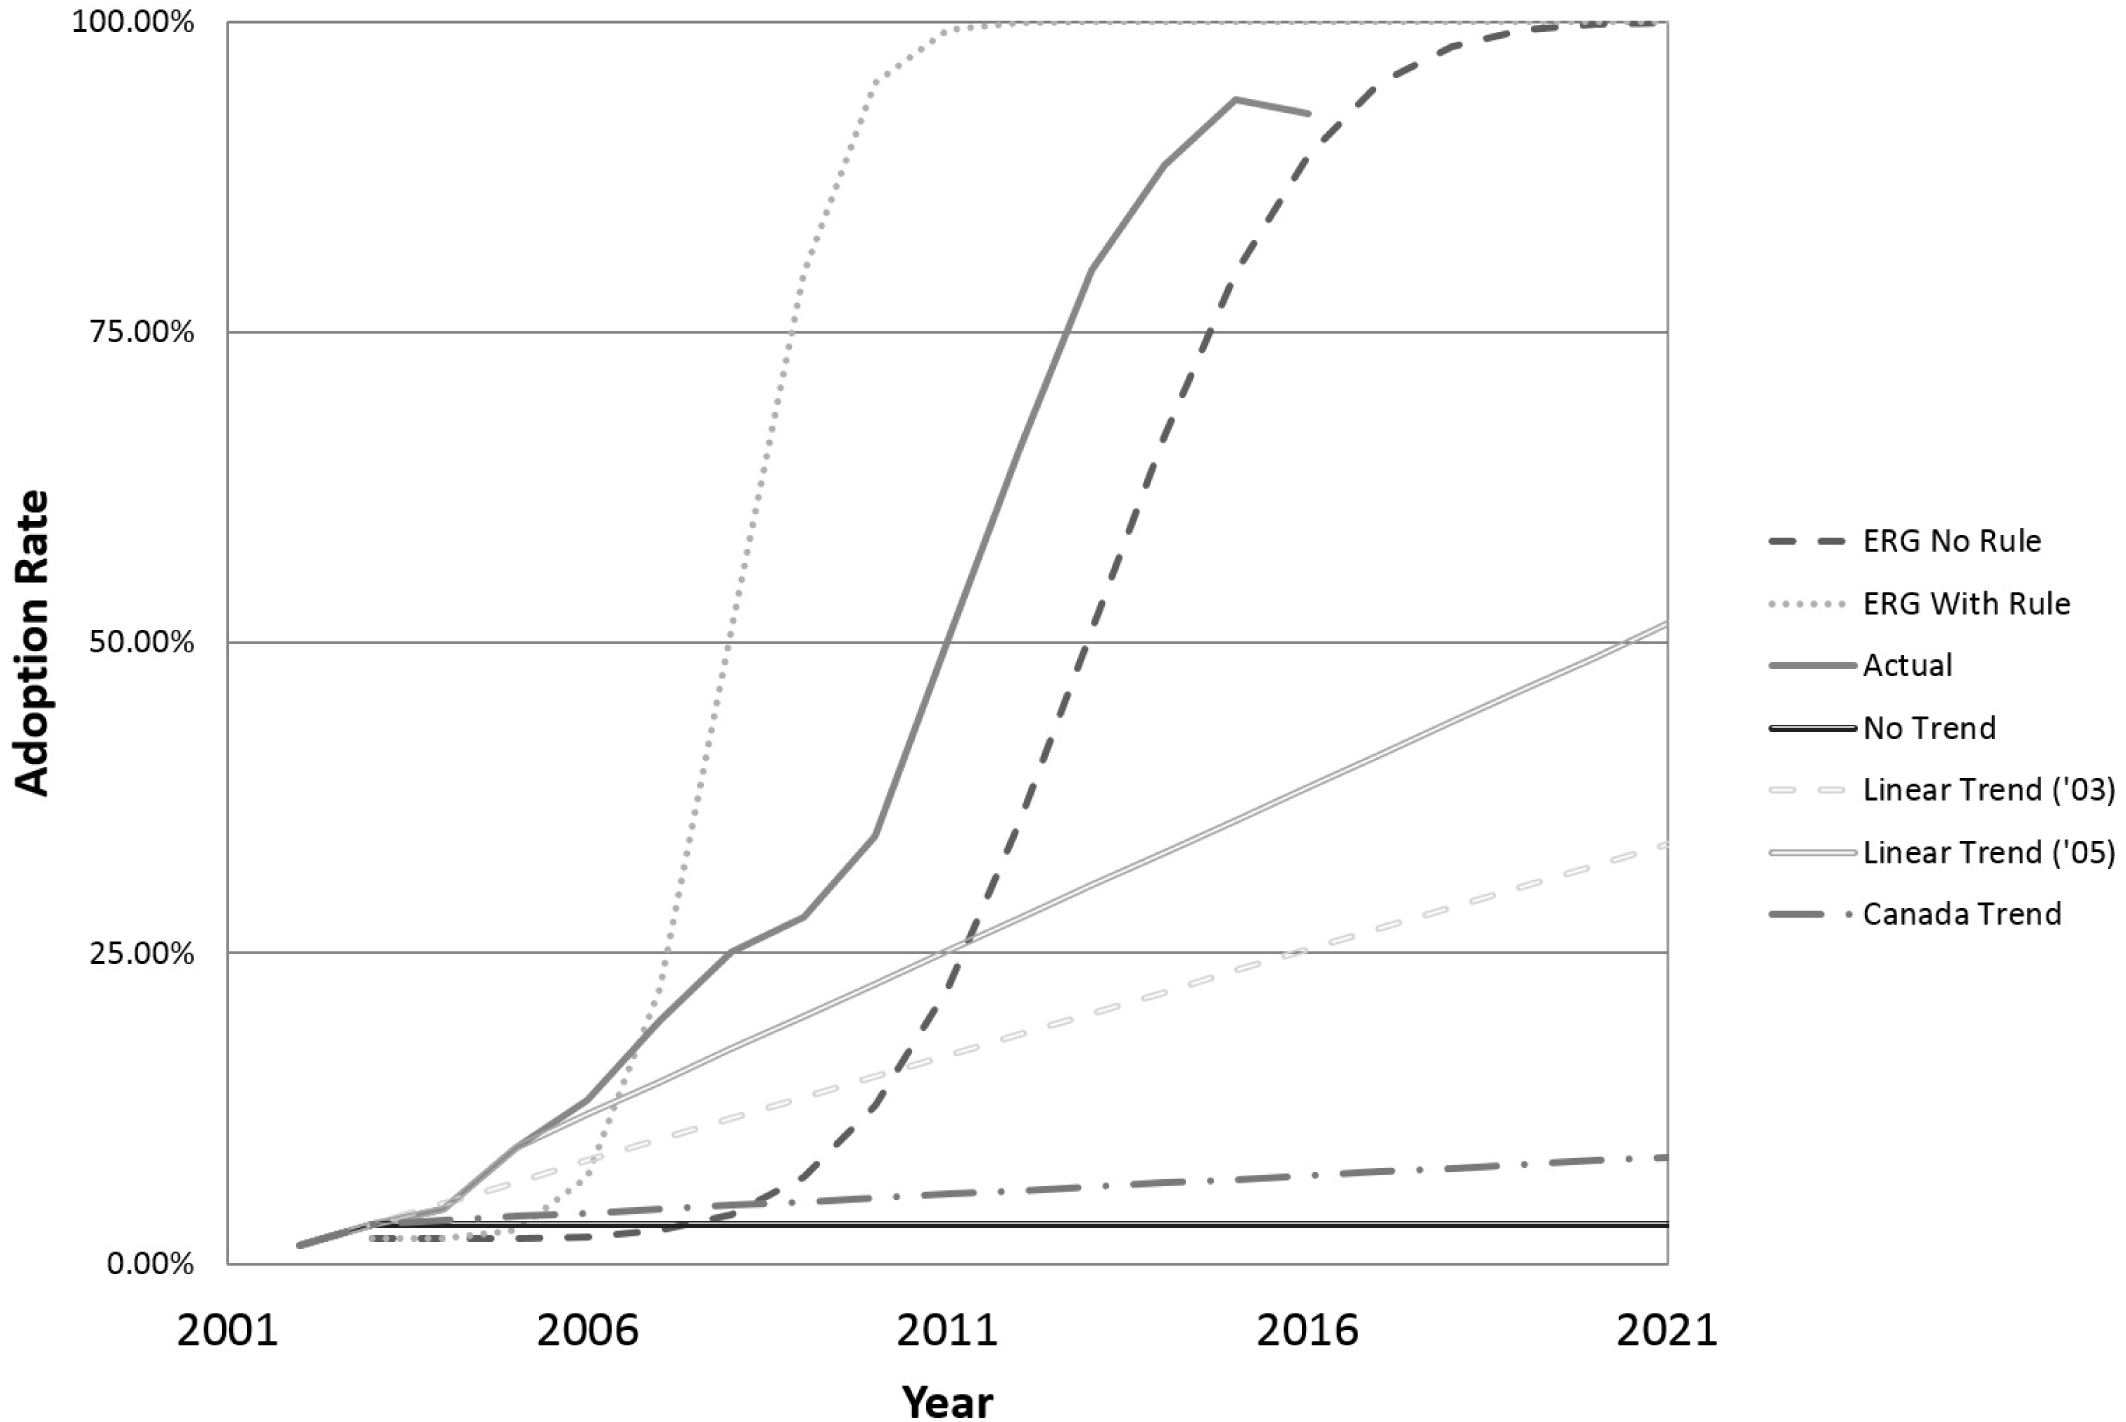
It is impossible to observe the counterfactual bar code adoption rate, or how adoption would have occurred without the 2004 Bar Code Rule. Therefore, in addition to recalculating the costs and benefits of the rule using actual adoption rate data and the original baseline forecast, this retrospective analysis also considers alternative counterfactuals as a way of bounding and creating benchmarks for the potential effects of the rule. We chose counterfactual baselines based on plausibility and the availability of data. Specifically, we consider the following scenarios:
(1) No Trend. At the time the prospective BCA was drafted, FDA had access to two years of data for hospital utilization of bar code technology. If the FDA had assumed that all hospitals had already made their adoption decision, the 2003 rate of 3.20% would have continued forever. Analysts often confuse the status quo for the appropriate regulatory baseline; however, since there was clear evidence that hospitals were adopting bar code technology without a rule, this forecast would have overstated the adoption attributable to the rule and yielded misleading results. This counterfactual scenario and cost-benefit calculations can also be interpreted as the net benefit of all hospital adoption of bar code technology since 2004.
(2) Linear Trend using data through 2003. A more plausible alternative baseline would assume that the annual increase in adoption would continue at the same pace as it did from 2002 to 2003, based on the data FDA had available at the time of the RIA. Under this scenario, an additional 1.70% of hospitals adopt the technology every year, leading to universal adoption by 2060.
(3) Linear Trend using data through 2005. This scenario captures a counterfactual in which the FDA relied on a linear trend, but updated the baseline forecast with data available at the time the rule went into effect. Under this scenario, an additional 2.63% of hospitals would have adopted the technology every year, resulting in universal adoption by 2040.
(4) Canada Trend. We also considered the experience of other countries. We looked at Canada, which has no comparable bar code requirement, which means that hospitals in Canada interested in applying bar code technology would be responsible for repackaging individual units with a bar code to make use of scanners, or pay an external repackager for this service. We chose Canada because they have made significant investments in related health information technology, such as electronic medical records (54% of hospitals in 2013–2014) (Hall & Wilgosh, Reference Hall and Wilgosh2015), and because data are available.Footnote 3
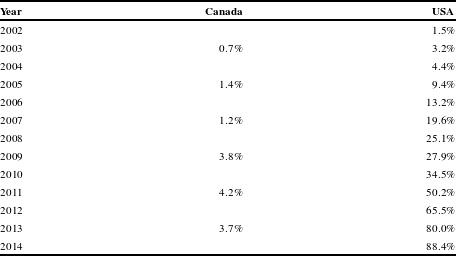
This alternative baseline assumes that U.S. adoption would proceed at the same rate as Canada, which had 0.7% overall adoption in 2003 and 3.7% adoption in 2013, a trend of 0.3% additional hospitals adopting per year (data on Canada’s adoption rate can be found in Table A1 in the Appendix). Under this scenario, we implicitly assume that bar code technology has yet to substantially penetrate the Canadian health sector primarily due to the absence of a similar bar code standard. If U.S. adoption had followed the same path as Canada, it would have been expected to fully adopt the technology in 2326.
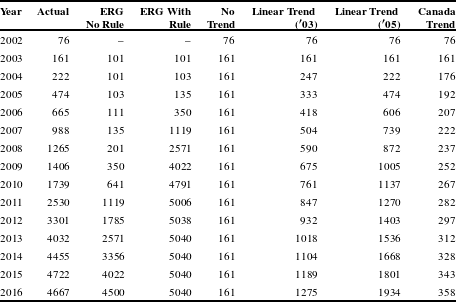
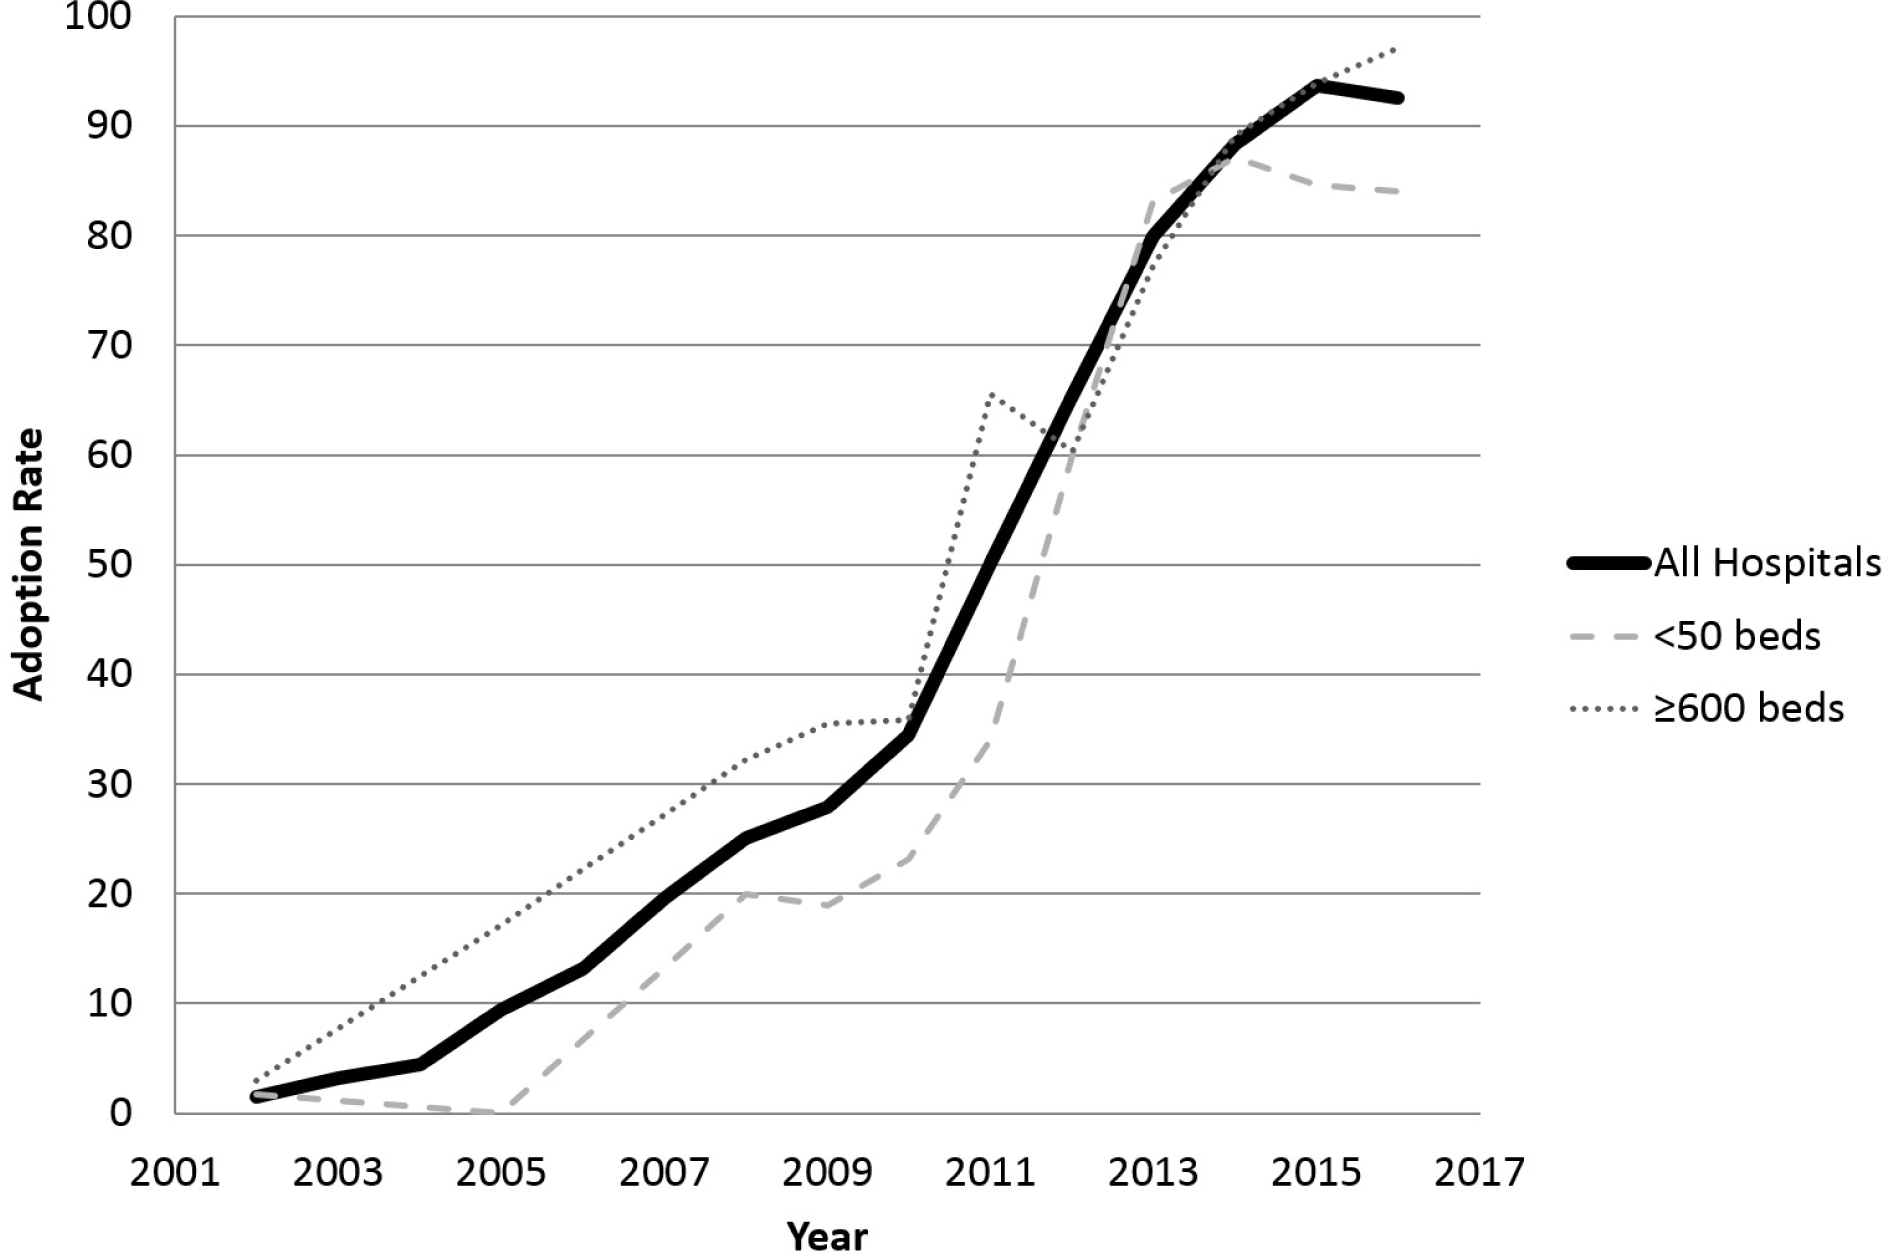
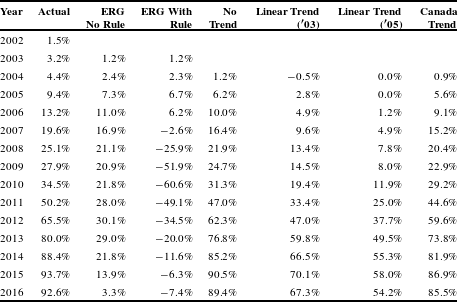
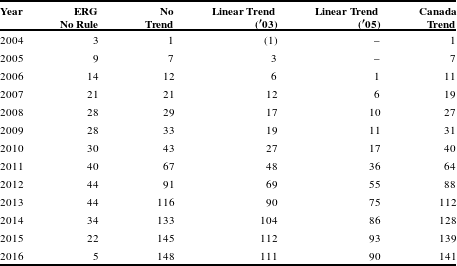
Table 1 presents our estimates of the number of hospitals adopting bar code technology. This analysis focuses on how the rate of the adoption of bar code technology affects our understanding of the costs and benefits of the Bar Code Rule. To allow for a more direct comparison with the 2004 RIA, we hold several other factors constant. For example, in the table below, 5,040 hospitals adopting the technology corresponds to a 100% adoption rate among the 2004 RIA’s estimate of 5,040 total hospitals. The column labeled “Actual” comes from annual survey results of hospital adoption rate reported by Pedersen et al. (Reference Pedersen, Schneider and Santell2001–Reference Pedersen, Schneider and Schekelhoff2017) multiplied by the total number of hospitals. As before, the original forecast and baseline are labeled “ERG No Rule” and “ERG With Rule,” since the FDA forecasts relied on a study prepared by Eastern Research Group, Inc. (2003). Figure 2 presents these adoption rates and forecasts visually, while Figure 3 breaks down adoption rates by hospital size.
Alternative baseline adoption rates.

Number of hospitals adopting bar code technology and alternative baseline forecasts.

Table 2 presents a comparison of the real-world bar code medication administration adoption rate with the various forecasts and baselines. The entries in this table can be interpreted as the net effect of the rule relative to the alternative baselines, a critical figure in calculating costs and benefits. Higher percentages represent the share of hospitals that have adopted the technology faster than they would have without the 2004 Bar Code Rule. The original “No Rule” baseline and “With Rule” forecasts are included for comparison. As an example, in 2008, this chart reads that 25.1% of hospitals had adopted bar code medication administration, which was 21.1% points higher than the FDA anticipated would adopt the technology without the rule, but 25.9% points lower than the FDA predicted would adopt the technology under the rule. Note that, beginning in 2007, the real-world experience fell short of the original forecast, although this gap has shrunk over time.
Adoption by hospital size.

Actual bar code technology adoption rate and net adoption rate relative to alternative baselines.

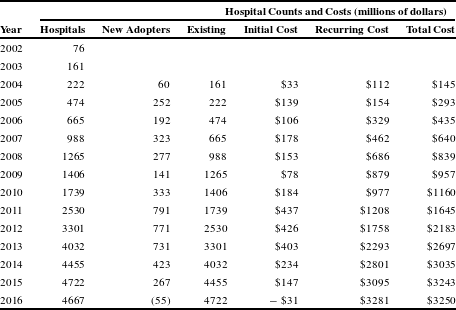
Hospital adoption and costs of adoption.

5 Recalculation of costs and benefits
5.1 Costs
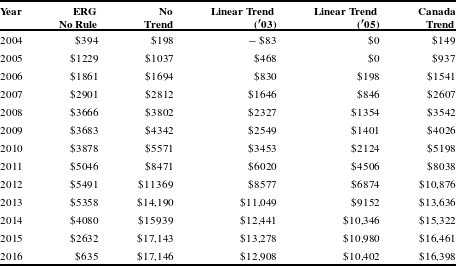
We can use the alternative hospital adoption rate baselines described and presented in Section 4 to retrospectively calculate the costs and benefits of the rule. To do so, we first describe the costs hospitals adopting the technology faced to adopt and maintain bar code systems. Table 3 presents the actual number of hospitals adopting bar code medication administration (Pedersen et al., Reference Pedersen, Schneider and Santell2001–Reference Pedersen, Schneider and Schekelhoff2017) in each year. New adopters, calculated as the current year’s adopters minus the previous year’s adopters, incur an initial cost in the first year. We rely on the 2004 RIA’s estimate that a typical hospital adopting the technology would incur an initial cost of $448,000 (or $552,000 in 2015 dollars). These costs account for the installation of scanners, readers, software, and initial training. In subsequent years, adopters face an annual recurring cost of $556,000 (or $685,000 in 2015 dollars), which captures operating and maintenance expenses. These expenses also include an estimated 3% reduction in nursing productivity after implementing a bar code system, though the 2004 RIA discusses the uncertainty around this figure. To give an example calculation, in 2004, 222 hospitals had adopted bar code technology, which amounted to an increase of 60 hospitals from 2003. Each hospital incurred about $552,000 in initial costs, for an aggregate cost of $33 million. The existing 161 hospitals each incurred $685,000 in operating and maintenance costs, which aggregates to $112 million. These costs sum to $145 million in 2004. Figures reported in the table below are presented in 2015 dollars.
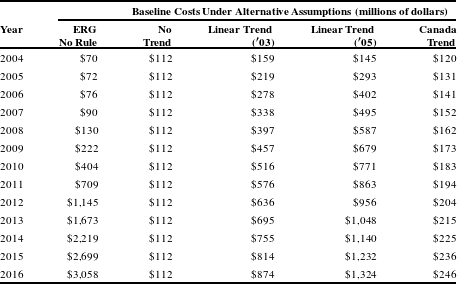
We also present similar calculations for each of the alternative baselines described above. Table 4 reports the total costs for each of the baseline estimates. Note that the “ERG No Rule” and “Linear Trend (
 $^{\prime }$
05)” tend to have higher total costs, which directly reflects that these baselines predicted faster technology adoption than other baseline assumptions.
Costs under alternative baselines.

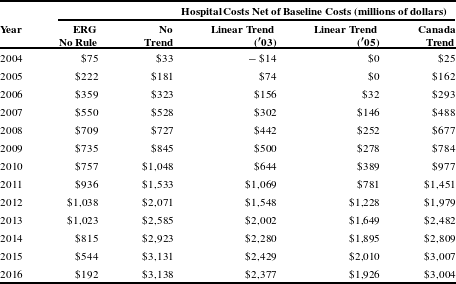
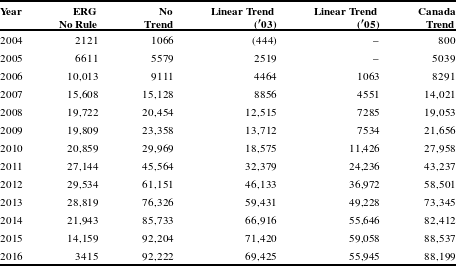
Finally, in Table 5, we subtract the figures presented in Table 4 from the total costs presented in Table 3 to yield the hospital costs attributable to the rule. These are the costs of hospitals actually adopting the technology minus the various forecasts of the baseline adoption rates that would have occurred without the Bar Code Rule.
Costs attributable to the rule under alternative baselines.

5.2 Benefits
We also reconsider the benefits that accrued from the Bar Code Rule by comparing the benefits expected from the actual hospital adoption rate to the alternative baseline scenarios. These benefits are derived from reductions in ADEs and AHTRs avoided due to bar code technology.
The 2004 FRIA indicated that 1.25 million ADEs occur each year in the United States, of which 373,000 are preventable. In the RIA, FDA assumed that bar code system use would produce no reduction in prescribing and transcribing errors, but that its use would intercept one half of the 45.1% of all preventable ADEs that now originate in the dispensing and administration stages of the medication process.Footnote
4
Thus, if all hospitals adopted bar code systems, the number of preventable ADEs would fall by 22.6% (
 $45.1\times 0.5$
), which would have prevented about 84,300 ADEs per year (373,000
 $\times$
0.226). The FDA similarly calculated that 114 AHTRs could be prevented annually with full bar code technology adoption. Prior to full adoption, FDA estimated that partial adoption would translate to a proportional reduction in preventable ADEs and AHTRs.
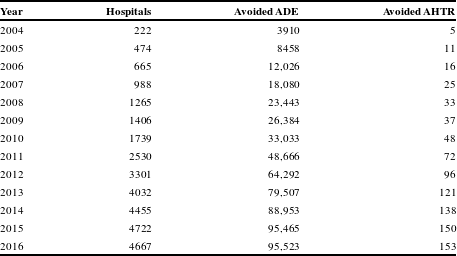
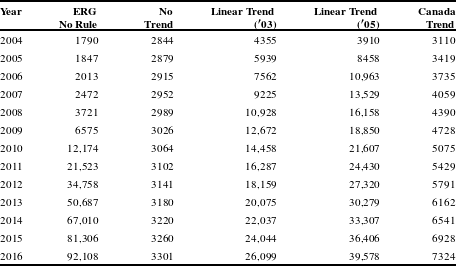
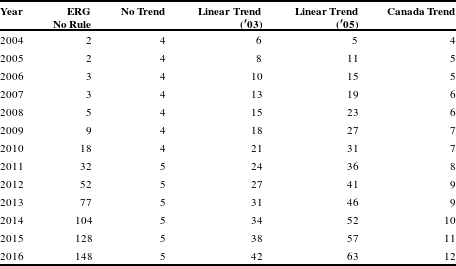
Table 6 calculates the avoided ADEs and AHTRs implied by hospital adoption of bar code technology. In the year 2004, 222 hospitals had adopted bar code technology. Under the assumptions of the 2004 RIA, 1315,000 ADEs were expected to occur in a hospital setting. Of these, 394,500 were thought to be avoidable, and among these, 77,750 occurred while dispensing or administration. Based on existing literature (Yang et al., Reference Yang, Brown, Trohimovich, Dana and Kelly2001; Barker et al., Reference Barker, Flynn, Pepper, Bates and Mikeal2002) and discussions with industry experts, FDA expected that if all hospitals had adopted bar code technology, half of these could have been prevented, or about 88,870. Since about 4.4% of hospitals had adopted the technology in 2004, we estimate that the same percentage, or 3910 ADEs were avoided due to bar code medication administration. We continue this analysis for AHTRs, and repeat the same analysis for each of the baseline scenarios in Tables 7 and 8.
Avoided ADE and AHTR implied by actual bar code technology adoption.

ADE avoided under baseline scenarios.

AHTR avoided under baseline scenarios.

Tables 9 and 10 quantify the number of ADEs and AHTRs attributable to the rule. Similar to the hospital cost estimates presented above, these represent the difference between ADEs and AHTRs implicit from the adoption rate minus the figures for each of the baseline scenarios.
ADE avoided due to the rule.

AHTR avoided due to the rule.

5.3 Monetizing Benefits
The 2004 FRIA included an estimate of the value of the resulting life years saved and pain and disability avoided; in the analysis FDA estimated that each ADE and AHTR resulted in additional direct medical costs of $2257. Additionally, the suffering and death resulted in quality-adjusted life year (QALY) losses valued at $185,500 per adverse drug event (ADE) and $101,200 per acute hemolytic transfuction reaction (AHTR). These valuations explicitly relied on a Value of Statistical Life of $5 million (or $6.2 million in 2015 dollars). By multiplying these values by the ADEs and AHTRs avoided due to the rule, we can monetize these benefits, which appear in Table 11.
Monetized benefits due to avoided ADE and AHTR (Millions of 2015 $).

5.4 Net Benefits
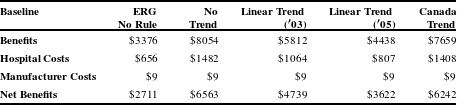
With costs and benefits calculated, we can now combine these to recreate the net costs and benefits. Table 12 reports the net benefits of the rule under the various baseline assumptions discussed earlier. Across each scenario, drug manufacturers incur regulatory costs that are annualized as $9 million, and are reported by year in the appendix. All figures are reported as millions of 2015 dollars, annualized over the 2004 to 2016 time period using a 3% discount rate.
Annualized net benefits under alternative baseline assumptions (millions of 2015 $).

The first column reports the benefits and costs if the original forecast of hospital adoption without the rule had been correct. Under this scenario, the rule would have generated $3.4 billion in annualized benefits, while hospitals would incur $656 million in annualized costs to adopt and maintain bar code technology. Subtracting these costs and the manufacturing costs yields $2.7 billion in annualized net benefits.
To put these estimates into context, the 2004 RIA estimated the annualized net benefits of the rule to be $4.3 billion in 2004 dollars, using a 3% discount rate. This is equivalent to $5.3 billion in 2015 dollars. These net benefits are calculated as the difference between $6.0 billion in annualized benefits and $747 million in annualized costs, again in 2015 dollars. As a consequence of hospitals adopting bar code technology slower than predicted under the rule, the benefit and cost estimates from the 2004 RIA are both too high when applying the original baseline. We next consider how net benefits change in light of the alternative baseline scenarios described earlier.
The second column again uses real hospital data, but diverges from the original ERG baseline by assuming that no new hospitals would have adopted bar code technology without FDA’s bar code rule. Relative to column 2, the benefits and hospital costs both increase. Column 6, which assumes that U.S. adoption would have followed Canada’s gradual trajectory without the rule, yields similar results.
The third column adopts a baseline where U.S. adoption would continue at its 2003 trend, reflecting the most up-to-date data available to FDA at the time the original RIA was drafted. This alternative baseline suggests that, without the rule, hospitals would have continued to adopt bar code technology more rapidly than ERG’s baseline through 2011, with a relatively slower adoption rate following this point. This translates to relatively lower benefits and costs through 2011 and relatively higher benefits during 2012–2016.
The fourth column uses a linear trend through 2005, the last year prior to the rule taking effect. An additional two years of data predicts more aggressive adoption of bar code medication administration by hospitals, although this may be due to hospitals adopting the technology after learning about the rule.
Our retrospective analysis presents a wide range of annualized net benefit estimates, between $2.7 billion and $6.6 billion. This uncertainty stems from different assumptions about what the adoption rate of bar code technology would have been in absence of the 2004 Bar Code Rule. These should be considered upper-bound estimates of the net effect of the rule, since many other initiatives affected the adoption of bar code technology in hospitals. Alternatively, these estimates can be considered a joint BCA of the Bar Code Rule and all other contemporaneous initiatives that pushed for bar code technology adoption. The 2004 RIA explored other sources of uncertainty in these estimates, including the effectiveness of bar codes at intercepting medical errors, and the mortality probability following an ADE. In a sensitivity analysis, the 2004 RIA yielded a range of estimated annualized net benefits between $862 million and $9.3 billion, when updated to 2015 dollars. All the net benefit calculations included in this retrospective fall in this range.
6 Reassessment of hospital costs
In addition to re-estimating the costs and benefits of the 2004 Bar Code Rule based on real-world data and considering several alternative counterfactual baselines, we also reconsidered our assumptions about the role of hospital costs. In the original analysis, the Bar Code Rule induced hospitals to speed up adoption of bar code technology, causing them to incur costs, which are included in the RIA. However, as mentioned earlier, the rule did not mandate adoption by any hospital. If we use a common assumption that hospitals aim to maximize profits, then any hospital that voluntarily adopted bar code medication administration must therefore have expected that doing so would either reduce other costs, or increase its revenue. Following through with this argument, this suggests that the costs we calculate are overstated, as hospitals should have offsets at least as large as their costs. More research could be done to investigate whether hospitals were motivated to adopt bar code technology because of reimbursement incentives for improved outcomes.
7 Conclusions
This retrospective BCA of the 2004 Bar Code Rule gives an overview of the FDA’s original regulatory impact analysis, describes how the real-world experience differed from forecasts, and attempts to understand the actual impacts of the rule. While access to new data allows us to better understand what happened, uncertainty remains over the counterfactual – at what rate hospitals would have adopted bar code technology without the rule. As we are unable to observe what the adoption rate would have been in the absence of the rule and thereby retrospectively measure the benefits and costs with certainty, we considered several alternative scenarios, and gave cost and benefit calculations based on each of those scenarios. The different scenarios based on actual adoption rates and other evidence, however, show that the benefits greatly exceeded the costs, with high benefit-cost ratios, under any plausible counterfactual adoption rate. However, it is unclear what portion of the adoption can be claimed by the Bar Code Rule. Given the number of and credibility of competing theories that explain adoption, the original ERG baseline, which attributes most of the technology uptake in hospitals to other forces besides the 2004 rule, remains our preferred counterfactual.
In this retrospective, we also briefly discussed an alternative approach toward costs to industry with voluntary investments in technology. Additional extensions of the analysis could include reconsidering other parameters, such as the effectiveness of bar code technology in reducing errors, or the likelihood that an error leads to an adverse health event. There are, however, potential costs that were not included in this analysis. Specifically, by setting the standard as a linear bar code, the Rule may have induced hospitals to make investments in technologies that are not “future proofed.” A better understanding of the state of hospital technology would be a logical next step in addressing this concern.
Appendix
Canadian adoption of bar code medication administration.