Introduction
Autism, as defined by DSM-IV criteria, is a developmental disorder characterized by difficulties in social interaction, a restricted repetitive range of interests and behaviours and impairments in verbal and non-verbal communication. There is a broad clinical phenotype that encompasses a wide range of behaviour and degrees of global intellectual impairment. This results in a diverse clinical population, generally described as having an autism spectrum disorder (ASD). Individuals on the autism spectrum who do not show global intellectual impairment are commonly referred to as having high-functioning autism (HFA) if they have a history of significant language delay and Asperger syndrome (AS) if they do not. For adults with HFA/AS it is the difficulties in social communication and interaction that are frequently the most debilitating.
Studies have identified deficits in facial emotion recognition in both children (Celani et al. Reference Celani, Battacchi and Arcidiacono1999) and adults (Hobson et al. Reference Hobson, Ouston and Lee1988; Howard et al. Reference Howard, Cowell, Boucher, Broks, Mayes, Farrant and Roberts2000; Adolphs et al. Reference Adolphs, Sears and Piven2001; Pelphrey et al. Reference Pelphrey, Sasson, Reznick, Paul, Goldman and Piven2002) with autism. Understanding more complex emotional and social information from facial stimuli is also thought to be impaired in autism (Baron-Cohen et al. Reference Baron-Cohen, Wheelwright, Hill, Raste and Plumb2001a). Although the majority of studies have focused on face stimuli, there is some evidence to suggest that the abnormalities of emotion processing may also be present in other types of visual stimuli such as body movement (Moore et al. Reference Moore, Hobson and Lee1997; Hubert et al. Reference Hubert, Wicker, Moore, Monfardini, Duverger, Fonséca and Deruelle2007).
The literature to date therefore suggests that individuals with autism may be impaired in recognizing emotional content in a variety of visual stimuli. It is, however, possible that the apparent deficits in emotion recognition in faces and from movement derive from general impairments in the processing of visual stimuli. Investigating emotion processing in the auditory modality is one way to examine whether there is a core deficit in emotion processing in ASD; if deficits in emotional processing of faces and whole body movement result from deficits in visual processing style and/or visual attention then emotional processing in the auditory domain should be preserved. Findings from the limited literature on vocal emotion processing have, however, provided mixed results. Rutherford et al. (Reference Rutherford, Baron-Cohen and Wheelwright2002) carried out the Reading the Mind in the Voice task, which involves stimuli purely in the auditory domain, and demonstrated deficits in autistic participants' ability to extract complex mental states from dialogue. Simple recognition of basic emotional states from vocal stimuli has been reported as being as accurate as controls in one study (O'Connor, Reference O'Connor2007) and impaired in another (Mazefsky & Oswald, Reference Mazefsky and Oswald2007).
In the current study we sought to investigate whether individuals with ASD have pervasive deficits in emotion processing across stimulus domains. The perception of a range of social signals was examined using tasks of comparable format to investigate face, body movement and voice emotion processing in a group of subjects with ASD and age- and gender-matched controls. We also extended our investigation into social cognition judgements as associated with facial stimuli in ASD.
We had three main hypotheses: first, that the ASD group would show deficits in emotion processing across a range of stimulus modalities; second, that these deficits would extend across a range of emotional states; and third, that subjects with ASD would also show related impairments in making social judgements.
Method
Participant details
Twenty-three individuals with ASD were recruited from ‘Number 6’, a drop-in centre and service provider for adults with AS or HFA in Edinburgh and the Lothians (www.number6.org.uk), with close links to the regional ASD health service. The ASD subject group had a mean age of 32.5 years (s.d.=10.9 years) and consisted of 16 males and seven females. Of these, six ASD participants had a history of depression and were taking selective serotonin reuptake inhibitors (SSRIs). The control group was matched by age [mean age 32.4 years (s.d.=11.1 years)] and gender (17 males, six females) and consisted of typically developing volunteers who reported no personal or family history (first-degree relative) of ASD or a major psychiatric disorder. All study volunteers provided informed consent and the study was approved by the Local Research Ethics Committee.
Test procedures
Diagnostic measures of ASD
All members of the ASD group had previously received a diagnosis of an ASD through multidisciplinary assessment by clinical services in South-East Scotland. DSM-IV diagnostic categories were confirmed through a combination of case-note review and assessment by a clinician experienced in the diagnosis of autism spectrum disorders in adults (A.C.S.).
To further characterize the current level of autistic behaviour, ASD participants completed the Autism Diagnostic Observational Schedule (ADOS; Lord et al. Reference Lord, Risi, Lambrecht, Cook, Leventhal, DiLavore, Pickles and Rutter2000), the Autism Quotient (AQ; Baron-Cohen et al. Reference Baron-Cohen, Wheelwright, Skinner, Martin and Clubley2001b), Empathy Quotient (EQ; Baron-Cohen & Wheelwright, Reference Baron-Cohen and Wheelwright2004) and Systemizing Quotient (SQ; Baron-Cohen et al. Reference Baron-Cohen, Richler, Bisarya, Gurunathan and Wheelwright2003). Participants were classified as ADOS positive if they scored above the cut-off for ASD on both the communication and social interaction subscales of the ADOS algorithm and also on their total score. Participants who failed to reach this threshold were classified as ADOS negative.
Background measures of cognitive ability
Intelligence quotient (IQ) scores were obtained using the Wechsler Abbreviated Scale of Intelligence (WASI). The Benton Test of Facial Recognition (Benton et al. Reference Benton, Hamsher and Varney1983) was used to establish basic face processing ability.
Emotion recognition
Emotion processing ability was investigated across three stimulus domains: faces, body movement and voices.
Face tasks
First, the Ekman 60 Faces Test from the Facial Expressions of Emotion: Stimuli and Tests (FEEST; Young et al. Reference Young, Perrett, Calder, Sprengelmeyer and Ekman2002) was carried out. Participants have to select a textual label to describe the emotion expressed in a face presented to them on a computer monitor. The stimuli were selected from Ekman & Friesen's (Reference Ekman and Friesen1976) pictures of facial affect series. Each face stimulus was presented for 5 s and participants had a choice of six emotion labels: ‘happiness’, ‘sadness’, ‘anger’, ‘disgust’, ‘fear’ and ‘surprise’. Ten trials for each emotion were presented in random order and participants received no feedback on task performance. The second task was the Emotion Hexagon task from the FEEST (Young et al. Reference Young, Perrett, Calder, Sprengelmeyer and Ekman2002), which uses the same task structure but stimuli are computer morphed to differ in the extent to which they express the emotion, thus providing a more sensitive measure of emotion labelling ability.
A further two tasks of facial emotion processing were developed, both using stimuli from the Japanese and Caucasian Facial Expressions of Emotion (JACFEE) series (Matsumoto & Ekman, Reference Matsumoto and Ekman1988). In the first Face Emotion Label task, participants were again presented with a face on the computer monitor for 5 s. This time, they had only five textual labels to choose from because ‘surprise’ was omitted to allow a more direct comparison between tasks involving facial emotion and those involving emotion in voices and body movements, for which ‘surprise’ stimuli were not available (Murray & Arnott, Reference Murray and Arnott1993). There were seven trials for each emotion and the 35 stimuli were presented in random order. The second task to use the JACFEE stimuli was a Face Emotion Match task. Participants were required to match the target stimuli to another picture of a face according to the emotional expression. This task was included as it has no verbal labelling component.
Body movement task
In the Body Movement Emotion Label task participants were required to select a text label from a choice of five (‘happiness’, ‘sadness’, ‘anger’, ‘disgust’ and ‘fear’) to describe the emotion expressed in a short movie clip. The movies ranged from 5 to 10 s and consisted of individual male and female actors depicting one of five emotions with whole-body movements. No facial emotion was visible. Ten trials of each emotion were presented in random order and responses received no feedback. The whole-body movement stimuli depicting basic emotions in full light is part of a standardized stimulus set from Atkinson et al. (Reference Atkinson, Dittrich, Gemmell and Young2004).
Voice task
In the Voice Emotion Label task, participants were required to select a text label from a choice of five (‘happiness’, ‘sadness’, ‘anger’, ‘disgust’ and ‘fear’) to describe the emotion in vocal stimuli. Calder Vocal Emotion stimuli were used, which last 5–10 s and consist of male and female actors saying strings of numbers in an emotional tone (Calder et al. Reference Calder, Keane, Lawrence and Manes2004). Ten trials of each emotion were presented in random order and responses received no feedback.
Tests of social judgement
A final set of tasks tested ability to make a range of social judgements from faces. A full description of the derivation of this set of tasks is available elsewhere (Santos, Reference Santos2003; Hall et al. Reference Hall, Harris, Sprengelmeyer, Sprengelmeyer, Young, Santos, Johnstone and Lawrie2004; Santos & Young, Reference Santos and Young2008). In brief, a database of 1000 pictures of faces of non-famous adults were acquired from media sources and were rated by six volunteer participants on six social dimensions (age, trustworthiness, intelligence, attractiveness, approachability and distinctiveness) using 1–7-point scales. A mean rating for each characteristic was then computed for each facial stimulus. For each characteristic, 40 faces were then selected comprising 20 faces representative of high and 20 faces of low valence to construct the final task. Each individual face appeared only in one set; completely different faces were selected for the sets of faces involving judgements of age, attractiveness, etc. The sets of faces for each social dimension were matched as closely as possible on the remaining five dimensions and half the stimuli were male and half female.
In the present study participants were shown 40 faces (eight practice and 32 test images) for each of the six social characteristics on a computer monitor. Each stimulus was presented for 5 s. Participants were asked by text prompts to make a two-alternative forced-choice judgement on the face relating to age (old or young) in set 1, trustworthiness (very trustworthy or not trustworthy) in set 2, attractiveness (attractive or unattractive) in set 3, intelligence (very intelligent or not intelligent) in set 4, approachability (very approachable or not approachable) in set 5 and distinctiveness (very distinctive or not distinctive) in set 6. A response was considered an error whenever it did not correspond to the categorization of the stimulus derived from the independent ratings (Santos, Reference Santos2003; Hall et al. Reference Hall, Harris, Sprengelmeyer, Sprengelmeyer, Young, Santos, Johnstone and Lawrie2004; Santos & Young, Reference Santos and Young2008).
Statistical analysis
Statistical analysis was carried out in SPSS version 14.0 for Windows (SPSS Inc., USA). t tests were used to investigate mean differences between the ASD and control groups in the AQ, EQ and SQ, measures of IQ and performance on the Benton Face Recognition Task.
Separate repeated-measures analyses of variance (ANOVAs) were used for each task of emotion recognition and the social judgement task, with emotion/judgement as the within-subject variable and group as the between-subject factor. Following the investigation of effects of group, effects of emotion and group×emotion interactions, the effect of group was investigated for each emotion separately using independent t tests. A Bonferroni correction was then applied to control for multiple comparisons. Standard residuals were examined to check that data were normally distributed before parametric statistical tests were applied.
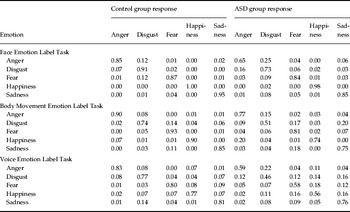
To illustrate the pattern of errors made by the control group and the ASD group in the Face Emotion Label task, the Body Movement Emotion Label task and the Voice Emotion Label task, confusion matrices were constructed by calculating the number of times each emotion was given in response to a stimulus.
Pearson's correlation was used to investigate associations between task performances across modalities in the emotion label tasks and the relationship between basic emotion label ability and social cognition.
Because of the range of symptom severity present in the ASD sample, an exploratory analysis was carried out with the ASD group subdivided according to the level of behavioural symptoms observed using the ADOS. Exploratory analyses to test for group×gender interactions were also carried out and the effect of medication in the ASD group investigated. Finally, as significant group differences were found in relation to IQ scores and performance on the Benton Face Recognition Test, the original analysis was repeated on subsets of the study population, matched on these measures.
Results
Diagnostic assessment
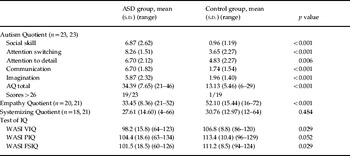
All participants within the subject group met DSM-IV criteria for ASD. Within the ASD group seven participants met DSM-IV criteria for childhood autism, 13 for AS and three for pervasive developmental disorder not otherwise specified (PDD-NOS). The ASD group scored significantly higher on each subset of the AQ compared to the control group (p<0.001, see Table 1) and significantly lower on the EQ (p<0.001). However there was no significant difference between groups on scores for the SQ (see Table 1). Despite the positive clinical diagnoses, only 11/23 participants scored above the ADOS cut-off.
Mean group scores with standard deviations (s.d.) and ranges for Autism, Empathy and Systemizing Quotients and tests of IQ. T tests were applied to compare group means

ASD, Autistic spectrum disorder; AQ, Autism Quotient; IQ, Intelligence Quotient; WASI, Wechsler Abbreviated Scale of Intelligence; VIQ, Verbal IQ; PIQ, performance IQ; FSIQ, full-scale IQ.
Background measures of cognitive abilities
Verbal IQ (VIQ) and full-scale IQ (FSIQ) scores were lower in the ASD group than in the control group (see Table 1). For scores on the Benton Test of Facial Recognition, the control group mean was 46 (s.d.=2.8), with a range of 41–52; all group members scoring in the non-impaired range. The mean ASD group score was 43.35 (s.d.=4.39), range 36–50. Although the mean score is within normal limits, four members of the ASD group scored below 39, indicating a face recognition impairment (Benton et al. Reference Benton, Hamsher and Varney1983). The difference between mean group scores was statistically significant (p=0.02).
Emotion recognition
Faces
Data for the four facial emotion tasks are presented in Supplementary Table S1 (available online). In the Ekman 60 Faces task there was a significant effect of group [F(1, 46)=27.7, p<0.001], a significant effect of emotion [F(5, 46)=17.12, p<0.001] and a significant group×emotion interaction [F(5, 46)=2.96, p=0.013]. Post-hoc t tests demonstrated that the ASD group performed significantly worse in the Ekman 60 Faces task when identifying ‘anger’, ‘sadness’ and ‘fear’ (p<0.05).
In the Emotion Hexagon task, again there was a significant effect of group [F(1, 46)=17.46, p<0.001], a significant effect of emotion [F(5, 46)=11.41, p<0.001] and a significant group×emotion interaction [F(5, 46)=2.41, p=0.037]. Again, the ASD group was significantly worse at identifying ‘anger’, ‘sadness’ and ‘fear’ (p<0.05).
In the Face Emotion Label task there was a significant effect of group [F(1, 46)=9.3, p=0.004), a significant effect of emotion [F(4, 46)=10.69, p<0.001) and a significant group×emotion interaction [F(4, 46)=3.17, p=0.015]. When the difference in group performance was investigated for each emotion separately, identification of ‘anger’ was found to be significantly impaired in the ASD group. In the Face Emotion Match task, there was a significant effect of group [F(1, 46)=10.1, p=0.003], a significant effect of emotion [F(4, 46)=10.09, p<0.001) and a significant group×emotion interaction [F(4, 46)=2.69, p=0.033). In this task, labelling ‘sadness’ was particularly impaired in the ASD group.
Body movement
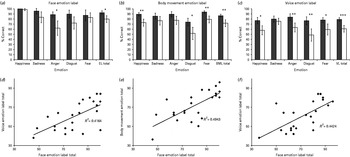
There was a significant effect of group [F(1, 46)=17.42, p<0.001] and a significant effect of emotion [F(4, 46)=18.82, p<0.001] in the Body Movement Label task; however, there was no significant group×emotion interaction [F(4, 46)=1.44, p=0.222]. The greatest impairments in the ASD group in this task were seen when identifying ‘happiness’ and ‘fear’ (see Fig. 1 b and Supplementary Table S1).
Percentage of correct responses for (a) the Face Emotion Label task, (b) the Body Movement Emotion Label task and (c) the Voice Emotion Label task. Control group mean is in black, autistic spectrum disorder (ASD) group mean is in white. 95% confidence intervals are displayed (* p<0.05, ** p<0.005, *** p<0.001). Correlations between performance in each of the emotion label tasks in the ASD group: (d) vocal emotion versus facial emotion, (e) body movement emotion versus facial emotion and (f) body movement emotion versus vocal emotion. All correlations are statistically significant (p=0.001).

Voices
In the Voice Emotion Label task, there was a significant effect of group [F(1, 46)=25.46, p<0.001), a significant effect of emotion [F(4, 46)=5.53, p<0.001] and a significant group×emotion interaction [F(4, 46)=2.89, p=0.024]. The ASD group demonstrated the greatest deficits when labelling ‘anger’ and ‘disgust’ and no significant difference was found between groups when identifying ‘sadness’ (see Fig. 1 c and Supplementary Table S1).
Error patterns in basic emotion labelling tasks
The pattern of errors in each task for each group is illustrated in the confusion matrices (Table 2). These data demonstrate that the number and type of errors made vary according to modality, with the deficits in emotion labelling performance seen in the ASD group resulting from increased numbers of similar errors made by the control group.
Confusion matrices for the control and autistic spectrum disorder (ASD) groups for the Face, Body Movement and Voice Emotion Label tasks

Social cognition
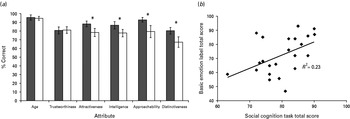
In the tasks of social cognition, there was a significant effect of group [F(1, 46)=17.48, p<0.001], a significant effect of emotion [F(5, 46)=27.97, p<0.001] and a significant group×judgement interaction [F(5, 46)=5.2, p<0.001]. Further exploration with post-hoc t tests identified deficits in the ASD group when making judgements of approachability, attractiveness, intelligence and distinctiveness. The difference in mean score for these attributes reached statistical significance (Fig. 2 a and Supplementary Table S1).
(a) Percentage of responses in agreement with standardized scores for each attribute in the task of social cognition. Control group mean is in black, autistic spectrum disorder (ASD) group mean is in white. 95% confidence intervals are displayed (* p<0.05, ** p<0.005, *** p<0.001). (b) Correlation between basic emotion labelling ability and performance in tasks of social cognition in the ASD group (p=0.021).

Correlation of task performance across modalities and in relation to social cognition ability
As presented in Fig. 1(d–f), performance on each emotion labelling task was significantly and positively correlated with emotion labelling ability in the other two stimulus domains in the ASD group. Face Emotion Label performance correlated with Voice Emotion Label performance (Pearson's r=0.646, p=0.001) and Body Movement Emotion Label performance (Pearson's r=0.701, p<0.001). Voice Emotion Label performance also correlated with performance in the Body Movement Emotion Label task (Pearson's r=0.665, p=0.001). The total emotion labelling score, an average score taken from each of the basic emotion label tasks, correlated with the average social cognition score in the ASD group (Pearson's r=0.48, p=0.021; Fig. 2 b).
Analysis of task performance by ADOS score
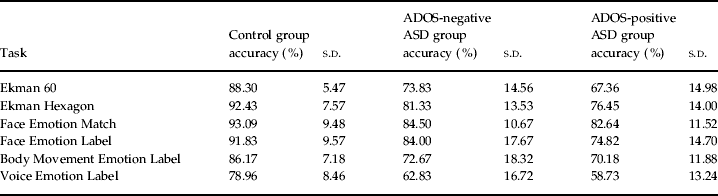
Despite all having a clinical diagnosis of ASD, around half of our sample did not meet criteria for an ADOS categorization of ASD. An exploratory analysis was therefore carried out to examine task performance with the ASD group subdivided according to whether or not participants scored above the cut-off on the ADOS (see Table 3). This analysis revealed that both groups showed impairments relative to the control group, with the task performance of those scoring below the ADOS cut-off lying intermediate between the performance of those who scored above the cut-off and the controls.
Task performance accuracy (totals across all emotions) for all emotion processing tasks for the control group and the autistic spectrum disorder (ASD) group subdivided according to the Autism Diagnostic Observational Schedule (ADOS) score

s.d., Standard deviation.
Control group: n=23, mean age=32.4 (s.d.=11.1) years, Autism Quotient (AQ)=13.1 (5.4), full-scale IQ (FSIQ)=111.2 (8.5). ADOS-negative ASD group: n=12, mean age=31.5 (s.d.=11.2) years, AQ=35.2 (7.8), FSIQ=105.3 (13.5). ADOS-positive ASD group: n=11, mean age=33.7 (s.d.=11) years, AQ=33.5 (7.7), FSIQ=97.4 (22.8).
Effects of possible confounds
The ASD group had a significantly lower FSIQ score than the control group (p=0.029); therefore, a subset of participants (n=17 in each group) with matched FSIQ was selected and the original analysis repeated. The ASD subset comprised five participants with autism, 11 with AS and one with PDD-NOS and showed no significant difference from the control group in verbal, performance or FSIQ. Repeated-measures ANOVAs revealed a similar pattern of results to those seen in the full group (see Supplementary Table S2). In addition, the correlations described above remained significant when investigated in the IQ-matched subset of ASD participants [FSIQ=110.2 (94–124)].
Similarly, as scores of the Benton Task of Face Recognition differed significantly between groups, ASD participants who had a Benton score indicative of face recognition impairment were excluded and the analysis of emotion and social tasks involving the face stimuli were repeated. When groups were matched for Benton task performance, the original pattern of results remained, suggesting that deficits in face recognition do not account for the emotion processing impairments presented in this study (see Supplementary Table S3).
As the gender ratio in this ASD population (16:7) was somewhat higher than what is seen typically (4:1), the effect of gender was investigated; there was no significant gender×group interaction in any of the emotion or social cognition tasks.
Within the ASD group, participants with a history of depression and taking SSRIs did not differ in their performance on the emotion processing tasks from the rest of the ASD group.
Discussion
We have demonstrated that people with ASD have significant impairments in emotion recognition across a range of stimulus domains and in both the visual and auditory modalities. These results cannot be accounted for in terms of a failure to process emotional information in any single stimulus domain or sensory modality and therefore strongly support the view that ASD involves a generalized impairment in emotion recognition. The same participants also had impairments in making other social judgements, suggesting that the deficits seen in emotion recognition could be part of a broader deficit in mental state attribution. Notably, the deficits in emotion recognition correlated with the deficits in social judgement. The emotion and social processing impairments observed in the ASD group could not be accounted for by any differences in IQ or basic face processing ability between groups.
Cross-modal deficits
The deficits displayed by the ASD group in each emotion processing task strongly support our hypothesis of cross-modal emotion processing deficits. Our findings of deficits in facial emotion processing across a range of tasks are in line with earlier studies (Celani et al. Reference Celani, Battacchi and Arcidiacono1999; Howard et al. Reference Howard, Cowell, Boucher, Broks, Mayes, Farrant and Roberts2000; Adolphs et al. Reference Adolphs, Sears and Piven2001; Pelphrey et al. Reference Pelphrey, Sasson, Reznick, Paul, Goldman and Piven2002). Previous reports (reviewed by Sasson, Reference Sasson2006), and indeed our own data from the Benton Task of Facial Recognition, suggest that basic face processing, regardless of emotion, may be impaired in ASD. However, differences were still apparent when the groups in the current study were matched for Benton task performance, suggesting that the results are not accounted for by deficits in basic face processing.
Deficits in the task of emotion recognition from body movement replicate previous findings (Blake et al. Reference Blake, Turner, Smoski, Pozdol and Stone2003; Hubert et al. Reference Hubert, Wicker, Moore, Monfardini, Duverger, Fonséca and Deruelle2007), reinforcing the view that processing emotion from whole-body movement is also deficient in ASD. However, the deficits in our ASD group are less marked than those reported by Hubert et al. (Reference Hubert, Wicker, Moore, Monfardini, Duverger, Fonséca and Deruelle2007). This could be accounted for by the difference in demands in the body movement emotion label task applied here, which used full body images as opposed to point light displays, allowing (a) full view of the body and (b) low motion coherence requirements when depicting whole-body movement stimuli. Furthermore, in Hubert et al. (Reference Hubert, Wicker, Moore, Monfardini, Duverger, Fonséca and Deruelle2007), participants were asked to spontaneously generate descriptive language whereas our task provided a limited number of textual options with which to respond.
We also demonstrated deficits in vocal emotion processing in the ASD group compared to the control group. This is in contrast to the findings of O'Connor (Reference O'Connor2007), who reported equivalent recognition of emotion from auditory stimuli in the ASD group relative to control group performance. Variations in task design may account for the difference in results between the studies. First, the task used in this study provides participants with five options with which to respond; in the O'Connor study only three emotions were investigated. Second, in the O'Connor study, participants labelled auditory stimuli that they had already been exposed to in a previous emotion processing task, which may have conferred an advantage. Our data indicate that deficits in emotion processing in autism also extend to the auditory modality.
Although the vast majority of previous emotion processing studies in ASD have made use of static facial representations of emotion (Critchley et al. Reference Critchley, Daly, Bullmore, Williams, Van Amelsvoort, Robertson, Rowe, Phillips, McAlonan, Howlin and Murphy2000; Howard et al. Reference Howard, Cowell, Boucher, Broks, Mayes, Farrant and Roberts2000; Adolphs et al. Reference Adolphs, Sears and Piven2001; Pelphrey et al. Reference Pelphrey, Sasson, Reznick, Paul, Goldman and Piven2002; Hall et al. Reference Hall, Szechtman and Nahmias2003; Ogai et al. Reference Ogai, Matsumoto, Suzuki, Ozawa, Fukuda, Uchiyama, Suckling, Isoda, Mori and Takei2003; Piggot et al. Reference Piggot, Kwon, Mobbs, Blasey, Lotspeich, Menon, Bookheimer and Reiss2004; Wang et al. Reference Wang, Dapretto, Hariri, Sigman and Bookheimer2004; Dalton et al. Reference Dalton, Nacewicz, Johnstone, Schaefer, Gernsbacher, Goldsmith, Alexander and Davidson2005; Ashwin et al. Reference Ashwin, Baron-Cohen, Wheelwright, O'Riordan and Bullmore2007; Deeley et al. Reference Deeley, Daly, Surguladze, Page, Toal, Robertson, Curran, Giampietro, Seal, Brammer, Andrew, Murphy, Phillips and Murphy2007; Koshino et al. Reference Koshino, Kana, Keller, Cherkassky, Minshew and Just2008), we show here that deficits in emotion recognition are not isolated to this type of stimulus. This broad-ranging deficit in emotion recognition is therefore unlikely to be accounted for by processing demands or a processing style adopted for any specific stimulus domain. Differences in eye-gaze pattern while processing static face stimuli (Klin et al. Reference Klin, Jones, Schultz, Volkmar and Cohen2002; Pelphrey et al. Reference Pelphrey, Sasson, Reznick, Paul, Goldman and Piven2002; Dalton et al. Reference Dalton, Nacewicz, Johnstone, Schaefer, Gernsbacher, Goldsmith, Alexander and Davidson2005; Spezio et al. Reference Spezio, Adolphs, Hurley and Piven2007), for example, cannot account for the observed deficits in identifying emotion in body movement and voice stimuli. Although we did not specifically monitor eye-gaze during our visual experiments, the cross-modal impairments in the ASD group reported here, which include deficits in auditory emotion processing, could not be fully accounted for by atypical scan paths during face processing.
Cross-emotion deficits
Although previous studies (Howard et al. Reference Howard, Cowell, Boucher, Broks, Mayes, Farrant and Roberts2000; Pelphrey et al. Reference Pelphrey, Sasson, Reznick, Paul, Goldman and Piven2002) demonstrated a differentially severe deficit in the identification of the emotion of fear from faces, we report a broader deficit in emotion recognition. Each of the basic emotions tested was impaired in at least one domain, lending further weight to the idea of a global deficit in emotion processing in ASD. This suggests that impairments in emotion recognition in ASD lie in a substrate common to the processing of a wide range of emotional states.
Social judgement deficits
The deficits in the ASD group extended to the tasks of social cognition in support of our third hypothesis. These tasks assess participants' ability to make social judgements from a static facial image. Our finding of deficits in a range of decisions extends previous work that was limited to decisions relating to ‘trustworthiness’ and ‘approachability’ (Adolphs et al. Reference Adolphs, Sears and Piven2001). Although we replicated Adolphs et al. (Reference Adolphs, Sears and Piven2001) finding of differences in judging approachability, the ASD group studied here were equivalent to the control group in their judgements of trustworthiness. Differences in the format of the task used may account for this; Adolphs et al. (Reference Adolphs, Sears and Piven2001) provide a scale with which participants rate trustworthiness whereas in this study participants were asked to make a dichotomous decision. The overall poorer task performance in these social tasks, however, supports the notion of a generalized dysfunction in processing social information from human stimuli in autism, as reported previously in studies assessing mentalizing ability (Happe et al. Reference Happe, Ehlers, Fletcher, Frith, Johansson, Gillberg, Dolan, Frackowiak and Frith1996; Baron-Cohen et al. Reference Baron-Cohen, Jolliffe, Mortimore and Robertson1997, Reference Baron-Cohen, Ring, Wheelwright, Bullmore, Brammer, Simmons and Williams1999; Frith, Reference Frith2001; Castelli et al. Reference Castelli, Frith, Happe and Frith2002). The significant positive correlation between ASD participants' performance of simple emotion recognition and these social judgements provides evidence that basic emotion processing skills are predictive of more general social ability.
Study limitations
It is important to note that, whereas all members of the ASD group had received a clinical diagnosis through multidisciplinary assessment by clinical services, only half of the group demonstrated sufficient current behavioural symptoms to score above the cut-off on the ADOS. Notably, all of the participants who did not meet criteria on the ADOS had clinical diagnoses of either AS or PDD-NOS, rather than autistic disorder. Although it is possible that the clinical diagnostic process may be over-inclusive, the findings when the group was subdivided by ADOS score suggest this is not the case, with cross-modal deficits in emotion processing present in both groups. Of note, those scoring below the cut-off, although still impaired, showed less marked deficits in emotion processing than those who scored above the cut-off. This may indicate that, although those below the cut-off are indeed classified correctly as being on the autism spectrum, they are less severely affected than those above the cut-off.
Other potential limitations to the current study include the lack of a standardized parental interview, such as the Autism Diagnostic Interview. Although parental interviews had been conducted for the majority of individuals during the original clinical diagnostic evaluation, we did not repeat this process because participants were adults recruited directly from a voluntary sector service. Furthermore, it should be noted that all ASD participants were individuals who chose to access a voluntary sector service and therefore the population studied may not necessarily be representative of the general autistic population.
Despite these limitations, the present study demonstrates robust findings of cross-modal emotion processing deficits in a clinically diagnosed sample with ASD. These findings suggest that previously reported deficits in emotion processing in ASD are not limited to one particular modality and are therefore likely to represent a core deficit in emotion processing, which consequentially impacts on social function.
Note
Supplementary material accompanies this paper on the Journal's website (http://journals.cambridge.org/psm).
Acknowledgements
We thank all the study participants for their involvement in this research and the support and the involvement of ‘Number 6’, Autism Initiatives, UK. R.P. is supported by a Principal's Ph.D. scholarship from the University of Edinburgh; A.C.S. is supported by a Wellcome Trust Clinical Research Training Fellowship; J.H. is supported by a Medical Research Council (MRC) Clinical Research Training Fellowship; and S.L. and H.W. are supported by the Theresa and Mortimer Sackler Foundation.
Declaration of Interest
None.