1 Introduction
The goal of this work is to analyse the differences at high pressures between real-gas compressible-flow behaviour and ideal-gas compressible-flow behaviour. Specifically, the focus is on canonical, ‘textbook’ theories for compressible flow and the modifications of the classical relations to account for real-gas behaviour: one-dimensional, isentropic flow through a choked nozzle; the Riemann invariants for wave propagation; the Prandtl shock relation; and the Rankine–Hugoniot relation. As an important feature of the analysis, a linearization of the cubic equation of state (EoS) in parameter space provides a simplifying approximation that facilitates analysis and computation of real-gas flows. This linearization does maintain nonlinear relations amongst the various flow variables and the associated key physics.
Interest in gaseous flows at pressures several-fold above critical pressures is increasing. Decades ago, experimental and computational analysis of flow through choked nozzles was motivated by the development of hypersonic wind tunnels. Examples are the studies by Tsien (Reference Tsien1946), Donaldson & Jones (Reference Donaldson and Jones1951) and Johnson (Reference Johnson1964). More recently, propulsion and power systems are driven towards substantially higher pressures to gain efficiency. Rocket combustors are operating at pressures at hundreds of bars, with the gas generator for propellant turbopumps at even higher pressures. Gas turbine engine design is trending towards peak pressures of approximately 60 bar and diesel engines have long operated at these high peak pressures. Airbag operation involves rocket-level pressures in a small combustion chamber. Of course, other applications related to blasts and industrial processing can exist. In the pioneering works on choked nozzles, the EoS used at that time are now out of date; improved models, although still descendants of the van der Waals cubic EoS, now exist (Chueh & Prausnitz Reference Chueh and Prausnitz1967a ,Reference Chueh and Prausnitz b ; Soave Reference Soave1972).
1.1 Consequence of real-gas behaviour on compressible flow
The potential for important quantitative differences for inviscid compressible flows between ideal-gas flows and real-gas flows has been well established in the literature. There have been earlier attempts to determine the jump in flow variables across a shock wave. Tao (Reference Tao1955) calculated jumps across normal shocks in freon-12 flow. The results show significant variations from ideal-gas behaviour for shocks with high pressure ratios. For a pressure ratio equal to 25, the downstream density was approximately 15 % higher for the real gas compared to the ideal gas, while the real-gas downstream temperature was 25 % lower. Shock flows of nitrogen were considered (Wilson & Regan Reference Wilson and Regan1965) where the upstream pressure and temperature varied up to 1000 atm and 2000 K. Correction factors as high as 1.6 for downstream pressure and 1.17 for downstream temperature were found to apply as multiples of the ideal-gas values. The analysis was based on the assumption that the upstream values satisfy the ideal-gas law. For the wide range of upstream values considered, this assumption is not acceptable.
For isentropic expansion and compression flows, Tao (Reference Tao1955) plots flow variables versus the Crocco number (Crocco Reference Crocco and Emmons1958), a non-dimensional velocity normalized by the square root of twice the stagnation enthalpy. For the Crocco number in the range of 0.2–0.5, they find higher real-gas values compared to ideal-gas values: i.e. 20 % for pressure, 10 % for density and 5 % for temperature.
For a convergent–divergent nozzle with a standing shock in the divergent (supersonic) portion, both Arina (Reference Arina2004) and Jassim & Muzychka (Reference Jassim, Abedinzadegan Abdi and Muzychka2008) show significant (i.e. 10 % or more) differences in flow properties for the ideal gas and the real gas. The shock location is also modified. Similar magnitudes of differences are shown by Arina (Reference Arina2004) for the shock tube problem with travelling shock, expansion wave and contact surface.
Donaldson & Jones (Reference Donaldson and Jones1951) performed experiments to measure the ratio of pressure at the choked throat of a nozzle to the stagnation pressure for air flow. They also measured the speed of sound in nitrogen at high pressures and made comparisons using the Beattie–Bridgeman EoS and the van der Waals EoS (Poling, Prausnitz & O’Connell Reference Poling, Prausnitz and O’Connell2001). Johnson (Reference Johnson1964) used the Beattie–Bridgeman EoS to calculate mass flow rates through a choked nozzle at high stagnation pressures for seven different gases. He found a few per cent difference between ideal-gas mass flux and real-gas mass flux, e.g. approximately a 3.5 % defect for the real-gas nitrogen at
 $550^{\circ }$
R and 100 bar. Ascough (Reference Ascough1968) calculated nozzle flow using tabulated thermodynamic data at supply pressures up to 10 bar and temperatures in the 270–400 K range. His results varied from ideal-gas results no higher than the third significant digit, indicating that, if more interesting results exist, they should be sought outside of this temperature–pressure range. More recently, Kim et al. (Reference Kim, Kim, Setoguchi and Matsuo2008) used the multidimensional Reynolds-averaged Navier–Stokes equation to treat flow of hydrogen through a choked nozzle. It was difficult to distinguish between real-gas effects and boundary-layer effects in explaining the reduction of mass flow, especially at the higher Reynolds number.
In some configurations and conditions, corrections due to real-gas effects might involve an adjustment of a value by only a few per cent. However, there are situations where such adjustments can have an extraordinarily large impact. A few per cent change in mass flow through a choked nozzle can have an important consequence on thrust. As another example, rocket solid propellant or automobile airbag solid explosive typically burns according to a law that gaseous mass generation rate
 ${\dot{m}}$
follows pressure
 $p$
to the power of
 $n$
with outflow from a pressurized chamber through a choked throat, i.e.
 ${\dot{m}}\sim p^{n}$
. If the non-dimensional exponent has the value
 $n=0.7$
(the top of the practical range) and the discharge coefficient were actually reduced by 3–10 % from the design based on an ideal-gas characterization, the chamber pressure would exceed the design value by 10–37 %, creating potentially a very dangerous situation. In addition to this type of case where small corrections have large indirect impact, situations are shown later where a change in a variable due to real-gas correction is large.
1.2 Special challenges
A real gas introduces new challenges to the computation of inviscid compressible flows. As noted by Drikakis & Tsangaris (Reference Drikakis and Tsangaris1993), the density is no longer primarily a function of the pressure. Rather, it becomes more strongly a function of both pressure and temperature. Enthalpy (or internal energy) becomes related to pressure, which creates a new coupling between the energy and momentum equations. Real-gas compressible-flow calculations have typically required iteration for a thermodynamic variable involving at least one of the conservation equations. See, for example, the study by Kouremenos (Reference Kouremenos1986), where the energy conservation equation for a jump across a normal shock is used in the iterative process. The real-gas EoS is typically a cubic algebraic equation with three solutions, two of which can be complex conjugates. Solving the cubic equation, choosing the physically interesting solution and avoiding the complex numbers form a substantial challenge in the context of intricate flow computations which already demand iterations. Arina (Reference Arina2004) solves three different flow configurations with four different EoS, the ideal-gas EoS and three different real-gas EoS. The CPU time was always substantially longer for the real-gas EoS. For air flow through a converging–diverging nozzle with a standing shock, the CPU time for the Redlich–Kwong EoS was more than double the perfect-gas time; for the same problem with CO
 $_{2}$
, it was 80 % greater. For the shock-tube problem with CO
 $_{2}$
where an unsteady expansion and a shock wave occur, the reported CPU time ratio is 3.62. The simpler but less accurate van der Waals EoS is generally less computationally expensive but also less accurate than the Redlich–Kwong EoS. Other real-gas EoS are more computationally expensive than the Redlich–Kwong EoS. The use of a closed-form approximation to the EoS can be an extremely good strategy to simplify the complex calculations. See, for example, the comments of Colella & Glaz (Reference Colella and Glaz1985) on the need for reliable approximations in treating real-gas EoS.
1.3 Focus and approach
Many different types of variations from ideal-gas flow behaviour are described as real-gas phenomena. Included are viscous flows, flows with heat and/or mass transport, and flows with various types of relaxation processes such as molecular vibrational excitations, dissociations, a wide variety of other chemical reactions, electronic excitations and ionization. In this paper, those non-equilibrium processes are not addressed. Here, the focus is on inviscid, compressible flows with equilibrium conditions that do not satisfy the ideal-gas law,
 $p=\unicode[STIX]{x1D70C}RT$
, and with enthalpy and internal energy dependent on pressure
 $p$
as well as temperature
 $T$
. For continuous flows, no non-equilibrium conditions are considered; while for the normal shock wave, the thin zone of
 $O(10^{-7})$
nm in thickness with molecular translational and rotational non-equilibrium is treated as a mathematical discontinuity.
Here, the descriptions ideal gas and perfect gas are considered to be identical for a gas that satisfies
 $p=\unicode[STIX]{x1D70C}RT$
and undergoes a duration of molecular collision that is negligibly short compared to the mean travel time between consecutive collisions. (This equivalent usage is common in the fields of fluid mechanics and gas kinetic theory but is not accepted in some other fields.) Furthermore, the ideal gas is considered to be calorically perfect (i.e. with constant specific heats). The simplification in the connectivity of the ideal-gas EoS to the fluid equations for conservation of mass, momentum and energy can only be fully appreciated after connecting the real-gas EoS to those equations of fluid motion. Treatment of the ideal gas is immensely simplified by the fact that four key quantities are directly proportional to each other: temperature, pressure-to-density ratio, specific enthalpy and sound speed squared, namely,
 $c^{2}=(\unicode[STIX]{x1D6FE}-1)h=\unicode[STIX]{x1D6FE}p/\unicode[STIX]{x1D70C}=\unicode[STIX]{x1D6FE}RT$
. Three independent ratios for these four quantities are constant in time and uniform in space for the ideal gas. This should be seen as extremely fortuitous. On the contrary, for a real gas, these ratios can vary significantly. Consequently, findings for an ideal gas that have come to be treated as ‘law’ are known from real-gas analysis not to hold generally.
In the analysis here, a widely accepted form of the cubic EoS is used. Isentropic expansions and compressions are considered; application examples include flow through choked nozzles, but nonlinear acoustical wave propagation and modified Riemann invariants are also addressed. The non-isentropic jumps across a shock wave provide another example. A wide range of stagnation temperatures are considered, which does have interesting and relevant consequences. An expansion in parameter space is used that more clearly identifies the effects of real-gas molecular interactions, both repulsions and attractions. Discussion is avoided for pressure and temperature domains where two phases or a compressible liquid exist. They deserve special separate attention.
The paper is organized as follows. Section 2 describes the basic thermodynamic foundations for the EoS, the enthalpy departure function and the determination of sound speed. The new linear expansion in the thermodynamic parameters is explained. Using that mathematical linearization, isentropic flow expansions and compressions are analysed in § 3. Applications to choked-nozzle flow, wave propagation and shock waves are given in §§ 4–6, respectively. Concluding remarks follow in § 7.
2 The thermodynamic foundation for compressible flow at high pressures
As a basis for analysis of compressible flow, three quantities which appear in the equations of motion directly or implicitly must be related: enthalpy
 $h$
, pressure-to-density ratio
 $p/\unicode[STIX]{x1D70C}$
and sound speed
 $c$
. The following subsections discuss the more complex real-gas behaviour because of the importance of intermolecular forces at high pressures and densities. Still, in the analysis here, certain effects such as molecular vibration and dissociation are neglected.
2.1 Real-gas equation of state
For analysis of compressible flow at very high pressures, corrections to the ideal-gas relations are needed in the supporting thermodynamics theory. Amongst other issues, many classical relations no longer apply in their original forms. In particular, adjustments are needed for the equations of state that describe density (or specific volume), enthalpy, and sound speed as functions of pressure, temperature and composition.
Poling et al. (Reference Poling, Prausnitz and O’Connell2001) presents several equation-of-state formulations, including the well-known cubic EoS by van der Waals, Peng and Robinson, and Redlich and Kwong, governing the compressibility factor
 $Z\equiv pv/(R_{u}T)=p/(\unicode[STIX]{x1D70C}RT)$
. Variations of the Redlich–Kwong EoS have been advanced by Chueh & Prausnitz (Reference Chueh and Prausnitz1967a
,Reference Chueh and Prausnitz
b
) and by Soave (Reference Soave1972). For an ideal gas,
 $Z=1$
everywhere, while, for a real gas, it may vary with space and time. Like any EoS in a system together with conservation equations, the cubic equation presents molar specific volume
 $v$
or mass density
 $\unicode[STIX]{x1D70C}$
as an implicit function of pressure
 $p$
and temperature
 $T$
. In addition, an enthalpy departure function gives the difference between the enthalpy for the ideal gas and the enthalpy for the real gas at any given pressure and temperature. Essentially, there is a pair of state equations, one for density and another for enthalpy
 $h$
. The developments proposed here may be done with any of these cubic EoS but only one is chosen here. In particular, the analysis proceeds with the Soave–Redlich–Kwong (SRK) cubic EoS, which is known for accuracy over a wide range of important applications. For example, Lapuerta & Agudelo (Reference Lapuerta, Ballesteros and Agudelo2006) compared several real-gas EoS with experimental results relevant to diesel engine combustion and showed that the SRK EoS gave the best agreement.
The SRK EoS for a single-component fluid is
 $$\begin{eqnarray}Z^{3}-Z^{2}+(A-B-B^{2})Z-AB=0,\end{eqnarray}$$
where
 $$\begin{eqnarray}\displaystyle & \displaystyle Z\equiv \frac{pv}{R_{u}T}=\frac{p}{\unicode[STIX]{x1D70C}RT}, & \displaystyle\end{eqnarray}$$
 $$\begin{eqnarray}\displaystyle & \displaystyle A\equiv \frac{ap}{(R_{u}T)^{2}}, & \displaystyle\end{eqnarray}$$
 $$\begin{eqnarray}\displaystyle & \displaystyle B\equiv \frac{bp}{R_{u}T}, & \displaystyle\end{eqnarray}$$
 $$\begin{eqnarray}\displaystyle & \displaystyle a\equiv 0.42748\frac{(R_{u}T_{c})^{2}}{p_{c}}[1+S(1-T_{r}^{0.5})]^{2}, & \displaystyle\end{eqnarray}$$
 $$\begin{eqnarray}\displaystyle & \displaystyle b\equiv 0.08664\frac{R_{u}T_{c}}{p_{c}}, & \displaystyle\end{eqnarray}$$
 $$\begin{eqnarray}\displaystyle & \displaystyle T_{r}\equiv \frac{T}{T_{c}}, & \displaystyle\end{eqnarray}$$
 $$\begin{eqnarray}\displaystyle & \displaystyle S\equiv 0.48508+1.5517\unicode[STIX]{x1D714}-0.15613\unicode[STIX]{x1D714}^{2}. & \displaystyle\end{eqnarray}$$
Here
 $R$
and
 $R_{u}$
are the specific and universal gas constants, respectively; and subscript
 $c$
denotes a thermodynamic critical value. The coefficients
 $a$
and
 $b$
(and therefore
 $A$
and
 $B$
) relate, respectively, to intermolecular attraction and repulsion. The second and third constant coefficients in the polynomial for
 $S$
differ slightly from the original Soave (Reference Soave1972) values. They are updated values by Graboski & Daubert (Reference Graboski and Daubert1978), which were also used by Meng & Yang (Reference Meng and Yang2003). (A different functional form is recommended for hydrogen; while discussion of gases with differing mathematical description is omitted to avoid distraction from the main themes, the approach is easily extendable to consider them.) In the domain of pressure and temperature where both gas and liquid exist in equilibrium, there is a solution of (2.1) for each phase; thus, two different, physically meaningful
 $Z$
values can result. Since
 $p$
and
 $T$
are identical for each phase, the implication is that there are two values for the specific molar volumes
 $v_{g}$
and
 $v_{l}$
and thereby for the mass densities
 $\unicode[STIX]{x1D70C}_{g}=W/v_{g}$
and
 $\unicode[STIX]{x1D70C}_{l}=W/v_{l}$
; where
 $W$
is the molar mass. A range of values is considered for
 $p$
and
 $T$
where only one phase exists and therefore only one interesting solution to the cubic equation exists (complex roots are ignored). At supercritical conditions, there are ranges of
 $p$
and
 $T$
where a compressible fluid exists without discontinuities in properties and may still be labelled as a gas. Thus, reference to
 $\unicode[STIX]{x1D70C}$
and other properties are made with the understanding they apply to a gas.
The properties for flows of gaseous mixtures are not calculated here; however, the extension for that situation is straightforward (Poling et al. Reference Poling, Prausnitz and O’Connell2001).
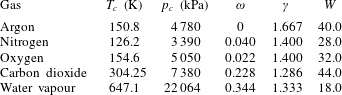
Table 1 presents critical temperature
 $T_{c}$
, critical pressure
 $p_{c}$
, acentric factor
 $\unicode[STIX]{x1D714}$
, ratio of specific heats for the ideal gas
 $\unicode[STIX]{x1D6FE}$
, and molecular mass
 $W$
for selected gases. Monatomic, diatomic and triatomic species are considered. In the calculations in the following sections, argon, nitrogen and carbon dioxide are analysed. Values of
 $\unicode[STIX]{x1D6FE}$
,
 $c_{p}$
and
 $c_{v}$
pertain only to the ideal-gas EoS. For example, as shown by (B 1),
 $c_{p}$
will not be the partial derivative of enthalpy with respect to temperature for a real gas. It will be that derivative only for an ideal gas and it retains only that meaning when used in the real-gas enthalpy relation.
Values for critical temperature, critical pressure, acentric factor and ratio of specific heats.

There is no obvious way to reduce the mathematical descriptions of different gases to a similar form for ease of calculation. For example, even if pressure and temperature are normalized, and
 $p/p_{c}$
and
 $T/T_{c}$
are treated, the gases differ significantly through three other parameters in table 1.
2.2 Linearized treatment of real-gas equation of state
The cubic EoS can be solved exactly for the compressibility factor
 $Z$
in terms of parameters
 $A$
and
 $B$
. Some 500 years ago, mathematicians S. del Ferro and N. Tartaglia obtained solutions for the cubic equation in a form involving cubic roots of functions formed as an algebraically elaborate collection of coefficients in the original equation. The exact solution is not useful in flow analysis. Firstly, the dependence of the coefficients of the cubic equation on unknown variables such as pressure, temperature and (for multicomponent flows) composition creates a higher-order system; i.e. there are couplings with other differential equations. Thereby, an iterative approach is required. Secondly, in a flow that develops in space and/or time, it is preferred to iterate about the solution at a prior time step or mesh point rather than returning to decide which of the cubic equation solutions to choose. The known additional computational challenges for real-gas, compressible-flow computation and the need for reliable approximations were addressed in § 1.2 with references to Colella & Glaz (Reference Colella and Glaz1985), Kouremenos (Reference Kouremenos1986), Drikakis & Tsangaris (Reference Drikakis and Tsangaris1993) and Arina (Reference Arina2004).
Approximations through perturbation expansions have been attempted. Tsien (Reference Tsien1946) used a linearization concept which differs from this work in several key features. The modern cubic equations were not available at that time; he used the van der Waals EoS where the parameter
 $a$
was a constant whereas the modern versions have
 $a(T)$
, i.e. a function of temperature
 $T$
, as shown by (2.8). Also, the important effects of internal energy and enthalpy departures from the ideal-gas behaviour were missing; among other things, there was no dependence of enthalpy or internal energy upon pressure. Tao (Reference Tao1955) used the Beattie-Bridgeman EoS and perturbation theory with six small parameters to describe the thermodynamics for normal shock analysis. Anand (Reference Anand2012) reports solutions for real-gas shock waves propagating at subsonic velocity. He uses an EoS with a repulsive molecular parameter but without an attractive molecular parameter. Glaister (Reference Glaister1988) and Guardone & Vigevano (Reference Guardone and Vigevano2002) discuss linearization of the numerical algorithms in Riemann problem solvers.
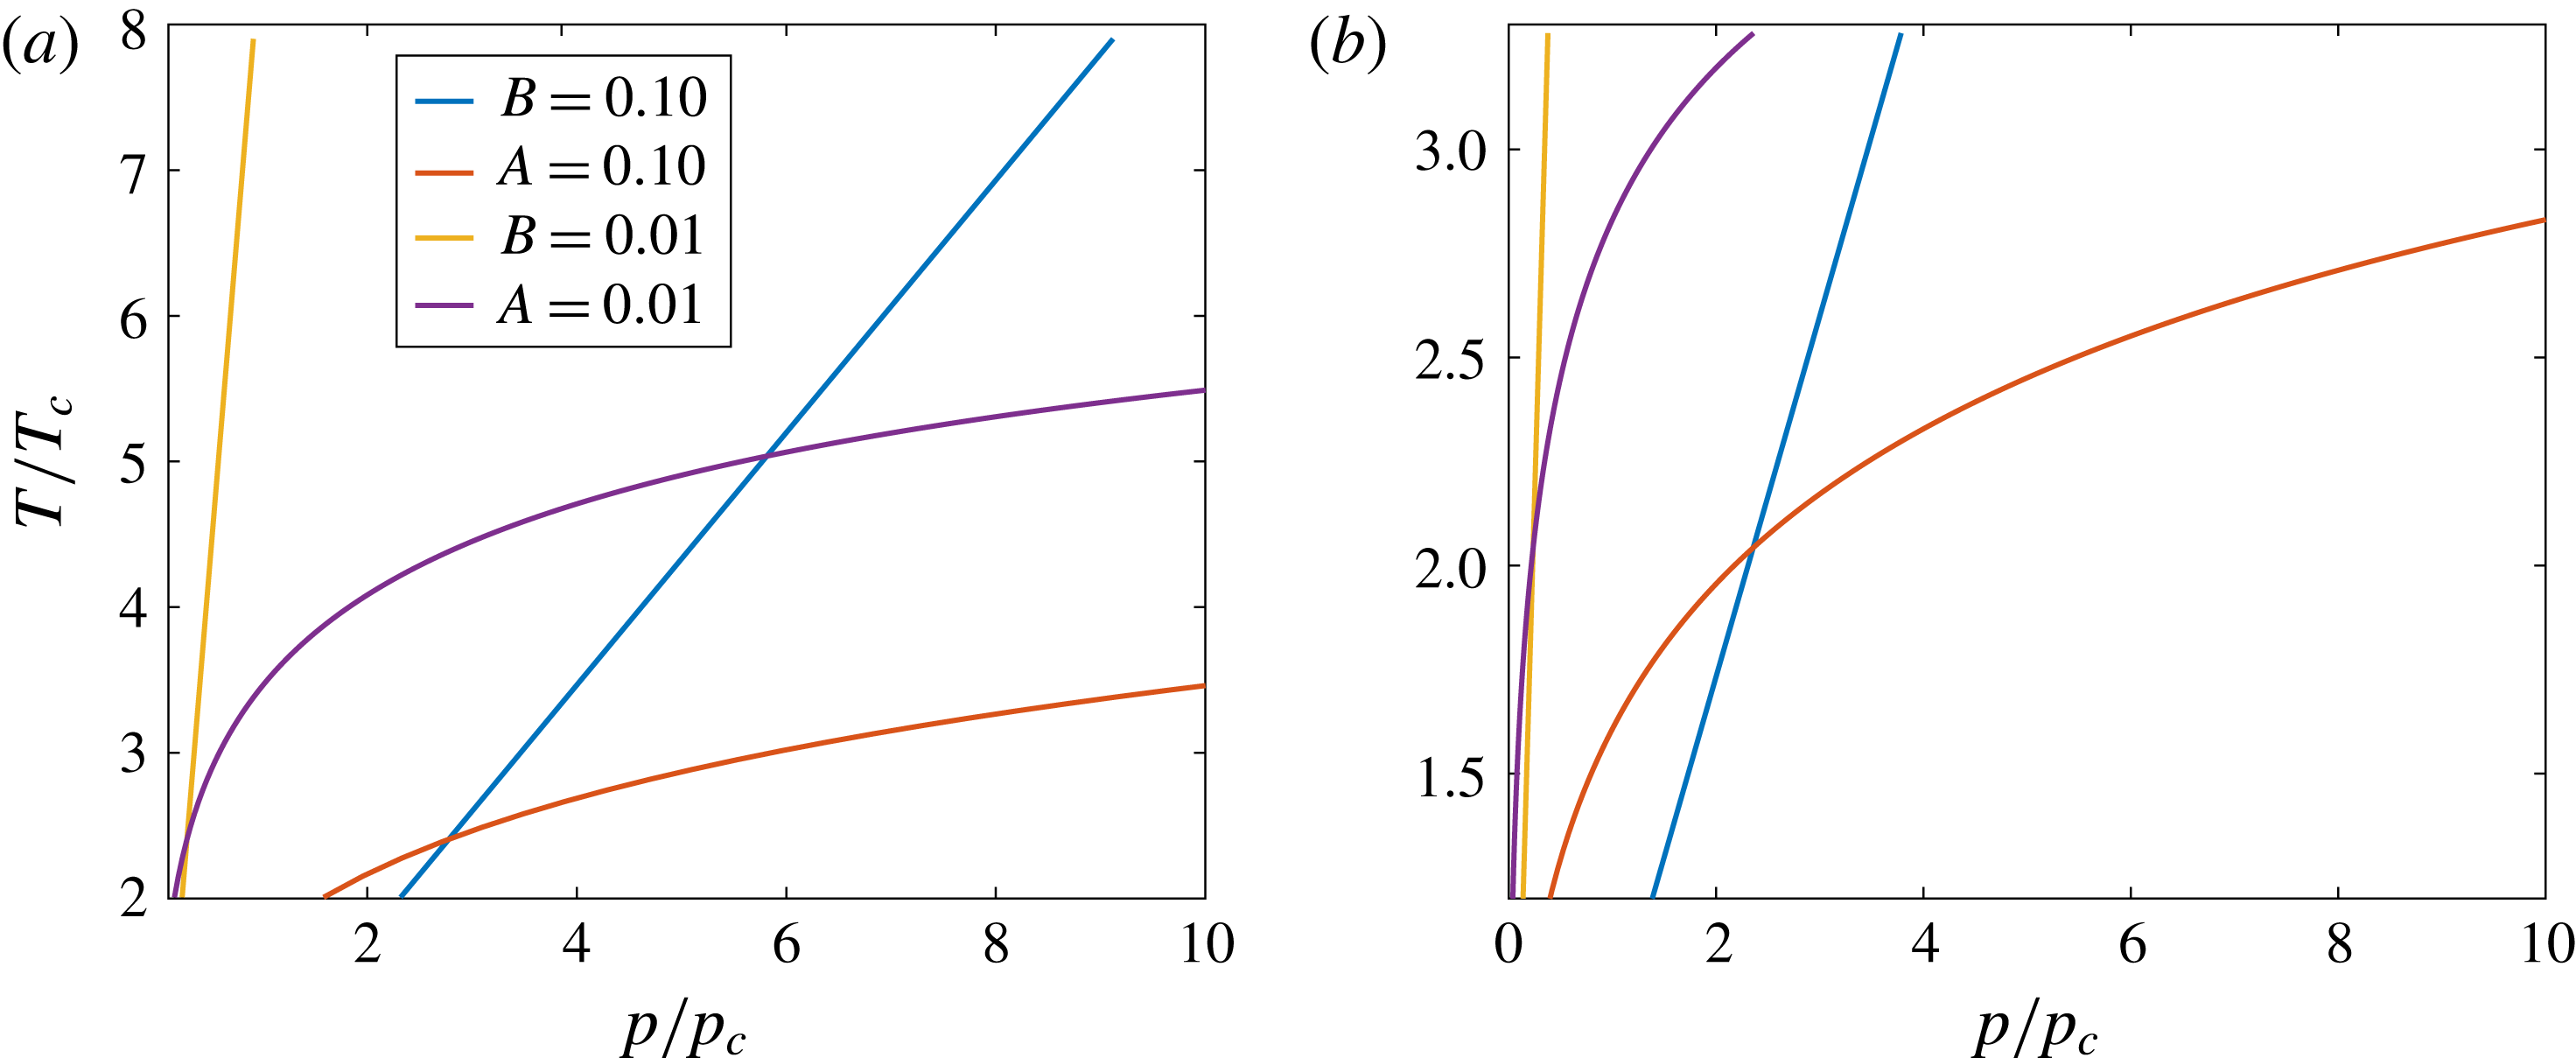
Here, it is shown that for a wide range of practical interest where the fluid temperature is well above the critical value, certain approximate solutions to the cubic EoS give sufficient accuracy and clarity of the physics. Often the parameters
 $A$
and
 $B$
have magnitudes substantially smaller than unity, making
 $Z-1$
also small in magnitude. As one example, consider an application by Jorda-Juanos & Sirignano (Reference Jorda-Juanos and Sirignano2016) where, for a mixture typical in combustion of methane, the temperature exceeds 400 K, and the parameters
 $z\equiv Z-1$
,
 $A$
and
 $B$
are small in magnitude. Specifically, they remain
 $O(10^{-1})$
or less at pressures up to 100 bar. Thereby, a linear perturbation expansion in the three parameters
 $z$
,
 $A$
and
 $B$
provides useful, accurate, simplified algorithms. In particular, neglecting squares and cubes of
 $z$
and products and squares of
 $A$
and
 $B$
, (2.1) can be simplified to
 $$\begin{eqnarray}\displaystyle Z\approx 1+B-A. & & \displaystyle\end{eqnarray}$$
The parameter
 $a$
and therefore
 $A$
represent the effects of intermolecular attraction; so, an increase in
 $A$
by itself would increase density at fixed temperature, pressure and composition. On the other hand, the parameter
 $b$
and therefore
 $B$
represent the effects of intermolecular repulsion; so, an increase in
 $B$
by itself at otherwise fixed conditions would decrease density. The linear form of the EoS given by (2.9) explains the impact of the molecular physics on the continuum properties in much clearer fashion than the original cubic EoS. Of course, in addition, it simplifies the flow analysis and carries the dependence on the molecular parameters in a much more informative fashion. The reasonable assumption is made that all flow variables are analytic in the fluid properties. (For the case with shock waves, we mean piecewise analytic.) And a small parameter never appears before the highest derivative. Thereby, the flow variables are calculated with accuracy to order of
 $A$
and
 $B$
and with error of order
 $A^{2}$
,
 $AB$
and
 $B^{2}$
. In appendix A, it is shown that the accuracy of that approximation in (2.9) can be maintained over a substantial parameter domain of interest. While density depends simply on
 $B-A$
here, the enthalpy and sound speed depend on
 $A$
and
 $B$
in different ways as well as depending on derivatives of
 $a(T)$
introduced through the functions
 $A^{\prime }$
and
 $A^{\prime \prime }$
, which are defined in appendix B, where the real-gas enthalpy relation is presented.
If the linear perturbations in (2.9) are neglected, the ideal-gas equation, i.e.
 $Z=1$
, is obtained. This linear form does not apply for two-phase domains or for the supercritical domain where a compressible-liquid behaviour occurs. The above-mentioned lower bound on temperature avoids these regions. At some temperatures and pressures,
 $Z-1$
might be small but
 $A$
and
 $B$
might not be sufficiently small to neglect higher-order terms in the cubic equation; thus, bounds on
 $A$
and
 $B$
individually are necessary here.
While other forms of the cubic EoS, including the original van der Waals equation and the more recent Peng–Robinson form of the cubic equation, differ from the Redlich–Kwong form presented here, they produce exactly the same linear approximation as given by (2.9). There is only a difference with the Peng–Robinson linearized version in the
 $S$
parameter, which affects the value of
 $A$
but not its order of magnitude. The van der Waals equation does not contain the added temperature dependence in the
 $a$
parameter. Consequently, the definition of
 $A$
in the linear version is different. In summary, our analysis here provides a template for linearization of the Peng–Robinson model and several other similar models.
The linear solution to the cubic equation reduces computational effort in flow-field calculations. In the context of the flow calculation, exact solution of the cubic equation requires an iterative process. The solution to a system of differential equations already requires iteration of some kind to get a well-converged solution as time is advanced at each step. If at each point in time and space another iteration were added within the finite-difference (or finite-volume) iteration, a substantial increase in computational resources would be needed.
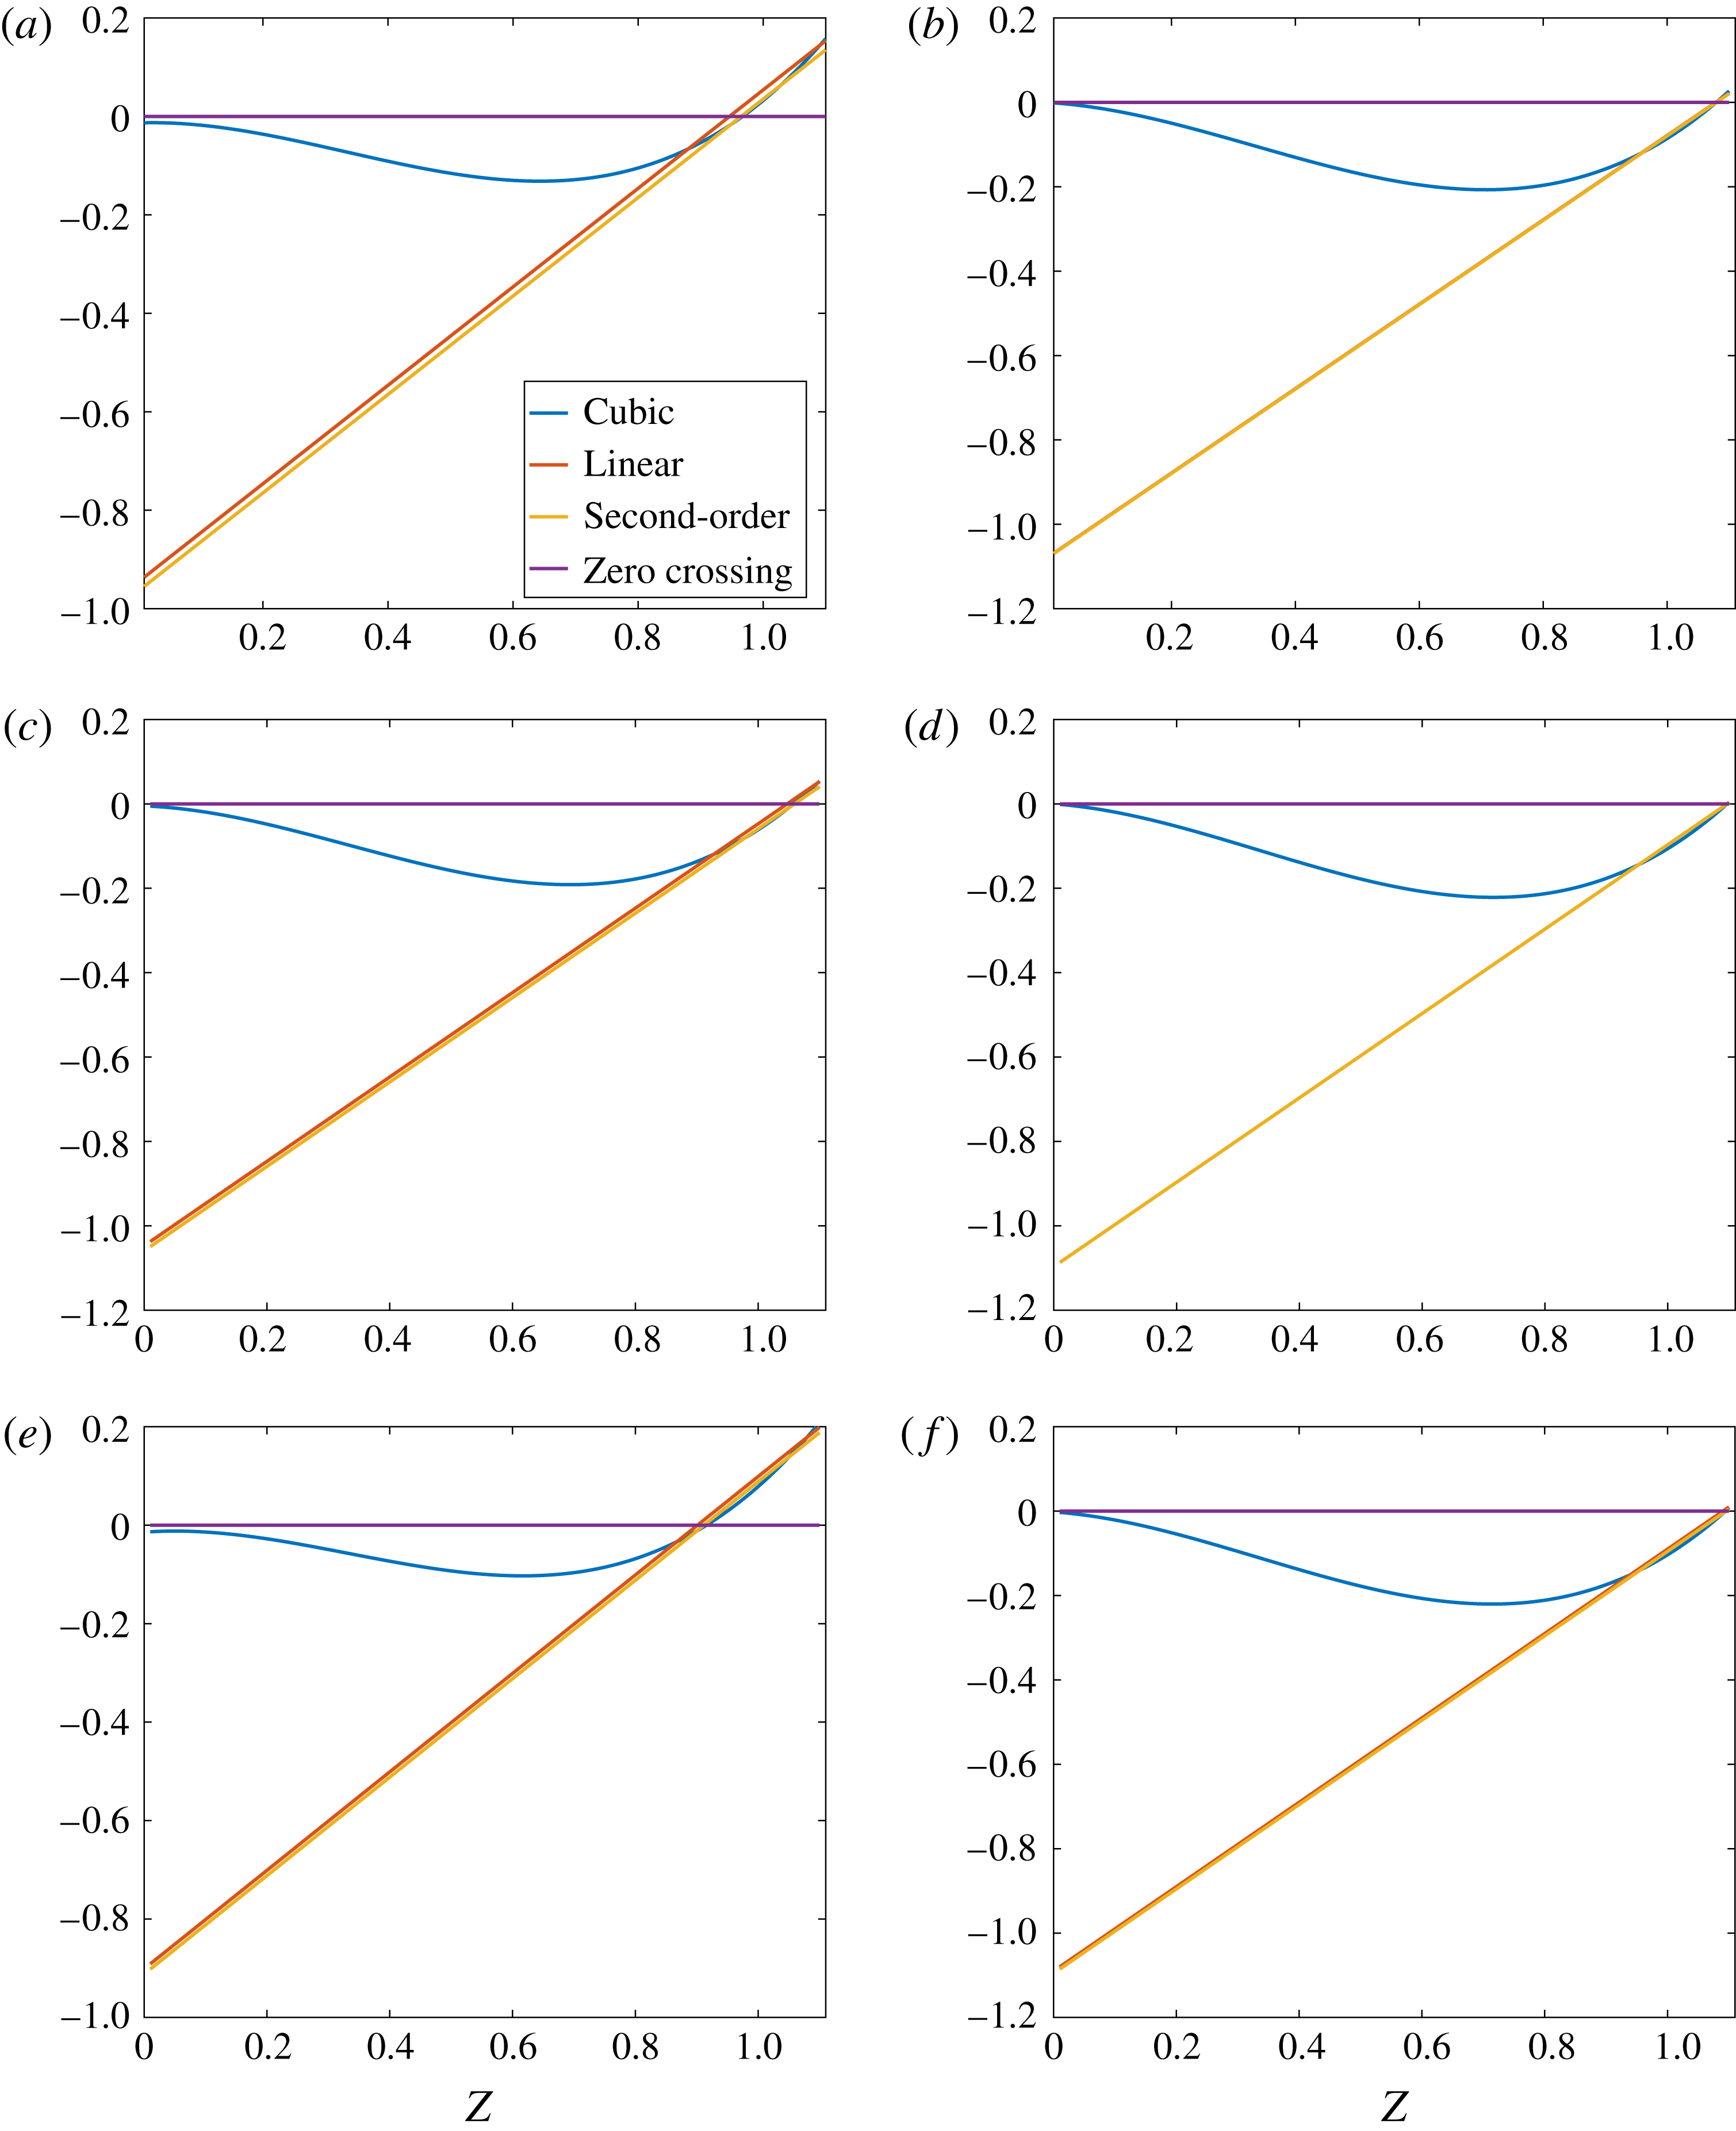
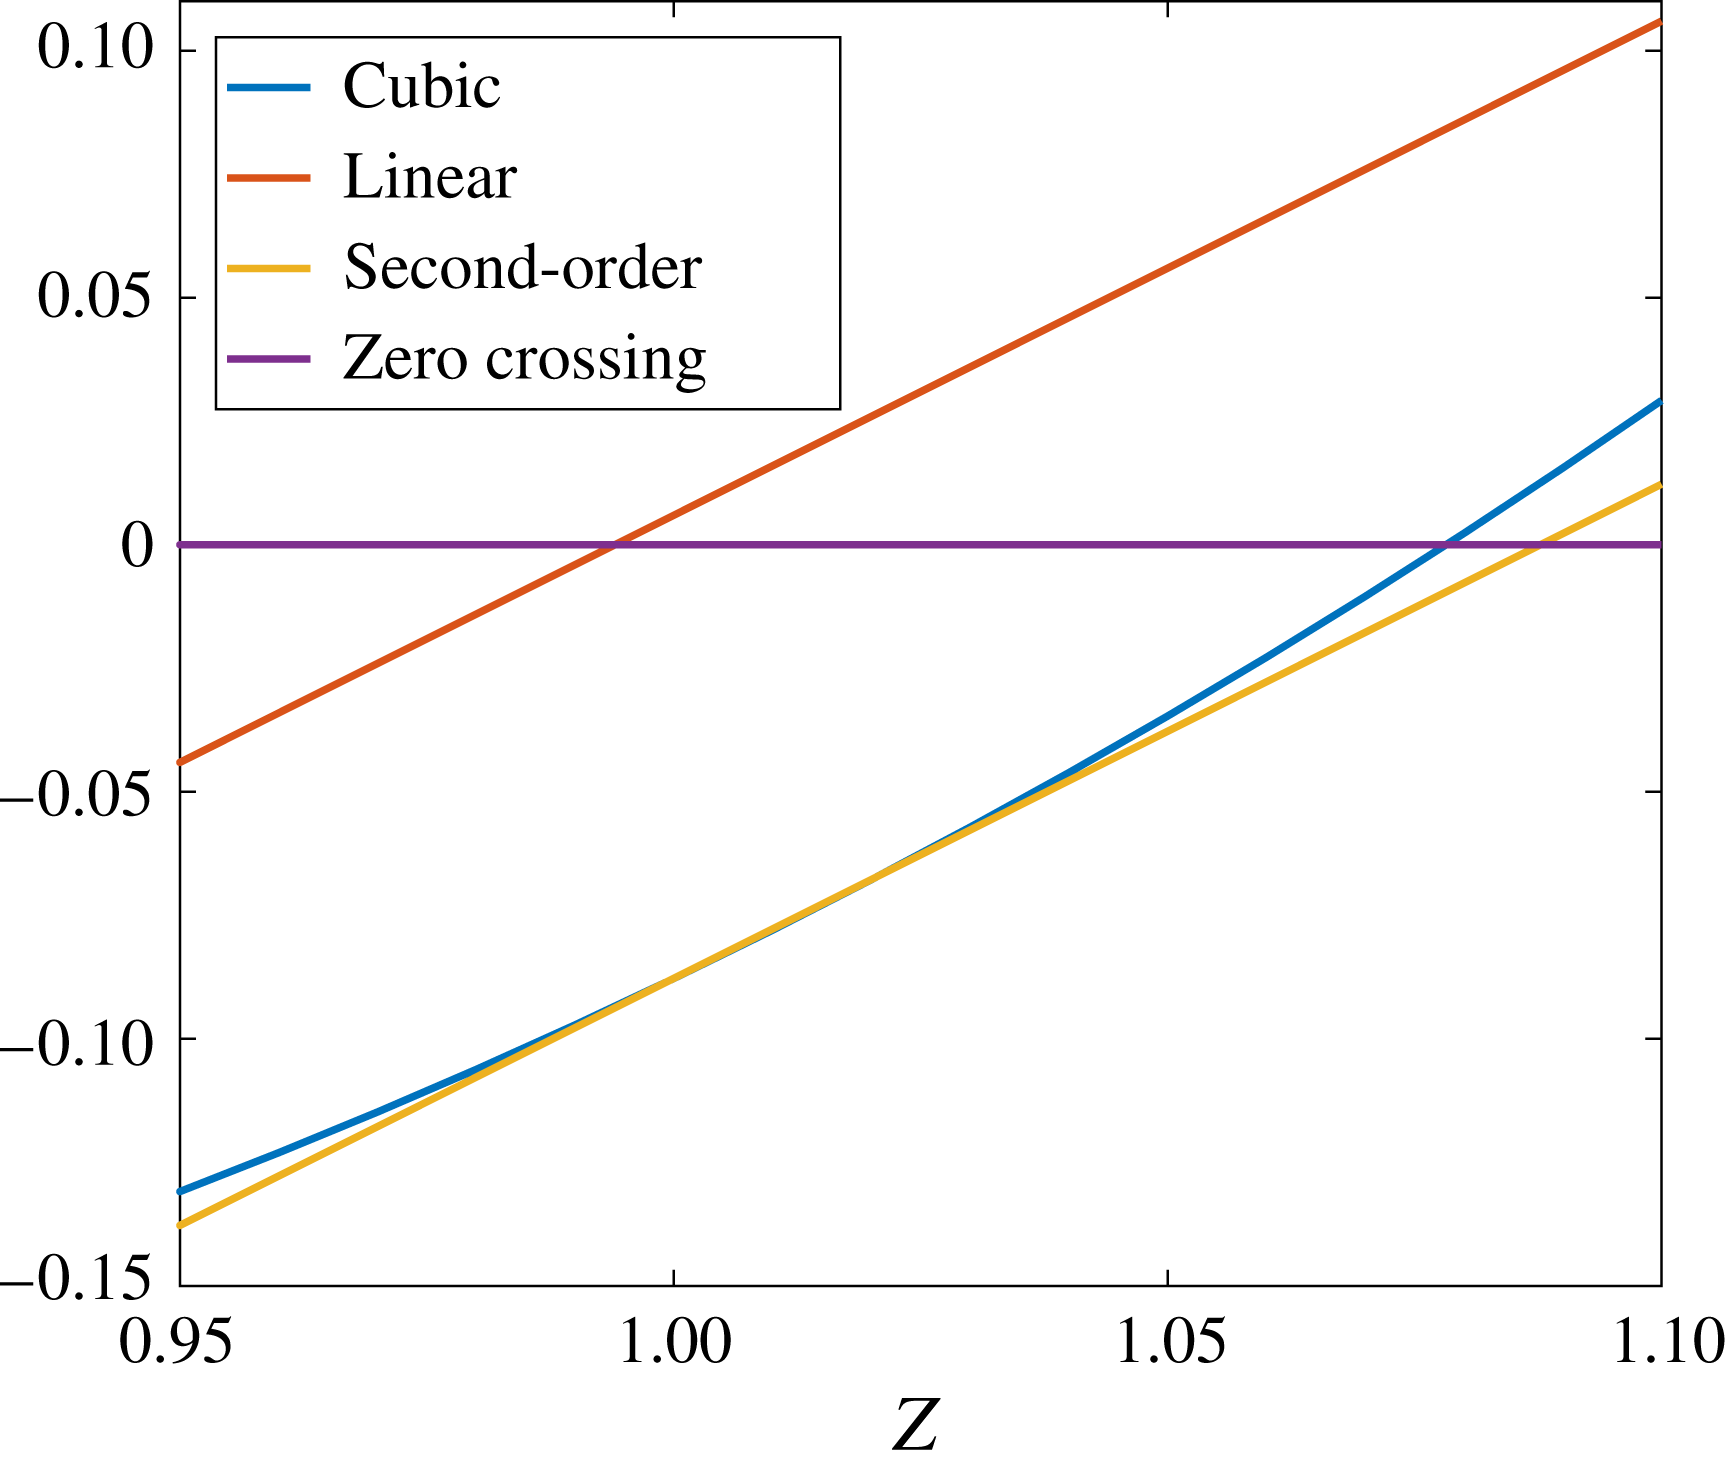
Further analysis and development of the linearization is provided in the appendices. In appendix A, a comparison is made between the exact solution and the linear solution of the cubic EoS. It is shown there that the linear solution can accurately give the solution to the cubic equation which yields the lowest density and therefore is most applicable to compressible flow. The parameter domain where the accuracy is acceptable is identified. It is also shown in appendix A that an iterative approach can yield a higher-order solution which has greater accuracy and yields a much larger domain of validity. The linear treatment is extended to the enthalpy and the speed of sound in appendices B and C, respectively.
3 Isentropic expansions and compressions
In this section, the various thermodynamic variables and the velocity are determined as functions of pressure. Isentropic relations are used; thus, stagnation values are fixed. Results are presented in a form that uses stagnation pressure and temperature for normalization. Thus, for an ideal gas, the non-dimensional results do not vary with these stagnation quantities; however, for a real gas, variations occur. These relations describe isentropic expansions and compressions. In our analysis, the entropy value is implicitly determined by the choices of stagnation temperature
 $\hat{T}$
and stagnation pressure
 $\hat{p}$
values. Then, it remains constant throughout the expanding or compressing flow.
Foundations are laid in appendix D where the linear relations are used to relate specific functions to pressure for isentropic and isoenergetic variations in a flow. Specifically, density, enthalpy, temperature, velocity and sound speed are determined as functions of pressure. While these functions are linear in parameters
 $A$
and
 $B$
and their derivatives, the dependences on pressure are strongly nonlinear.
3.1 Results for isentropic flow
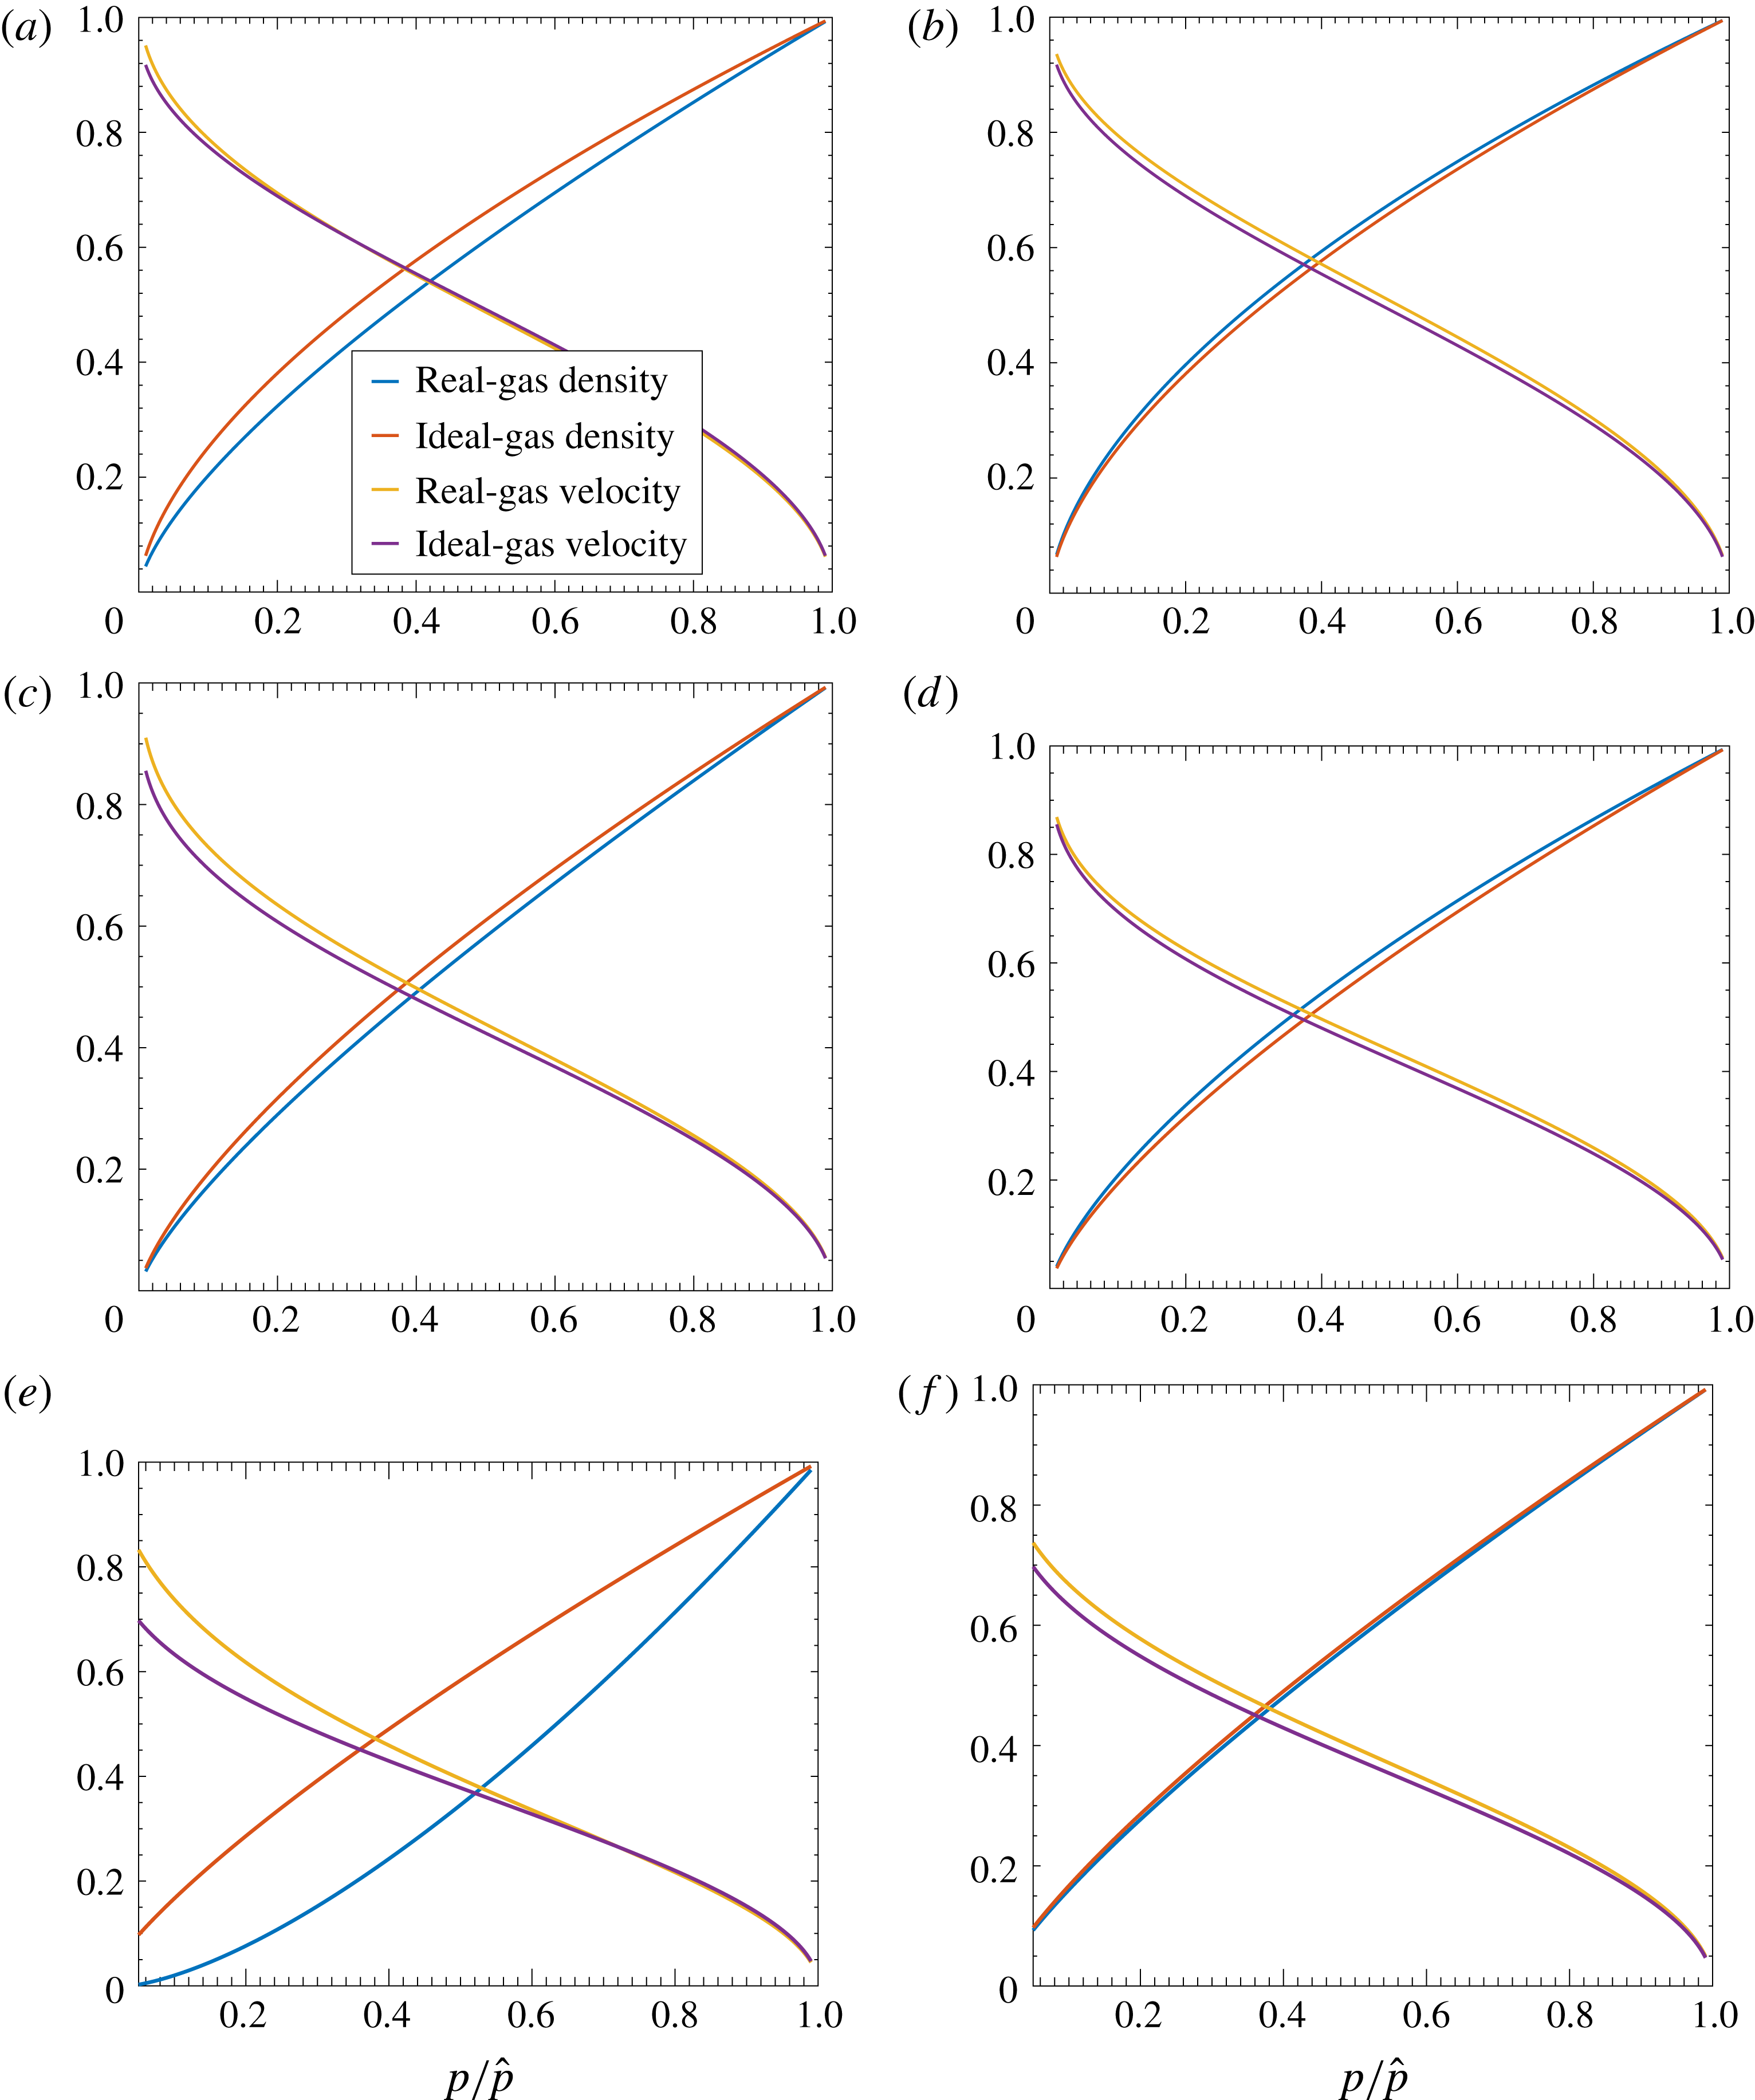
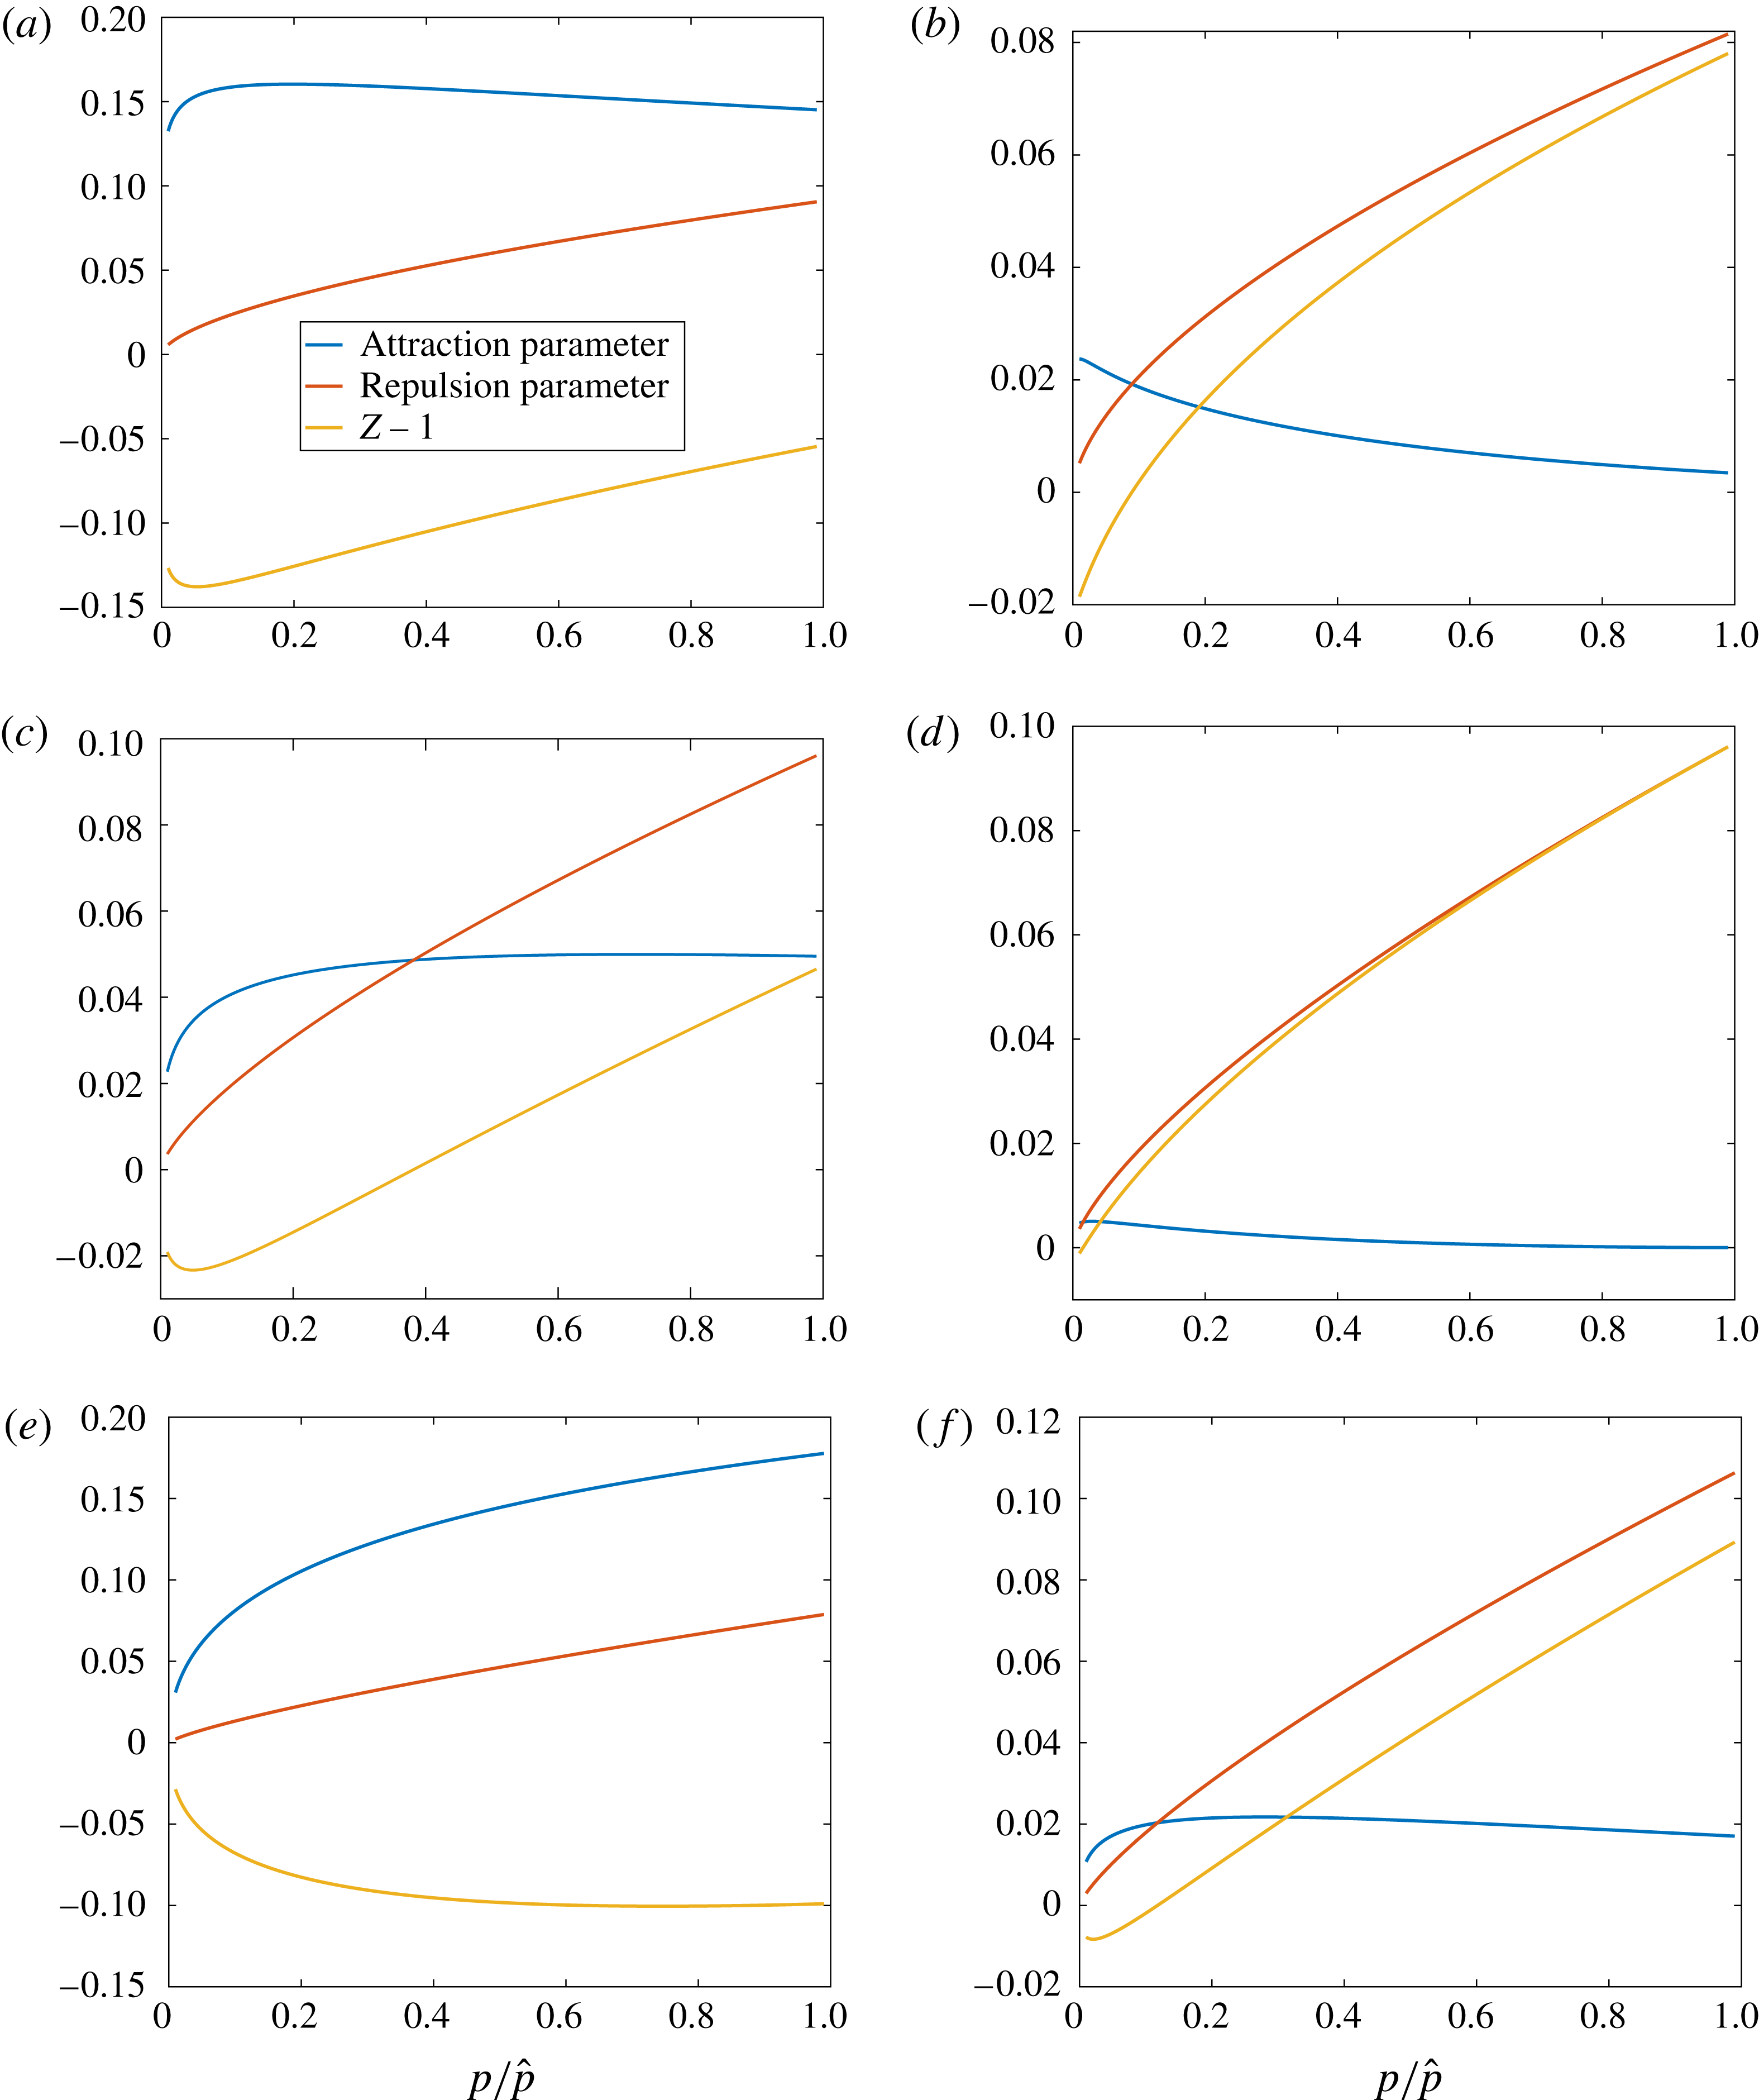
Figure 1 shows argon flow, nitrogen flow and carbon dioxide flow results with non-dimensional values for
 $\unicode[STIX]{x1D70C}$
and velocity
 $u$
as functions of the normalized
 $p$
for six cases, two for each gas. Comparisons are made with ideal-gas results. Although all calculations here involve temperatures and pressures in a range that extends from above to well above standard conditions, including values above the critical values, the cases of figure 1(a,c,e) are identified as ‘lower-temperature’ cases while figure 1(b,d,f) present the ‘higher-temperature’ cases. For the higher-temperature cases, the maximum
 $Z$
occurs at the highest pressure of 30 MPa. The normalized density is higher for the real gas than for the ideal gas; however, the two stagnation densities used for normalization differ by the factor
 $\hat{Z}$
, which is the compressibility factor at the stagnation condition. (Pressure, temperature, enthalpy, velocity and sound speed are all normalized by the same values for the real and ideal gases; normalization of density is different.) Thus, the dimensional real-gas density is actually lower than the ideal-gas value. For example, for nitrogen in figure 1(d), the normalized density is a few per cent higher for the real gas. However,
 $\hat{Z}=1.097$
; thus, the real-gas dimensional density is approximately 8 % lower than the ideal-gas value in the mid-range of the expansion. For the lower-temperature cases, the value of
 $\hat{Z}$
can fall below the ideal-gas value. For example, with carbon dioxide in figure 1(e), the real-gas normalized density is a few per cent higher than the ideal-gas normalized density. However, here
 $\hat{Z}=0.901$
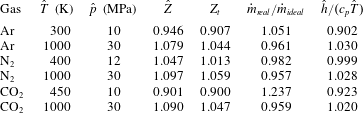
as shown in table 2. Thus, the stagnation density for the real gas is 11 % higher than for the ideal gas and the dimensional real-gas density exceeds the ideal-gas density by approximately 15 % in the mid-pressure range. In this lower temperature range, the attractive molecular forces that influence
 $A$
are more effective than the repulsive forces that influence
 $B$
. The effect of the variation of
 $\hat{Z}$
from the ideal-gas value is most significant here on density. At high pressures, the intermolecular forces prevent the increase of density in proportion to the pressure as would occur with the ideal gas. In the next section, the consequence for mass flow through a choked nozzle is shown.
Solutions for non-dimensional density and velocity versus non-dimensional pressure: (a) argon, 300 K, 10 MPa; (b) argon, 1000 K, 30 MPa; (c) nitrogen, 400 K, 12 MPa; (d) nitrogen, 1000 K, 30 MPa; (e) carbon dioxide, 450 K, 10 MPa; (f) carbon dioxide, 1000 K, 30 MPa.

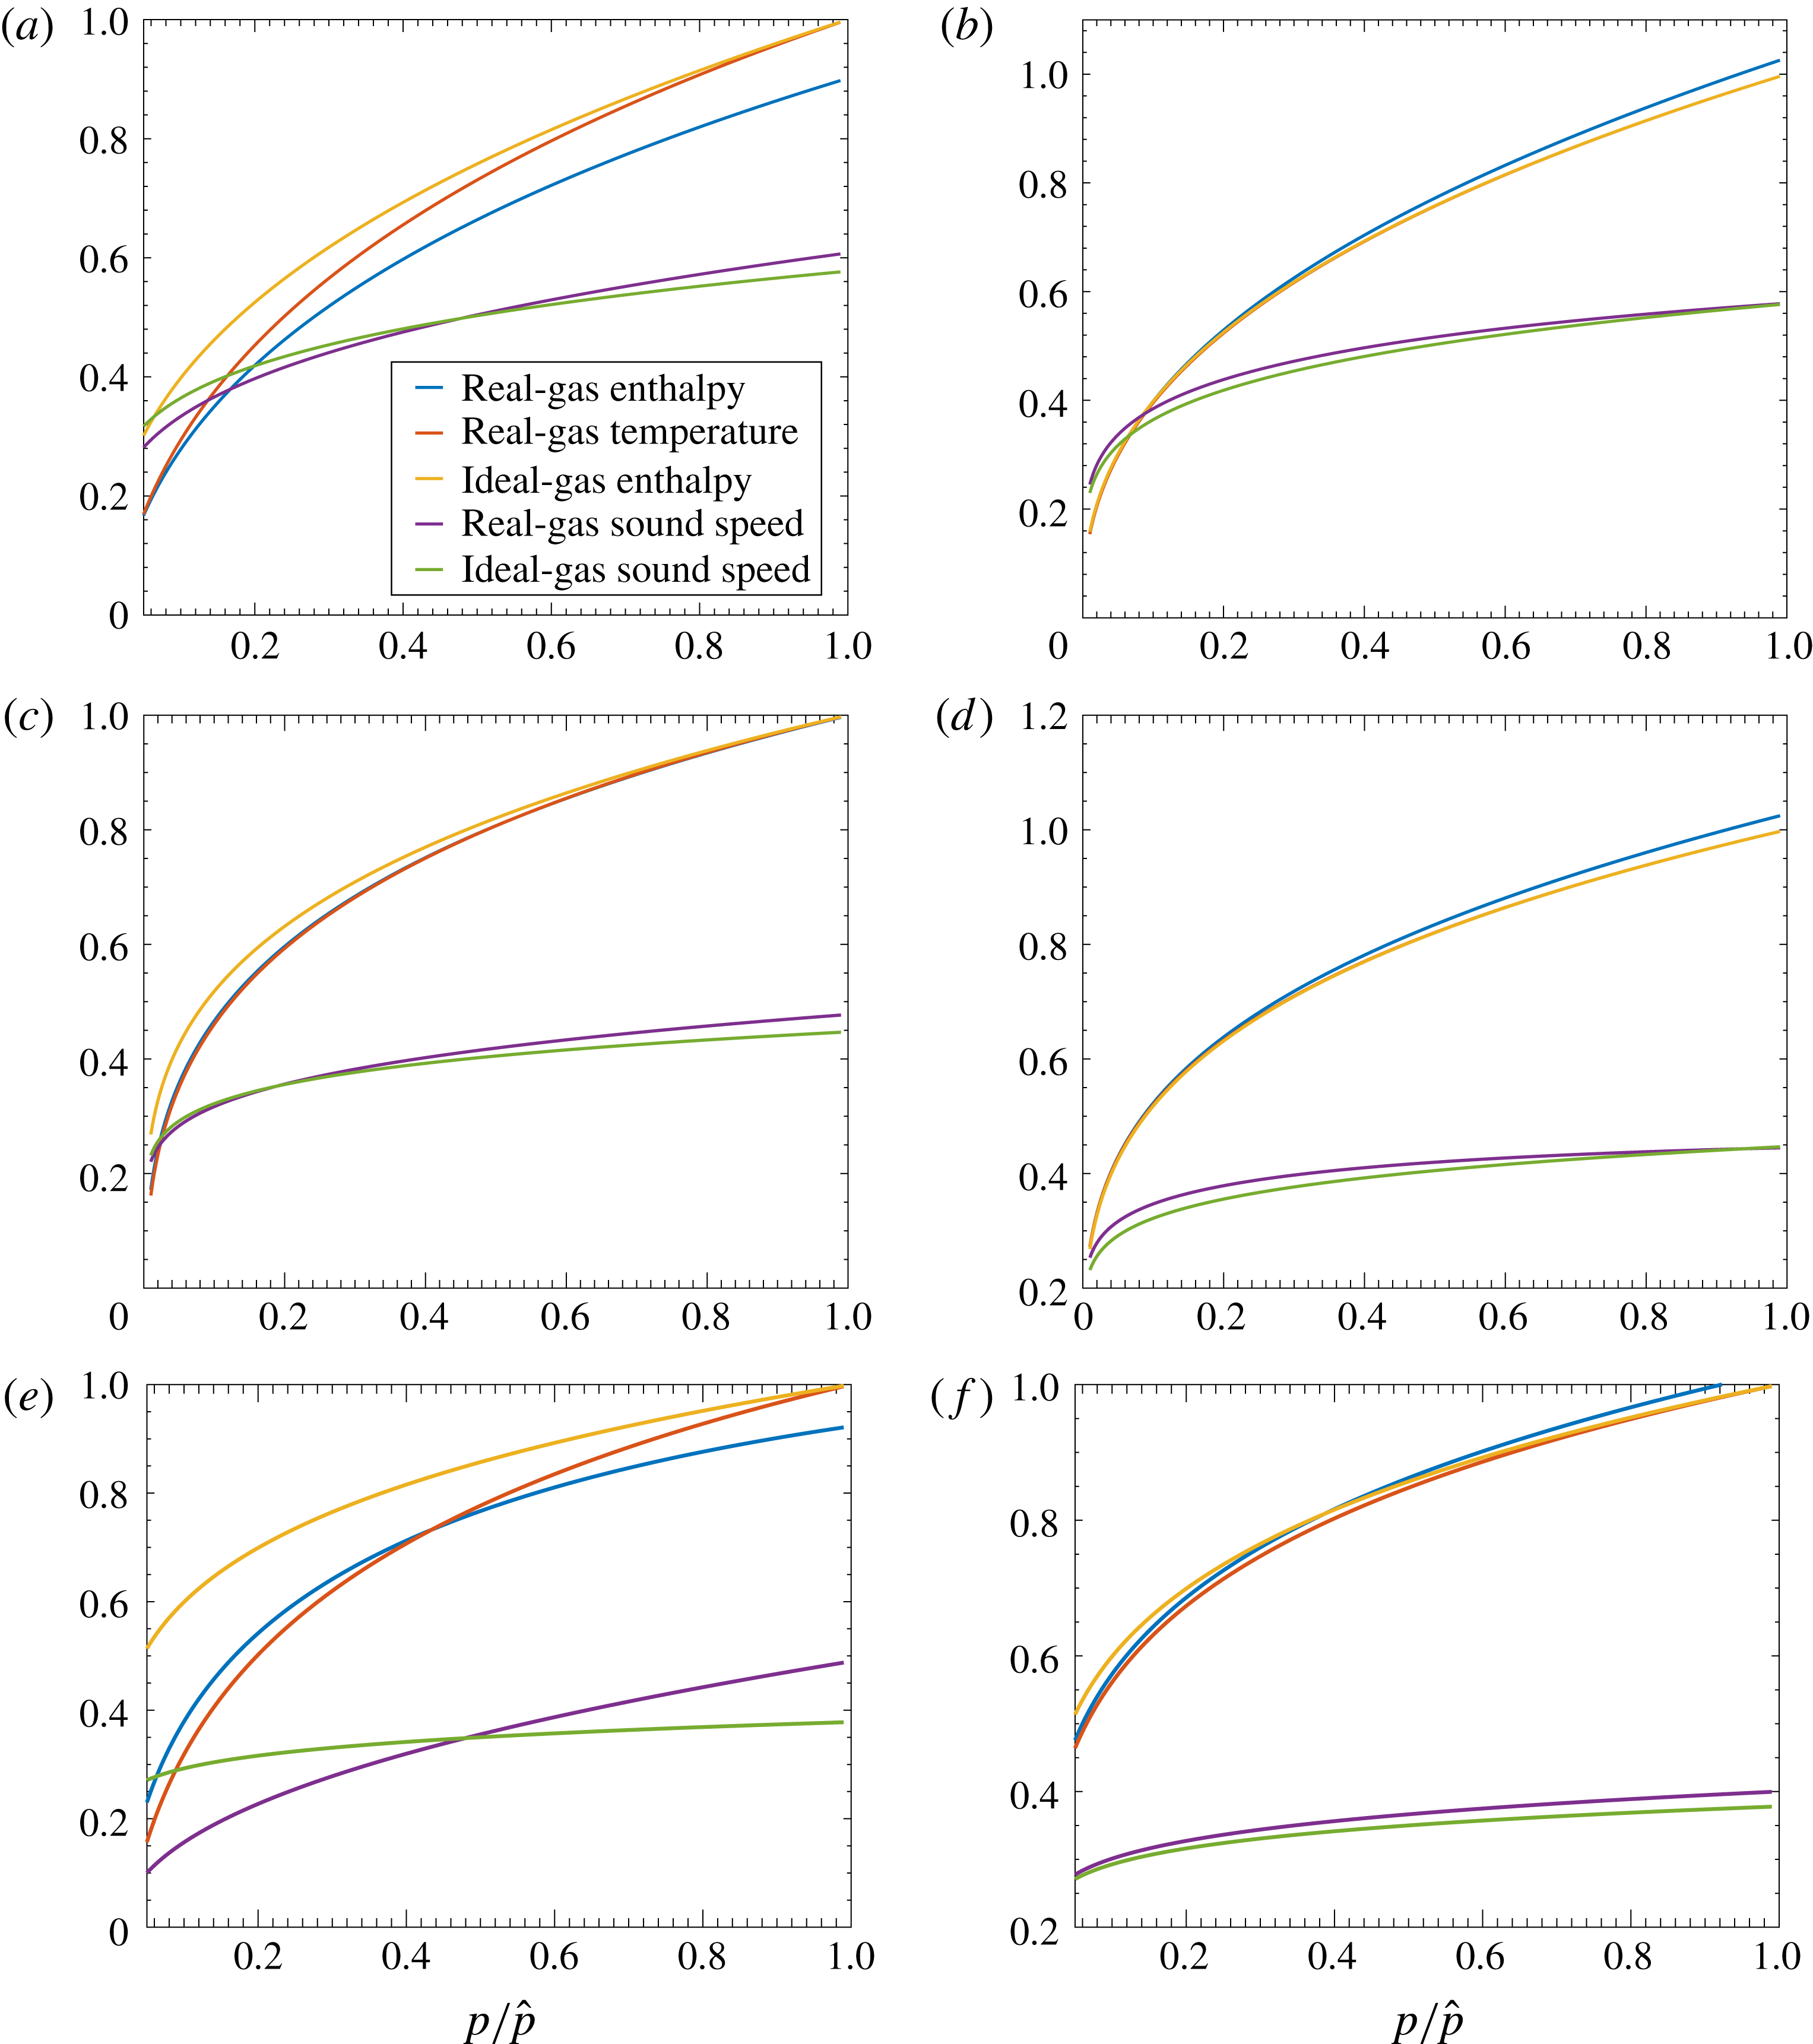
The real-gas velocity generally exceeds the ideal-gas value for both the higher and lower stagnation temperature cases. Accordingly, figure 2 shows that the real-gas enthalpy decreases faster than the ideal-gas enthalpy with decreasing pressure. The stagnation enthalpy for the same stagnation temperature differs between the real and ideal gases.
As table 2 indicates, the cases at higher stagnation temperature generally have real-gas enthalpy exceeding the ideal-gas enthalpy, while the cases at lower stagnation temperature sometimes have real-gas enthalpy values below the ideal-gas enthalpy values. The kinetic energy that can manifest from an expansion increases with increasing stagnation enthalpy.
Comparison between ideal-gas flow and real-gas flow: compressibility factors and ratios for stagnation enthalpy and mass flux.

Enthalpy and temperature for isentropic flows of argon, nitrogen and carbon dioxide are presented in figure 2 as functions of the non-dimensional pressure for both the real and ideal gases. Generally, the normalized real-gas enthalpy differs from the normalized temperature for the real gas by a few per cent for those conditions. The normalized temperatures differ less significantly for the real gas and ideal gas. By construction, normalized temperature equals normalized enthalpy for the ideal gas. At higher stagnation temperatures, the real-gas enthalpy is higher than either the real-gas temperature or the ideal-gas enthalpy (temperature) for the three gases, as seen in figure 2(b,d,f). This implies that there is more energy in the real gas at those same conditions and explains the larger velocity obtained for the real gas in an isentropic expansion. However, a reversal might occur at lower stagnation temperatures, as seen in figure 2(a,c); the ideal-gas enthalpy and temperature values can exceed those for the real gas.
Solutions for non-dimensional enthalpy, temperature and sound speed versus non-dimensional pressure: (a) argon, 300 K, 10 MPa; (b) argon, 1000 K, 30 MPa; (c) nitrogen, 400 K, 12 MPa; (d) nitrogen, 1000 K, 30 MPa; (e) carbon dioxide, 450 K, 10 MPa; (f) carbon dioxide, 1000 K, 30 MPa.

At higher stagnation temperature, the real gas has a higher sound speed than the ideal gas at the same temperature and pressure. At lower stagnation temperatures, the relative magnitudes can be reversed.
4 One-dimensional nozzle flow
The first example of a compressible flow to be studied is isentropic flow through a choked nozzle. One-dimensional steady flow is examined. The results of the previous section can be applied.
For an ideal gas, steady-state or quasi-steady-state flow has the Mach number
 $M$
at the nozzle entrance determined by the ratio of the specific heats
 $\unicode[STIX]{x1D6FE}\equiv c_{p}/c_{v}$
and the ratio of the nozzle-entrance cross-sectional area to the nozzle-throat cross-sectional area
 $A_{e}/A_{t}$
. Detailed analyses of one-dimensional compressible flow appear in many references (e.g. Liepmann & Roshko Reference Liepmann and Roshko1957; Crocco Reference Crocco and Emmons1958; Saad Reference Saad1993). The relation is not as simple for a non-ideal gas described by the cubic EoS (2.1).
Consider here a one-dimensional, steady, inviscid flow without body forces. For a constant mass flux
 ${\dot{m}}=\unicode[STIX]{x1D70C}uA$
, the continuity and momentum relations are
 $$\begin{eqnarray}\displaystyle & \displaystyle \frac{\text{d}\unicode[STIX]{x1D70C}}{\unicode[STIX]{x1D70C}}+\frac{\text{d}u}{u}+\frac{\text{d}A}{A}=0, & \displaystyle\end{eqnarray}$$
 $$\begin{eqnarray}\displaystyle & \displaystyle \unicode[STIX]{x1D70C}u\,\text{d}u+\text{d}p=0. & \displaystyle\end{eqnarray}$$
From (4.1) and (4.2), it can be shown that
 $$\begin{eqnarray}\displaystyle \frac{u}{A}\frac{\text{d}A}{\text{d}u}=\frac{\displaystyle u^{2}-\frac{\text{d}p}{\text{d}\unicode[STIX]{x1D70C}}}{\displaystyle \frac{\text{d}p}{\text{d}\unicode[STIX]{x1D70C}}}. & & \displaystyle\end{eqnarray}$$
At the nozzle throat where
 $A$
reaches a minimum value, the Mach number
 $M=1$
and the local throat velocity is given by
 $u_{t}=\sqrt{(\text{d}p/\text{d}\unicode[STIX]{x1D70C})|_{t}}$
. This result is not based on the isoenergetic or isentropic assumption, so it holds even in the non-adiabatic case. Only friction and body force have been neglected.
If there is no chemical reaction, vibrational relaxation or heat transfer, the flow is isentropic and
 $\text{d}p=c^{2}\,\text{d}\unicode[STIX]{x1D70C}$
. Then, (4.3) yields
 $$\begin{eqnarray}\displaystyle \frac{u}{A}\frac{\text{d}A}{\text{d}u}=\frac{u^{2}-c^{2}}{c^{2}}=M^{2}-1. & & \displaystyle\end{eqnarray}$$
Now, the throat velocity
 $u_{t}=\sqrt{(\unicode[STIX]{x2202}p/\unicode[STIX]{x2202}\unicode[STIX]{x1D70C})|_{s=const.,t}}=c_{t}$
where
 $c_{t}$
is the throat value of the thermodynamic variable
 $c$
, which is the speed of sound, as shown by (C 1). Thereby, for a steady, inviscid, isoenergetic, homocompositional flow, sonic velocity occurs at the throat. This conclusion has not been constrained by any assumption about the equations of state for density and enthalpy. The Bethe–Zel’dovich–Thompson fluid (Kluwick Reference Kluwick1993), which is outside our immediate interest, can have sonic flow at other positions besides the throat.
For an ideal-gas isentropic flow, the knowledge of the fluid composition and the prescription of stagnation enthalpy (or stagnation temperature) immediately yields the value of temperature at the throat because enthalpy and sound speed depend only on temperature and are independent of pressure. That is,
 $h^{o}=h(T_{t})+[c(T_{t})]^{2}/2$
is a relation fixing
 $T_{t}$
. Then, with knowledge of the stagnation pressure and use of the polytropic relation applied at constant entropy, the pressure at the throat
 $p_{t}$
is obtained. From knowledge of the pressure and temperature at the throat, all other quantities, i.e.
 $c$
,
 $h$
and
 $u$
, are easily determined from thermodynamic relations. Thus, once stagnation values for pressure and temperature are prescribed, all values at the nozzle throat are readily determined by algebraic relations without the need to integrate (4.1) and (4.2) numerically. This is not possible in the real-gas case where integration of those equations becomes necessary.
In contrast, for the real gas, one has
 $h^{o}=h(p_{t},T_{t})+[c(p_{t},T_{t})]^{2}/2$
. Thus, specification of the stagnation enthalpy only gives a relation between
 $p_{t}$
and
 $T_{t}$
. Also, there is no polytropic relation between pressure and temperature. So, in general, numerical integration becomes necessary.
4.1 Values at the sonic location
At the sonic point, where
 $u=c$
and
 $u^{2}=c^{2}$
, use of (D 13) and (D 17) yields a condition for the pressure value there. Using subscript
 $t$
for that point and using coefficient definitions from (D 5), it can be stated that
 $$\begin{eqnarray}\displaystyle \frac{\unicode[STIX]{x1D6FE}+1}{2}\left(\frac{p_{t}}{\hat{p}}\right)^{(\unicode[STIX]{x1D6FE}-1)/\unicode[STIX]{x1D6FE}} & = & \displaystyle 1+(\unicode[STIX]{x1D706}_{1}-\unicode[STIX]{x1D706}_{b})\left[\frac{\unicode[STIX]{x1D6FE}-1}{\unicode[STIX]{x1D6FE}}\frac{p_{t}}{\hat{p}}-\left(\frac{p_{t}}{\hat{p}}\right)^{(\unicode[STIX]{x1D6FE}-1)/\unicode[STIX]{x1D6FE}}+\frac{1}{\unicode[STIX]{x1D6FE}}\right]\nonumber\\ \displaystyle & & \displaystyle -\,\unicode[STIX]{x1D706}_{2}\left[(\unicode[STIX]{x1D6FE}-1)\left(\frac{p_{t}}{\hat{p}}\right)^{1/\unicode[STIX]{x1D6FE}}-\left(\frac{p_{t}}{\hat{p}}\right)^{(\unicode[STIX]{x1D6FE}-1)/\unicode[STIX]{x1D6FE}}+2-\unicode[STIX]{x1D6FE}\right]\nonumber\\ \displaystyle & & \displaystyle +\,\unicode[STIX]{x1D706}_{3}\left[\frac{2(\unicode[STIX]{x1D6FE}-1)}{\unicode[STIX]{x1D6FE}+1}\left(\frac{p_{t}}{\hat{p}}\right)^{(1-\unicode[STIX]{x1D6FE})/2\unicode[STIX]{x1D6FE}}-\left(\frac{p_{t}}{\hat{p}}\right)^{(\unicode[STIX]{x1D6FE}+1)/\unicode[STIX]{x1D6FE}}+\frac{3-\unicode[STIX]{x1D6FE}}{\unicode[STIX]{x1D6FE}+1}\right]\nonumber\\ \displaystyle & & \displaystyle +\,\frac{\unicode[STIX]{x1D6FE}-1}{2}\left(\frac{p_{t}}{\hat{p}}\right)^{(\unicode[STIX]{x1D6FE}-1)/\unicode[STIX]{x1D6FE}}\left[\unicode[STIX]{x1D706}_{b}-\unicode[STIX]{x1D706}_{1}+\unicode[STIX]{x1D706}_{2}-\unicode[STIX]{x1D706}_{3}-2(\unicode[STIX]{x1D706}_{b}-\unicode[STIX]{x1D706}_{1})\left(\frac{p_{t}}{\hat{p}}\right)^{1/\unicode[STIX]{x1D6FE}}\right.\nonumber\\ \displaystyle & & \displaystyle -\left.\frac{2\unicode[STIX]{x1D706}_{2}}{\unicode[STIX]{x1D6FE}}\left(\frac{p_{t}}{\hat{p}}\right)^{(2-\unicode[STIX]{x1D6FE})/\unicode[STIX]{x1D6FE}}+\frac{(5-\unicode[STIX]{x1D6FE})\unicode[STIX]{x1D706}_{3}}{2}\left(\frac{p_{t}}{\hat{p}}\right)^{(3-\unicode[STIX]{x1D6FE})/2\unicode[STIX]{x1D6FE}}\right]\nonumber\\ \displaystyle & = & \displaystyle 1+(\unicode[STIX]{x1D706}_{b}-\unicode[STIX]{x1D706}_{1})\left[\frac{\unicode[STIX]{x1D6FE}+1}{2}\left(\frac{p_{t}}{\hat{p}}\right)^{(\unicode[STIX]{x1D6FE}-1)/\unicode[STIX]{x1D6FE}}-\frac{\unicode[STIX]{x1D6FE}^{2}-1}{\unicode[STIX]{x1D6FE}}\frac{p_{t}}{\hat{p}}-\frac{1}{\unicode[STIX]{x1D6FE}}\right]\nonumber\\ \displaystyle & & \displaystyle +\,\unicode[STIX]{x1D706}_{2}\left[\frac{\unicode[STIX]{x1D6FE}+1}{2}\left(\frac{p_{t}}{\hat{p}}\right)^{(\unicode[STIX]{x1D6FE}-1)/\unicode[STIX]{x1D6FE}}-\frac{\unicode[STIX]{x1D6FE}^{2}-1}{\unicode[STIX]{x1D6FE}}\left(\frac{p_{t}}{\hat{p}}\right)^{1/\unicode[STIX]{x1D6FE}}+\unicode[STIX]{x1D6FE}-2\right]\nonumber\\ \displaystyle & & \displaystyle +\,\unicode[STIX]{x1D706}_{3}\left[\frac{\unicode[STIX]{x1D6FE}-1}{2}\left(\frac{p_{t}}{\hat{p}}\right)^{(\unicode[STIX]{x1D6FE}-1)/\unicode[STIX]{x1D6FE}}+\frac{2(\unicode[STIX]{x1D6FE}-1)}{\unicode[STIX]{x1D6FE}+1}\left(\frac{p_{t}}{\hat{p}}\right)^{(1-\unicode[STIX]{x1D6FE})/2\unicode[STIX]{x1D6FE}}\right.\nonumber\\ \displaystyle & & \displaystyle -\left.\left(\frac{3-\unicode[STIX]{x1D6FE}}{2}\right)^{2}\left(\frac{p_{t}}{\hat{p}}\right)^{(\unicode[STIX]{x1D6FE}+1)/\unicode[STIX]{x1D6FE}}+\frac{3-\unicode[STIX]{x1D6FE}}{\unicode[STIX]{x1D6FE}+1}\right].\end{eqnarray}$$
To zeroth order,
 $p_{t}/\hat{p}=[2/(\unicode[STIX]{x1D6FE}+1)]^{\unicode[STIX]{x1D6FE}/(\unicode[STIX]{x1D6FE}-1)}$
, which may be substituted into the first-order terms. Define
 $$\begin{eqnarray}\displaystyle \unicode[STIX]{x1D6E4}_{0}\equiv \frac{2}{\unicode[STIX]{x1D6FE}+1},\quad \unicode[STIX]{x1D6E4}_{1}\equiv \left(\frac{2}{\unicode[STIX]{x1D6FE}+1}\right)^{\unicode[STIX]{x1D6FE}/(\unicode[STIX]{x1D6FE}-1)},\quad \unicode[STIX]{x1D6E4}_{2}\equiv \left(\frac{2}{\unicode[STIX]{x1D6FE}+1}\right)^{1/(\unicode[STIX]{x1D6FE}-1)}. & & \displaystyle\end{eqnarray}$$
Then, it is obtained that
 $$\begin{eqnarray}\displaystyle \frac{p_{t}}{\hat{p}} & = & \displaystyle \unicode[STIX]{x1D6E4}_{1}\left\{\vphantom{\left(\frac{2}{\unicode[STIX]{x1D6FE}+1}\right)^{1/2}}1+(\unicode[STIX]{x1D706}_{b}-\unicode[STIX]{x1D706}_{1})\left[\frac{\unicode[STIX]{x1D6FE}-1}{\unicode[STIX]{x1D6FE}}-\frac{(\unicode[STIX]{x1D6FE}^{2}-1)}{\unicode[STIX]{x1D6FE}}\unicode[STIX]{x1D6E4}_{1}\right]+\unicode[STIX]{x1D706}_{2}\left[\unicode[STIX]{x1D6FE}-1-\frac{\unicode[STIX]{x1D6FE}^{2}-1}{\unicode[STIX]{x1D6FE}}\unicode[STIX]{x1D6E4}_{2}\right]\right.\nonumber\\ \displaystyle & & \displaystyle \left.+\,\unicode[STIX]{x1D706}_{3}\left[\left(\frac{2}{\unicode[STIX]{x1D6FE}+1}\right)^{1/2}(\unicode[STIX]{x1D6FE}-1)-\left(\frac{3-\unicode[STIX]{x1D6FE}}{2}\right)^{2}\unicode[STIX]{x1D6E4}_{1}\unicode[STIX]{x1D6E4}_{2}+\unicode[STIX]{x1D6E4}_{0}\right]\right\}^{\unicode[STIX]{x1D6FE}/(\unicode[STIX]{x1D6FE}-1)}.\end{eqnarray}$$
Now, substitution from (4.7) into (D 7), (D 10), (D 14), (D 17) and (D 12) allows determination of other variables at the sonic point as functions of
 $\unicode[STIX]{x1D6FE}$
,
 $\hat{A}$
and
 $\hat{B}$
. The values of
 $\unicode[STIX]{x1D70C}_{t}$
and
 $c_{t}$
are especially useful in determining mass flow and thrust for a choked-nozzle configuration. For example,
 $$\begin{eqnarray}\displaystyle \frac{\unicode[STIX]{x1D70C}_{t}}{\hat{\unicode[STIX]{x1D70C}}}=\left(\frac{p_{t}}{\hat{p}}\right)^{1/\unicode[STIX]{x1D6FE}}+(\unicode[STIX]{x1D706}_{1}-\unicode[STIX]{x1D706}_{b})[\unicode[STIX]{x1D6E4}_{2}^{2}-\unicode[STIX]{x1D6E4}_{2}]+\unicode[STIX]{x1D706}_{2}\left[\unicode[STIX]{x1D6E4}_{2}-\frac{\unicode[STIX]{x1D6E4}_{2}^{2}}{\unicode[STIX]{x1D6E4}_{0}}\right]+\unicode[STIX]{x1D706}_{3}[\unicode[STIX]{x1D6E4}_{2}^{5/2}\unicode[STIX]{x1D6E4}_{1}^{-1/2}-\unicode[STIX]{x1D6E4}_{2}] & & \displaystyle\end{eqnarray}$$
and
 $$\begin{eqnarray}\displaystyle \frac{c_{t}}{(2c_{p}\hat{T})^{1/2}} & = & \displaystyle \left(\frac{\unicode[STIX]{x1D6FE}-1}{2}\right)^{1/2}\hat{Z}^{1/2}\left(\frac{p_{t}}{\hat{p}}\right)^{(\unicode[STIX]{x1D6FE}-1)/2\unicode[STIX]{x1D6FE}}\left[\vphantom{\frac{\unicode[STIX]{x1D6E4}_{2}}{\unicode[STIX]{x1D6E4}_{0}^{1/2}}}1-\unicode[STIX]{x1D706}_{b}+\unicode[STIX]{x1D706}_{1}-\unicode[STIX]{x1D706}_{2}+\unicode[STIX]{x1D706}_{3}\right.\nonumber\\ \displaystyle & & \displaystyle +\left.2(\unicode[STIX]{x1D706}_{b}-\unicode[STIX]{x1D706}_{1})\unicode[STIX]{x1D6E4}_{2}+\frac{2\unicode[STIX]{x1D706}_{2}}{\unicode[STIX]{x1D6FE}}\frac{\unicode[STIX]{x1D6E4}_{2}^{2}}{\unicode[STIX]{x1D6E4}_{1}}-\frac{(5-\unicode[STIX]{x1D6FE})\unicode[STIX]{x1D706}_{3}}{2}\frac{\unicode[STIX]{x1D6E4}_{2}}{\unicode[STIX]{x1D6E4}_{0}^{1/2}}\right]^{1/2},\end{eqnarray}$$
where the lower-order solution for
 $p_{t}$
has been substituted into the higher-order terms of (4.8) and (4.9).
4.2 Dependence on Mach number
From (D 13) and (D 17), the Mach number
 $M$
can be determined as a function of pressure in the one-dimensional isentropic flow, namely
 $$\begin{eqnarray}\displaystyle M=\frac{u}{c}=\left[\left(\frac{2}{\unicode[STIX]{x1D6FE}-1}\right)\left(\frac{p}{\hat{p}}\right)^{(1-\unicode[STIX]{x1D6FE})/\unicode[STIX]{x1D6FE}}~\frac{\displaystyle 1-\left(\frac{p}{\hat{p}}\right)^{(\unicode[STIX]{x1D6FE}-1)/\unicode[STIX]{x1D6FE}}+\unicode[STIX]{x1D6EC}_{2}\left(\frac{p}{\hat{p}}\right)}{\displaystyle 1+\unicode[STIX]{x1D6EC}_{3}\left(\frac{p}{\hat{p}}\right)}\right]^{1/2}, & & \displaystyle\end{eqnarray}$$
where the functions
 $\unicode[STIX]{x1D6EC}_{2}$
and
 $\unicode[STIX]{x1D6EC}_{3}$
are defined by (D 11) and (D 16) and encapsulate the first-order corrections for the real gas.
To lowest order, one obtains is the ideal-gas result
 $p/\hat{p}=m^{\unicode[STIX]{x1D6FE}/(1-\unicode[STIX]{x1D6FE})}$
where
 $m\equiv 1+[(\unicode[STIX]{x1D6FE}-1)/2]M^{2}$
. This may be substituted into the higher-order terms in (4.10) to obtain the approximation for pressure as a function of Mach number:
 $$\begin{eqnarray}\displaystyle \frac{p}{\hat{p}}=\left[1+\frac{\unicode[STIX]{x1D6FE}-1}{2}M^{2}[1+\unicode[STIX]{x1D6EC}_{2}(m^{\unicode[STIX]{x1D6FE}/(1-\unicode[STIX]{x1D6FE})})]-\unicode[STIX]{x1D6EC}_{1}(m^{\unicode[STIX]{x1D6FE}/(1-\unicode[STIX]{x1D6FE})})\right]^{\unicode[STIX]{x1D6FE}/(1-\unicode[STIX]{x1D6FE})}, & & \displaystyle\end{eqnarray}$$
where
 $\unicode[STIX]{x1D6EC}_{1}$
is defined by (D 8).
4.3 Dependence on cross-sectional area
From the one-dimensional continuity relation for choked flow through a nozzle, it follows that
 $$\begin{eqnarray}\displaystyle \frac{A}{A_{t}}=\frac{\unicode[STIX]{x1D70C}_{t}/(\hat{Z}\hat{\unicode[STIX]{x1D70C}})}{\unicode[STIX]{x1D70C}/\hat{\unicode[STIX]{x1D70C}}}\;\frac{\displaystyle c_{t}\left/\sqrt{2c_{p}\hat{T}}\right.}{u\left/\sqrt{2c_{p}\hat{T}}\right.}. & & \displaystyle\end{eqnarray}$$
Substitution from (D 7), (D 14), (D 18) and (4.7) into (4.12) yields
 $A/A_{t}$
as a function of
 $p/\hat{p},~\unicode[STIX]{x1D6FE},~\hat{A}$
and
 $\hat{B}$
. To lowest order, a relation for the ideal-gas flow is given by
 $$\begin{eqnarray}\displaystyle \frac{A}{A_{t}} & = & \displaystyle \left[1+\frac{\unicode[STIX]{x1D6FE}-1}{2}M^{2}\right]^{1/(\unicode[STIX]{x1D6FE}-1)}\left(\frac{\unicode[STIX]{x1D6FE}-1}{2}M^{2}\right)^{-1/2}\left[1+\frac{\unicode[STIX]{x1D6FE}-1}{2}M^{2}\right]^{1/2}\unicode[STIX]{x1D6E4}_{1}^{1/\unicode[STIX]{x1D6FE}}\left(\frac{\unicode[STIX]{x1D6FE}-1}{\unicode[STIX]{x1D6FE}+1}\right)^{1/2}\nonumber\\ \displaystyle & = & \displaystyle \frac{1}{M}\left[\frac{2}{\unicode[STIX]{x1D6FE}+1}\left(1+\frac{\unicode[STIX]{x1D6FE}-1}{2}M^{2}\right)\right]^{(\unicode[STIX]{x1D6FE}+1)/(2(\unicode[STIX]{x1D6FE}-1))}.\end{eqnarray}$$
To solve (4.12) for
 $M$
as a function of
 $A/A_{t}$
, it is convenient to solve prior equation (4.13) for a first-order approximation of
 $M$
as a function of
 $A/A_{t}$
. It yields two solutions: one is supersonic and the other is subsonic. Then, the solution for
 $M$
from this lower-order analysis can be substituted into the first-order terms of (4.12).
4.4 Mass flux and thrust
The mass flux through the choked nozzle
 ${\dot{m}}$
depends on stagnation pressure, stagnation temperature, ratio of specific heats and throat cross-sectional area:
 $$\begin{eqnarray}\displaystyle \frac{{\dot{m}}}{\hat{p}A_{t}/(R\hat{T})^{1/2}}=\frac{\unicode[STIX]{x1D70C}_{t}c_{t}A_{t}}{\hat{p}A_{t}/(R\hat{T})^{1/2}}, & & \displaystyle\end{eqnarray}$$
where the inputs from (4.7), (4.8) and (4.9) are made. For the ideal gas, this reduces to
 $$\begin{eqnarray}\displaystyle {\dot{m}}_{ideal}=\unicode[STIX]{x1D6FE}^{1/2}\left(\frac{2}{\unicode[STIX]{x1D6FE}+1}\right)^{(\unicode[STIX]{x1D6FE}+1)/(2(\unicode[STIX]{x1D6FE}-1))}\frac{\hat{p}A_{t}}{(R\hat{T})^{1/2}}. & & \displaystyle\end{eqnarray}$$
The product
 $\unicode[STIX]{x1D70C}_{t}u_{t}=\unicode[STIX]{x1D70C}_{t}c_{t}$
in (4.14) can be determined in several ways: (i) equations (4.8) and (4.9) can be used; (ii) the values of
 $\unicode[STIX]{x1D70C}$
and
 $u$
can be used at the pressure where
 $u=c$
; or (iii) the magnitude of the maximum value of the product
 $\unicode[STIX]{x1D70C}u$
can be determined over the pressure range. The numerical results are close but differences occur because of second-order errors in the linear method. The third approach has arbitrarily been selected.
The thrust force
 $F$
can also be determined as a function of stagnation properties, values of the variables at the nozzle throat and exit, and cross-sectional area. If the subscripts
 $e$
and
 $a$
, respectively, denote exit values and ambient values, the standard relation is
 $F={\dot{m}}u_{e}+(p_{e}-p_{a})A_{e}$
. Thus, the non-dimensional thrust is given as
 $$\begin{eqnarray}\displaystyle \frac{F}{\hat{p}A_{t}}=\frac{\unicode[STIX]{x1D70C}_{t}c_{t}u_{e}}{\hat{p}}+\left(\frac{p}{\hat{p}}-\frac{p_{a}}{\hat{p}}\right)\frac{A_{e}}{A_{t}}. & & \displaystyle\end{eqnarray}$$
The specific impulse is defined as
 $I\equiv F/({\dot{m}}g)$
with units of seconds. A normalized value can be calculated from (4.14) and (4.16):
 $$\begin{eqnarray}\displaystyle \frac{Ig}{\sqrt{R\hat{T}}}=\frac{F/(\hat{p}A_{t})}{{\dot{m}}(R\hat{T})^{1/2}/(\hat{p}A_{t})}. & & \displaystyle\end{eqnarray}$$
4.5 Results for one-dimensional flow
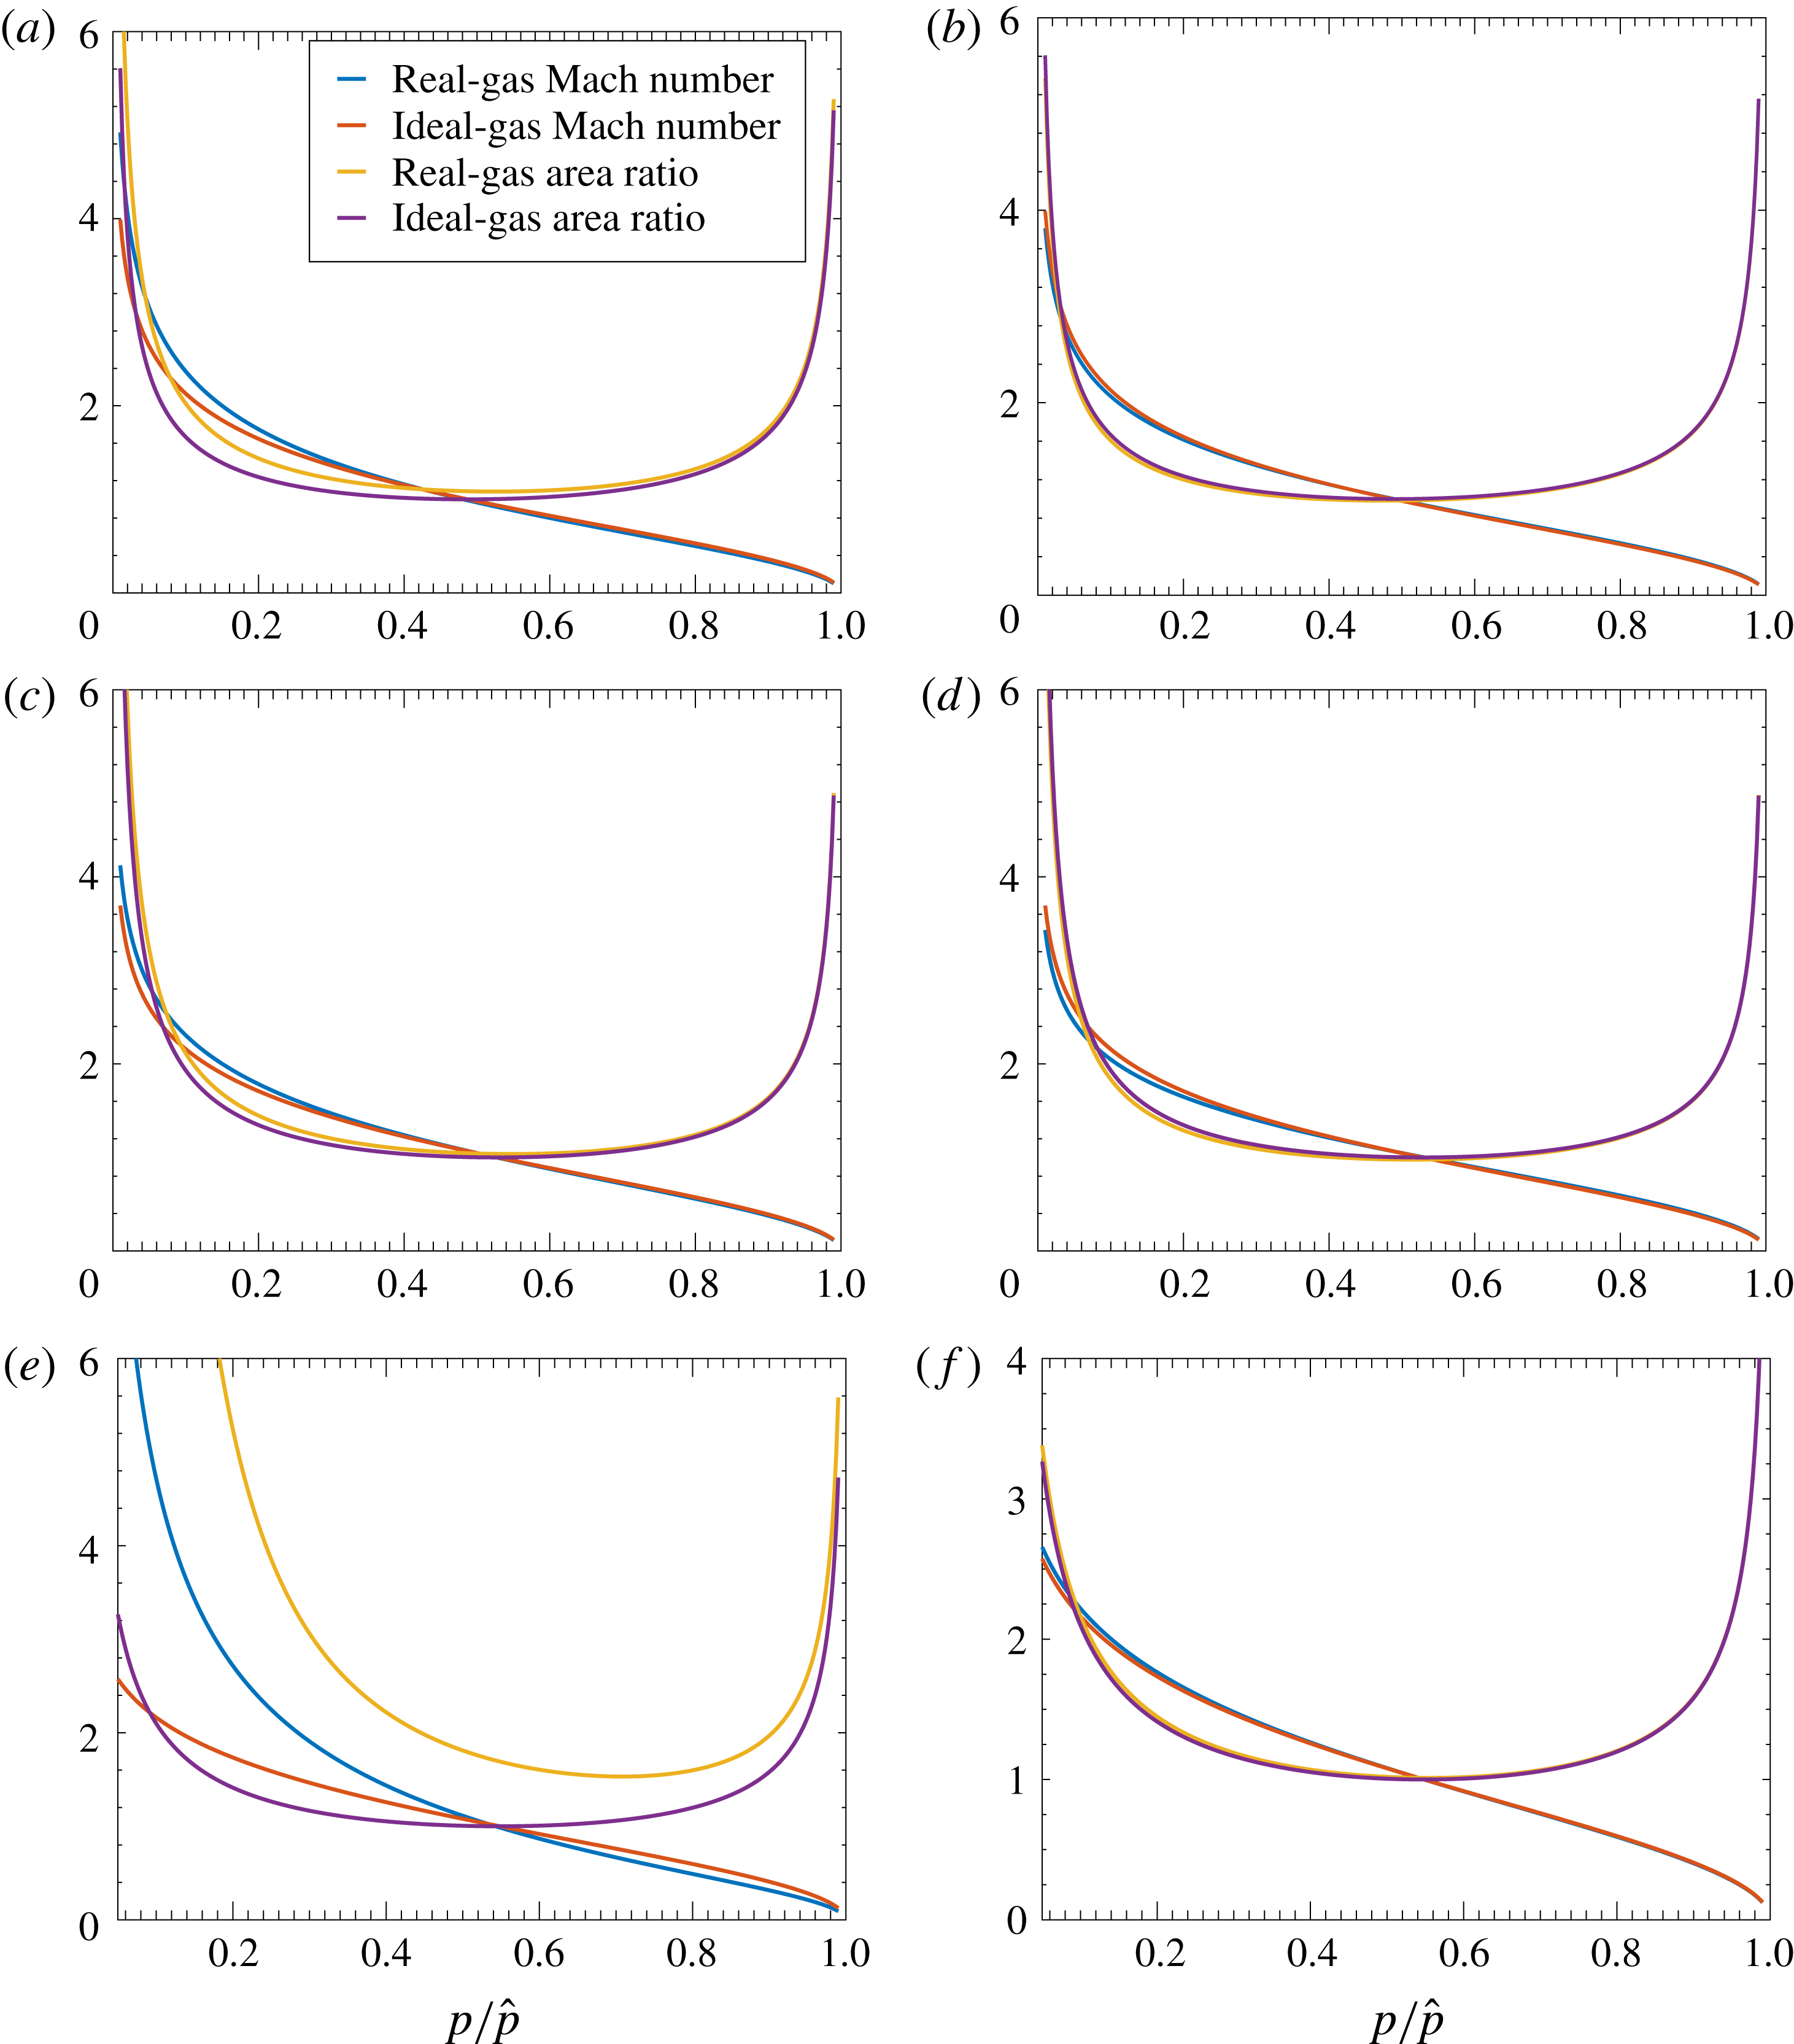
Figure 3 shows comparisons of Mach number and normalized cross-sectional area versus normalized pressure for both real and ideal flows. Mach number is generally slightly higher for real gases at the lower stagnation temperatures; at higher temperatures, no general behaviour appears. This comparison is at a given pressure not a given cross-sectional area. This point is noteworthy because the areas for the real gas and ideal gas at that pressure can differ. Generally, in the supersonic region at lower stagnation temperatures, for identical Mach number, the real gas has a higher pressure. At a given pressure and lower stagnation temperatures, the real gas has larger cross-sectional area in the supersonic domain.
Solutions for Mach number and area ratio versus non-dimensional pressure for choked-nozzle flow: (a) argon, 300 K, 10 MPa; (b) argon, 1000 K, 30 MPa; (c) nitrogen, 400 K, 12 MPa; (d) nitrogen, 1000 K, 30 MPa; (e) carbon dioxide, 450 K, 10 MPa; (f) carbon dioxide, 1000 K, 30 MPa.

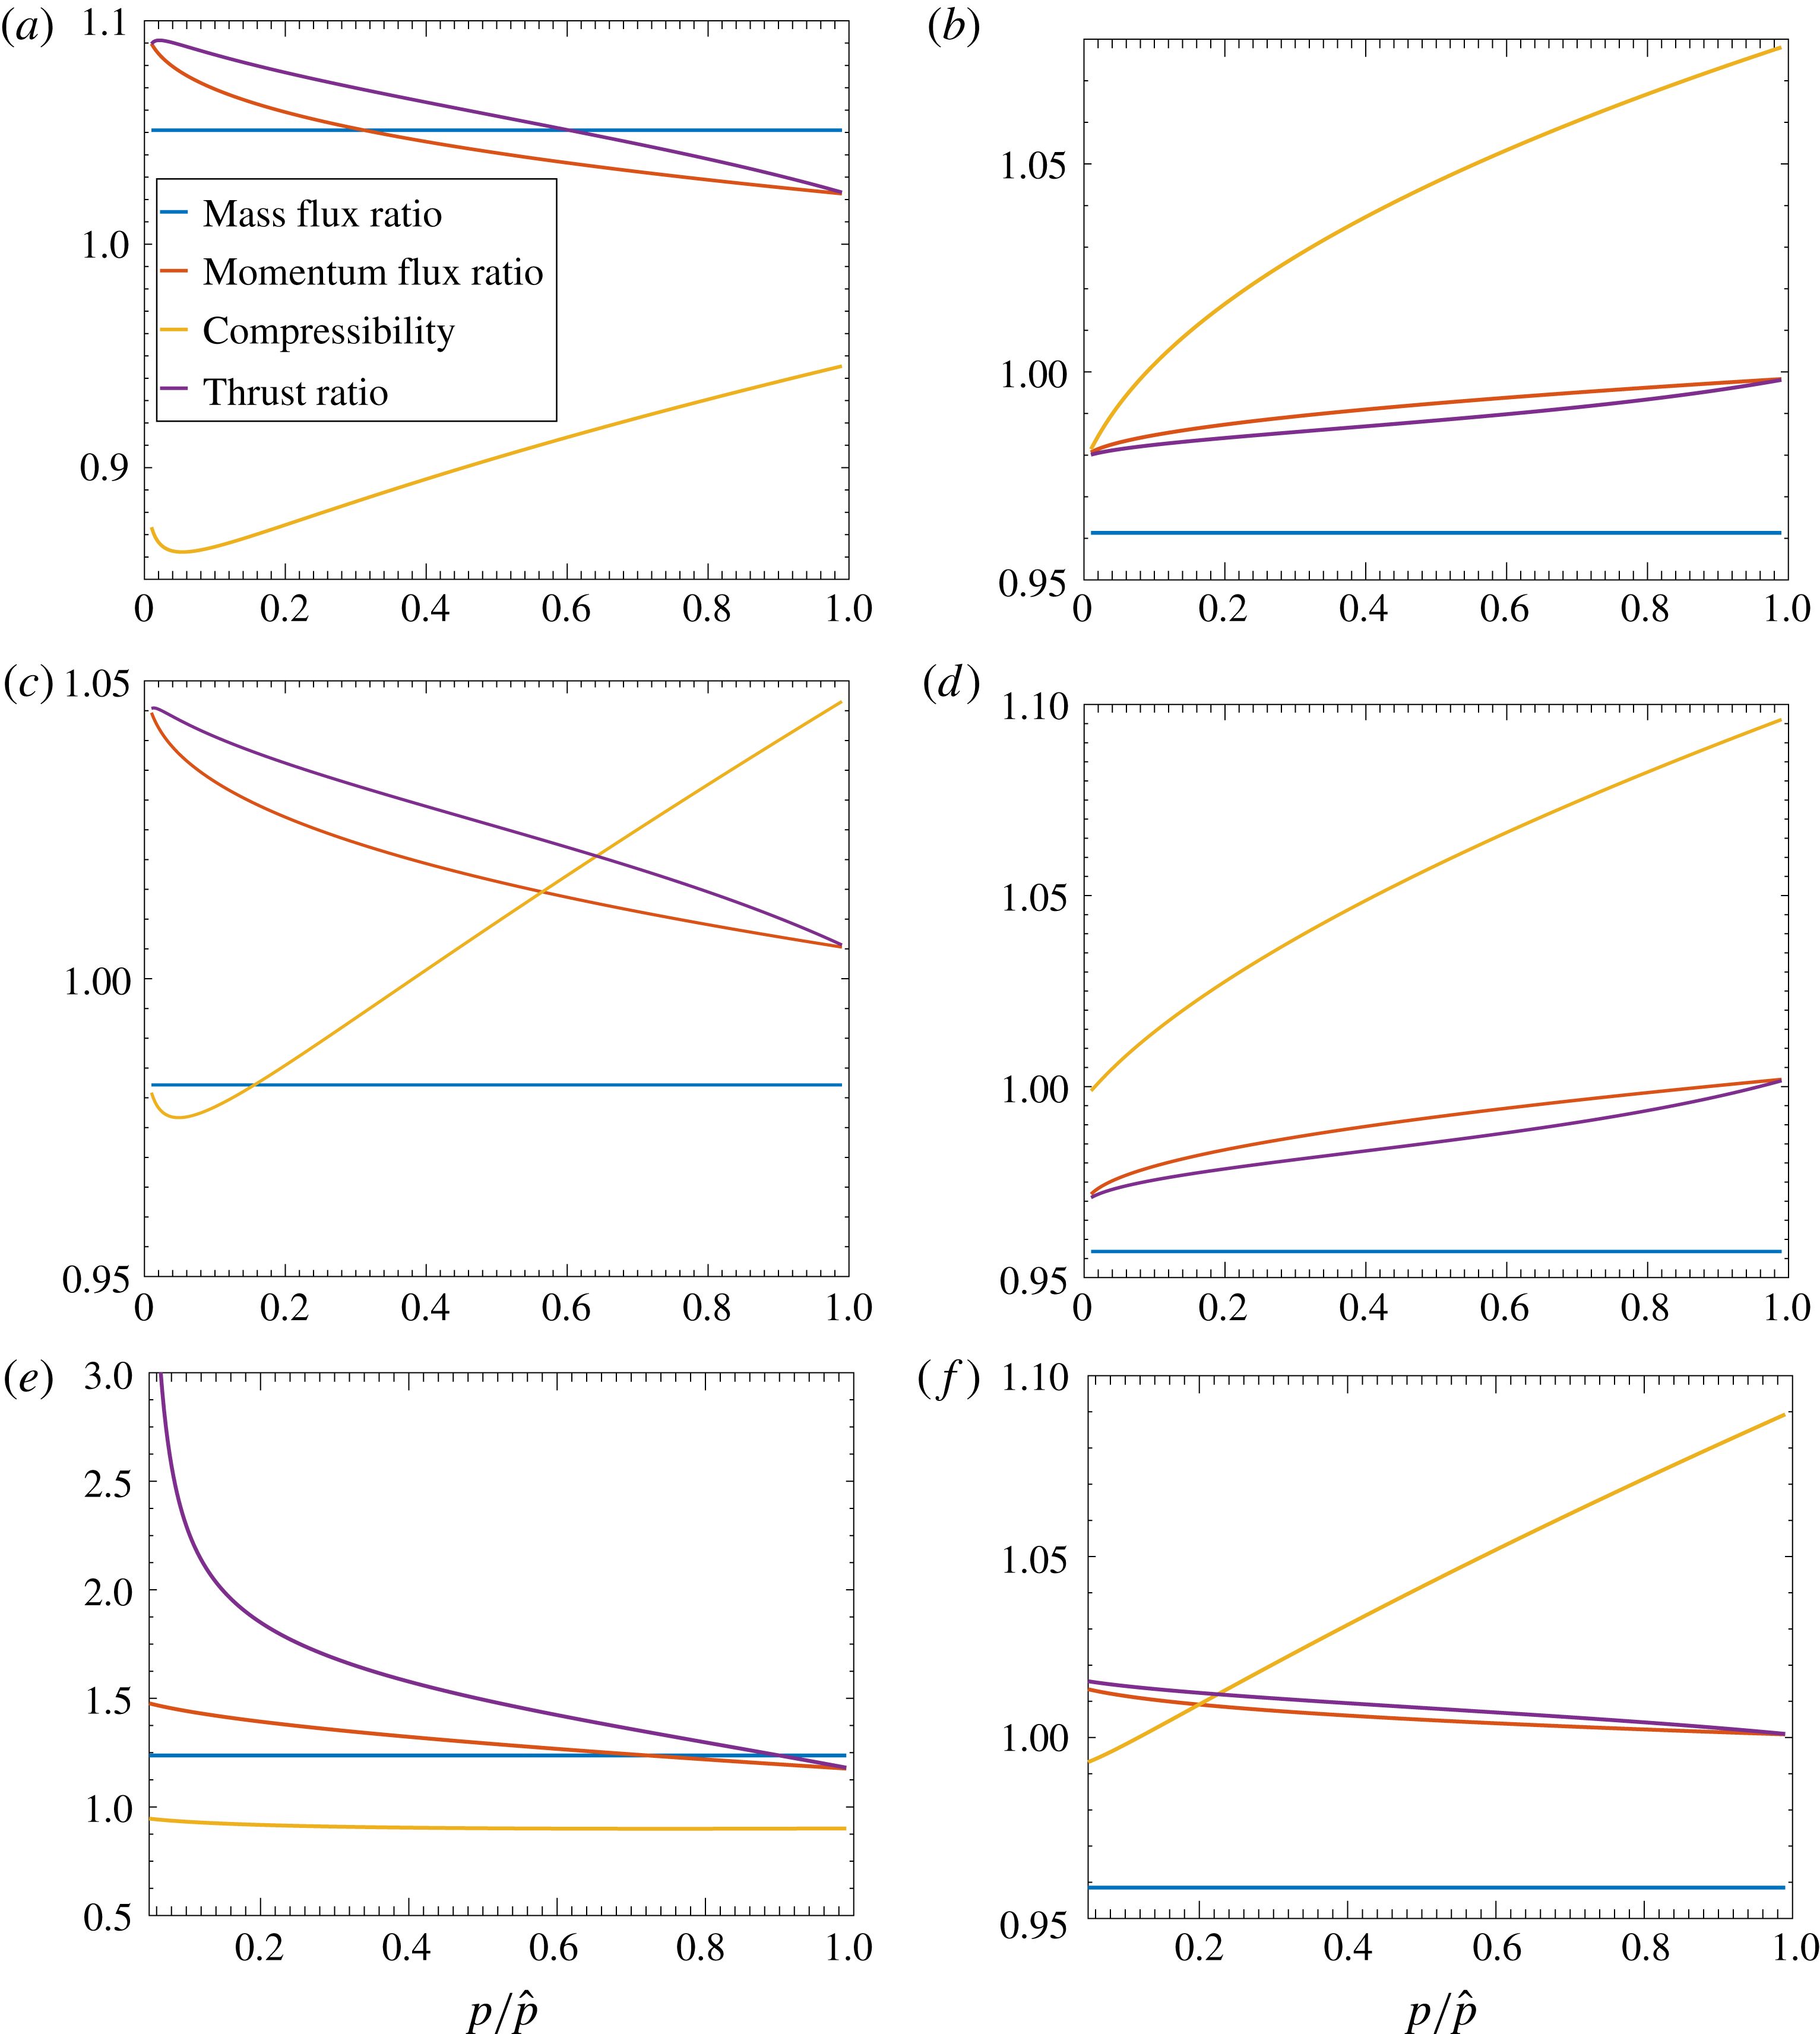
Figure 4 gives comparisons between the real gas and ideal gas for mass flux
 ${\dot{m}}/{\dot{m}}_{ideal}$
, momentum flux
 ${\dot{m}}u/({\dot{m}}_{ideal}u_{ideal})$
, thrust, compressibility factor
 $Z$
and thrust ratio
 $F/F_{ideal}$
. Real-gas mass flux is generally lower (higher) than ideal-gas flux for flows where
 $Z-1$
is positive (negative). This rule generally occurs at higher stagnation temperatures, with some deviation at lower stagnation temperatures. Figure 4(c) shows a transitional case for the value of
 $Z-1$
. This higher-temperature reduction in allowable mass flux is highly relevant to combustion at high pressures. The compressibility factor generally increases with increasing pressure and increasing stagnation temperature. Previous works (Johnson Reference Johnson1964; Ascough Reference Ascough1968; Kim et al.
Reference Kim, Kim, Setoguchi and Matsuo2008) reported mass flux through choked nozzles for generally low stagnation pressures. With the exception of a case with water vapour (i.e. steam) flow (Johnson Reference Johnson1964), they found the real-gas flow had a greater mass flux than the ideal-gas flow. It follows that real-gas flow gives less mass discharge at higher stagnation temperatures and the reversal is related to the change in relative magnitudes of the repulsion and attraction parameters.
Comparison of real-gas to ideal-gas ratios of mass flux, momentum flux and thrust between real-gas nozzle flow and ideal-gas nozzle flow: (a) argon, 300 K, 10 MPa; (b) argon, 1000 K, 30 MPa; (c) nitrogen, 400 K, 12 MPa; (d) nitrogen, 1000 K, 30 MPa; (e) carbon dioxide, 450 K, 10 MPa; (f) carbon dioxide, 1000 K, 30 MPa.

The momentum flux ratio and the thrust ratio exhibit similar trends, always decreasing at lower stagnation temperatures with increasing pressure. At optimal thrust, momentum flux and thrust become equal. For the very high stagnation pressures considered, the expansions have not reached a cross-sectional area that gives the designated ambient pressure (1 bar). Thus, the momentum flux ratio exceeds the thrust ratio.
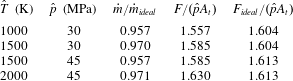
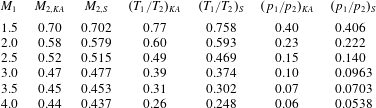
It is interesting to examine the optimal thrust that manifests when the supersonic flow is expanded to ambient pressure. Several combinations of stagnation pressure and temperature were taken, with results shown in table 3 for nitrogen with an expansion to 1 bar. In all cases, the mass flux for the real gas was a few per cent below the ideal-gas values. Generally, the real-gas thrust is lower than the ideal-gas thrust at higher stagnation pressures and temperatures.
Optimal thrust values for nitrogen flow through a nozzle.

There is longstanding knowledge that, at high pressures, the allowable mass flux through a choked nozzle can differ by a few per cent between the ideal gas and a real gas. Here, one finds for nitrogen in figure 4(c) that, at 400 K
 $(720^{\circ }\text{R})$
and 120 bar,
 $Z=104.7$
and mass flux defect (i.e. one minus mass flux ratio) is 0.017. Considering differences in the EoS, these values compare favourably with the values of 103.7 and 0.027 reported by Johnson (Reference Johnson1964) for
 $700^{\circ }\text{R}$
and 100 atm.
5 Wave motion and modified Riemann invariants
If the unsteady flow is homentropic (i.e. it has uniform and constant entropy value), it is useful to non-dimensionalize the equations using values of pressure and temperature that yield the same value of entropy as the actual flow entropy value. Then, the variation of the dimensional flow variable from the reference value is always isentropic and a relation between the dimensional value and the reference value is readily available. The stagnation values for pressure and temperature at any specified (albeit arbitrary) point in space and time satisfy this need and can serve as the reference values for all space and time. The stagnation pressure and the stagnation temperature are sufficient to determine entropy (given composition). Although the values of that pair (and of other stagnation variables) can individually vary through the flow in space or time, they are coupled for a homentropic flow in such a way as to produce the identical entropy value. Essentially, all paths under consideration here occur at the same entropy value whether they are the actual path of a fluid particle or the abstract path from static to stagnation values.
Consider one-dimensional wave motion with isentropic conditions. Let
 $p^{\prime },~\unicode[STIX]{x1D70C}^{\prime },~u^{\prime }$
and
 $c^{\prime }$
be the normalized quantities given by (D 7), (D 14) and (D 18). Velocity
 $\sqrt{2c_{p}\hat{T}}$
and length
 $L$
are used to provide the normalized
 $x^{\prime }$
and
 $t^{\prime }$
. Here, the chosen reference properties for the non-dimensional scheme are the quiescent conditions for pressure and temperature. The continuity and momentum equations may be written as
 $$\begin{eqnarray}\displaystyle \left.\begin{array}{@{}c@{}}\displaystyle \frac{\unicode[STIX]{x2202}(\ln \unicode[STIX]{x1D70C}^{\prime })}{\unicode[STIX]{x2202}t^{\prime }}+u^{\prime }\frac{\unicode[STIX]{x2202}(\ln \unicode[STIX]{x1D70C}^{\prime })}{\unicode[STIX]{x2202}x^{\prime }}+\frac{\unicode[STIX]{x2202}u^{\prime }}{\unicode[STIX]{x2202}x^{\prime }}=0,\\ \displaystyle \frac{\unicode[STIX]{x2202}u^{\prime }}{\unicode[STIX]{x2202}t^{\prime }}+u^{\prime }\frac{\unicode[STIX]{x2202}u^{\prime }}{\unicode[STIX]{x2202}x^{\prime }}+c^{\prime 2}\frac{\unicode[STIX]{x2202}(\ln \unicode[STIX]{x1D70C}^{\prime })}{\unicode[STIX]{x2202}x^{\prime }}=0.\end{array}\right\} & & \displaystyle\end{eqnarray}$$
From (D 7) and (D 18),
 $c^{\prime }$
and
 $\unicode[STIX]{x1D70C}^{\prime }$
are related to
 $p^{\prime }$
as
 $$\begin{eqnarray}\unicode[STIX]{x1D70C}^{\prime }=(p^{\prime })^{1/\unicode[STIX]{x1D6FE}}[1+\unicode[STIX]{x1D6EC}_{1}(p^{\prime })]\approx (p^{\prime })^{1/\unicode[STIX]{x1D6FE}}\exp [\unicode[STIX]{x1D6EC}_{1}(p^{\prime })]\end{eqnarray}$$
and
 $$\begin{eqnarray}\displaystyle c^{\prime } & = & \displaystyle ((\unicode[STIX]{x1D6FE}-1)/2)^{1/2}\hat{Z}^{1/2}(p^{\prime })^{(\unicode[STIX]{x1D6FE}-1)/2\unicode[STIX]{x1D6FE}}[1+\unicode[STIX]{x1D6EC}_{3}(p^{\prime })]^{1/2}\nonumber\\ \displaystyle & {\approx} & \displaystyle ((\unicode[STIX]{x1D6FE}-1)/2)^{1/2}(p^{\prime })^{(\unicode[STIX]{x1D6FE}-1)/2\unicode[STIX]{x1D6FE}}[1+(1/2)(\hat{B}-\hat{A}+\unicode[STIX]{x1D6EC}_{3}(p^{\prime }))]\nonumber\\ \displaystyle & {\approx} & \displaystyle ((\unicode[STIX]{x1D6FE}-1)/2)^{1/2}(p^{\prime })^{(\unicode[STIX]{x1D6FE}-1)/2\unicode[STIX]{x1D6FE}}\exp [(1/2)(\hat{B}-\hat{A}+\unicode[STIX]{x1D6EC}_{3}(p^{\prime }))].\end{eqnarray}$$
Thus, dropping the approximation notation, it is found that
 $$\begin{eqnarray}\displaystyle \ln p^{\prime } & = & \displaystyle \unicode[STIX]{x1D6FE}[\ln \unicode[STIX]{x1D70C}^{\prime }-\unicode[STIX]{x1D6EC}_{1}(p^{\prime })]\nonumber\\ \displaystyle & = & \displaystyle (2\unicode[STIX]{x1D6FE}/(\unicode[STIX]{x1D6FE}-1))[\ln c^{\prime }-(1/2)\ln ((\unicode[STIX]{x1D6FE}-1)/2)-(1/2)(\hat{B}-\hat{A}+\unicode[STIX]{x1D6EC}_{3}(p^{\prime }))].\end{eqnarray}$$
Finally,
 $\unicode[STIX]{x1D70C}^{\prime }$
and
 $c^{\prime }$
can be related; specifically,
 $$\begin{eqnarray}\displaystyle \ln \unicode[STIX]{x1D70C}^{\prime }=(2/(\unicode[STIX]{x1D6FE}-1))\ln c^{\prime }+\unicode[STIX]{x1D6EC}_{1}-\unicode[STIX]{x1D6EC}_{3}/(\unicode[STIX]{x1D6FE}-1) & & \displaystyle\end{eqnarray}$$
plus additive constants that are eliminated upon differentiation. The factor
 $\unicode[STIX]{x1D6EC}_{1}-\unicode[STIX]{x1D6EC}_{3}/(\unicode[STIX]{x1D6FE}-1)$
is the fractional variation of the isentropic real-gas relation between
 $c^{2}$
and
 $\unicode[STIX]{x1D70C}$
from the isentropic ideal-gas relation between those variables.
5.1 Riemann invariant construction
Define
 $\unicode[STIX]{x1D716}\equiv \unicode[STIX]{x1D6EC}_{1}-\unicode[STIX]{x1D6EC}_{3}/(\unicode[STIX]{x1D6FE}-1)$
and substitute into (5.1) for
 $\unicode[STIX]{x1D70C}^{\prime }$
:
 $$\begin{eqnarray}\displaystyle & \displaystyle \frac{2}{\unicode[STIX]{x1D6FE}-1}\left[\frac{\unicode[STIX]{x2202}c^{\prime }}{\unicode[STIX]{x2202}t^{\prime }}+u^{\prime }\frac{\unicode[STIX]{x2202}c^{\prime }}{\unicode[STIX]{x2202}x^{\prime }}\right]+c^{\prime }\frac{\unicode[STIX]{x2202}\unicode[STIX]{x1D716}}{\unicode[STIX]{x2202}t^{\prime }}+u^{\prime }c^{\prime }\frac{\unicode[STIX]{x2202}\unicode[STIX]{x1D716}}{\unicode[STIX]{x2202}x^{\prime }}+c^{\prime }\frac{\unicode[STIX]{x2202}u^{\prime }}{\unicode[STIX]{x2202}x^{\prime }}=0, & \displaystyle\end{eqnarray}$$
 $$\begin{eqnarray}\displaystyle & \displaystyle \frac{\unicode[STIX]{x2202}u^{\prime }}{\unicode[STIX]{x2202}t^{\prime }}+u^{\prime }\frac{\unicode[STIX]{x2202}u^{\prime }}{\unicode[STIX]{x2202}x^{\prime }}+c^{\prime }\frac{2}{\unicode[STIX]{x1D6FE}-1}\frac{\unicode[STIX]{x2202}c^{\prime }}{\unicode[STIX]{x2202}x^{\prime }}+c^{\prime 2}\frac{\unicode[STIX]{x2202}\unicode[STIX]{x1D716}}{\unicode[STIX]{x2202}x^{\prime }}=0. & \displaystyle\end{eqnarray}$$
Using the lowest-order relation
 $p^{\prime }=(2c^{\prime 2}/(\unicode[STIX]{x1D6FE}-1))^{\unicode[STIX]{x1D6FE}/(\unicode[STIX]{x1D6FE}-1)}$
,
 $\unicode[STIX]{x1D716},~\unicode[STIX]{x1D6EC}_{1}$
and
 $\unicode[STIX]{x1D6EC}_{3}$
can be converted to functions of
 $c^{\prime }$
. Then, a function
 $\unicode[STIX]{x1D6F9}(c^{\prime })\equiv \int c^{\prime }\,\text{d}\unicode[STIX]{x1D716}=\int c^{\prime }(\text{d}\unicode[STIX]{x1D716}/\text{d}c^{\prime })\,\text{d}c^{\prime }$
is created. The function
 $\unicode[STIX]{x1D6F9}$
provides, for an isentropic path, an integrated effect of the variation from the ideal-gas behaviour. This allows reorganization of the continuity and momentum equations by addition and subtraction to yield
 $$\begin{eqnarray}\displaystyle & \displaystyle \left[\frac{\unicode[STIX]{x2202}}{\unicode[STIX]{x2202}t^{\prime }}+(u^{\prime }+c^{\prime })\frac{\unicode[STIX]{x2202}}{\unicode[STIX]{x2202}x^{\prime }}\right]\left(u^{\prime }+\frac{2}{\unicode[STIX]{x1D6FE}-1}c^{\prime }+\unicode[STIX]{x1D6F9}(c^{\prime })\right)=0, & \displaystyle\end{eqnarray}$$
 $$\begin{eqnarray}\displaystyle & \displaystyle \left[\frac{\unicode[STIX]{x2202}}{\unicode[STIX]{x2202}t^{\prime }}+(u^{\prime }-c^{\prime })\frac{\unicode[STIX]{x2202}}{\unicode[STIX]{x2202}x^{\prime }}\right]\left(u^{\prime }-\frac{2}{\unicode[STIX]{x1D6FE}-1}c^{\prime }-\unicode[STIX]{x1D6F9}(c^{\prime })\right)=0. & \displaystyle\end{eqnarray}$$
This yields the two modified Riemann invariants,
 $$\begin{eqnarray}\displaystyle \left.\begin{array}{@{}c@{}}\displaystyle I_{R}\equiv u^{\prime }+\frac{2}{\unicode[STIX]{x1D6FE}-1}c^{\prime }+\unicode[STIX]{x1D6F9}(c^{\prime }),\\ \displaystyle I_{L}\equiv u^{\prime }-\frac{2}{\unicode[STIX]{x1D6FE}-1}c^{\prime }-\unicode[STIX]{x1D6F9}(c^{\prime }),\end{array}\right\} & & \displaystyle\end{eqnarray}$$
which propagate respectively along the characteristic paths
 $$\begin{eqnarray}\displaystyle \left.\begin{array}{@{}c@{}}\displaystyle \frac{\text{d}x^{\prime }}{\text{d}t^{\prime }}=(u^{\prime }+c^{\prime }),\\ \displaystyle \frac{\text{d}x^{\prime }}{\text{d}t^{\prime }}=(u^{\prime }-c^{\prime }),\end{array}\right\} & & \displaystyle\end{eqnarray}$$
where the following relations are developed from the definitions given by (D 8) and (D 16):
 $$\begin{eqnarray}\displaystyle \unicode[STIX]{x1D6EC}_{1} & \equiv & \displaystyle (\unicode[STIX]{x1D706}_{1}-\unicode[STIX]{x1D706}_{b})\left[\left(\frac{p}{\hat{p}}\right)^{1/\unicode[STIX]{x1D6FE}}-1\right]-\unicode[STIX]{x1D706}_{2}\left[\left(\frac{p}{\hat{p}}\right)^{(2-\unicode[STIX]{x1D6FE})/\unicode[STIX]{x1D6FE}}-1\right]\nonumber\\ \displaystyle & & \displaystyle +\,\unicode[STIX]{x1D706}_{3}\left[\left(\frac{p}{\hat{p}}\right)^{(3-\unicode[STIX]{x1D6FE})/2\unicode[STIX]{x1D6FE}}-1\right]\nonumber\\ \displaystyle & = & \displaystyle (\unicode[STIX]{x1D706}_{1}-\unicode[STIX]{x1D706}_{b})\left[\left(\frac{2c^{\prime 2}}{\unicode[STIX]{x1D6FE}-1}\right)^{1/(\unicode[STIX]{x1D6FE}-1)}-1\right]-\unicode[STIX]{x1D706}_{2}\left[\left(\frac{2c^{\prime 2}}{\unicode[STIX]{x1D6FE}-1}\right)^{(2-\unicode[STIX]{x1D6FE})/(\unicode[STIX]{x1D6FE}-1)}-1\right]\nonumber\\ \displaystyle & & \displaystyle +\,\unicode[STIX]{x1D706}_{3}\left[\left(\frac{2c^{\prime 2}}{\unicode[STIX]{x1D6FE}-1}\right)^{(3-\unicode[STIX]{x1D6FE})/2(\unicode[STIX]{x1D6FE}-1)}-1\right],\end{eqnarray}$$
 $$\begin{eqnarray}\displaystyle \unicode[STIX]{x1D6EC}_{3} & \equiv & \displaystyle -\unicode[STIX]{x1D706}_{b}+\unicode[STIX]{x1D706}_{1}-\unicode[STIX]{x1D706}_{2}+\unicode[STIX]{x1D706}_{3}+\frac{(\unicode[STIX]{x1D6FE}+1)(\unicode[STIX]{x1D706}_{b}-\unicode[STIX]{x1D706}_{1})}{\unicode[STIX]{x1D6FE}}\left(\frac{p}{\hat{p}}\right)^{1/\unicode[STIX]{x1D6FE}}\nonumber\\ \displaystyle & & \displaystyle +\,\frac{2\unicode[STIX]{x1D706}_{2}}{\unicode[STIX]{x1D6FE}}\left(\frac{p}{\hat{p}}\right)^{(2-\unicode[STIX]{x1D6FE})/\unicode[STIX]{x1D6FE}}-\frac{(3+\unicode[STIX]{x1D6FE})\unicode[STIX]{x1D706}_{3}}{2\unicode[STIX]{x1D6FE}}\left(\frac{p}{\hat{p}}\right)^{(3-\unicode[STIX]{x1D6FE})/2\unicode[STIX]{x1D6FE}}\nonumber\\ \displaystyle & = & \displaystyle -\unicode[STIX]{x1D706}_{b}+\unicode[STIX]{x1D706}_{1}-\unicode[STIX]{x1D706}_{2}+\unicode[STIX]{x1D706}_{3}+\frac{(\unicode[STIX]{x1D6FE}+1)(\unicode[STIX]{x1D706}_{b}-\unicode[STIX]{x1D706}_{1})}{\unicode[STIX]{x1D6FE}}\left(\frac{2c^{\prime 2}}{\unicode[STIX]{x1D6FE}-1}\right)^{1/(\unicode[STIX]{x1D6FE}-1)}\nonumber\\ \displaystyle & & \displaystyle +\,\frac{2\unicode[STIX]{x1D706}_{2}}{\unicode[STIX]{x1D6FE}}\left(\frac{2c^{\prime 2}}{\unicode[STIX]{x1D6FE}-1}\right)^{(2-\unicode[STIX]{x1D6FE})/(\unicode[STIX]{x1D6FE}-1)}-\frac{(3+\unicode[STIX]{x1D6FE})\unicode[STIX]{x1D706}_{3}}{2\unicode[STIX]{x1D6FE}}\left(\frac{2c^{\prime 2}}{\unicode[STIX]{x1D6FE}-1}\right)^{(3-\unicode[STIX]{x1D6FE})/2(\unicode[STIX]{x1D6FE}-1)},\quad\end{eqnarray}$$
 $$\begin{eqnarray}\displaystyle \unicode[STIX]{x1D716}\equiv \unicode[STIX]{x1D6EC}_{1}-\frac{\unicode[STIX]{x1D6EC}_{3}}{\unicode[STIX]{x1D6FE}-1} & = & \displaystyle \frac{\unicode[STIX]{x1D6FE}}{\unicode[STIX]{x1D6FE}-1}(\unicode[STIX]{x1D706}_{b}-\unicode[STIX]{x1D706}_{1}+\unicode[STIX]{x1D706}_{2}-\unicode[STIX]{x1D706}_{3})+\frac{(\unicode[STIX]{x1D6FE}^{2}+1)(\unicode[STIX]{x1D706}_{1}-\unicode[STIX]{x1D706}_{b})}{\unicode[STIX]{x1D6FE}(\unicode[STIX]{x1D6FE}-1)}\left(\frac{2c^{\prime 2}}{\unicode[STIX]{x1D6FE}-1}\right)^{1/(\unicode[STIX]{x1D6FE}-1)}\nonumber\\ \displaystyle & & \displaystyle -\,\frac{(\unicode[STIX]{x1D6FE}^{2}-\unicode[STIX]{x1D6FE}+2)\unicode[STIX]{x1D706}_{2}}{\unicode[STIX]{x1D6FE}(\unicode[STIX]{x1D6FE}-1)}\left(\frac{2c^{\prime 2}}{\unicode[STIX]{x1D6FE}-1}\right)^{(2-\unicode[STIX]{x1D6FE})/(\unicode[STIX]{x1D6FE}-1)}\nonumber\\ \displaystyle & & \displaystyle +\,\frac{(2\unicode[STIX]{x1D6FE}^{2}-\unicode[STIX]{x1D6FE}+3)\unicode[STIX]{x1D706}_{3}}{2\unicode[STIX]{x1D6FE}(\unicode[STIX]{x1D6FE}-1)}\left(\frac{2c^{\prime 2}}{\unicode[STIX]{x1D6FE}-1}\right)^{(3-\unicode[STIX]{x1D6FE})/2(\unicode[STIX]{x1D6FE}-1)}.\end{eqnarray}$$
Consequently, one obtains
 $$\begin{eqnarray}\displaystyle c^{\prime }\frac{\text{d}\unicode[STIX]{x1D716}}{\text{d}c^{\prime }} & = & \displaystyle 2c^{\prime 2}\frac{\text{d}\unicode[STIX]{x1D716}}{\text{d}(c^{\prime 2})}\nonumber\\ \displaystyle & = & \displaystyle 2\frac{(\unicode[STIX]{x1D6FE}^{2}+1)(\unicode[STIX]{x1D706}_{1}-\unicode[STIX]{x1D706}_{b})}{\unicode[STIX]{x1D6FE}(\unicode[STIX]{x1D6FE}-1)^{2}}\left(\frac{2c^{\prime 2}}{\unicode[STIX]{x1D6FE}-1}\right)^{1/(\unicode[STIX]{x1D6FE}-1)}\nonumber\\ \displaystyle & & \displaystyle -\,2\frac{(\unicode[STIX]{x1D6FE}^{2}-\unicode[STIX]{x1D6FE}+2)(2-\unicode[STIX]{x1D6FE})\unicode[STIX]{x1D706}_{2}}{\unicode[STIX]{x1D6FE}(\unicode[STIX]{x1D6FE}-1)^{2}}\left(\frac{2c^{\prime 2}}{\unicode[STIX]{x1D6FE}-1}\right)^{(2-\unicode[STIX]{x1D6FE})/(\unicode[STIX]{x1D6FE}-1)}\nonumber\\ \displaystyle & & \displaystyle +\,\frac{(2\unicode[STIX]{x1D6FE}^{2}-\unicode[STIX]{x1D6FE}+3)(3-\unicode[STIX]{x1D6FE})\unicode[STIX]{x1D706}_{3}}{2\unicode[STIX]{x1D6FE}(\unicode[STIX]{x1D6FE}-1)^{2}}\left(\frac{2c^{\prime 2}}{\unicode[STIX]{x1D6FE}-1}\right)^{(3-\unicode[STIX]{x1D6FE})/2(\unicode[STIX]{x1D6FE}-1)},\end{eqnarray}$$
 $$\begin{eqnarray}\displaystyle \unicode[STIX]{x1D6F9}(c^{\prime }) & = & \displaystyle \int c\frac{\text{d}\unicode[STIX]{x1D716}}{\text{d}c^{\prime }}\,\text{d}c^{\prime }\nonumber\\ \displaystyle & = & \displaystyle \frac{(\unicode[STIX]{x1D6FE}^{2}+1)(\unicode[STIX]{x1D706}_{1}-\unicode[STIX]{x1D706}_{b})}{\unicode[STIX]{x1D6FE}(\unicode[STIX]{x1D6FE}+1)}\left(\frac{2}{\unicode[STIX]{x1D6FE}-1}\right)^{\unicode[STIX]{x1D6FE}/(\unicode[STIX]{x1D6FE}-1)}c^{\prime (\unicode[STIX]{x1D6FE}+1)/(\unicode[STIX]{x1D6FE}-1)}\nonumber\\ \displaystyle & & \displaystyle -\,\frac{(\unicode[STIX]{x1D6FE}^{2}-\unicode[STIX]{x1D6FE}+2)(2-\unicode[STIX]{x1D6FE})\unicode[STIX]{x1D706}_{2}}{\unicode[STIX]{x1D6FE}(3-\unicode[STIX]{x1D6FE})}\left(\frac{2}{\unicode[STIX]{x1D6FE}-1}\right)^{1/(\unicode[STIX]{x1D6FE}-1)}c^{\prime (3-\unicode[STIX]{x1D6FE})/(\unicode[STIX]{x1D6FE}-1)}\nonumber\\ \displaystyle & & \displaystyle +\,\frac{(2\unicode[STIX]{x1D6FE}^{2}-\unicode[STIX]{x1D6FE}+3)(3-\unicode[STIX]{x1D6FE})\unicode[STIX]{x1D706}_{3}}{8\unicode[STIX]{x1D6FE}}\left(\frac{2}{\unicode[STIX]{x1D6FE}-1}\right)^{(\unicode[STIX]{x1D6FE}+1)/2(\unicode[STIX]{x1D6FE}-1)}c^{\prime 2/(\unicode[STIX]{x1D6FE}-1)}.\end{eqnarray}$$
From (5.10) and (5.11), it is concluded that
 $I_{R}$
is a function of
 $\unicode[STIX]{x1D702}\equiv t^{\prime }-\int (u^{\prime }+c^{\prime })^{-1}\,\text{d}x^{\prime }$
alone and
 $I_{L}$
is a function of
 $\unicode[STIX]{x1D709}\equiv t^{\prime }-\int (u^{\prime }-c^{\prime })^{-1}\,\text{d}x^{\prime }$
alone. Integrals are taken along the paths indicated by (5.11). If waves travel in one direction only,
 $u^{\prime }$
and
 $c^{\prime }$
are constant along each characteristic path. For example, if waves travel only in the positive
 $x^{\prime }$
-direction,
 $\unicode[STIX]{x1D702}=t^{\prime }-(x^{\prime }-x_{P}^{\prime })/(u^{\prime }+c^{\prime })$
; while, if waves travel only in the negative
 $x^{\prime }$
-direction,
 $\unicode[STIX]{x1D709}=t^{\prime }-(x^{\prime }-x_{P}^{\prime })/(u^{\prime }-c^{\prime })$
. For the moment, consider
 $x_{P}^{\prime }$
as a reference position. Later, in a specific example, that position is identified as the location of a moving boundary.
From (5.10), it follows that
 $$\begin{eqnarray}\displaystyle \left.\begin{array}{@{}c@{}}\displaystyle \begin{array}{@{}c@{}}\displaystyle u^{\prime }=\frac{I_{R}(\unicode[STIX]{x1D702})+I_{L}(\unicode[STIX]{x1D709})}{2},\end{array}\\ \displaystyle \begin{array}{@{}rcl@{}}\displaystyle c^{\prime }\; & =\; & \displaystyle \frac{\unicode[STIX]{x1D6FE}-1}{4}[I_{R}(\unicode[STIX]{x1D702})-I_{L}(\unicode[STIX]{x1D709})-2\unicode[STIX]{x1D6F9}(c^{\prime })]\\ \displaystyle \; & {\approx}\; & \displaystyle \frac{\unicode[STIX]{x1D6FE}-1}{4}\left[I_{R}(\unicode[STIX]{x1D702})-I_{L}(\unicode[STIX]{x1D709})-2\unicode[STIX]{x1D6F9}\left(\frac{(\unicode[STIX]{x1D6FE}-1)(I_{R}(\unicode[STIX]{x1D702})-I_{L}(\unicode[STIX]{x1D709}))}{4}\right)\right].\end{array}\end{array}\right\} & & \displaystyle\end{eqnarray}$$
As an example of nonlinear but isentropic wave propagation, consider a sinusoidally oscillating piston at one end (i.e. left end near
 $x^{\prime }=0$
) of a semi-infinite duct with constant cross-section. Before the rightward-travelling wave arrives, the gas is quiescent at stagnation values with
 $u^{\prime }=0$
and, from (D 18),
 $$\begin{eqnarray}\displaystyle c^{\prime }=\sqrt{[(\unicode[STIX]{x1D6FE}-1)/2]\hat{Z}[1+\unicode[STIX]{x1D6EC}_{3}(1)]}. & & \displaystyle\end{eqnarray}$$
At the moving piston face,
 $$\begin{eqnarray}\displaystyle \left.\begin{array}{@{}c@{}}\displaystyle x_{P}^{\prime }=-(U/(2\unicode[STIX]{x03C0}))\cos \unicode[STIX]{x1D714}t=-(U/(2\unicode[STIX]{x03C0}))\cos \unicode[STIX]{x1D714}^{\prime }t^{\prime },\\ \displaystyle u^{\prime }(t^{\prime },x_{P}^{\prime })=U\sin \unicode[STIX]{x1D714}^{\prime }t^{\prime }.\end{array}\right\} & & \displaystyle\end{eqnarray}$$
Here,
 $\unicode[STIX]{x1D714}^{\prime }\equiv \unicode[STIX]{x1D714}L/\sqrt{2c_{p}\hat{T}}=2\unicode[STIX]{x03C0}\sqrt{(\unicode[STIX]{x1D6FE}-1)/2},$
if the reference length
 $L$
equals the theoretical wavelength for propagation at frequency
 $\unicode[STIX]{x1D714}$
and ideal-gas acoustic wave speed for the stagnation conditions. This choice of reference value does not condition the actual wave speed or wavelength in this situation.
For this problem,
 $I_{L}=-\sqrt{(2/(\unicode[STIX]{x1D6FE}-1))\hat{Z}[1+\unicode[STIX]{x1D6EC}_{3}(1)]}-\unicode[STIX]{x1D6F9}(\sqrt{(\unicode[STIX]{x1D6FE}-1)/2}\,)$
uniformly for all values of
 $\unicode[STIX]{x1D709}$
. From the velocity boundary condition at the piston, it follows that, at
 $x=x_{P},~I_{R}(t^{\prime })=2U\sin \unicode[STIX]{x1D714}^{\prime }t^{\prime }+\sqrt{2/(\unicode[STIX]{x1D6FE}-1)}+\unicode[STIX]{x1D6F9}(\sqrt{(\unicode[STIX]{x1D6FE}-1)/2}\,)$
. Thus, for all
 $x^{\prime },t^{\prime }$
values of interest,
 $$\begin{eqnarray}\displaystyle & \displaystyle I_{R}(\unicode[STIX]{x1D702})=2U\sin \unicode[STIX]{x1D714}^{\prime }\unicode[STIX]{x1D702}+\sqrt{\frac{2}{\unicode[STIX]{x1D6FE}-1}\hat{Z}[1+\unicode[STIX]{x1D6EC}_{3}(1)]}+\unicode[STIX]{x1D6F9}\left(\sqrt{\frac{\unicode[STIX]{x1D6FE}-1}{2}}\right), & \displaystyle\end{eqnarray}$$
 $$\begin{eqnarray}\displaystyle & \displaystyle u^{\prime }(x^{\prime },t^{\prime })=u^{\prime }(\unicode[STIX]{x1D702})=U\sin \unicode[STIX]{x1D714}^{\prime }\unicode[STIX]{x1D702}, & \displaystyle\end{eqnarray}$$
 $$\begin{eqnarray}\displaystyle c^{\prime }(x^{\prime },t^{\prime }) & = & \displaystyle c^{\prime }(\unicode[STIX]{x1D702})\nonumber\\ \displaystyle & = & \displaystyle \frac{\unicode[STIX]{x1D6FE}-1}{2}\,U\sin \unicode[STIX]{x1D714}^{\prime }\unicode[STIX]{x1D702}+\sqrt{\frac{\unicode[STIX]{x1D6FE}-1}{2}\hat{Z}[1+\unicode[STIX]{x1D6EC}_{3}(1)]}\nonumber\\ \displaystyle & & \displaystyle +\,\frac{\unicode[STIX]{x1D6FE}-1}{2}\left[\unicode[STIX]{x1D6F9}\left(\sqrt{\frac{\unicode[STIX]{x1D6FE}-1}{2}}\right)-\unicode[STIX]{x1D6F9}\left(\frac{\unicode[STIX]{x1D6FE}-1}{2}\,U\sin \unicode[STIX]{x1D714}^{\prime }\unicode[STIX]{x1D702}+\sqrt{\frac{\unicode[STIX]{x1D6FE}-1}{2}}\right)\right],\qquad\end{eqnarray}$$
 $$\begin{eqnarray}\displaystyle u^{\prime }+c^{\prime } & = & \displaystyle \frac{\unicode[STIX]{x1D6FE}+1}{2}\,U\sin \unicode[STIX]{x1D714}^{\prime }\unicode[STIX]{x1D702}+\sqrt{\frac{\unicode[STIX]{x1D6FE}-1}{2}\hat{Z}[1+\unicode[STIX]{x1D6EC}_{3}(1)]}\nonumber\\ \displaystyle & & \displaystyle +\,\frac{\unicode[STIX]{x1D6FE}-1}{2}\left[\unicode[STIX]{x1D6F9}\left(\sqrt{\frac{\unicode[STIX]{x1D6FE}-1}{2}}\right)-\unicode[STIX]{x1D6F9}\left(\frac{\unicode[STIX]{x1D6FE}-1}{2}\,U\sin \unicode[STIX]{x1D714}^{\prime }\unicode[STIX]{x1D702}+\sqrt{\frac{\unicode[STIX]{x1D6FE}-1}{2}}\right)\right],\qquad\end{eqnarray}$$
 $$\begin{eqnarray}\displaystyle u^{\prime }-c^{\prime } & = & \displaystyle \frac{3-\unicode[STIX]{x1D6FE}}{2}\,U\sin \unicode[STIX]{x1D714}^{\prime }\unicode[STIX]{x1D702}-\sqrt{\frac{\unicode[STIX]{x1D6FE}-1}{2}\hat{Z}[1+\unicode[STIX]{x1D6EC}_{3}(1)]}\nonumber\\ \displaystyle & & \displaystyle -\,\frac{\unicode[STIX]{x1D6FE}-1}{2}\left[\unicode[STIX]{x1D6F9}\left(\sqrt{\frac{\unicode[STIX]{x1D6FE}-1}{2}}\right)-\unicode[STIX]{x1D6F9}\left(\frac{\unicode[STIX]{x1D6FE}-1}{2}\,U\sin \unicode[STIX]{x1D714}^{\prime }\unicode[STIX]{x1D702}+\sqrt{\frac{\unicode[STIX]{x1D6FE}-1}{2}}\right)\right].\qquad\end{eqnarray}$$
In this problem of choice, the velocity
 $u^{\prime }$
remains a simple sinusoidal function of the characteristic coordinate
 $\unicode[STIX]{x1D702}^{\prime }$
while
 $c^{\prime }$
is a more complicated function of that coordinate due to the real-gas correction. These functions are a consequence of the particular boundary condition and not a general rule. For example, if the wave described above reflected on the right at an open end of the duct or partially open end (e.g. orifice in a wall), the velocity in the reflecting wave would have a real-gas correction described through the
 $\unicode[STIX]{x1D6F9}$
function. Another example would relate to disturbances of the type found in combustion instability problems where, at specific locations, the divergence of the velocity could be a function of the thermodynamic variables.
The difference in slopes of the characteristics between the positive and negative peaks of the wave gives a measure of compressive wave steepening and broadening of the expansion portion as the sinusoidal shape transforms towards an N-wave. Specifically, one has
 $$\begin{eqnarray}\displaystyle \unicode[STIX]{x0394}(u^{\prime }+c^{\prime }) & = & \displaystyle (\unicode[STIX]{x1D6FE}+1)U\nonumber\\ \displaystyle & & \displaystyle +\,\frac{\unicode[STIX]{x1D6FE}-1}{2}\left[\unicode[STIX]{x1D6F9}\left(\sqrt{\frac{\unicode[STIX]{x1D6FE}-1}{2}}-\frac{\unicode[STIX]{x1D6FE}-1}{2}U\right)-\unicode[STIX]{x1D6F9}\left(\sqrt{\frac{\unicode[STIX]{x1D6FE}-1}{2}}+\frac{\unicode[STIX]{x1D6FE}-1}{2}U\right)\right].\nonumber\\ \displaystyle & & \displaystyle\end{eqnarray}$$
The real-gas properties modify the rate of steepening as indicated by the difference in the
 $\unicode[STIX]{x1D6F9}$
function.
5.2 Results for piston-driven wave
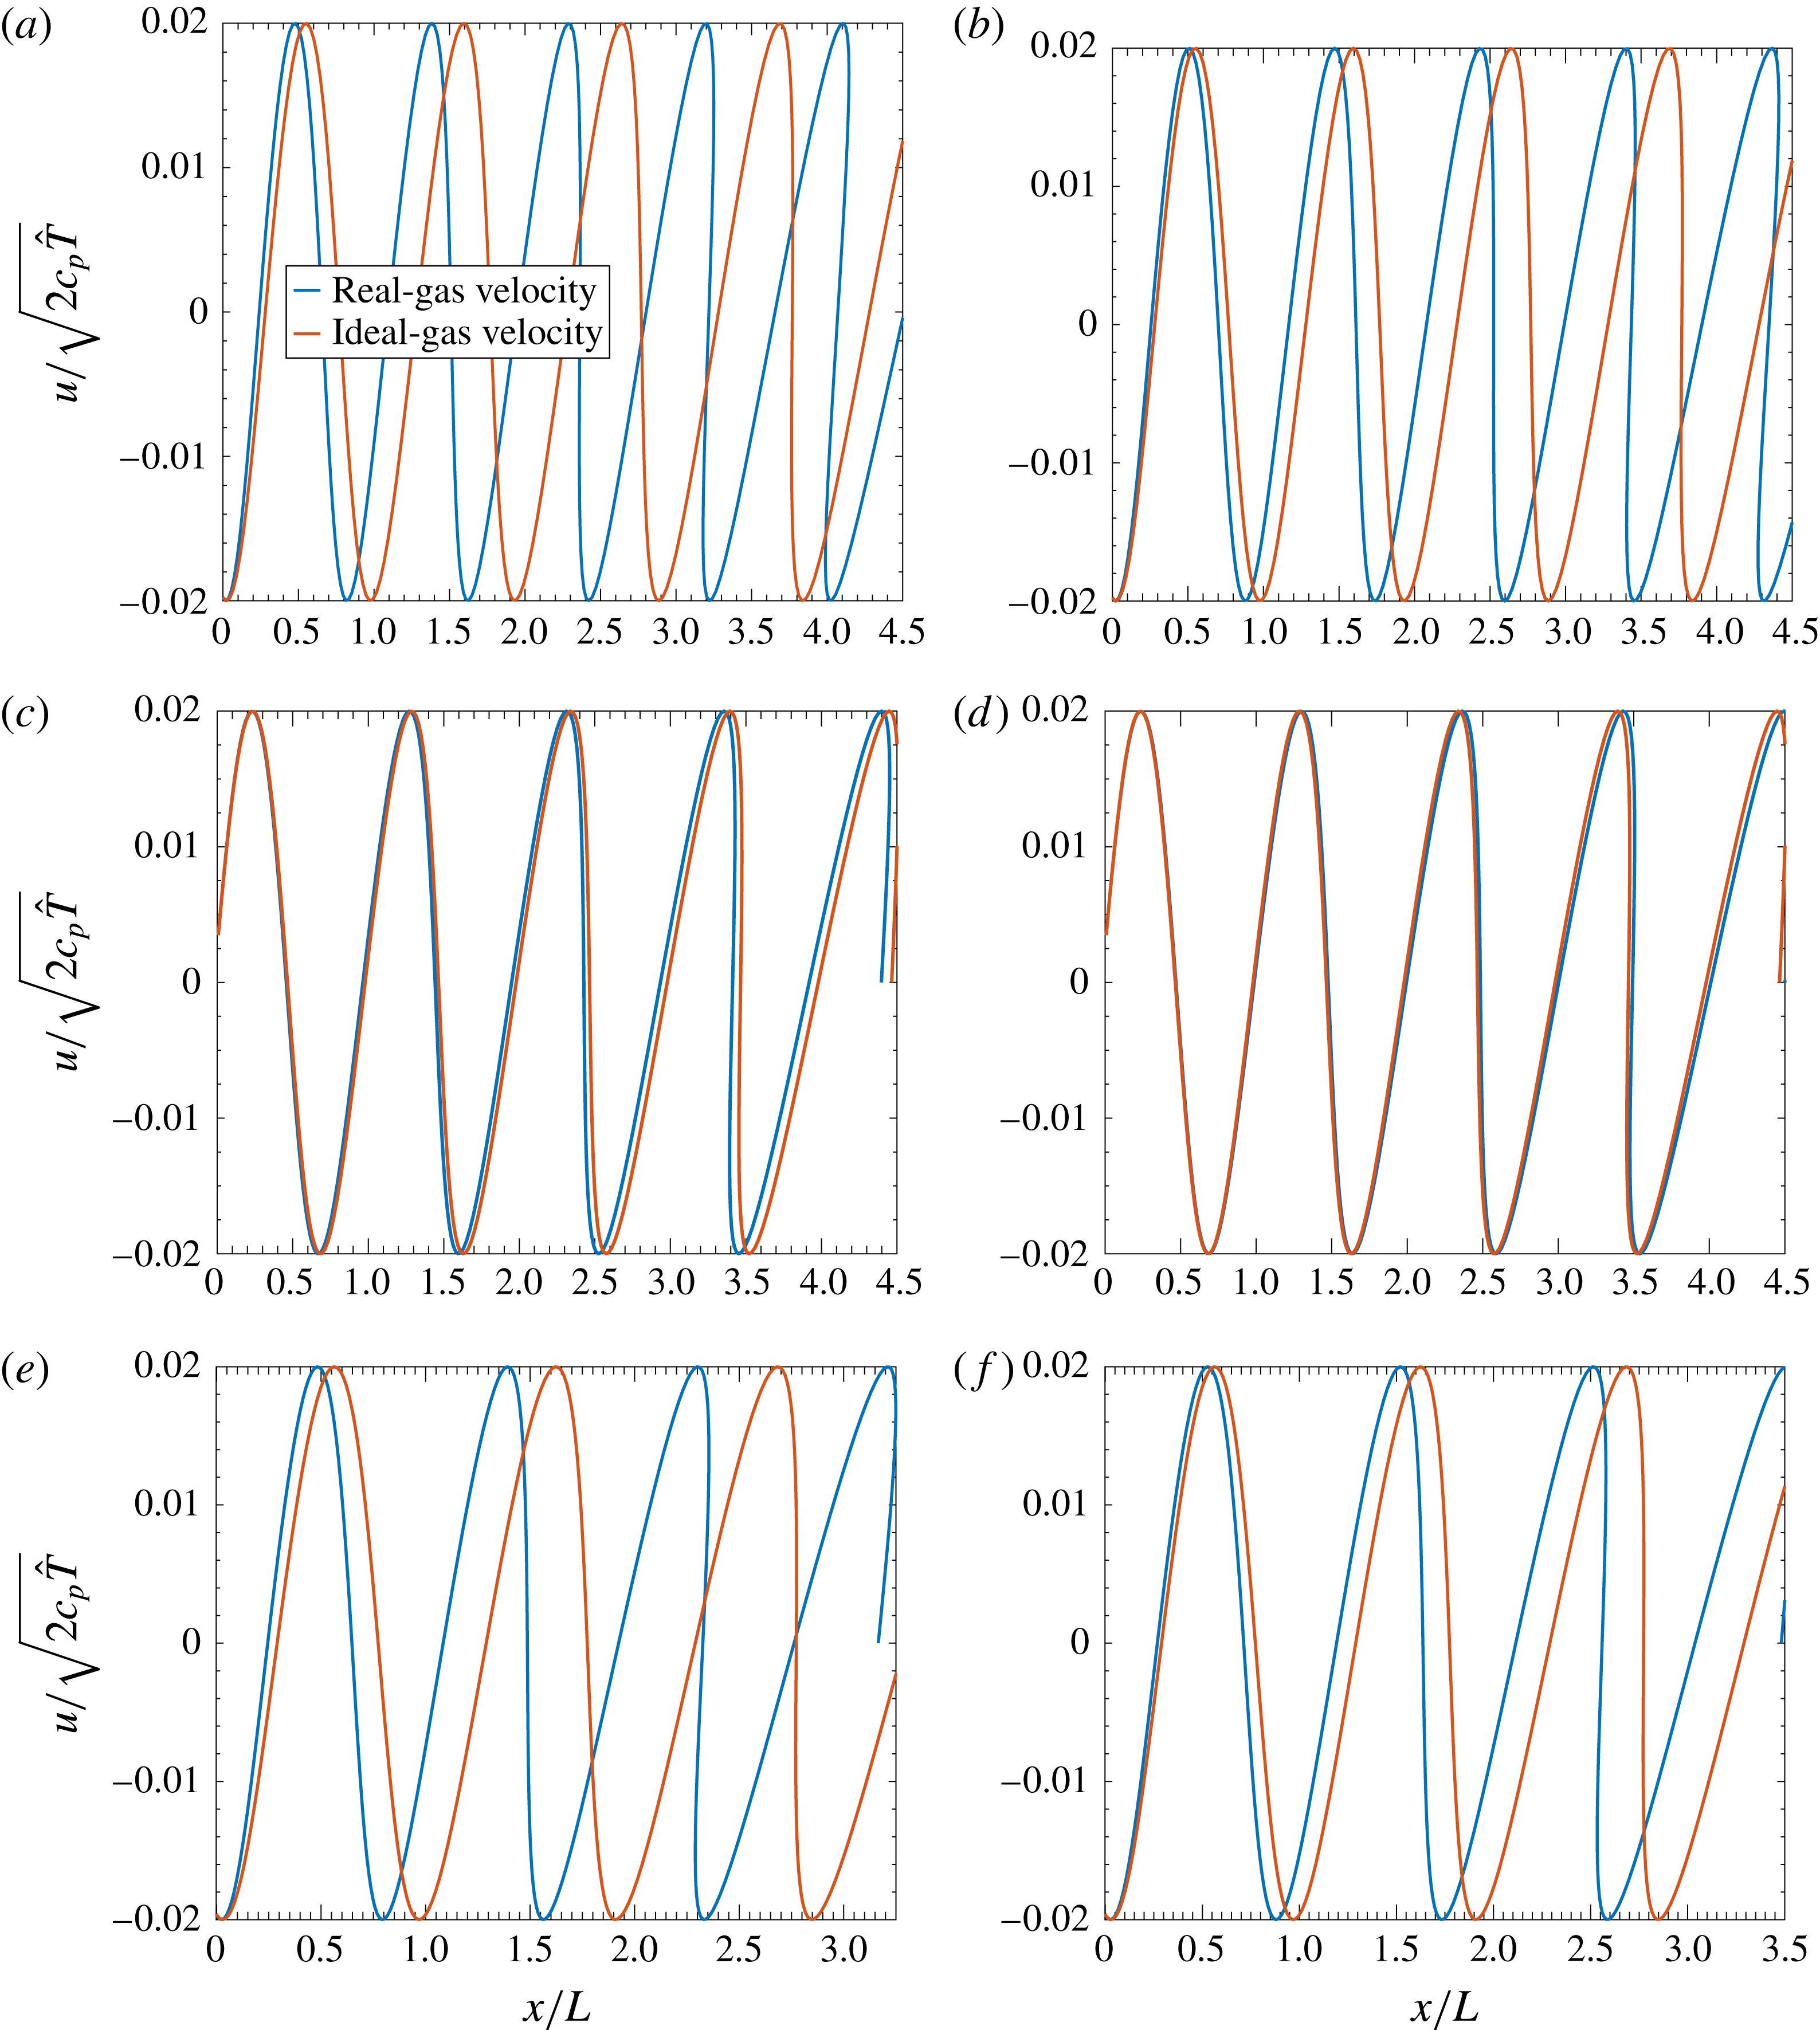
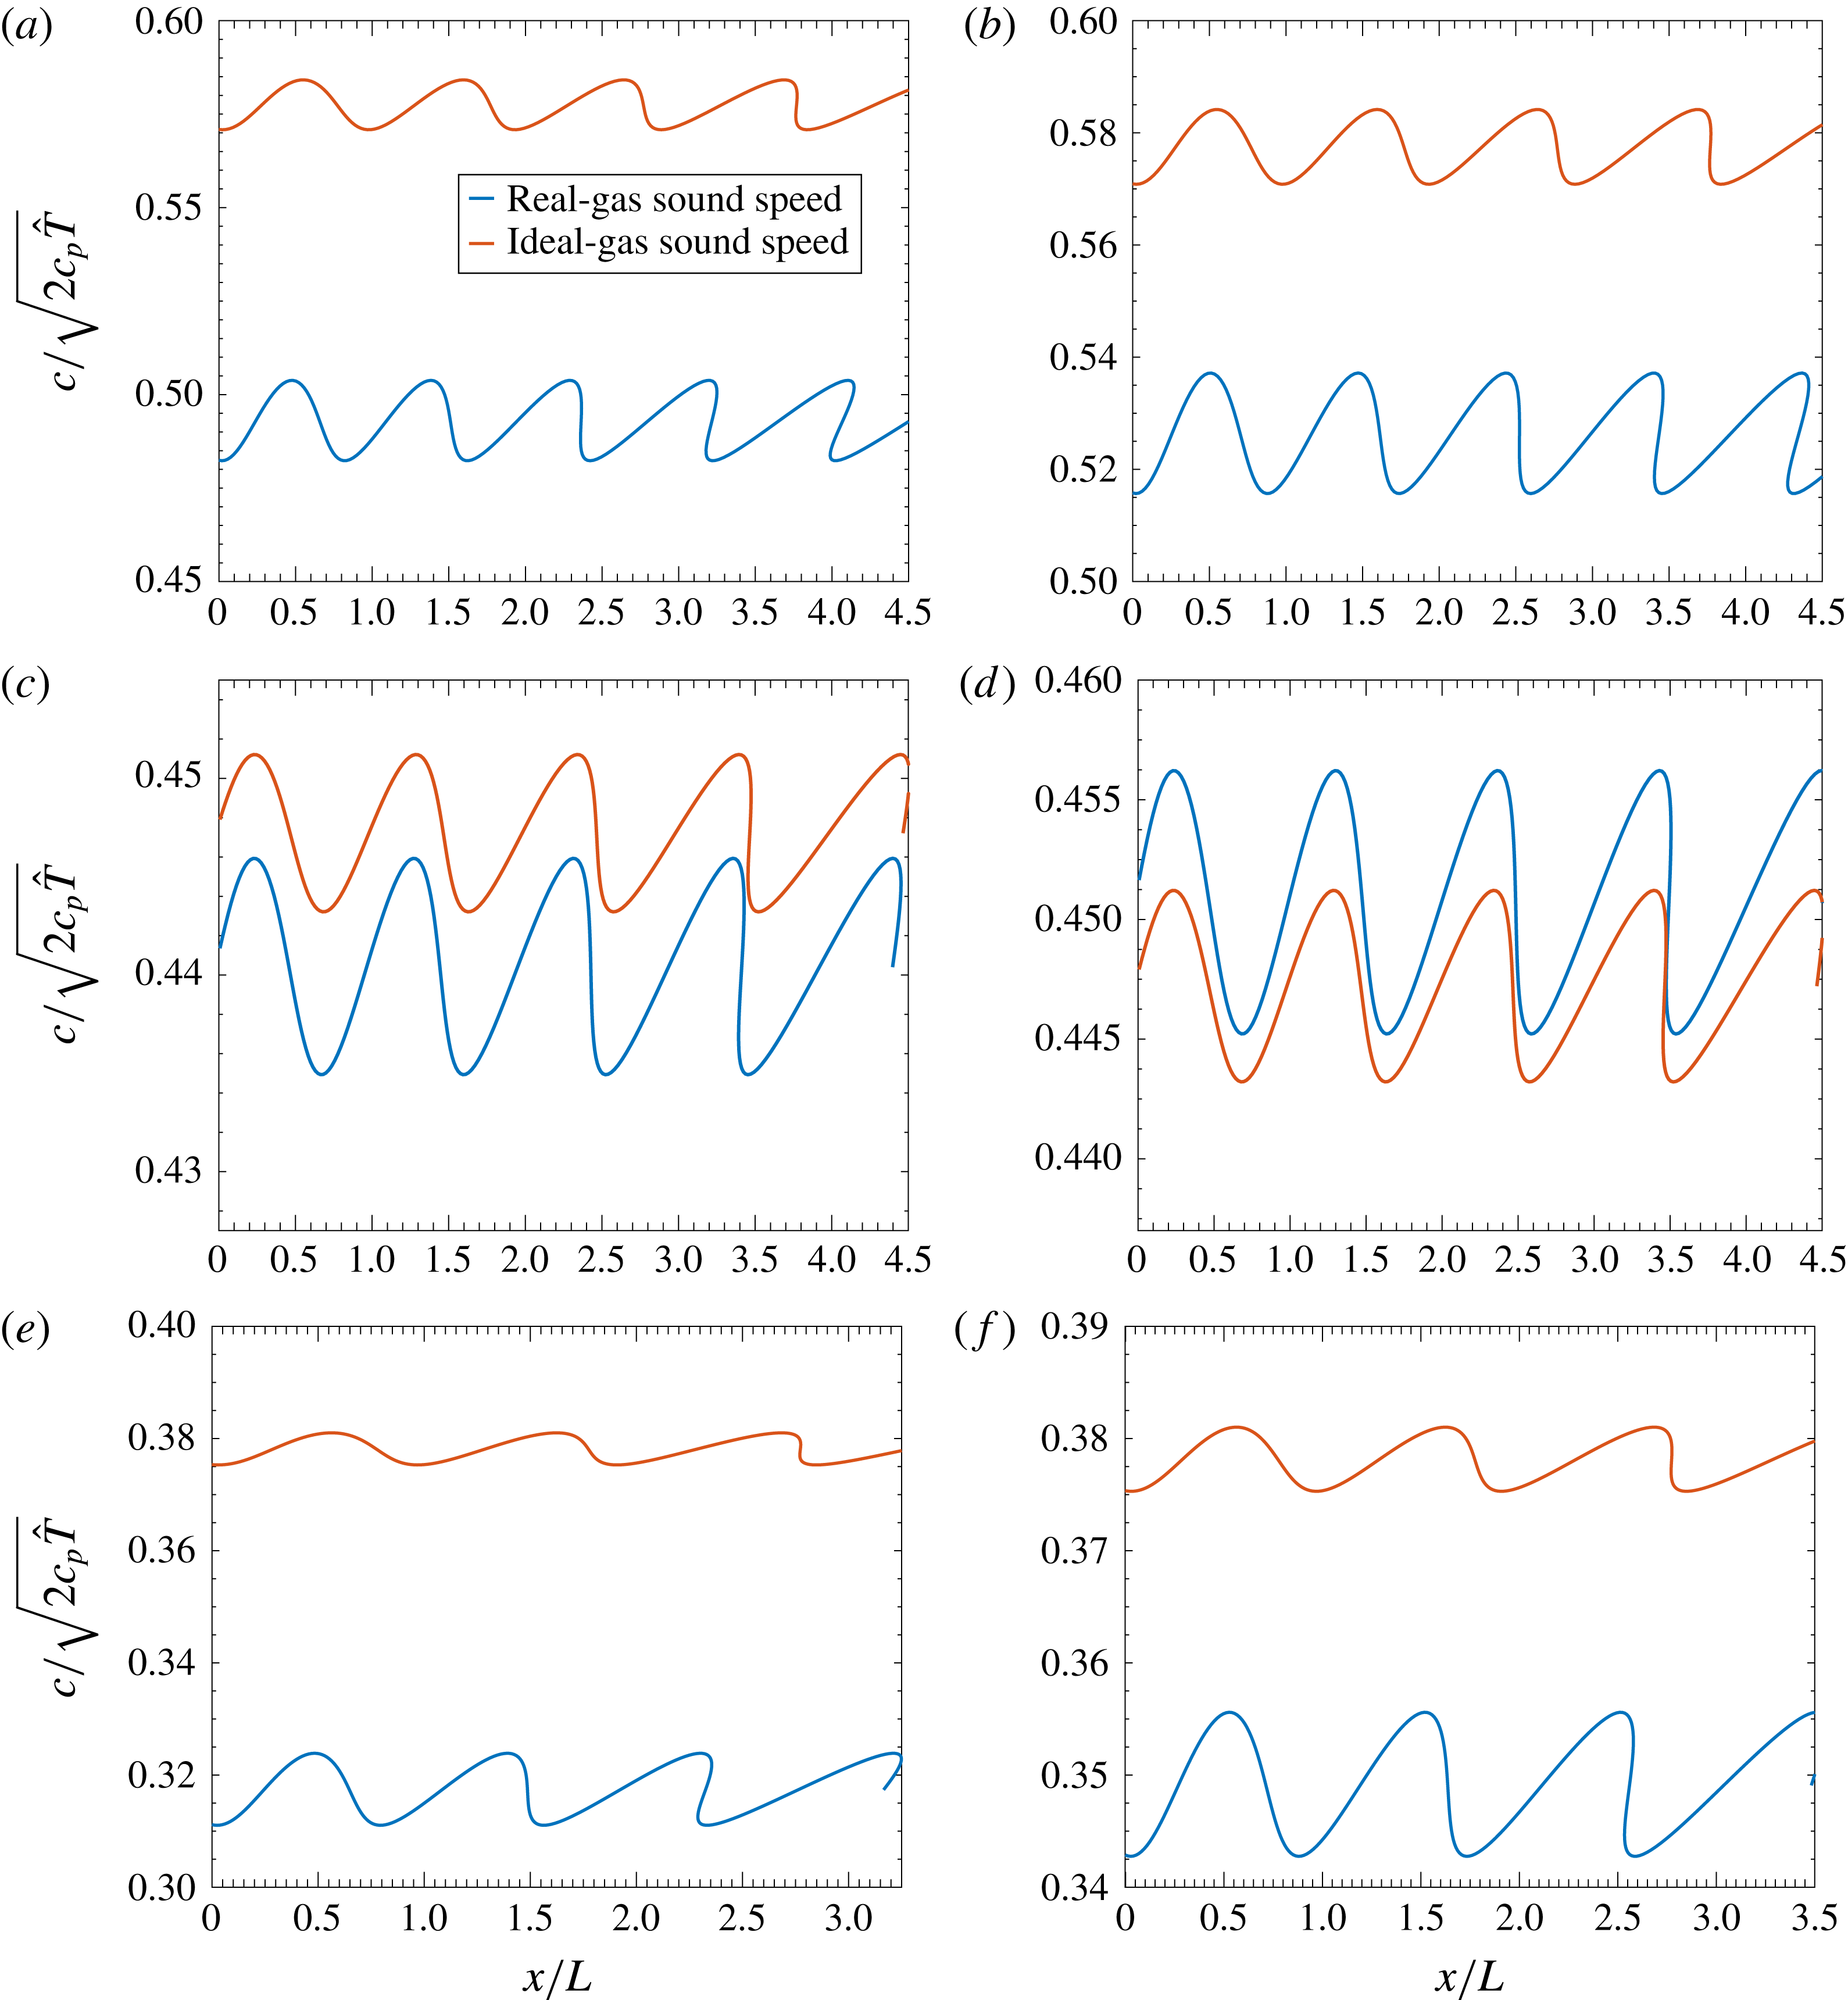
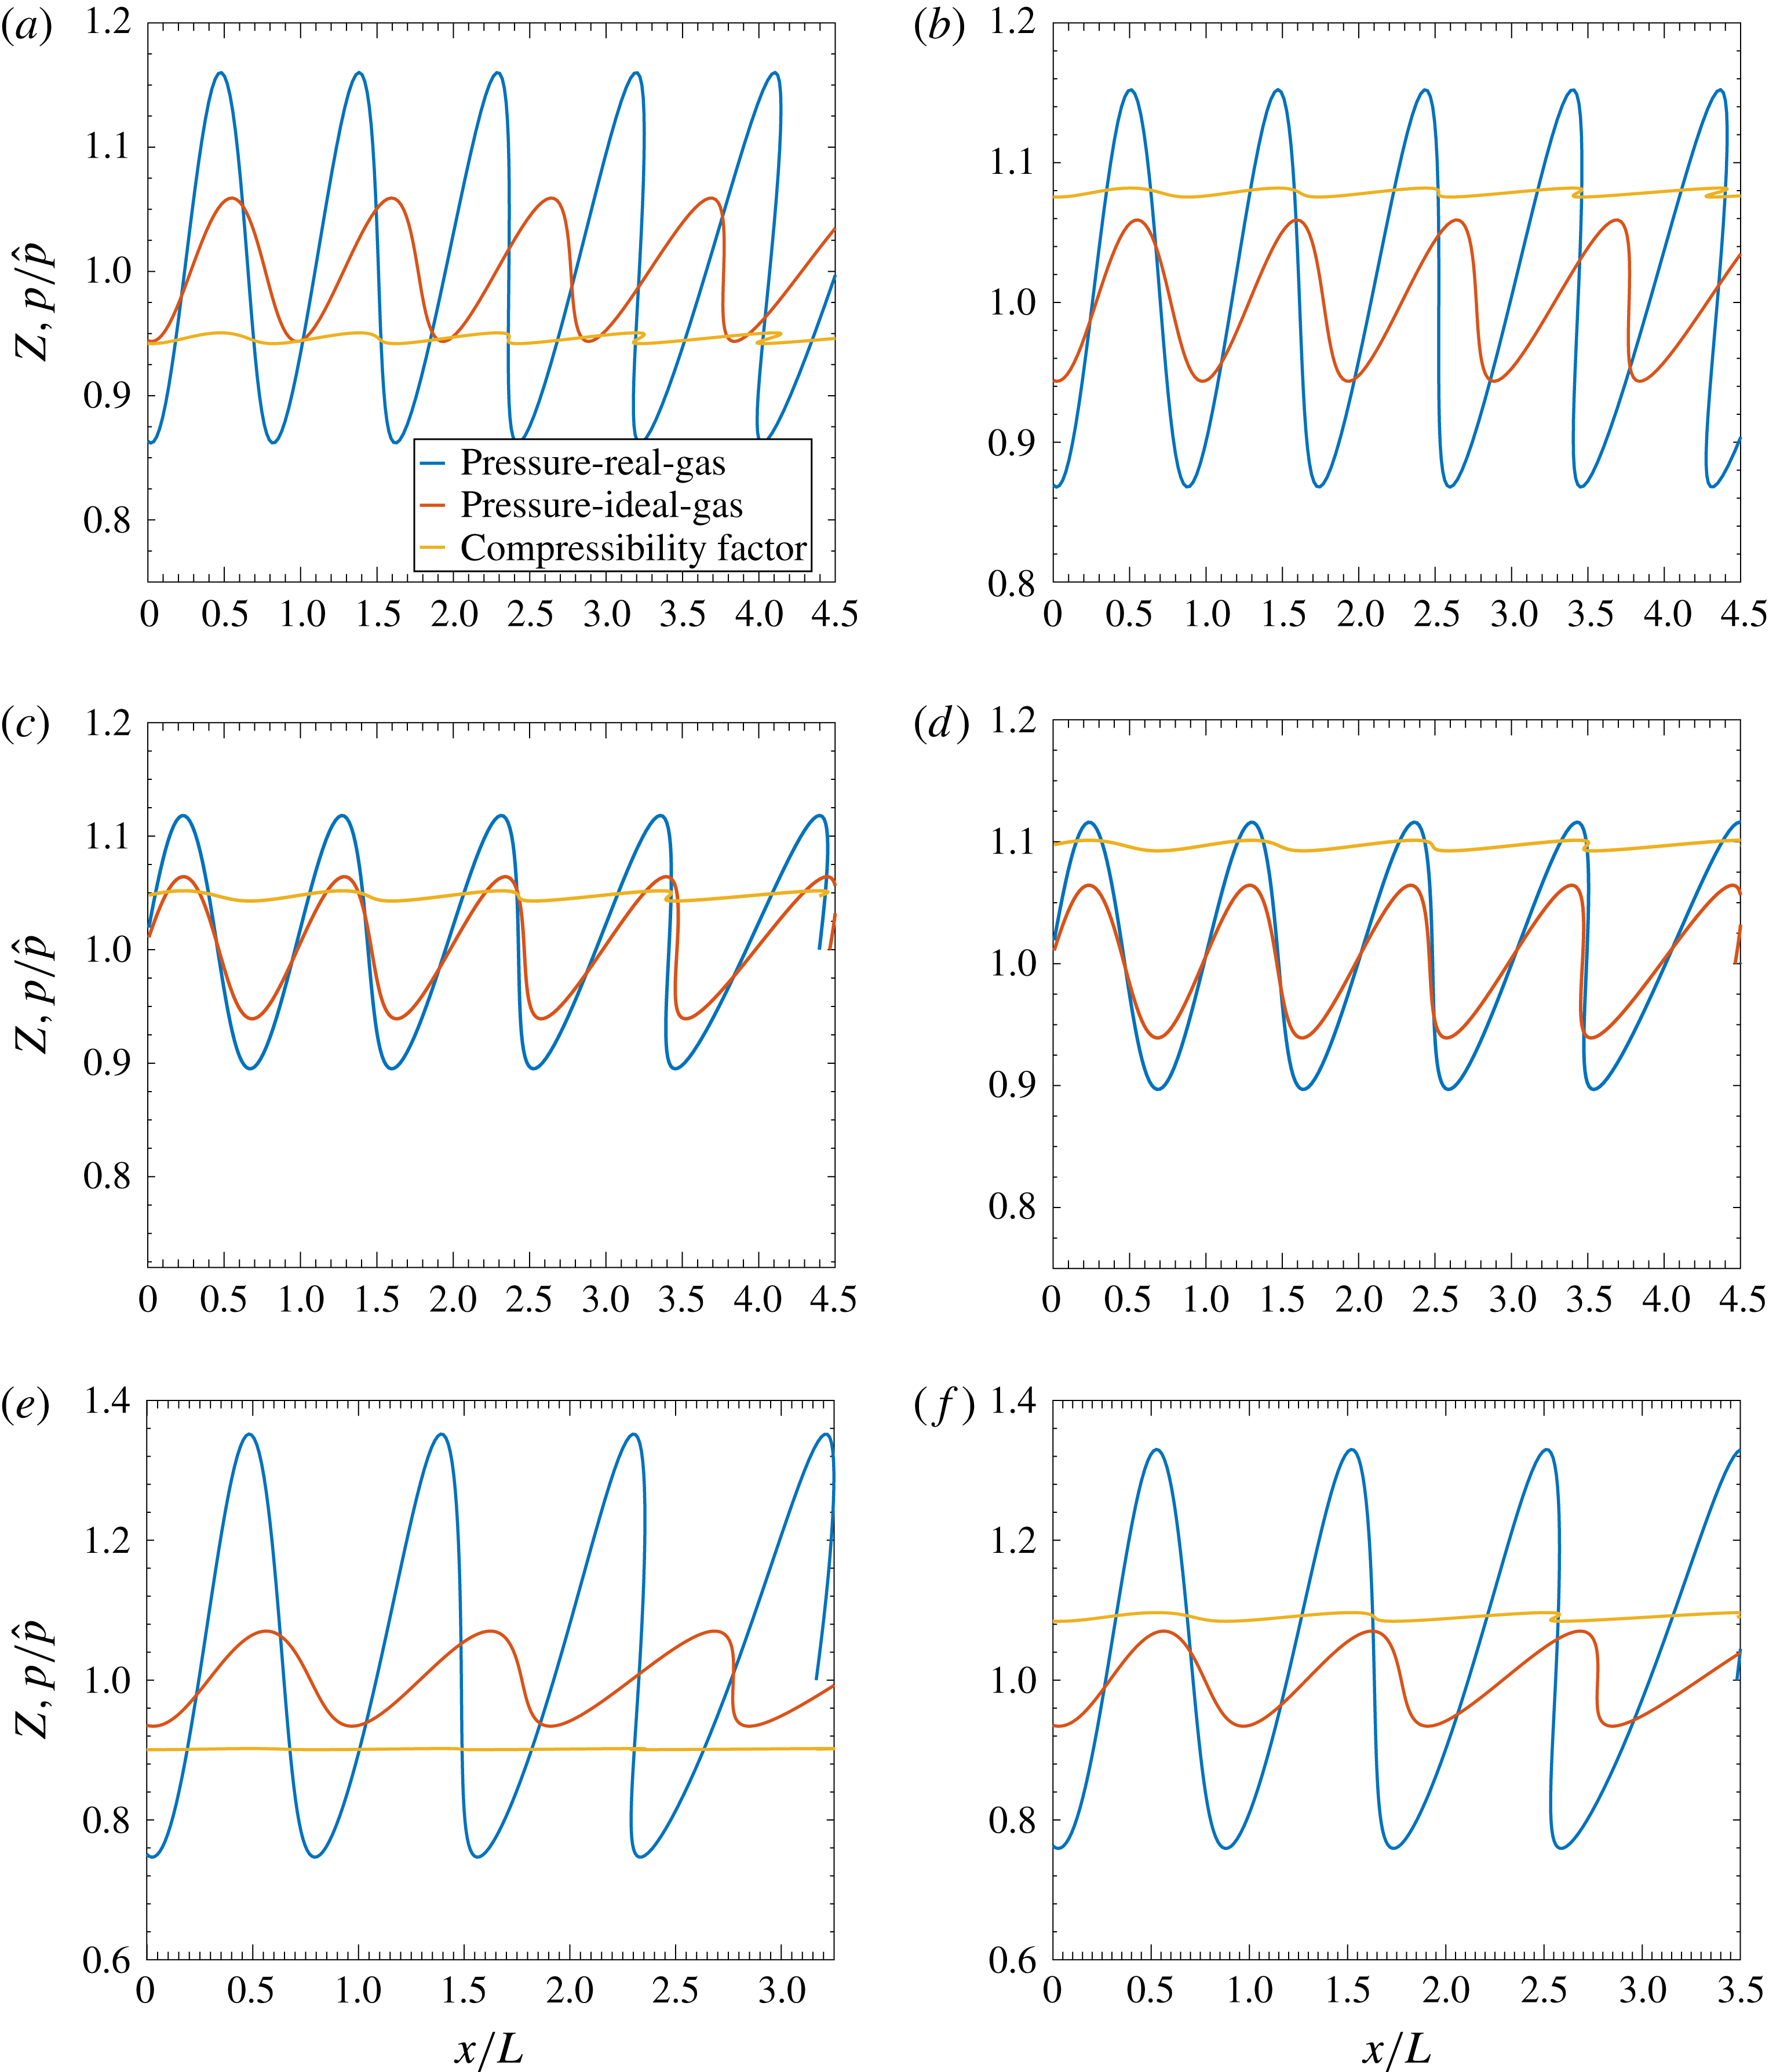
Results are presented in figures 5–7 for the same gases and stagnation conditions that were considered in the nozzle flow analysis. Non-dimensional velocity, sound speed and pressure versus non-dimensional spatial location are given for both the ideal-gas and real-gas calculations at a time
 $t^{\prime }=10$
, which is roughly the time for a wave to travel four to six wavelengths. (The non-dimensional frequency increases with
 $\unicode[STIX]{x1D6FE}$
here.) The non-dimensional velocity amplitude of the piston is given as
 $U=0.02$
, which is roughly 15–30 times smaller than the speed of sound, depending on the temperature. With the normalization scheme, the results easily scale to any frequency of piston oscillation. Generally, the original sinusoidal waveform distorts in well-known fashion towards an N-shaped waveform; multi-valued solutions are allowed to develop in physical space to emphasize the wave distortion; of course, a shock discontinuity must form, leaving only single-valued solutions.
Velocity is shown in figure 5. The same amplitude is maintained and is determined by the amplitude of piston motion for all cases. The ideal-gas and real-gas solutions for
 $u(\unicode[STIX]{x1D702})$
are identical sinusoidal functions, but solutions for
 $u(t^{\prime },x^{\prime })$
differ because the sound speeds differ. The real-gas wave generally moves slower than the ideal-gas wave. A modest exception occurs with nitrogen at the higher temperature. Ideal gases with higher
 $\unicode[STIX]{x1D6FE}$
and lower molecular mass tend to move more wavelengths as expected. The real gas does not follow the same trend. The differences between real and ideal behaviour is greater for carbon dioxide and argon than for nitrogen.
Comparison of non-dimensional velocity for piston-driven flow between real-gas flow and ideal-gas flow: (a) argon, 300 K, 10 MPa; (b) argon, 1000 K, 30 MPa; (c) nitrogen, 400 K, 12 MPa; (d) nitrogen, 1000 K, 30 MPa; (e) carbon dioxide, 450 K, 10 MPa; (f) carbon dioxide, 1000 K, 30 MPa.

In figure 6, modest to profound differences in sound speed from the ideal-gas behaviour are seen. At lower temperatures, especially for carbon dioxide, the average real-gas sound speed is lower than the average ideal-gas value. At higher temperatures, the nitrogen real gas has a modestly higher sound speed. The real-gas sound speed amplitudes are generally higher than the ideal-gas amplitudes. The explanation follows from the facts that the
 $\unicode[STIX]{x1D6F9}$
function is negative and it oscillates out of phase with the velocity and sound speed. Thus,
 $\unicode[STIX]{x1D6F9}$
has a positive contribution in (5.17), thereby increasing the value of
 $c^{\prime }$
amplitude above the ideal-gas value.
Comparison of non-dimensional sound speed for piston-driven flow between real-gas flow and ideal-gas flow: (a) argon, 300 K, 10 MPa; (b) argon, 1000 K, 30 MPa; (c) nitrogen, 400 K, 12 MPa; (d) nitrogen, 1000 K, 30 MPa; (e) carbon dioxide, 450 K, 10 MPa; (f) carbon dioxide, 1000 K, 30 MPa.

Figure 7 shows that the real-gas pressure has the most profound differences from the ideal gas; pressure amplitude is substantially increased at all temperatures but especially for the lower-temperature carbon dioxide, where an approximate tripling and doubling of the ideal-gas pressure amplitude case occurs at certain temperatures. Through the Riemann invariant, the velocity
 $u$
and sound speed
 $c$
are related linearly for the ideal gas and with a weakly nonlinear relation for the real gas. Consequently, the magnitudes of their amplitudes are comparable. However, the relation between pressure and sound speed involves a power law with exponent
 $2\unicode[STIX]{x1D6FE}/(\unicode[STIX]{x1D6FE}-1)$
, which affects the triatomic gas more than the diatomic gas (and in turn more than the monatomic gas). This power relation not only makes pressure amplitudes larger than other amplitudes for both the ideal and real gases, but also accentuates the difference between real and ideal gases. A higher pressure amplitude for the larger molecules is needed to achieve the amplitude of sound speed (or effectively the temperature and enthalpy amplitudes) demanded through the Riemann invariant by the magnitude of piston velocity, that is, the higher specific heat requires that the piston do more work raising the needed product of pressure and velocity.
Comparison of non-dimensional pressure for piston-driven flow between real-gas flow and ideal-gas flow: (a) argon, 300 K, 10 MPa; (b) argon, 1000 K, 30 MPa; (c) nitrogen, 400 K, 12 MPa; (d) nitrogen, 1000 K, 30 MPa; (e) carbon dioxide, 450 K, 10 MPa; (f) carbon dioxide, 1000 K, 30 MPa.

The magnitudes of
 $Z-1$
, which capture the difference between real and ideal gases, are significant. The compressibility factor is seen in figure 7 to increase generally with temperature for these gases with values below one found for argon and carbon dioxide at lower temperatures. The amplitude of oscillation is more modest than found for other variables.
The author is unaware of previously published modifications to Riemann invariants owing to real-gas EoS effects.
6 Shock relations
The classical shock relations are built around the ideal-gas assumption, specifically, the relation
 $h=(\unicode[STIX]{x1D6FE}/(\unicode[STIX]{x1D6FE}-1))(p/\unicode[STIX]{x1D70C})$
is used. However, from (B 5),
 $$\begin{eqnarray}\displaystyle h & = & \displaystyle \frac{\unicode[STIX]{x1D6FE}}{\unicode[STIX]{x1D6FE}-1}\frac{p}{\unicode[STIX]{x1D70C}Z}+RT[B-2A+A^{\prime }]\nonumber\\ \displaystyle & {\approx} & \displaystyle \frac{\unicode[STIX]{x1D6FE}}{\unicode[STIX]{x1D6FE}-1}\frac{p}{\unicode[STIX]{x1D70C}}\left[1+\frac{2-\unicode[STIX]{x1D6FE}}{\unicode[STIX]{x1D6FE}}A-\frac{1}{\unicode[STIX]{x1D6FE}}B+\frac{\unicode[STIX]{x1D6FE}-1}{\unicode[STIX]{x1D6FE}}A^{\prime }\right]=\frac{\unicode[STIX]{x1D6FE}}{\unicode[STIX]{x1D6FE}-1}\frac{p}{\unicode[STIX]{x1D70C}}[1+\unicode[STIX]{x1D701}],\end{eqnarray}$$
where
 $\unicode[STIX]{x1D701}$
is defined by the last equation. The conservation equations for mass, normal momentum, transverse momentum and energy across the shock wave can easily be manipulated into the following forms:
 $$\begin{eqnarray}\displaystyle & \displaystyle \frac{u_{1}}{u_{2}}=\frac{\unicode[STIX]{x1D70C}_{2}}{\unicode[STIX]{x1D70C}_{1}}, & \displaystyle\end{eqnarray}$$
 $$\begin{eqnarray}\displaystyle & \displaystyle u_{1}+\frac{p_{1}}{\unicode[STIX]{x1D70C}_{1}u_{1}}=u_{2}+\frac{p_{2}}{\unicode[STIX]{x1D70C}_{2}u_{2}}, & \displaystyle\end{eqnarray}$$
 $$\begin{eqnarray}\displaystyle & \displaystyle v_{1}=v_{2}, & \displaystyle\end{eqnarray}$$
 $$\begin{eqnarray}\displaystyle & \displaystyle \frac{\unicode[STIX]{x1D6FE}}{\unicode[STIX]{x1D6FE}-1}\frac{p_{1}}{\unicode[STIX]{x1D70C}_{1}}[1+\unicode[STIX]{x1D701}_{1}]+\frac{u_{1}^{2}}{2}=\frac{\unicode[STIX]{x1D6FE}}{\unicode[STIX]{x1D6FE}-1}\frac{p_{2}}{\unicode[STIX]{x1D70C}_{2}}[1+\unicode[STIX]{x1D701}_{2}]+\frac{u_{2}^{2}}{2}=\frac{\unicode[STIX]{x1D6FE}+1}{2(\unicode[STIX]{x1D6FE}-1)}c^{\ast 2}={\hat{h}}-\frac{v_{1}^{2}}{2}, & \displaystyle\end{eqnarray}$$
where
 $u$
and
 $v$
are the normal and transverse velocity components, respectively. Subscripts 1 and 2 pertain respectively to conditions on the upstream and downstream sides of the shock. Upstream conditions for
 $p_{1},~T_{1},~u_{1}$
and
 $v_{1}$
are regarded as given, with these conservation laws determining the downstream values. The other interesting upstream variables can also be readily determined. Given
 $p_{1}$
and
 $T_{1}$
, the value of
 $\unicode[STIX]{x1D70C}_{1}$
is readily determined from
 $Z=1+B-A$
. Equation (6.1) determines
 $\unicode[STIX]{x1D701}_{1}$
. The characteristic velocity
 $c^{\ast }$
is an abstract velocity with value between
 $u_{1}$
and
 $u_{2}$
that is determined by the stagnation enthalpy less the kinetic energy per unit mass associated with the transverse flow; so, with knowledge of
 $u_{1}$
and
 $v_{1}$
, the values
 ${\hat{h}}_{1}={\hat{h}}_{2}$
and
 $c^{\ast }=\sqrt{[2(\unicode[STIX]{x1D6FE}-1)/(\unicode[STIX]{x1D6FE}+1)][{\hat{h}}_{1}-v_{1}^{2}/2]}$
are determined. For the normal shock,
 $c^{\ast }$
is directly proportional to the square root of stagnation enthalpy.
6.1 Modified Prandtl relation
It is apparent that, for the ideal gas where
 $\unicode[STIX]{x1D701}_{1}=\unicode[STIX]{x1D701}_{2}=0$
, the enthalpy term in the energy conservation equation is easily related to the pressure term in the normal-momentum conservation equation. However, a more complex relation exists for a real gas. Using the energy equation to substitute into the pressure term of the momentum equation, it follows that
 $$\begin{eqnarray}\displaystyle \left[\frac{\unicode[STIX]{x1D6FE}+1}{\unicode[STIX]{x1D6FE}-1}\frac{c^{\ast 2}}{u_{1}}-u_{1}\right]\frac{1}{1+\unicode[STIX]{x1D701}_{1}}+\frac{2\unicode[STIX]{x1D6FE}}{\unicode[STIX]{x1D6FE}-1}u_{1}=\left[\frac{\unicode[STIX]{x1D6FE}+1}{\unicode[STIX]{x1D6FE}-1}\frac{c^{\ast 2}}{u_{2}}-u_{2}\right]\frac{1}{1+\unicode[STIX]{x1D701}_{2}}+\frac{2\unicode[STIX]{x1D6FE}}{\unicode[STIX]{x1D6FE}-1}u_{2}. & & \displaystyle\end{eqnarray}$$
After multiplying the left
 $c^{\ast 2}$
by
 $u_{2}/u_{2}$
and the right
 $c^{\ast 2}$
by
 $u_{1}/u_{1}$
, expanding with the small values of
 $\unicode[STIX]{x1D701}_{1}$
and
 $\unicode[STIX]{x1D701}_{2}$
, and factoring out
 $u_{2}-u_{1}$
, the relation becomes
 $$\begin{eqnarray}\displaystyle 1=\frac{c^{\ast 2}}{u_{1}u_{2}}\left[1-\frac{\unicode[STIX]{x1D701}_{1}u_{2}-\unicode[STIX]{x1D701}_{2}u_{1}}{u_{2}-u_{1}}\right]-\frac{\unicode[STIX]{x1D6FE}-1}{\unicode[STIX]{x1D6FE}+1}\,\frac{\unicode[STIX]{x1D701}_{2}u_{2}-\unicode[STIX]{x1D701}_{1}u_{1}}{u_{2}-u_{1}}. & & \displaystyle\end{eqnarray}$$
To lowest order, the classical Prandtl relation
 $c^{\ast 2}=u_{1}u_{2}$
is obtained and may be used to substitute into the higher-order term, yielding
 $$\begin{eqnarray}\displaystyle \frac{c^{\ast 2}}{u_{1}u_{2}}=1+\frac{\unicode[STIX]{x1D701}_{1}u_{2}-\unicode[STIX]{x1D701}_{2}u_{1}}{u_{2}-u_{1}}+\frac{\unicode[STIX]{x1D6FE}-1}{\unicode[STIX]{x1D6FE}+1}\,\frac{\unicode[STIX]{x1D701}_{2}u_{2}-\unicode[STIX]{x1D701}_{1}u_{1}}{u_{2}-u_{1}}. & & \displaystyle\end{eqnarray}$$
Consistently with the approximation here,
 $u_{2}=c^{\ast 2}/u_{1}$
may be substituted on the right-hand side of this equation to yield the modified Prandtl shock relation for high-pressure environments:
 $$\begin{eqnarray}\displaystyle \frac{c^{\ast 2}}{u_{1}u_{2}}=1+\frac{\unicode[STIX]{x1D701}_{1}c^{\ast 2}-\unicode[STIX]{x1D701}_{2}u_{1}^{2}}{c^{\ast 2}-u_{1}^{2}}+\frac{\unicode[STIX]{x1D6FE}-1}{\unicode[STIX]{x1D6FE}+1}\,\frac{\unicode[STIX]{x1D701}_{2}c^{\ast 2}-\unicode[STIX]{x1D701}_{1}u_{1}^{2}}{c^{\ast 2}-u_{1}^{2}}. & & \displaystyle\end{eqnarray}$$
In some cases, numerical difficulties occur with the form of (6.9) because some of the terms on the right-hand side occasionally involve the ratio of two small numbers. It becomes more convenient at times to solve (6.6) as a quadratic equation for
 $u_{2}$
, using the negative-sign option in the classical formula and iterating to update volumes of
 $\unicode[STIX]{x1D701}_{2}$
.
For the limit of the ideal gas, the classical
 $c^{\ast 2}=u_{1}u_{2}$
is recovered and, in the limit of shock strength going to zero for the ideal gas,
 $c^{\ast }=u_{1}=u_{2}=c$
. This is not the general real-gas result;
 $c^{\ast 2}$
remains proportional to the stagnation enthalpy but the relation with velocity is more complex.
The limiting characteristic velocity value can be determined as the strength of the shock wave goes to zero, i.e.
 $u_{2}\rightarrow u_{1}$
. Equations (6.1) and (6.9) are used with the definition of
 $c^{\ast }$
to obtain
 $$\begin{eqnarray}c^{\ast 2}=\left[1+\frac{2\unicode[STIX]{x1D6FE}}{\unicode[STIX]{x1D6FE}+1}\unicode[STIX]{x1D701}_{1}\right]u_{1}^{2}=2\frac{\unicode[STIX]{x1D6FE}-1}{\unicode[STIX]{x1D6FE}+1}{\hat{h}}_{1}=2\frac{\unicode[STIX]{x1D6FE}-1}{\unicode[STIX]{x1D6FE}+1}\left[h_{1}+\frac{u_{1}^{2}}{2}\right],\end{eqnarray}$$
 $$\begin{eqnarray}\displaystyle u_{1}^{2} & = & \displaystyle \frac{(\unicode[STIX]{x1D6FE}-1)h_{1}}{1+\unicode[STIX]{x1D6FE}\unicode[STIX]{x1D701}_{1}}\approx (\unicode[STIX]{x1D6FE}-1)h_{1}(1-\unicode[STIX]{x1D6FE}\unicode[STIX]{x1D701}_{1})\nonumber\\ \displaystyle & = & \displaystyle \frac{\unicode[STIX]{x1D6FE}p_{1}}{\unicode[STIX]{x1D70C}_{1}}(1+\unicode[STIX]{x1D701}_{1})(1-\unicode[STIX]{x1D6FE}\unicode[STIX]{x1D701}_{1})\approx \frac{\unicode[STIX]{x1D6FE}p_{1}}{\unicode[STIX]{x1D70C}_{1}}[1-(\unicode[STIX]{x1D6FE}-1)\unicode[STIX]{x1D701}_{1}].\end{eqnarray}$$
This limiting velocity for the real gas is generally not the characteristic velocity. In particular,
 $c^{\ast }$
does not go to
 $c_{1}$
as shock strength goes to zero. Here
 $\unicode[STIX]{x1D701}$
is the fractional departure of
 $(\unicode[STIX]{x1D6FE}-1)h$
from
 $\unicode[STIX]{x1D6FE}p/\unicode[STIX]{x1D70C}$
and
 $-(\unicode[STIX]{x1D6FE}-1)\unicode[STIX]{x1D701}_{1}/2$
is the fractional departure of the limiting wave speed from
 $\sqrt{\unicode[STIX]{x1D6FE}p_{1}/\unicode[STIX]{x1D70C}_{1}}.$
Thus,
 $[Z_{1}-1-(\unicode[STIX]{x1D6FE}-1)\unicode[STIX]{x1D701}_{1}]/2$
is the fractional departure of the limiting wave speed from
 $\sqrt{\unicode[STIX]{x1D6FE}RT_{1}}.$
When the attraction parameter
 $A_{1}$
becomes larger (smaller) than the repulsion parameter
 $B_{1}$
,
 $Z_{1}-1$
becomes negative (positive) but
 $\unicode[STIX]{x1D701}_{1}$
tends towards becoming positive (negative). The change in sign does not occur simultaneously for
 $\unicode[STIX]{x1D701}$
and
 $Z-1$
. Nevertheless, real-gas limiting wave speed tends to be larger (smaller) than the ideal-gas value when
 $B_{1}>A_{1}$
(
 $B_{1}<A_{1}$
).
An interesting set of normal shock calculations for real-gas flow of air at upstream values
 $T_{1}=700$
K,
 $p_{1}=1$
, 4 and 50 MPa is given by Kouremenos & Antonopoulos (Reference Kouremenos and Antonopoulos1989). They use the original Redlich–Kwong form of the EoS but qualitative differences are not expected with our SRK form. Results are reported for the range
 $1.2\leqslant M_{1}\leqslant 5.5$
. That paper makes no mention of a modified Prandtl relation or modified Rankine–Hugoniot relation.
6.2 Modified Rankine–Hugoniot relation
Next, the modifications of the Rankine–Hugoniot relation are examined by manipulation of the conservation laws of (6.5). Combination of the normal-momentum and continuity relations yields
 $$\begin{eqnarray}\displaystyle u_{1}^{2}=\frac{p_{2}-p_{1}}{\unicode[STIX]{x1D70C}_{2}-\unicode[STIX]{x1D70C}_{1}}\frac{\unicode[STIX]{x1D70C}_{2}}{\unicode[STIX]{x1D70C}_{1}},\quad u_{2}^{2}=\frac{p_{2}-p_{1}}{\unicode[STIX]{x1D70C}_{2}-\unicode[STIX]{x1D70C}_{1}}\frac{\unicode[STIX]{x1D70C}_{1}}{\unicode[STIX]{x1D70C}_{2}}. & & \displaystyle\end{eqnarray}$$
Substitution for the velocity terms in the energy equation and multiplication by the factor
 $\unicode[STIX]{x1D70C}_{1}/p_{1}$
gives a linear relation for the pressure ratio
 $p_{2}/p_{1}$
in terms of
 $\unicode[STIX]{x1D70C}_{2}/\unicode[STIX]{x1D70C}_{1},~\unicode[STIX]{x1D6FE},~\unicode[STIX]{x1D701}_{1}$
and
 $\unicode[STIX]{x1D701}_{2}$
. Solution of that linear relation yields the modified Rankine–Hugoniot relation:
 $$\begin{eqnarray}\displaystyle \frac{p_{2}}{p_{1}}=\left[\frac{\unicode[STIX]{x1D70C}_{2}}{\unicode[STIX]{x1D70C}_{1}}-\frac{\unicode[STIX]{x1D6FE}-1}{\unicode[STIX]{x1D6FE}+1+2\unicode[STIX]{x1D6FE}\unicode[STIX]{x1D701}_{1}}\right]\left[1-\frac{\unicode[STIX]{x1D6FE}-1}{\unicode[STIX]{x1D6FE}+1+2\unicode[STIX]{x1D6FE}\unicode[STIX]{x1D701}_{2}}\frac{\unicode[STIX]{x1D70C}_{2}}{\unicode[STIX]{x1D70C}_{1}}\right]^{-1}. & & \displaystyle\end{eqnarray}$$
Equations (6.9) and (6.13) give the classical Prandtl and Rankine–Hugoniot relations when
 $\unicode[STIX]{x1D701}_{1}=\unicode[STIX]{x1D701}_{2}=0$
. Solutions to the modified relations can readily be obtained in a two-step iteration. First, taking
 $\unicode[STIX]{x1D701}_{1}=\unicode[STIX]{x1D701}_{2}=0$
and given upstream values for
 $u_{1},~v_{1},~p_{1}$
and
 $\unicode[STIX]{x1D70C}_{1}$
, equations (6.9) and (6.13), together with transverse-momentum and continuity equations in (6.5), yield the zeroth-order approximations to the downstream values, i.e.
 $u_{2}^{\ast },~p_{2}^{\ast }$
and
 $\unicode[STIX]{x1D70C}_{2}^{\ast }$
and the correct value for
 $v_{2}$
. Next, using these values for
 $p_{2}^{\ast }$
and
 $\unicode[STIX]{x1D70C}_{2}^{\ast }$
with the ideal-gas relation, the values of
 $T_{2}^{\ast }$
and
 $\unicode[STIX]{x1D701}_{2}$
are determined with sufficient accuracy. Substitution of
 $\unicode[STIX]{x1D701}_{1}$
and
 $\unicode[STIX]{x1D701}_{2}$
into (6.9), (6.13) and the continuity equation gives
 $u_{2},~p_{2}$
and
 $\unicode[STIX]{x1D70C}_{2}$
with the desired accuracy. Then,
 $T_{2}$
is determined from
 $Z=1+B-A$
and
 $h_{2}={\hat{h}}-(u_{2}^{2}+v_{2}^{2})/2.$
As the pressure ratio
 $p_{2}/p_{1}\rightarrow \infty$
in (6.13), it follows that
 $$\begin{eqnarray}\displaystyle \left.\begin{array}{@{}c@{}}\displaystyle \frac{\unicode[STIX]{x1D70C}_{2}}{\unicode[STIX]{x1D70C}_{1}}\rightarrow \frac{\unicode[STIX]{x1D6FE}+1+2\unicode[STIX]{x1D6FE}\unicode[STIX]{x1D701}_{2}}{\unicode[STIX]{x1D6FE}-1},\\ \displaystyle \unicode[STIX]{x1D701}_{2}=\frac{2-\unicode[STIX]{x1D6FE}}{\unicode[STIX]{x1D6FE}}A-\frac{1}{\unicode[STIX]{x1D6FE}}B+\frac{\unicode[STIX]{x1D6FE}-1}{\unicode[STIX]{x1D6FE}}A^{\prime }\rightarrow \frac{1}{\unicode[STIX]{x1D6FE}}\left[\frac{\tilde{a}S^{2}}{R_{u}T_{c}}-b\right]\frac{p_{2}}{R_{u}T_{2}}=\frac{1}{\unicode[STIX]{x1D6FE}}\left[\frac{\tilde{a}S^{2}}{R_{u}T_{c}}-b\right]\frac{\unicode[STIX]{x1D70C}_{2}}{W}.\end{array}\right\}\qquad & & \displaystyle\end{eqnarray}$$
In the limits for
 $A$
and
 $A^{\prime }$
, it has been considered that temperature ratio goes to infinity as pressure ratio goes to infinity. For the ideal gas,
 $(\unicode[STIX]{x1D70C}_{2}/\unicode[STIX]{x1D70C}_{1})|_{ideal}\rightarrow (\unicode[STIX]{x1D6FE}+1)/(\unicode[STIX]{x1D6FE}-1)$
, giving a finite limiting value for
 $\unicode[STIX]{x1D70C}_{2}$
. Thus,
 $\unicode[STIX]{x1D701}_{2}$
has a finite limit, thereby yielding, for the real gas, the finite limit
 $$\begin{eqnarray}\displaystyle \left.\frac{\unicode[STIX]{x1D70C}_{2}}{\unicode[STIX]{x1D70C}_{1}}\right|_{real}\rightarrow \frac{\displaystyle \unicode[STIX]{x1D6FE}+1+2\left[\frac{\tilde{a}S^{2}}{R_{u}T_{c}}-b\right]}{\unicode[STIX]{x1D6FE}-1}\frac{\unicode[STIX]{x1D70C}_{2}}{W}=\left(1+2\frac{\unicode[STIX]{x1D70C}_{1}}{W(\unicode[STIX]{x1D6FE}-1)}\left[\frac{\tilde{a}S^{2}}{R_{u}T_{c}}-b\right]\right)\frac{\unicode[STIX]{x1D6FE}+1}{\unicode[STIX]{x1D6FE}-1}.\qquad & & \displaystyle\end{eqnarray}$$
Differentiation of
 $p_{2}$
given by (6.13) with respect to
 $\unicode[STIX]{x1D70C}_{2}$
, holding upstream values constant, and taking the limit as
 $p_{2}\rightarrow p_{1}$
, yields the result
 $$\begin{eqnarray}\displaystyle \left.\frac{\text{d}p_{2}}{\text{d}\unicode[STIX]{x1D70C}_{2}}\right|_{p_{2}\rightarrow p_{1}}=\frac{\unicode[STIX]{x1D6FE}p_{1}}{\unicode[STIX]{x1D70C}_{1}}\left[\left.1-(\unicode[STIX]{x1D6FE}-1)\unicode[STIX]{x1D701}_{1}-\frac{\unicode[STIX]{x1D6FE}-1}{\unicode[STIX]{x1D6FE}+1}\unicode[STIX]{x1D70C}_{1}\frac{\text{d}\unicode[STIX]{x1D701}_{2}}{\text{d}\unicode[STIX]{x1D70C}_{2}}\right|_{p_{2}\rightarrow p_{1}}\right]. & & \displaystyle\end{eqnarray}$$
The derivative
 $\text{d}\unicode[STIX]{x1D701}_{2}/\text{d}\unicode[STIX]{x1D70C}_{2}$
in (6.16) is taken along the path
 $p_{2}(\unicode[STIX]{x1D70C}_{2})$
defined by (6.13). Specifically,
 $\unicode[STIX]{x1D701}_{2}$
taken from (6.1) should be cast as
 $\unicode[STIX]{x1D701}_{2}(p_{2},\unicode[STIX]{x1D70C}_{2})$
. The derivative of
 $\unicode[STIX]{x1D701}_{2}$
involves both the explicit derivative and the implicit derivative through
 $p_{2}(\unicode[STIX]{x1D70C}_{2})$
. For the latter derivative, the approximate form
 $(\text{d}p_{2}/\text{d}\unicode[STIX]{x1D70C}_{2})|_{p_{2}\rightarrow p_{1}}=\unicode[STIX]{x1D6FE}p_{1}/\unicode[STIX]{x1D70C}_{1}$
suffices in this higher-order term. As known, for the ideal gas, in this limit of shock strength going to zero, the derivative along the Rankine–Hugoniot curve given by (6.16) goes to the value for the derivative along the isentropic particle path in that limiting situation, namely,
 $(\text{d}p_{2}/\text{d}\unicode[STIX]{x1D70C}_{2})|_{p_{2}\rightarrow p_{1}}\rightarrow \unicode[STIX]{x1D6FE}p_{1}/\unicode[STIX]{x1D70C}_{1}=c^{2}=(\unicode[STIX]{x2202}p_{2}/\unicode[STIX]{x2202}\unicode[STIX]{x1D70C}_{2})|_{s}$
. For the general case of the real gas, this tangency also occurs.
The entropy gain across the shock is of third order in non-dimensional pressure gain for an ideal gas. This means that, in the limiting behaviour of a weak shock,
 $T\,\text{d}s=\text{d}h-(1/\unicode[STIX]{x1D70C})\,\text{d}p\ll \text{d}h\approx (1/\unicode[STIX]{x1D70C})\,\text{d}p$
along the direct integration path (monotonic variations) from upstream to downstream conditions. A second-order-accurate measure of this condition can be created using the mean-value theorem. Namely, the magnitude of
 $\unicode[STIX]{x1D6E5}\equiv (\unicode[STIX]{x1D70C}_{1}/p_{1})[h_{2}-h_{1}]-2[p_{2}/p_{1}-1]/[\unicode[STIX]{x1D70C}_{2}/\unicode[STIX]{x1D70C}_{1}+1]$
can be compared to the magnitude of
 $(\unicode[STIX]{x1D70C}_{1}/p_{1})[h_{2}-h_{1}]$
(or
 $2[p_{2}/p_{1}-1]/[\unicode[STIX]{x1D70C}_{2}/\unicode[STIX]{x1D70C}_{1}+1]$
).
6.3 Shock results
Results for two cases with nitrogen gas are examined in figures 8 and 9, with upstream flow values for temperature and pressure given by 400 K, 10 MPa and 300 K, 3 MPa, respectively. These examples involve upstream conditions at supercritical pressure and supercritical temperature and at subcritical pressure and supercritical temperature, respectively. An attempt is made to choose upstream values that keep errors due to linearization small in the downstream flow. Among other things, this disallows treatment of compressible liquids at supercritical pressures and subcritical temperatures. Nitrogen is favoured because it has the lowest critical values of the gases selected here for computations in other sections; thereby the upstream pressure and temperature are taken at sufficiently low values to keep the
 $A$
and
 $B$
parameters behind the shock low enough to validate the linearization.
Calculations are made over a range of
 $u_{1}$
values and displayed in figures 8 and 9. Some portions of the range are not physically reasonable since the second law of thermodynamics is not reflected in the algorithms. For example, portions of the curves where ratios of pressure, density, temperature and enthalpy drop below values of one have been disregarded and are not shown in the figures.
Significant differences in the Rankine–Hugoniot (RH) plots are generally seen in figures 8(a) and 9(a). The largest differences in pressure ratio between the real gas and the ideal gas occur near the limiting density ratios, which themselves differ substantially. In these cases, the real gas has a smaller value for the upper limit on density ratio. Both the real and ideal cases are each calculated in two ways as an error estimate on the linearization: (i) downstream pressure and density are calculated and then the ratios are ‘directly’ formed; and (ii) the RH formula is calculated. The error is small enough to make useful conclusions. Figures 8(a) and 9(a) and other results not shown here indicate that the real-gas pressure ratio generally appears larger (smaller) than the ideal-gas ratio when
 $B>A~(A>B)$
. (This should not be taken as a strict rule, since quantities such as
 $A^{\prime }$
and
 $A^{\prime \prime }$
can have an influence.) At some values of density ratio, the RH results from figures 8(a) and 9(a) show very large differences in pressure ratio between the ideal gas and the real gas; in particular, the real-gas shock is much stronger there. This behaviour is consistent with the results for the continuous wave given in figure 7, where real gases had larger pressure amplitudes for the same forcing mechanism; the continuous waves there are expected to deform to N-shaped waveforms with shock formation. Note however that, at the same shock velocity
 $u_{1}$
, the ideal gas can yield the greater pressure ratio as shown in figures 8(b) and 9(b). The velocity ratio, however, will be given as the reciprocal of the density ratio; thus the fractional change in velocity is smaller for the real gas in these cases.
Shock wave – comparison of non-dimensional solutions between real gas and ideal gas for nitrogen, at
 $T_{1}=400$
K,
 $p_{1}=10~\text{MPa}$
,
 $u_{1}=400{-}2500~\text{m}~\text{s}^{-1}$
: (a) Rankine–Hugoniot relation; (b) pressure ratio versus shock velocity; (c) enthalpy and temperature ratios; (d) upstream and downstream Mach numbers; (e) compressibility factor
 $Z$
, attraction parameter
 $A$
, repulsion parameter
 $B$
; (f) non-dimensional shock jumps in pressure, entropy and enthalpy, and
 $M_{2}-1$
.

Shock wave – comparison of non-dimensional solutions between real gas and ideal gas for nitrogen, at
 $T_{1}=300$
K,
 $p_{1}=3~\text{MPa}$
,
 $u_{1}=350{-}2000~\text{m}~\text{s}^{-1}$
: (a) Rankine–Hugoniot relation; (b) pressure ratio versus shock velocity; (c) enthalpy and temperature ratios; (d) upstream and downstream Mach numbers; (e) compressibility factor
 $Z$
, attraction parameter
 $A$
, repulsion parameter
 $B$
; (f) non-dimensional shock jumps in pressure, entropy and enthalpy, and
 $M_{2}-1$
.

Enthalpy and temperature show differences for the real gas in figures 8(c) and 9(c); downstream ideal-gas temperature exceeds real-gas temperature for the same shock velocity. Generally, non-dimensional enthalpy exceeds non-dimensional temperature for the real gas. Figures 8(d) and 9(d) show that, for the given upstream conditions, the shock Mach number is smaller for the real gas. Figures 8(e) and 9(e) show that a portion of the domain has the values of
 $A$
and
 $B$
within desirable constraints for accuracy; however, for other portions, they achieve magnitudes near 0.4, which raises our error estimates to above 10 %.
Figure 8(f) shows the results for nitrogen at upstream values of 400 K, 10 MPa. In similar fashion to the previous example in the same figure, an inflow velocity of approximately
 $450~\text{m}~\text{s}^{-1}$
,
 $p_{2}\rightarrow p_{1},~\unicode[STIX]{x1D70C}_{2}\rightarrow \unicode[STIX]{x1D70C}_{1},~h_{2}\rightarrow h_{1},~T_{2}\rightarrow T_{1}$
and
 $Z_{2}\rightarrow Z_{1}$
are found. Figure 8(f) also shows that the approximate measure
 $\unicode[STIX]{x1D6E5}$
related to entropy change is going to the zero limit and is higher order in magnitude.
The low-temperature nitrogen case is examined through figure 9. Here, the limiting behaviour presents no surprises. At an inflow velocity of
 $357~\text{m}~\text{s}^{-1}$
,
 $p_{2}\rightarrow p_{1},~\unicode[STIX]{x1D70C}_{2}\rightarrow \unicode[STIX]{x1D70C}_{1},~h_{2}\rightarrow h_{1},~T_{2}\rightarrow T_{1},~Z_{2}\rightarrow Z_{1}$
and
 $M_{2}\rightarrow M_{1}\rightarrow 1$
. Within our error here,
 $Z_{1}=1$
; the limit should show ideal-gas behaviour. In the calculations here (including unpublished cases), no cases with
 $M_{1}<1$
and entropy gain were found; they should be physically unstable if they exist as mathematical solutions.
Some analytical support can be given for the finding of limiting velocities not at the sonic speed. The relation between enthalpy and sound from (C 16) and (6.1) yields
 $$\begin{eqnarray}\displaystyle \unicode[STIX]{x1D6FE}\frac{p}{\unicode[STIX]{x1D70C}}=\frac{c^{2}}{1+\unicode[STIX]{x1D70E}}=\frac{(\unicode[STIX]{x1D6FE}-1)h}{1+\unicode[STIX]{x1D701}}, & & \displaystyle\end{eqnarray}$$
and thus
 $$\begin{eqnarray}\displaystyle h\approx \frac{c^{2}}{\unicode[STIX]{x1D6FE}-1}[1+\unicode[STIX]{x1D701}-\unicode[STIX]{x1D70E}]. & & \displaystyle\end{eqnarray}$$
The energy conservation across the shock may be developed as follows and combined with the momentum relation:
 $$\begin{eqnarray}\displaystyle \left.\begin{array}{@{}c@{}}\displaystyle h_{2}-h_{1}=\frac{u_{1}^{2}-u_{2}^{2}}{2}=\frac{u_{1}+u_{2}}{2}(u_{1}-u_{2}),\\ \displaystyle \unicode[STIX]{x1D6FF}h=\left.\frac{u_{1}+u_{2}}{2\unicode[STIX]{x1D70C}_{1}u_{1}}\right|_{u_{2}\rightarrow u_{1}}\unicode[STIX]{x1D6FF}p\rightarrow \frac{1}{\unicode[STIX]{x1D70C}_{1}}\unicode[STIX]{x1D6FF}p.\end{array}\right\} & & \displaystyle\end{eqnarray}$$
The definitions
 $\unicode[STIX]{x1D6FF}h=h_{2}-h_{1},~\unicode[STIX]{x1D6FF}u=u_{2}-u_{1}$
, etc. are applied in the limit as the jump across the shock is disappearing. As the jump across the shock becomes small, the asymptote is giving an isentropic result as shown by comparison with the differential relation that describes the combined first and second laws, i.e.
 $T\,\text{d}s=\text{d}h-(1/\unicode[STIX]{x1D70C})\,\text{d}p$
.
Table 4 compares present approximate calculations with the cubic-equation computations of Kouremenos & Antonopoulos (Reference Kouremenos and Antonopoulos1989), now designated as KA. Ratios of pressure and temperature plus downstream Mach number are compared for certain upstream Mach numbers. Subscripts
 $KA$
and
 $S$
are used in the table for the results of Kouremenos & Antonopoulos (Reference Kouremenos and Antonopoulos1989) and the current results, respectively. The KA computations were done for a normal shock in air using the Redlich–Kwong EoS, while the S results treat a normal shock in nitrogen and use the linearized SRK EoS. The quantitative KA results were interpreted from their graph (Kouremenos & Antonopoulos Reference Kouremenos and Antonopoulos1989, figure 2); so, the number of trusted significant digits was limited. They made no comparison with ideal-gas results. Table 4 shows that KA and S results compare favourably. For the chosen range of
 $M_{1}$
,
 $Z_{2}$
varied from 1.02 to 1.06 in the S results, increasing with
 $M_{1}$
; and the downstream pressure, temperature and density were each lower than the value yielded for the ideal gas, with the difference increasing with
 $M_{1}$
. The KA article also had results for 50 MPa, which yields too high a value of
 $Z_{2}-1$
to apply our linearization and make a useful comparison;
 $Z_{2}=1.2$
and higher downstream.
Comparison with Kouremenos & Antonopoulos (Reference Kouremenos and Antonopoulos1989) normal shock calculations. Values for upstream Mach number, downstream Mach number, temperature ratio and pressure ratio. Upstream values were 700 K and 4 MPa.

7 Concluding remarks
A method of linearization in parameter space has been shown to be useful in describing and explaining nonlinear real-gas behaviour. The countering effects of intermolecular repulsion and attraction become more clearly visible. Monatomic, diatomic and triatomic gases were studied at high and low temperatures. Generally, repulsion becomes more dominant at higher temperatures while attraction tends to prevail at lower temperatures. The approximate method provides a numerical description which, over a wide (albeit limited) parameter range, is sufficiently accurate for interesting compressible flows at elevated pressures. It is important to linearize the EoS for enthalpy as well as the cubic EoS for density; also, the speed-of-sound function must be properly expanded. The treatment identifies the substantial simplification of the ideal gas where enthalpy, sound-speed squared, temperature and pressure–density ratio are all directly proportional to each other.
While the Soave–Redlich–Kwong (SRK) cubic EoS has been chosen and single-component gases have been examined, the method for extension has been identified. Other well-known cubic equations provide the same linear form with modest changes in parameter dependence on temperature. The rules for treating mixtures are identified in the literature and have been summarized here.
Three types of simple compressible flows have been treated: choked-nozzle flow with expansion to supersonic flow, a nonlinear acoustical wave driven by an oscillating piston, and a normal shock wave. The differences amongst monatomic species, diatomic species and triatomic species are often consequential. Interesting corrections to ideal-gas behaviour are identified. Often, the corrections have different signs at high and low temperatures because of differences of relative strengths of the repulsion and attraction parameters (i.e. increases or decreases from the ideal-gas values). Corrections are found in the choked-nozzle discharge, optimal thrust, Riemann invariants, Prandtl shock relation and Rankine–Hugoniot relation. Specifically, a study is made of the effects of variations from the three independent constants formed in ideal-gas treatment by the powerful relations
 $c^{2}=(\unicode[STIX]{x1D6FE}-1)h=\unicode[STIX]{x1D6FE}p/\unicode[STIX]{x1D70C}=\unicode[STIX]{x1D6FE}RT$
. None of these equalities hold for the real gas.
Nozzle discharge coefficients could be greater or less than the ideal-gas value, depending on stagnation conditions and the particular gas. The different behaviours are related to the relative strengths of the attraction parameter
 $A$
and the repulsion parameter
 $B$
in the EoS. No clear trends were seen for optimal thrust values.
A modified Rankine–Hugoniot relation and a modified Prandtl relation are developed for the real gas. Large differences in pressure ratio for the real and ideal gases are found near the limiting density ratio. As shock strength goes to zero for the real gas, the limiting speed is the sonic speed limit found also for the ideal gas.
The pressure amplitude in a piston-driven oscillation could be very large for the real gas, especially for a triatomic species. This behaviour is consistent with results from the modified Rankine–Hugoniot results whereby pressure jumps for real-gas shocks can be substantially larger than jumps for the ideal-gas shocks. At lower temperatures, the real gas has a significantly lower sound speed than the ideal gas.
While there is risk in generalization based on a limited number of calculations, the findings are that the greatest cause of deviations between real-gas and ideal-gas compressible flows is the real-gas escape from proportional behaviour for the square of the sound speed with enthalpy or temperature. The lack of proportionality for the real gas between the pressure–density ratio and enthalpy or temperature is also significant but not as severe.
Acknowledgements
This research was supported by the National Science Foundation under grant CBET-1333605 and by the Air Force Office of Scientific Research under grant FA9550-15-1-0033. Discussions with Professor F. Liu about the steady, one-dimensional nozzle flow have been helpful. Editorial advice from Professor S. Elghobashi is valued.
Appendix A. Comparison of linear results
Figure 10 compares, for argon, nitrogen and carbon dioxide, the exact cubic solutions for
 $Z$
to the linear solutions for
 $Z$
for a few selected cases of temperature and pressure. A low-temperature case and a high-temperature case are taken for each gas, since it affects the magnitude of
 $Z-1$
, sometimes even producing a change in sign. The linear solution is built around the smallness of
 $A$
and
 $B$
, each of which increases with increasing pressure and decreasing temperature. Let us arbitrarily only accept an error in
 $Z$
if it is less than 1 %. Figure 10 plots both the cubic relation
 $G(Z)=Z^{3}-Z^{2}+(A-B-B^{2})Z-AB$
and the linear relation
 $H(Z)=Z-1-B+A$
. The curve for second-order theory,
 $I(Z)$
, is also plotted in figure 10 and is discussed below. The horizontal line gives the zero value, so that the intersections with that line give
 $G(Z)=0$
and
 $H(Z)=0$
. These intersections identify the solutions for
 $Z$
. We see in figure 10(a,b) that acceptable linear approximations for argon are found at
 $T=300~\text{K}$
,
 $p=10~\text{MPa}$
and
 $T=1000~\text{K}$
,
 $p=30~\text{MPa}$
. Figure 10(c–f) shows that similar results for nitrogen are found at
 $T=400~\text{K}$
,
 $p=12~\text{MPa}$
and
 $T=1000~\text{K}$
,
 $p=30~\text{MPa}$
; and for carbon dioxide at
 $T=450~\text{K}$
,
 $p=10~\text{MPa}$
and
 $T=1000~\text{K}$
,
 $p=30~\text{MPa}$
. The parameters
 $A$
and
 $B$
each increase with increasing pressure and decrease with increasing temperature. Thus, these parameters can remain sufficiently bounded for our purpose here if temperature increases as pressure increases in a certain way.
Sample comparisons of exact solution to cubic equation of state for argon, nitrogen and carbon dioxide with local linear approximation: (a) argon, 300 K, 10 MPa; (b) argon, 1000 K, 30 MPa; (c) nitrogen, 400 K, 12 MPa; (d) nitrogen, 1000 K, 30 MPa; (e) carbon dioxide, 450 K, 10 MPa; (f) carbon dioxide, 1000 K, 30 MPa.

The approximation concept can be extended to a polynomial solution with powers of
 $A$
and
 $B$
to make the approximation error as small as desired. For example,
 $Z=1+B-A-A^{2}+3AB$
with error of
 $O(A^{3},A^{2}B,AB^{2},B^{3})$
can be used to approximate the solution to (2.1). In figure 10,
 $H(Z)$
and
 $I(Z)$
essentially give identical results. Figure 11 plots the function
 $I(Z)=Z-1+A-B+A^{2}-3AB$
along with functions
 $G(Z)$
and
 $H(Z)$
for the case where
 $T=300~\text{K}$
and
 $p=20~\text{MPa}$
. The error for the linear approximation becomes unacceptable at this combination of a very high pressure and low temperature. An acceptable result emerges, however, for the second-order solution. The simplicity of the linear relation with error of
 $O(A^{2},AB,B^{2})$
is preferred in developing the flow solutions and further analysis is confined to domains where that error is very small. The second-order result here nevertheless demonstrates that there exists (i) a rational approximation method and (ii) a path to improvement for the temperature–pressure domains where the linear approximation is weak.
Comparison of exact solution, linear approximation and second-order approximation for cubic equation for nitrogen at 300 K, 20 MPa.

In order to ensure that second-order terms do not become too large, the linearization should be used where both
 $A$
and
 $B$
are
 $O(10^{-1})$
. It is possible that
 $B-A$
is small in magnitude but
 $A$
and
 $B$
are individually too large for accurate use of the linear method. Figure 12 shows the range for certain magnitudes of those parameters for CO
 $_{2}$
. Between the two lines in either panel
 $0.01<A<0.10$
or
 $0.01<B<0.10$
. There is a reasonably large range that covers interesting situations. To the left of both lines, the parameter is smaller than
 $0.01$
; while to the right of both lines, it is greater than
 $0.10$
. Qualitatively similar results are found for other gases.
Range of pressure and temperature (normalized by critical values) where linear approximation can be useful for nitrogen and carbon dioxide. Parameter bounds for (a) nitrogen and (b) carbon dioxide.

Relative magnitudes of
 $A$
and
 $B$
and consequence on whether
 $Z>1$
or
 $Z<1$
for isentropic expansions and compressions with given stagnation temperature and pressure: (a) argon, 300 K, 10 MPa; (b) argon, 1000 K, 30 MPa; (c) nitrogen, 400 K, 12 MPa; (d) nitrogen, 1000 K, 30 MPa; (e) carbon dioxide, 450 K, 10 MPa; (f) carbon dioxide, 1000 K, 30 MPa.

The behaviour of compressible flows at elevated pressure has qualitative differences that depend on whether the compressibility factor
 $Z$
is greater than or less than unity, or almost equivalently whether for a given pressure and temperature the density is less than or greater than the ideal-gas value. Figure 13 shows examples where
 $Z$
is considered for isentropic expansion from given stagnation conditions over a range of pressure that varies by two orders of magnitude. Here, the temperature value is related to pressure through an isentropic relation. One can consider the values of
 $A$
,
 $B$
and
 $Z$
here to represent values found during an isentropic expansion (right to left in figure 13) or compression (left to right). At higher stagnation temperatures,
 $Z>1$
is typical; repulsion (through parameter
 $B$
) tends to be stronger than attraction (through parameter
 $A$
) in determining the variation from an ideal-gas behaviour. For stagnation temperature closer to (but still above) the critical temperature,
 $Z<1$
often occurs; attraction becomes stronger than repulsion. So, in figure 13(b,d,f),
 $B>A,~Z>1$
and density is less than the ideal-gas value (except at the low-pressure end of the expansion (compression)). On the contrary for figure 13(a,e),
 $A>B,~Z<1$
and density exceeds the ideal-gas value. Figure 13(c) for lower temperature with nitrogen shows a transition between the aforementioned two regimes;
 $Z-1$
changes value during the expansion (compression). These density values have consequence for mass flux and momentum flux in choked flows.
In appendices B–D, it is shown that other thermodynamic variables are analytic functions of the parameters and can be expanded in powers of
 $A$
and
 $B$
; therefore, it can be expected that the linear approximations for those variables have the same error bounds as
 $Z-1$
.
Appendix B. Linearization of the enthalpy departure function
The specific enthalpy
 $h$
(or enthalpy per mole
 $\tilde{h}=Wh$
) varies from the ideal-gas specific enthalpy
 $h^{\ast }$
(or
 $\tilde{h}^{\ast }$
) at the same temperature. Although the present interest is not in two-phase problems, for the SRK case, the gas-phase enthalpy
 $h_{g}$
and the liquid-phase enthalpy
 $h_{l}$
each satisfy the following relation:
 $$\begin{eqnarray}h=\frac{\tilde{h}}{W}=h^{\ast }(T)+\frac{1}{W}\left[R_{u}T(Z-1)+\frac{T(\text{d}a/\text{d}T)-a}{b}\ln \frac{Z+B}{Z}\right].\end{eqnarray}$$
It can be shown from (2.8) that, for a single species,
 $$\begin{eqnarray}\displaystyle \left.\begin{array}{@{}c@{}}\displaystyle \tilde{a}\equiv 0.42748\frac{(R_{u}T_{c})^{2}}{p_{c}},\\ \displaystyle T\frac{\text{d}a}{\text{d}T}=\tilde{a}\left[S^{2}\frac{T}{T_{c}}-S(S+1)\sqrt{\frac{T}{T_{c}}}\,\right],\\ \displaystyle T^{2}\frac{\text{d}^{2}a}{\text{d}T^{2}}=\frac{\tilde{a}S(S+1)}{2}\sqrt{\frac{T}{T_{c}}},\end{array}\right\} & & \displaystyle\end{eqnarray}$$
 $$\begin{eqnarray}\displaystyle \left.\begin{array}{@{}c@{}}\displaystyle A=\frac{ap}{(R_{u}T)^{2}}=\frac{\tilde{a}p}{(R_{u}T)^{2}}\left[(S+1)^{2}-2S(1+S)\sqrt{\frac{T}{T_{c}}}+S^{2}\frac{T}{T_{c}}\right],\\ \displaystyle A^{\prime }\equiv \frac{p}{(R_{u}T)^{2}}T\frac{\text{d}a}{\text{d}T}=\frac{AT}{a}\frac{\text{d}a}{\text{d}T}=\frac{\tilde{a}p}{(R_{u}T)^{2}}\left[S^{2}\frac{T}{T_{c}}-S(S+1)\sqrt{\frac{T}{T_{c}}}\,\right],\\ \displaystyle A^{\prime \prime }\equiv \frac{p}{(R_{u}T)^{2}}T^{2}\frac{\text{d}^{2}a}{\text{d}T^{2}}=\frac{AT^{2}}{a}\frac{\text{d}^{2}a}{\text{d}T^{2}}=\frac{\tilde{a}p}{(R_{u}T)^{2}}\frac{S(S+1)}{2}\sqrt{\frac{T}{T_{c}}}.\end{array}\right\} & & \displaystyle\end{eqnarray}$$
Then, one obtains
 $$\begin{eqnarray}h=h^{\ast }(T)+\frac{R_{u}T}{W}\left[Z-1+\frac{A^{\prime }-A}{B}\ln \frac{Z+B}{Z}\right].\end{eqnarray}$$
For the non-ideal fluid, the volume is not exactly equal to the sum of weighted volumes of the components:
 $v\neq \sum _{j=1}^{{\tilde{N}}}X_{j}v_{j}$
. A similar character occurs for the enthalpy:
 $\tilde{h}\neq \sum _{j=1}^{{\tilde{N}}}X_{j}\tilde{h}_{j}$
.
The enthalpy departure function relation given by (B 4) can be linearized. The result for the enthalpy is
 $$\begin{eqnarray}\displaystyle h & = & \displaystyle h^{\ast }(T)+\frac{R_{u}T}{W}[B-2A+A^{\prime }]\nonumber\\ \displaystyle & = & \displaystyle c_{p}T+\frac{R_{u}\hat{T}}{W}\left\{\hat{B}-2\hat{A}\left[(S+1)^{2}\frac{\hat{T}}{T}-2S(1+S)\sqrt{\frac{\hat{T}}{T_{c}}}\sqrt{\frac{\hat{T}}{T}}+S^{2}\frac{\hat{T}}{T_{c}}\right]\right.\nonumber\\ \displaystyle & & \displaystyle +\left.\hat{A}\left[S^{2}\frac{\hat{T}}{T_{c}}-S(S+1)\sqrt{\frac{\hat{T}}{T_{c}}}\sqrt{\frac{\hat{T}}{T}}\,\right]\right\}\frac{p}{\hat{p}},\end{eqnarray}$$
where
 $\hat{A}$
and
 $\hat{B}$
are defined using stagnation pressure
 $\hat{p}$
and stagnation temperature
 $\hat{T}$
:
 $$\begin{eqnarray}\displaystyle \hat{A}\equiv \frac{\tilde{a}\hat{p}}{(R_{u}\hat{T})^{2}},\quad \hat{B}\equiv \frac{b\hat{p}}{R_{u}\hat{T}}. & & \displaystyle\end{eqnarray}$$
The non-dimensional form is
 $$\begin{eqnarray}\displaystyle \frac{h}{c_{p}\hat{T}} & = & \displaystyle \frac{T}{\hat{T}}+\frac{\unicode[STIX]{x1D6FE}-1}{\unicode[STIX]{x1D6FE}}\left\{\hat{B}-2\hat{A}\left[(S+1)^{2}\frac{\hat{T}}{T}-2S(1+S)\sqrt{\frac{\hat{T}}{T_{c}}}\sqrt{\frac{\hat{T}}{T}}+S^{2}\frac{\hat{T}}{T_{c}}\right]\right.\nonumber\\ \displaystyle & & \displaystyle +\left.\hat{A}\left[S^{2}\frac{\hat{T}}{T_{c}}-S(S+1)\sqrt{\frac{\hat{T}}{T_{c}}}\sqrt{\frac{\hat{T}}{T}}\,\right]\right\}\frac{p}{\hat{p}}.\end{eqnarray}$$
Equation (B 7) can be used to determine temperature. The stagnation enthalpy can be determined given stagnation values for pressure and temperature. It is given by
 $$\begin{eqnarray}\displaystyle \frac{{\hat{h}}}{c_{p}\hat{T}}=1+\frac{\unicode[STIX]{x1D6FE}-1}{\unicode[STIX]{x1D6FE}}\left[\hat{B}-2\hat{A}(S+1)^{2}+3\hat{A}S(1+S)\sqrt{\frac{\hat{T}}{T_{c}}}-\hat{A}S^{2}\frac{\hat{T}}{T_{c}}\right]. & & \displaystyle\end{eqnarray}$$
Equations (B 7) and (B 8) introduce a pressure dependence that does not exist for the ideal gas. Furthermore, these equations indicate that the real-gas enthalpy can exceed the ideal-gas value when
 $B$
becomes larger than
 $A$
, which occurs as temperature becomes larger. The real-gas enthalpy can fall below the ideal-gas value at more moderate temperatures.
In the next subsection, the wave dynamics for a compressible gas is considered with the purpose of identifying the sound speed, which is an important thermodynamic variable in compressible flow.
Appendix C. Sound speed
The three variables
 $p,~T$
and
 $\boldsymbol{u}$
can be viewed as governed by the continuity, energy and momentum equations. Then, coupling with (2.1) and (B 4) also determines
 $\unicode[STIX]{x1D70C}$
and
 $h$
. For the wave dynamics, it is assumed that composition is fixed. Thereby, in the EoS, the quantity
 $a$
depends only on temperature
 $T$
and
 $b$
is fixed. Viscous behaviour, body forces, heat conduction, mass diffusion and turbulent transport are neglected. The following definitions are made:
 $E$
is the rate of energy addition or conversion per unit mass; at constant composition, consider
 $p=p(\unicode[STIX]{x1D70C},s)$
,
 $c^{2}\equiv (\unicode[STIX]{x2202}p/\unicode[STIX]{x2202}\unicode[STIX]{x1D70C})|_{s}$
and
 $e\equiv (\unicode[STIX]{x2202}p/\unicode[STIX]{x2202}s)|_{\unicode[STIX]{x1D70C}}$
; and
 $\unicode[STIX]{x1D713}\equiv e/\unicode[STIX]{x1D70C}T$
and
 $\unicode[STIX]{x1D700}\equiv E-\unicode[STIX]{x1D70C}T\boldsymbol{u}\boldsymbol{\cdot }\unicode[STIX]{x1D735}s$
. Then, the nonlinear wave equation can be developed. Specifically, one has
 $$\begin{eqnarray}\displaystyle \frac{\unicode[STIX]{x2202}^{2}p}{\unicode[STIX]{x2202}t^{2}}-c^{2}\unicode[STIX]{x1D6FB}^{2}p=\frac{1}{c^{2}}\frac{\unicode[STIX]{x2202}c^{2}}{\unicode[STIX]{x2202}t}\frac{\unicode[STIX]{x2202}p}{\unicode[STIX]{x2202}t}+\unicode[STIX]{x1D713}\frac{\unicode[STIX]{x2202}\unicode[STIX]{x1D700}}{\unicode[STIX]{x2202}t}+\unicode[STIX]{x1D700}\frac{\unicode[STIX]{x2202}\unicode[STIX]{x1D713}}{\unicode[STIX]{x2202}t}-\frac{1}{c^{2}}\frac{\unicode[STIX]{x2202}c^{2}}{\unicode[STIX]{x2202}t}\unicode[STIX]{x1D700}\unicode[STIX]{x1D713}+c^{2}\unicode[STIX]{x1D735}\boldsymbol{\cdot }(\unicode[STIX]{x1D735}\boldsymbol{\cdot }(\unicode[STIX]{x1D70C}\boldsymbol{u}\boldsymbol{u})). & & \displaystyle\end{eqnarray}$$
It is seen from the form of the differential operator in (C 1) that the thermodynamic function
 $c$
is the speed of sound. This conclusion relied only on one thermodynamic condition: a thermodynamic variable is determined, at fixed composition, by the values of two other thermodynamic variables. There has been no assumption about EoS for density or enthalpy. The velocity
 $\boldsymbol{u}$
can be coupled to pressure
 $p$
through the Euler momentum equation to close the system for solution.
Now, the speed of sound can be evaluated for our specific EoS. The differential form of (2.1) is obtained as
 $$\begin{eqnarray}[3Z^{2}-2Z+A-B-B^{2}]\,\text{d}Z+[Z-B]\,\text{d}A-[Z+2BZ+A]\,\text{d}B=0.\end{eqnarray}$$
Changes in
 $A$
and
 $B$
are forced by changes in
 $T$
and
 $p$
for constant-composition situations. These in turn cause changes in
 $Z$
. It follows from the EoS that
 $$\begin{eqnarray}\displaystyle & \displaystyle \text{d}Z=Z\left[\frac{\text{d}p}{p}+\frac{\text{d}v}{v}-\frac{\text{d}T}{T}\right]=Z\left[\frac{\text{d}p}{p}-\frac{\text{d}\unicode[STIX]{x1D70C}}{\unicode[STIX]{x1D70C}}-\frac{\text{d}T}{T}\right], & \displaystyle\end{eqnarray}$$
 $$\begin{eqnarray}\displaystyle & \displaystyle \text{d}A=A\left[\frac{\text{d}p}{p}-2\frac{\text{d}T}{T}\right]+A^{\prime }\frac{\text{d}T}{T}, & \displaystyle\end{eqnarray}$$
 $$\begin{eqnarray}\displaystyle & \displaystyle \text{d}B=B\left[\frac{\text{d}p}{p}-\frac{\text{d}T}{T}\right], & \displaystyle\end{eqnarray}$$
where
 $A^{\prime }\equiv (T/a)(\text{d}a/\text{d}T)A$
.
Equations (C 2), (C 3), (C 4) and (C 5) may be combined to determine the differential of pressure
 $\text{d}p$
as a function of the temperature and density differentials,
 $\text{d}T$
and
 $\text{d}\unicode[STIX]{x1D70C}$
. Specifically,
 $$\begin{eqnarray}\displaystyle \frac{\text{d}p}{p}=f(A,B,Z)\frac{\text{d}\unicode[STIX]{x1D70C}}{\unicode[STIX]{x1D70C}}+g(B,Z)\frac{\text{d}T}{T}, & & \displaystyle\end{eqnarray}$$
where the definitions are made that
 $$\begin{eqnarray}\displaystyle & \displaystyle f(A,B,Z)\equiv \frac{2Z^{3}-Z^{2}+AB}{Z^{3}-B^{2}Z}, & \displaystyle\end{eqnarray}$$
 $$\begin{eqnarray}\displaystyle & \displaystyle g(B,Z)\equiv \frac{1}{Z-B}-\frac{A^{\prime }}{Z(Z+B)}. & \displaystyle\end{eqnarray}$$
From (B 1) the differential relation for enthalpy is derived. Another relation for
 $\text{d}h$
is given by the combined first and second laws. Matching these two differential forms yields
 $$\begin{eqnarray}\displaystyle \frac{\text{d}p}{\unicode[STIX]{x1D70C}}+T\,\text{d}s=\text{d}h & = & \displaystyle c_{p}\,\text{d}T+\frac{R_{u}T}{W}\left[(Z-1)\frac{\text{d}T}{T}+\text{d}Z-\frac{A-A^{\prime }}{B}\left(\frac{1}{Z+B}-\frac{1}{Z}\right)\,\text{d}Z\right.\nonumber\\ \displaystyle & & \displaystyle -\left.\frac{A-A^{\prime }}{B}\frac{1}{Z+B}\,\text{d}B+\left(\frac{A^{\prime \prime }}{B}\ln \frac{Z+B}{Z}\right)\frac{\text{d}T}{T}\right].\end{eqnarray}$$
Now, with use of the differential forms given by (C 3), (C 4) and (C 5) for substitution, one may construct the relation
 $$\begin{eqnarray}\displaystyle \frac{\text{d}T}{T}=\unicode[STIX]{x1D6FC}\frac{\text{d}p}{p}+\unicode[STIX]{x1D6FD}\frac{\text{d}\unicode[STIX]{x1D70C}}{\unicode[STIX]{x1D70C}}+\frac{1}{c_{v}+\unicode[STIX]{x1D705}}\,\text{d}s, & & \displaystyle\end{eqnarray}$$
where, after cancellations,
 $\unicode[STIX]{x1D6FC}=0$
and the following definitions are used:
 $$\begin{eqnarray}\displaystyle \left.\begin{array}{@{}c@{}}\displaystyle \unicode[STIX]{x1D6FD}\equiv \frac{1}{c_{v}+\unicode[STIX]{x1D705}}\left[\frac{R_{u}}{W}Z+\frac{\displaystyle a-T\frac{\text{d}a}{\text{d}T}}{bTW}\frac{B}{Z+B}\right]=\frac{(\unicode[STIX]{x1D6FE}-1)}{1+\unicode[STIX]{x1D705}/c_{v}}\left[Z+\frac{A-A^{\prime }}{Z+B}\right],\\ \displaystyle \unicode[STIX]{x1D705}\equiv c_{v}(\unicode[STIX]{x1D6FE}-1)\frac{A^{\prime \prime }}{B}\ln \left(\frac{Z+B}{Z}\right).\end{array}\right\} & & \displaystyle\end{eqnarray}$$
Now eliminate the temperature differential by substitution from (C 6) with (C 10):
 $$\begin{eqnarray}\displaystyle \frac{\text{d}p}{p}=(f+g\unicode[STIX]{x1D6FD})\frac{\text{d}\unicode[STIX]{x1D70C}}{\unicode[STIX]{x1D70C}}+\frac{1}{c_{v}+\unicode[STIX]{x1D705}}\,\text{d}s, & & \displaystyle\end{eqnarray}$$
thus giving
 $$\begin{eqnarray}\displaystyle c^{2}=\left.\frac{\unicode[STIX]{x2202}p}{\unicode[STIX]{x2202}\unicode[STIX]{x1D70C}}\right|_{s}=\frac{ZR_{u}T}{W}(f+g\unicode[STIX]{x1D6FD}). & & \displaystyle\end{eqnarray}$$
For an ideal gas,
 $Z=1,~A=B=A^{\prime }=A^{\prime \prime }=0,~f=g=1,~\unicode[STIX]{x1D6FD}=\unicode[STIX]{x1D6FE}-1$
and therefore the well-known result,
 $c^{2}=\unicode[STIX]{x1D6FE}R_{u}T/W$
, follows.
Next, the speed of sound can be evaluated and, when needed, the wave equation (C 1) can be solved. It may be solved together with the Euler form of the momentum equation to determine velocity
 $\boldsymbol{u}$
and pressure
 $p$
. Equation (B 4) governs enthalpy for known temperature or governs temperature for known enthalpy. The density may be determined from (2.1) given
 $p$
and
 $T$
. These thermodynamic relations are algebraically complicated; when solved with the flow equations, derivatives of these functions are also complicated. In certain regimes of practical relevance, simpler forms can give accurate approximations to these relations. In the following sections, useful, rational simplifying approximations are developed and applied to a few canonical compressible flows. The dependence of the thermodynamic variables on the parameters
 $A$
and
 $B$
is linearized. The nonlinearities in the flow, relating the dependent variables to each other, are fully maintained.
Now, the linearization can be applied to the speed-of-sound function. Within the accuracy of the linear theory, some convenient approximations can be used:
 $(1+\unicode[STIX]{x1D716}_{1})/(1+\unicode[STIX]{x1D716}_{2})\approx (1+\unicode[STIX]{x1D716}_{1})(1-\unicode[STIX]{x1D716}_{2})\approx 1+\unicode[STIX]{x1D716}_{1}-\unicode[STIX]{x1D716}_{2}$
, where
 $\unicode[STIX]{x1D716}_{1}$
and
 $\unicode[STIX]{x1D716}_{2}$
are perturbation quantities with magnitudes smaller than
 $O(1)$
. These standard expansions are used for linearization but the equals sign is used with the approximation understood. Equation (C 13) becomes
 $$\begin{eqnarray}\displaystyle \frac{\unicode[STIX]{x1D70C}c^{2}}{p}=\left.\frac{\unicode[STIX]{x2202}(\ln p)}{\unicode[STIX]{x2202}(\ln \unicode[STIX]{x1D70C})}\right|_{s}=\unicode[STIX]{x1D6FE}+\unicode[STIX]{x1D6FE}B+(\unicode[STIX]{x1D6FE}-2)A-2(\unicode[STIX]{x1D6FE}-1)A^{\prime }-(\unicode[STIX]{x1D6FE}-1)^{2}A^{\prime \prime }. & & \displaystyle\end{eqnarray}$$
Substitutions for
 $A$
and
 $B$
in terms of pressure and temperature can be made. Also, an isentropic process is considered so that the derivative in (C 14) becomes the full derivative through the flow field:
 $$\begin{eqnarray}\displaystyle \frac{\unicode[STIX]{x1D70C}c^{2}}{p}=\frac{\text{d}(\ln p)}{\text{d}(\ln \unicode[STIX]{x1D70C})} & = & \displaystyle \unicode[STIX]{x1D6FE}+\unicode[STIX]{x1D6FE}\frac{bp}{R_{u}T}\nonumber\\ \displaystyle & & \displaystyle +\,(\unicode[STIX]{x1D6FE}-2)\frac{\tilde{a}p}{(R_{u}T)^{2}}\left[(S+1)^{2}-2S(1+S)\sqrt{\frac{T}{T_{c}}}+S^{2}\frac{T}{T_{c}}\right]\nonumber\\ \displaystyle & & \displaystyle -\,2(\unicode[STIX]{x1D6FE}-1)\frac{\tilde{a}p}{(R_{u}T)^{2}}\left[S^{2}\frac{T}{T_{c}}-S(S+1)\sqrt{\frac{T}{T_{c}}}\,\right]\nonumber\\ \displaystyle & & \displaystyle -\,(\unicode[STIX]{x1D6FE}-1)^{2}\frac{\tilde{a}p}{(R_{u}T)^{2}}\frac{S(S+1)}{2}\sqrt{\frac{T}{T_{c}}}.\end{eqnarray}$$
Thus, the linearized form follows:
 $$\begin{eqnarray}\displaystyle c^{2}=\frac{\unicode[STIX]{x1D6FE}p}{\unicode[STIX]{x1D70C}}[1+\unicode[STIX]{x1D70E}], & & \displaystyle\end{eqnarray}$$
where the definition is made that
 $$\begin{eqnarray}\displaystyle \unicode[STIX]{x1D70E} & \equiv & \displaystyle B+\frac{(\unicode[STIX]{x1D6FE}-2)}{\unicode[STIX]{x1D6FE}}A-\frac{2(\unicode[STIX]{x1D6FE}-1)}{\unicode[STIX]{x1D6FE}}A^{\prime }-\frac{(\unicode[STIX]{x1D6FE}-1)^{2}}{\unicode[STIX]{x1D6FE}}A^{\prime \prime }\nonumber\\ \displaystyle & = & \displaystyle \frac{bp}{R_{u}T}+\frac{(\unicode[STIX]{x1D6FE}-2)}{\unicode[STIX]{x1D6FE}}\frac{\tilde{a}p}{(R_{u}T)^{2}}\left[(S+1)^{2}-2S(1+S)\sqrt{\frac{T}{T_{c}}}+S^{2}\frac{T}{T_{c}}\right]\nonumber\\ \displaystyle & & \displaystyle -\,\frac{2(\unicode[STIX]{x1D6FE}-1)}{\unicode[STIX]{x1D6FE}}\frac{\tilde{a}p}{(R_{u}T)^{2}}\left[S^{2}\frac{T}{T_{c}}-S(S+1)\sqrt{\frac{T}{T_{c}}}\,\right]\nonumber\\ \displaystyle & & \displaystyle -\,\frac{(\unicode[STIX]{x1D6FE}-1)^{2}}{\unicode[STIX]{x1D6FE}}\frac{\tilde{a}p}{(R_{u}T)^{2}}\frac{S(S+1)}{2}\sqrt{\frac{T}{T_{c}}}.\end{eqnarray}$$
Appendix D. Relations for isentropic and isoenergetic flows
D.1 Density as a function of pressure
Using a linear perturbation with (C 15), it can be approximated that
 $$\begin{eqnarray}\displaystyle \frac{\text{d}(\ln \unicode[STIX]{x1D70C})}{\text{d}(\ln p)} & = & \displaystyle \frac{1}{\unicode[STIX]{x1D6FE}}\left\{1-\frac{bp}{R_{u}T}-\frac{\unicode[STIX]{x1D6FE}-2}{\unicode[STIX]{x1D6FE}}\frac{\tilde{a}p}{(R_{u}T)^{2}}\left[(S+1)^{2}-2S(1+S)\sqrt{\frac{T}{T_{c}}}+S^{2}\frac{T}{T_{c}}\right]\right.\nonumber\\ \displaystyle & & \displaystyle +\,\frac{2(\unicode[STIX]{x1D6FE}-1)}{\unicode[STIX]{x1D6FE}}\frac{\tilde{a}p}{(R_{u}T)^{2}}\left[S^{2}\frac{T}{T_{c}}-S(S+1)\sqrt{\frac{T}{T_{c}}}\,\right]\nonumber\\ \displaystyle & & \displaystyle \left.+\,\frac{(\unicode[STIX]{x1D6FE}-1)^{2}}{\unicode[STIX]{x1D6FE}}\frac{\tilde{a}p}{(R_{u}T)^{2}}\frac{S(S+1)}{2}\sqrt{\frac{T}{T_{c}}}\vphantom{\sqrt{\frac{T}{T_{c}}}}\right\}.\end{eqnarray}$$
The first term on the right (i.e.
 $1/\unicode[STIX]{x1D6FE}$
) gives the zeroth-order term, while the other terms on the right-hand side provide the first-order correction. Thus, the lowest-order (i.e. zeroth-order) approximation has
 $Z=1$
and
 $\text{d}(\ln \unicode[STIX]{x1D70C})/\text{d}(\ln p)=1/\unicode[STIX]{x1D6FE}$
. It follows that, to zeroth order,
 $\unicode[STIX]{x1D70C}/\hat{\unicode[STIX]{x1D70C}}=(p/\hat{p})^{1/\unicode[STIX]{x1D6FE}}$
and
 $T/\hat{T}=(p/\hat{p})^{(\unicode[STIX]{x1D6FE}-1)/\unicode[STIX]{x1D6FE}}$
, where
 $\hat{p},~\hat{\unicode[STIX]{x1D70C}}$
and
 $\hat{T}$
are stagnation quantities. The zeroth-order approximation may be substituted in the first-order term with the difference being of second order, which has already been declared negligible. Thereby, one obtains
 $$\begin{eqnarray}\displaystyle \frac{\text{d}(\ln \unicode[STIX]{x1D70C})}{\text{d}(\ln p)} & = & \displaystyle \frac{1}{\unicode[STIX]{x1D6FE}}\left\{\vphantom{\sqrt{\frac{\hat{T}}{T_{c}}}}1-\frac{b\hat{p}}{R_{u}\hat{T}}\left(\frac{p}{\hat{p}}\right)^{1/\unicode[STIX]{x1D6FE}}+\frac{2(\unicode[STIX]{x1D6FE}-1)}{\unicode[STIX]{x1D6FE}}\frac{\tilde{a}\hat{p}}{(R_{u}\hat{T})^{2}}\left[S^{2}\frac{\hat{T}}{T_{c}}\left(\frac{p}{\hat{p}}\right)^{1/\unicode[STIX]{x1D6FE}}\right.\right.\nonumber\\ \displaystyle & & \displaystyle -\left.S(S+1)\sqrt{\frac{\hat{T}}{T_{c}}}\left(\frac{p}{\hat{p}}\right)^{(3-\unicode[STIX]{x1D6FE})/2\unicode[STIX]{x1D6FE}}\right]-\frac{\unicode[STIX]{x1D6FE}-2}{\unicode[STIX]{x1D6FE}}\frac{\tilde{a}\hat{p}}{(R_{u}\hat{T})^{2}}\left[(S+1)^{2}\left(\frac{p}{\hat{p}}\right)^{(2-\unicode[STIX]{x1D6FE})/\unicode[STIX]{x1D6FE}}\right.\nonumber\\ \displaystyle & & \displaystyle -\left.2S(1+S)\sqrt{\frac{\hat{T}}{T_{c}}}\left(\frac{p}{\hat{p}}\right)^{(3-\unicode[STIX]{x1D6FE})/2\unicode[STIX]{x1D6FE}}+S^{2}\frac{\hat{T}}{T_{c}}\left(\frac{p}{\hat{p}}\right)^{1/\unicode[STIX]{x1D6FE}}\right]\nonumber\\ \displaystyle & & \displaystyle \left.+\,\frac{(\unicode[STIX]{x1D6FE}-1)^{2}}{\unicode[STIX]{x1D6FE}}\frac{\tilde{a}\hat{p}}{(R_{u}\hat{T})^{2}}\frac{S(S+1)}{2}\sqrt{\frac{\hat{T}}{T_{c}}}\left(\frac{p}{\hat{p}}\right)^{(3-\unicode[STIX]{x1D6FE})/2\unicode[STIX]{x1D6FE}}\right\}.\end{eqnarray}$$
Separation of variables and integration yields
 $$\begin{eqnarray}\displaystyle \frac{\unicode[STIX]{x1D70C}}{\hat{\unicode[STIX]{x1D70C}}} & = & \displaystyle C\left(\frac{p}{\hat{p}}\right)^{1/\unicode[STIX]{x1D6FE}}\exp \left[-\unicode[STIX]{x1D706}_{b}\left(\frac{p}{\hat{p}}\right)^{1/\unicode[STIX]{x1D6FE}}+\unicode[STIX]{x1D706}_{1}\left(\frac{p}{\hat{p}}\right)^{1/\unicode[STIX]{x1D6FE}}\right.\nonumber\\ \displaystyle & & \displaystyle -\left.\unicode[STIX]{x1D706}_{2}\left(\frac{p}{\hat{p}}\right)^{(2-\unicode[STIX]{x1D6FE})/\unicode[STIX]{x1D6FE}}+\unicode[STIX]{x1D706}_{3}\left(\frac{p}{\hat{p}}\right)^{(3-\unicode[STIX]{x1D6FE})/2\unicode[STIX]{x1D6FE}}\right],\end{eqnarray}$$
where
 $C$
is the constant of integration and
 $$\begin{eqnarray}\displaystyle \left.\begin{array}{@{}c@{}}\displaystyle \unicode[STIX]{x1D706}_{b}\equiv \hat{B},\quad \unicode[STIX]{x1D706}_{1}\equiv S^{2}\hat{A}\frac{\hat{T}}{T_{c}},\\ \displaystyle \unicode[STIX]{x1D706}_{2}\equiv -\frac{1}{\unicode[STIX]{x1D6FE}}(S+1)^{2}\hat{A},\quad \unicode[STIX]{x1D706}_{3}\equiv \frac{\unicode[STIX]{x1D6FE}+1}{\unicode[STIX]{x1D6FE}}S(S+1)\hat{A}\sqrt{\frac{\hat{T}}{T_{c}}},\end{array}\right\} & & \displaystyle\end{eqnarray}$$
 $$\begin{eqnarray}\hat{A}\equiv \frac{\tilde{a}\hat{p}}{(R_{u}\hat{T})^{2}},\quad \hat{B}\equiv \frac{b\hat{p}}{R_{u}\hat{T}}.\end{eqnarray}$$
Now, the exponential term is expanded to the needed order to obtain
 $$\begin{eqnarray}\displaystyle \frac{\unicode[STIX]{x1D70C}}{\hat{\unicode[STIX]{x1D70C}}} & = & \displaystyle C\left(\frac{p}{\hat{p}}\right)^{1/\unicode[STIX]{x1D6FE}}\left[1-\unicode[STIX]{x1D706}_{b}\left(\frac{p}{\hat{p}}\right)^{1/\unicode[STIX]{x1D6FE}}+\unicode[STIX]{x1D706}_{1}\left(\frac{p}{\hat{p}}\right)^{1/\unicode[STIX]{x1D6FE}}\right.\nonumber\\ \displaystyle & & \displaystyle -\left.\unicode[STIX]{x1D706}_{2}\left(\frac{p}{\hat{p}}\right)^{(2-\unicode[STIX]{x1D6FE})/\unicode[STIX]{x1D6FE}}+\unicode[STIX]{x1D706}_{3}\left(\frac{p}{\hat{p}}\right)^{(3-\unicode[STIX]{x1D6FE})/2\unicode[STIX]{x1D6FE}}\right].\end{eqnarray}$$
Here
 $C$
is determined by setting
 $\unicode[STIX]{x1D70C}=\hat{\unicode[STIX]{x1D70C}}$
when
 $p=\hat{p}$
. Upon expansion to a linear form,
 $C=1+\unicode[STIX]{x1D706}_{b}-\unicode[STIX]{x1D706}_{1}+\unicode[STIX]{x1D706}_{2}-\unicode[STIX]{x1D706}_{3}$
. Substitution for
 $C$
into (D 6) followed by multiplication yields
 $$\begin{eqnarray}\displaystyle \frac{\unicode[STIX]{x1D70C}}{\hat{\unicode[STIX]{x1D70C}}} & = & \displaystyle \left(\frac{p}{\hat{p}}\right)^{1/\unicode[STIX]{x1D6FE}}+(\unicode[STIX]{x1D706}_{1}-\unicode[STIX]{x1D706}_{b})\left[\left(\frac{p}{\hat{p}}\right)^{2/\unicode[STIX]{x1D6FE}}-\left(\frac{p}{\hat{p}}\right)^{1/\unicode[STIX]{x1D6FE}}\right]\nonumber\\ \displaystyle & & \displaystyle -\,\unicode[STIX]{x1D706}_{2}\left[\left(\frac{p}{\hat{p}}\right)^{(3-\unicode[STIX]{x1D6FE})/\unicode[STIX]{x1D6FE}}-\left(\frac{p}{\hat{p}}\right)^{1/\unicode[STIX]{x1D6FE}}\right]+\unicode[STIX]{x1D706}_{3}\left[\left(\frac{p}{\hat{p}}\right)^{(5-\unicode[STIX]{x1D6FE})/2\unicode[STIX]{x1D6FE}}-\left(\frac{p}{\hat{p}}\right)^{1/\unicode[STIX]{x1D6FE}}\right]\nonumber\\ \displaystyle & = & \displaystyle \left(\frac{p}{\hat{p}}\right)^{1/\unicode[STIX]{x1D6FE}}\left[1+\unicode[STIX]{x1D6EC}_{1}\left(\frac{p}{\hat{p}}\right)\right],\end{eqnarray}$$
where
 $\unicode[STIX]{x1D6EC}_{1}(p/\hat{p})$
is defined as
 $$\begin{eqnarray}\displaystyle \unicode[STIX]{x1D6EC}_{1}\equiv (\unicode[STIX]{x1D706}_{1}-\unicode[STIX]{x1D706}_{b})\left[\left(\frac{p}{\hat{p}}\right)^{1/\unicode[STIX]{x1D6FE}}-1\right]-\unicode[STIX]{x1D706}_{2}\left[\left(\frac{p}{\hat{p}}\right)^{(2-\unicode[STIX]{x1D6FE})/\unicode[STIX]{x1D6FE}}-1\right]+\unicode[STIX]{x1D706}_{3}\left[\left(\frac{p}{\hat{p}}\right)^{(3-\unicode[STIX]{x1D6FE})/2\unicode[STIX]{x1D6FE}}-1\right].\quad & & \displaystyle\end{eqnarray}$$
Here
 $\unicode[STIX]{x1D6EC}_{1}$
is the fractional variation of the real-gas isentropic relation between density and pressure from the ideal-gas isentropic relation between those same variables. In the case where the stagnation pressure and temperature are given and fixed in the comparison, a factor
 $\hat{Z}$
is still needed to account for the difference in stagnation density.
D.2 Enthalpy as a function of pressure
The enthalpy can be obtained by a simple integration for an isentropic process:
 $h=\int \text{d}h=\int (1/\unicode[STIX]{x1D70C})\,\text{d}p$
. First, a relation is obtained for the reciprocal of density as a function of pressure:
 $$\begin{eqnarray}\displaystyle \frac{\hat{\unicode[STIX]{x1D70C}}}{\unicode[STIX]{x1D70C}} & = & \displaystyle \left(\frac{p}{\hat{p}}\right)^{-1/\unicode[STIX]{x1D6FE}}+(\unicode[STIX]{x1D706}_{b}-\unicode[STIX]{x1D706}_{1})\left[1-\left(\frac{p}{\hat{p}}\right)^{-1/\unicode[STIX]{x1D6FE}}\right]\nonumber\\ \displaystyle & & \displaystyle +\,\unicode[STIX]{x1D706}_{2}\left[\left(\frac{p}{\hat{p}}\right)^{(1-\unicode[STIX]{x1D6FE})/\unicode[STIX]{x1D6FE}}-\left(\frac{p}{\hat{p}}\right)^{-1/\unicode[STIX]{x1D6FE}}\right]-\unicode[STIX]{x1D706}_{3}\left[\left(\frac{p}{\hat{p}}\right)^{(1-\unicode[STIX]{x1D6FE})/2\unicode[STIX]{x1D6FE}}-\left(\frac{p}{\hat{p}}\right)^{-1/\unicode[STIX]{x1D6FE}}\right]\nonumber\\ \displaystyle & = & \displaystyle \left(\frac{p}{\hat{p}}\right)^{-1/\unicode[STIX]{x1D6FE}}\left[1-\unicode[STIX]{x1D6EC}_{1}\left(\frac{p}{\hat{p}}\right)\right].\end{eqnarray}$$
Now, integration with use of stagnation values to set the constant yields
 $$\begin{eqnarray}\displaystyle {\hat{h}}-h=\frac{u^{2}}{2}=\frac{\unicode[STIX]{x1D6FE}}{\unicode[STIX]{x1D6FE}-1}\left(\frac{\hat{p}}{\hat{\unicode[STIX]{x1D70C}}}\right)\left[1-\left(\frac{p}{\hat{p}}\right)^{(\unicode[STIX]{x1D6FE}-1)/\unicode[STIX]{x1D6FE}}+\unicode[STIX]{x1D6EC}_{2}\left(\frac{p}{\hat{p}}\right)\right], & & \displaystyle\end{eqnarray}$$
where the function
 $\unicode[STIX]{x1D6EC}_{2}(p/\hat{p})$
is defined as follows to encapsulate first-order terms:
 $$\begin{eqnarray}\displaystyle \unicode[STIX]{x1D6EC}_{2} & \equiv & \displaystyle (\unicode[STIX]{x1D706}_{1}-\unicode[STIX]{x1D706}_{b})\left[\frac{\unicode[STIX]{x1D6FE}-1}{\unicode[STIX]{x1D6FE}}\frac{p}{\hat{p}}-\left(\frac{p}{\hat{p}}\right)^{(\unicode[STIX]{x1D6FE}-1)/\unicode[STIX]{x1D6FE}}+\frac{1}{\unicode[STIX]{x1D6FE}}\right]\nonumber\\ \displaystyle & & \displaystyle -\,\unicode[STIX]{x1D706}_{2}\left[(\unicode[STIX]{x1D6FE}-1)\left(\frac{p}{\hat{p}}\right)^{1/\unicode[STIX]{x1D6FE}}-\left(\frac{p}{\hat{p}}\right)^{(\unicode[STIX]{x1D6FE}-1)/\unicode[STIX]{x1D6FE}}+2-\unicode[STIX]{x1D6FE}\right]\nonumber\\ \displaystyle & & \displaystyle +\,\unicode[STIX]{x1D706}_{3}\left[\frac{2(\unicode[STIX]{x1D6FE}-1)}{\unicode[STIX]{x1D6FE}+1}\left(\frac{p}{\hat{p}}\right)^{(\unicode[STIX]{x1D6FE}+1)/2\unicode[STIX]{x1D6FE}}-\left(\frac{p}{\hat{p}}\right)^{(\unicode[STIX]{x1D6FE}-1)/\unicode[STIX]{x1D6FE}}+\frac{3-\unicode[STIX]{x1D6FE}}{\unicode[STIX]{x1D6FE}+1}\right].\end{eqnarray}$$
Here
 $\unicode[STIX]{x1D6EC}_{2}$
is the fractional variation of the real-gas isentropic relation between kinetic energy per unit mass (
 $u^{2}/2$
) and pressure from the ideal-gas isentropic relation between those same variables.
Equation (B 8) for stagnation enthalpy
 ${\hat{h}}$
can be used to substitute into (D 10) to determine enthalpy
 $h$
. The left-hand side of (B 8) is the ratio of real-gas stagnation enthalpy to ideal-gas stagnation enthalpy. Thus, an increase in
 $A$
gives a relative increase to the ideal-gas value, while an increase in
 $B$
gives a relative increase to the real-gas value. In an ideal gas, the only energy is the kinetic (translational and rotational) energy of molecules, while the real gas also has an energy associated with intermolecular forces.
D.3 Temperature as a function of pressure
The combination of (D 10) yielding the enthalpy and (B 7) yielding the linearized enthalpy departure function allows the determination of temperature as a function of pressure. Specifically, one has
 $$\begin{eqnarray}\displaystyle \frac{T}{\hat{T}} & = & \displaystyle 1+\frac{\unicode[STIX]{x1D6FE}-1}{\unicode[STIX]{x1D6FE}}\left[\hat{B}\left(1-\frac{p}{\hat{p}}\right)+2\hat{A}(S+1)^{2}\left(\left(\frac{p}{\hat{p}}\right)^{1/\unicode[STIX]{x1D6FE}}-1\right)\right.\nonumber\\ \displaystyle & & \displaystyle +\left.3\hat{A}S(1+S)\sqrt{\frac{\hat{T}}{T_{c}}}\left(1-\left(\frac{p}{\hat{p}}\right)^{(\unicode[STIX]{x1D6FE}+1)/2\unicode[STIX]{x1D6FE}}\right)+\hat{A}S^{2}\frac{\hat{T}}{T_{c}}\left(\frac{p}{\hat{p}}-1\right)\right]\nonumber\\ \displaystyle & & \displaystyle -\,\hat{Z}\left\{1-\left(\frac{p}{\hat{p}}\right)^{(\unicode[STIX]{x1D6FE}-1)/\unicode[STIX]{x1D6FE}}+(\unicode[STIX]{x1D706}_{1}-\unicode[STIX]{x1D706}_{b})\left[\frac{\unicode[STIX]{x1D6FE}-1}{\unicode[STIX]{x1D6FE}}\frac{p}{\hat{p}}-\left(\frac{p}{\hat{p}}\right)^{(\unicode[STIX]{x1D6FE}-1)/\unicode[STIX]{x1D6FE}}+\frac{1}{\unicode[STIX]{x1D6FE}}\right]\right.\nonumber\\ \displaystyle & & \displaystyle -\,\unicode[STIX]{x1D706}_{2}\left[(\unicode[STIX]{x1D6FE}-1)\left(\frac{p}{\hat{p}}\right)^{1/\unicode[STIX]{x1D6FE}}-\left(\frac{p}{\hat{p}}\right)^{(\unicode[STIX]{x1D6FE}-1)/\unicode[STIX]{x1D6FE}}+2-\unicode[STIX]{x1D6FE}\right]\nonumber\\ \displaystyle & & \displaystyle +\left.\unicode[STIX]{x1D706}_{3}\left[\frac{2(\unicode[STIX]{x1D6FE}-1)}{\unicode[STIX]{x1D6FE}+1}\left(\frac{p}{\hat{p}}\right)^{(\unicode[STIX]{x1D6FE}+1)/2\unicode[STIX]{x1D6FE}}-\left(\frac{p}{\hat{p}}\right)^{(\unicode[STIX]{x1D6FE}-1)/\unicode[STIX]{x1D6FE}}+\frac{3-\unicode[STIX]{x1D6FE}}{\unicode[STIX]{x1D6FE}+1}\right]\right\}\nonumber\\ \displaystyle & = & \displaystyle 1+\frac{\unicode[STIX]{x1D6FE}-1}{\unicode[STIX]{x1D6FE}}\left[\hat{B}\left(1-\frac{p}{\hat{p}}\right)+2\hat{A}(S+1)^{2}\left(\left(\frac{p}{\hat{p}}\right)^{1/\unicode[STIX]{x1D6FE}}-1\right)\right.\nonumber\\ \displaystyle & & \displaystyle +\,3\hat{A}S(1+S)\sqrt{\frac{\hat{T}}{T_{c}}}\left(1-\left(\frac{p}{\hat{p}}\right)^{(\unicode[STIX]{x1D6FE}+1)/2\unicode[STIX]{x1D6FE}}\right)\nonumber\\ \displaystyle & & \displaystyle +\left.\hat{A}S^{2}\frac{\hat{T}}{T_{c}}\left(\frac{p}{\hat{p}}-1\right)\right]-\hat{Z}\left[1-\left(\frac{p}{\hat{p}}\right)^{(\unicode[STIX]{x1D6FE}-1)/\unicode[STIX]{x1D6FE}}+\unicode[STIX]{x1D6EC}_{2}\left(\frac{p}{\hat{p}}\right)\right].\end{eqnarray}$$
D.4 Velocity as a function of pressure
For isoenergetic flow,
 ${\hat{h}}-h=u^{2}/2$
, where
 $u$
is the velocity. From (D 10), it follows that
 $$\begin{eqnarray}\displaystyle \frac{u^{2}}{2c_{p}\hat{T}}=\frac{{\hat{h}}-h}{c_{p}\hat{T}} & = & \displaystyle \hat{Z}\left\{1-\left(\frac{p}{\hat{p}}\right)^{(\unicode[STIX]{x1D6FE}-1)/\unicode[STIX]{x1D6FE}}+(\unicode[STIX]{x1D706}_{1}-\unicode[STIX]{x1D706}_{b})\left[\frac{\unicode[STIX]{x1D6FE}-1}{\unicode[STIX]{x1D6FE}}\frac{p}{\hat{p}}-\left(\frac{p}{\hat{p}}\right)^{(\unicode[STIX]{x1D6FE}-1)/\unicode[STIX]{x1D6FE}}+\frac{1}{\unicode[STIX]{x1D6FE}}\right]\right.\nonumber\\ \displaystyle & & \displaystyle -\,\unicode[STIX]{x1D706}_{2}\left[(\unicode[STIX]{x1D6FE}-1)\left(\frac{p}{\hat{p}}\right)^{1/\unicode[STIX]{x1D6FE}}-\left(\frac{p}{\hat{p}}\right)^{(\unicode[STIX]{x1D6FE}-1)/\unicode[STIX]{x1D6FE}}+2-\unicode[STIX]{x1D6FE}\right]\nonumber\\ \displaystyle & & \displaystyle +\left.\unicode[STIX]{x1D706}_{3}\left[\frac{2(\unicode[STIX]{x1D6FE}-1)}{\unicode[STIX]{x1D6FE}+1}\left(\frac{p}{\hat{p}}\right)^{(\unicode[STIX]{x1D6FE}+1)/2\unicode[STIX]{x1D6FE}}-\left(\frac{p}{\hat{p}}\right)^{(\unicode[STIX]{x1D6FE}-1)/\unicode[STIX]{x1D6FE}}+\frac{3-\unicode[STIX]{x1D6FE}}{\unicode[STIX]{x1D6FE}+1}\right]\right\}\nonumber\\ \displaystyle & = & \displaystyle \hat{Z}\left[1-\left(\frac{p}{\hat{p}}\right)^{(\unicode[STIX]{x1D6FE}-1)/\unicode[STIX]{x1D6FE}}+\unicode[STIX]{x1D6EC}_{2}\left(\frac{p}{\hat{p}}\right)\right],\end{eqnarray}$$
and thereby
 $$\begin{eqnarray}\displaystyle \frac{u}{(2c_{p}\hat{T})^{1/2}} & = & \displaystyle \hat{Z}^{1/2}\left\{1-\left(\frac{p}{\hat{p}}\right)^{(\unicode[STIX]{x1D6FE}-1)/\unicode[STIX]{x1D6FE}}+(\unicode[STIX]{x1D706}_{1}-\unicode[STIX]{x1D706}_{b})\left[\frac{\unicode[STIX]{x1D6FE}-1}{\unicode[STIX]{x1D6FE}}\frac{p}{\hat{p}}-\left(\frac{p}{\hat{p}}\right)^{(\unicode[STIX]{x1D6FE}-1)/\unicode[STIX]{x1D6FE}}+\frac{1}{\unicode[STIX]{x1D6FE}}\right]\right.\nonumber\\ \displaystyle & & \displaystyle -\,\unicode[STIX]{x1D706}_{2}\left[(\unicode[STIX]{x1D6FE}-1)\left(\frac{p}{\hat{p}}\right)^{1/\unicode[STIX]{x1D6FE}}-\left(\frac{p}{\hat{p}}\right)^{(\unicode[STIX]{x1D6FE}-1)/\unicode[STIX]{x1D6FE}}+2-\unicode[STIX]{x1D6FE}\right]\nonumber\\ \displaystyle & & \displaystyle +\left.\unicode[STIX]{x1D706}_{3}\left[\frac{2(\unicode[STIX]{x1D6FE}-1)}{\unicode[STIX]{x1D6FE}+1}\left(\frac{p}{\hat{p}}\right)^{(\unicode[STIX]{x1D6FE}+1)/2\unicode[STIX]{x1D6FE}}-\left(\frac{p}{\hat{p}}\right)^{(\unicode[STIX]{x1D6FE}-1)/\unicode[STIX]{x1D6FE}}+\frac{3-\unicode[STIX]{x1D6FE}}{\unicode[STIX]{x1D6FE}+1}\right]\right\}^{1/2}\nonumber\\ \displaystyle & = & \displaystyle \hat{Z}^{1/2}\left[1-\left(\frac{p}{\hat{p}}\right)^{(\unicode[STIX]{x1D6FE}-1)/\unicode[STIX]{x1D6FE}}+\unicode[STIX]{x1D6EC}_{2}\left(\frac{p}{\hat{p}}\right)\right]^{1/2}.\end{eqnarray}$$
D.5 Sound speed as a function of pressure
From (C 16), one obtains
 $$\begin{eqnarray}\displaystyle c^{2} & = & \displaystyle \frac{\unicode[STIX]{x1D6FE}p}{\unicode[STIX]{x1D70C}}[1+\unicode[STIX]{x1D70E}]\nonumber\\ \displaystyle & = & \displaystyle \frac{\unicode[STIX]{x1D6FE}p}{\unicode[STIX]{x1D70C}}\left[1+B+\frac{\unicode[STIX]{x1D6FE}-2}{\unicode[STIX]{x1D6FE}}A-\frac{2(\unicode[STIX]{x1D6FE}-1)}{\unicode[STIX]{x1D6FE}}A^{\prime }-\frac{(\unicode[STIX]{x1D6FE}-1)^{2}}{\unicode[STIX]{x1D6FE}}A^{\prime \prime }\right]\nonumber\\ \displaystyle & = & \displaystyle \frac{\unicode[STIX]{x1D6FE}p}{\unicode[STIX]{x1D70C}}\left[1+(\unicode[STIX]{x1D706}_{b}-\unicode[STIX]{x1D706}_{1})\left(\frac{p}{\hat{p}}\right)^{1/\unicode[STIX]{x1D6FE}}+\frac{\unicode[STIX]{x1D706}_{2}(2-\unicode[STIX]{x1D6FE})}{\unicode[STIX]{x1D6FE}}\left(\frac{p}{\hat{p}}\right)^{(2-\unicode[STIX]{x1D6FE})/\unicode[STIX]{x1D6FE}}-\frac{(3-\unicode[STIX]{x1D6FE})\unicode[STIX]{x1D706}_{3}}{2}\left(\frac{p}{\hat{p}}\right)^{(3-\unicode[STIX]{x1D6FE})/2\unicode[STIX]{x1D6FE}}\right]\nonumber\\ \displaystyle & = & \displaystyle \frac{\unicode[STIX]{x1D6FE}\hat{p}}{\hat{\unicode[STIX]{x1D70C}}}\left(\frac{p}{\hat{p}}\right)^{(\unicode[STIX]{x1D6FE}-1)/\unicode[STIX]{x1D6FE}}\left[1-\unicode[STIX]{x1D706}_{b}+\unicode[STIX]{x1D706}_{1}-\unicode[STIX]{x1D706}_{2}+\unicode[STIX]{x1D706}_{3}+2(\unicode[STIX]{x1D706}_{b}-\unicode[STIX]{x1D706}_{1})\left(\frac{p}{\hat{p}}\right)^{1/\unicode[STIX]{x1D6FE}}\right.\nonumber\\ \displaystyle & & \displaystyle +\left.\frac{2\unicode[STIX]{x1D706}_{2}}{\unicode[STIX]{x1D6FE}}\left(\frac{p}{\hat{p}}\right)^{(2-\unicode[STIX]{x1D6FE})/\unicode[STIX]{x1D6FE}}-\frac{(5-\unicode[STIX]{x1D6FE})\unicode[STIX]{x1D706}_{3}}{2}\left(\frac{p}{\hat{p}}\right)^{(3-\unicode[STIX]{x1D6FE})/2\unicode[STIX]{x1D6FE}}\right]\nonumber\\ \displaystyle & = & \displaystyle \frac{\unicode[STIX]{x1D6FE}\hat{p}}{\hat{\unicode[STIX]{x1D70C}}}\left(\frac{p}{\hat{p}}\right)^{(\unicode[STIX]{x1D6FE}-1)/\unicode[STIX]{x1D6FE}}\left[1+\unicode[STIX]{x1D6EC}_{3}\left(\frac{p}{\hat{p}}\right)\right],\end{eqnarray}$$
where the function
 $\unicode[STIX]{x1D6EC}_{3}(p/\hat{p})$
is defined as follows to encapsulate the first-order terms:
 $$\begin{eqnarray}\displaystyle \unicode[STIX]{x1D6EC}_{3} & \equiv & \displaystyle -\unicode[STIX]{x1D706}_{b}+\unicode[STIX]{x1D706}_{1}-\unicode[STIX]{x1D706}_{2}+\unicode[STIX]{x1D706}_{3}+2(\unicode[STIX]{x1D706}_{b}-\unicode[STIX]{x1D706}_{1})\left(\frac{p}{\hat{p}}\right)^{1/\unicode[STIX]{x1D6FE}}\nonumber\\ \displaystyle & & \displaystyle +\,\frac{2\unicode[STIX]{x1D706}_{2}}{\unicode[STIX]{x1D6FE}}\left(\frac{p}{\hat{p}}\right)^{(2-\unicode[STIX]{x1D6FE})/\unicode[STIX]{x1D6FE}}-\frac{(5-\unicode[STIX]{x1D6FE})\unicode[STIX]{x1D706}_{3}}{2}\left(\frac{p}{\hat{p}}\right)^{(3-\unicode[STIX]{x1D6FE})/2\unicode[STIX]{x1D6FE}}.\end{eqnarray}$$
Here
 $\unicode[STIX]{x1D6EC}_{3}$
is the fractional variation of the real-gas isentropic relation between sound speed squared and pressure from the ideal-gas isentropic relation between those same variables. In the case where the stagnation pressure and temperature are given and fixed in the comparison, a factor
 $\hat{Z}$
is still needed to account for the difference in stagnation density value from the ideal-gas value.
Upon normalization, it may be written that
 $$\begin{eqnarray}\displaystyle \frac{c^{2}}{2c_{p}\hat{T}} & = & \displaystyle \frac{\unicode[STIX]{x1D6FE}-1}{2}\hat{Z}\left(\frac{p}{\hat{p}}\right)^{(\unicode[STIX]{x1D6FE}-1)/\unicode[STIX]{x1D6FE}}\left[1-\unicode[STIX]{x1D706}_{b}+\unicode[STIX]{x1D706}_{1}-\unicode[STIX]{x1D706}_{2}+\unicode[STIX]{x1D706}_{3}\right.\nonumber\\ \displaystyle & & \displaystyle +\left.2(\unicode[STIX]{x1D706}_{b}-\unicode[STIX]{x1D706}_{1})\left(\frac{p}{\hat{p}}\right)^{1/\unicode[STIX]{x1D6FE}}+\frac{2\unicode[STIX]{x1D706}_{2}}{\unicode[STIX]{x1D6FE}}\left(\frac{p}{\hat{p}}\right)^{(2-\unicode[STIX]{x1D6FE})/\unicode[STIX]{x1D6FE}}-\frac{(5-\unicode[STIX]{x1D6FE})\unicode[STIX]{x1D706}_{3}}{2}\left(\frac{p}{\hat{p}}\right)^{(3-\unicode[STIX]{x1D6FE})/2\unicode[STIX]{x1D6FE}}\right]\nonumber\\ \displaystyle & = & \displaystyle \frac{\unicode[STIX]{x1D6FE}-1}{2}\hat{Z}\left(\frac{p}{\hat{p}}\right)^{(\unicode[STIX]{x1D6FE}-1)/\unicode[STIX]{x1D6FE}}\left[1+\unicode[STIX]{x1D6EC}_{3}\left(\frac{p}{\hat{p}}\right)\right]\end{eqnarray}$$
and
 $$\begin{eqnarray}\displaystyle \frac{c}{(2c_{p}\hat{T})^{1/2}}=\left(\frac{\unicode[STIX]{x1D6FE}-1}{2}\right)^{1/2}\hat{Z}^{1/2}\left(\frac{p}{\hat{p}}\right)^{(\unicode[STIX]{x1D6FE}-1)/2\unicode[STIX]{x1D6FE}}\left[1+\unicode[STIX]{x1D6EC}_{3}\left(\frac{p}{\hat{p}}\right)\right]^{1/2}. & & \displaystyle\end{eqnarray}$$