INTRODUCTION
It has been shown in various studies that were conducted and reported so far in the context of axial virtual cathode oscillator (VIRCATOR) that an axial virtual cathode oscillator radiates in the microwave range of electromagnetic spectrum provided the voltage applied between anode and cathode is in the order of hundreds of kilovolts. Recently, a detailed theoretical study (Singh & Chaturvedi, Reference Singh and Chaturvedi2008) was presented for a proposed low-voltage conventional vircator that shows formation of secondary virtual cathode along with the existence of a primary virtual cathode. Moreover a theoretical estimation of as high as 7% efficiency is also reported in the same theoretical model. By using the word “conventional” the other mechanisms to assist the formation of virtual cathodes are excluded here for comparison viz. the application of external magnetic fields (Kurkin et al., Reference Kurkin, Hramov and Koronovskii2011), magnetron injection gun (Kalinin et al., Reference Kalinin and Starodubov2011), shielding of the electron source from external magnetic field (Kurkin et al., Reference Kurkin, Koronovskii and Hramov2011b), and external electric field (Egorov et al., Reference Egorov, Kalinin, Koronovskii, Hramov and Morozov2006; Reference Egorov, Kalinin, Koronovskii and Hramov2007). A very interesting study regarding the effect of background gas and the ionization is also reported by Filatov et al. (Reference Filatov, Kalinin, Khramov and Trubetskov2006; Reference Filatov, Hramov, Bliokh, Koronovskii and Felsteiner2009; Reference Filatov, Koronovskii, Kurkin and Hramov2012) for low voltage vircator with decelerating electric field. Another low voltage vircator operation using pin type stainless steel cathode vircator by the application of 60 kV accelerating voltage is also reported in the literature: (Betzios & Uzunoglu, Reference Betzios and Uzunoglu2009). Conventional axial-vircators are already well reported in the literature (Yatsuzuka et al., Reference Yatsuzuka, Nakayama, Tanigawa, Nobuhara, Young and Ishihara1998; Truchi & Peterkin, Reference Truchi and Peterkin1998; Choi et al., Reference Choi, Choi, Choi, Song, Jung, Seo, Shin, Uhm, Lim, Kim, Lee and Ahn2002; Reference Choi, Choi, Jung, Chong, Ko, Seo, Cho, Uhm and Suk2000; Chen et al., Reference Chen, Mankowski, Walter, Kristiansen and Gale2007).
As far as experimental point of view is concerned it becomes more and more tedious and complex task to make a pulse power source that delivers higher electrical powers needed to drive the vircator at the hundreds of kilovolts of voltages. As the output voltage of the pulse power source is increased, to meet the requirement of vircator, the associated system components become bulkier and bigger in size. This results from the requirement of breakdown strength of insulating materials used in the system design. It results in a quest to explore microwave emission characteristics of a vircator operating at the relatively lower voltages of operation, which can be provided by a compact and easy-to-operate-with pulse power source. Essentially, the problem gets bifurcated to two parts, one being engineering part to make a suitable compact and small pulse power source and the other being to understand the physics of the axial virtual cathode oscillator when connected to such small and compact pulse power source.
A virtual cathode oscillator works when the current of a beam of charged particle moving inside a drift tube far exceeds the space charge limited current defined for that drift tube geometry. Under such circumstances the pinching inside the beam takes place and a virtual cathode is formed at the place where the density of charged particle is high and energy is in form of potential energy rather in form of kinetic energy. The region of these high density charge particles oscillates in space as well as in time leading to a radiation mostly defined by the density of the cloud of charge particles. Moreover the charges, which are still trying to replenish the beam current, get trapped between real and virtual cathode and also start radiating electromagnetic wave with a frequency depending upon reflection time for the charged particles between real and virtual cathodes.
EXPERIMENTAL DETAILS
Vircator Parameters
In the present experiment, we have used a vircator chamber made of stainless steel having a sheet thickness of 3 mm. The cathode is made of aluminum which is covered with velvet on the electron emission surface using a silver epoxy based electrically conducting bonding agent. The diameter of the velvet area stuck on the aluminum is 50 mm and the anode is made of stainless steel with an optical transparency of nearly 90%. In an interesting study done on carbon fiber cathodes (Li, Reference Li, Liu, Xu, Chen, Chang, Wan and Wen2009; Li Reference Li, Chang, Zhang, Liu, Chen and Wen2012) it has been shown that quite high (280–440 A/cm2) and almost uniform electron current densities are produced in carbon fibers. In a very recent published study by Roy et al. (Reference Roy, Menon, Sharma, Patel, Sharma and Chakravarthy2013), the current densities in graphite stainless steel nail cathode and carbon fiber cathodes at 200 kV of applied voltage is also found to be similar. In the present set of experiments, the gap between anode and cathode can be adjusted from 2 mm to few centimeters. The electron-beam-diode zone of the vircator is evacuated to a measured 2 × 10⁻⁴ torr vacuum inside the vircator chamber. It is measured using the penning gauge connected with the vacuum chamber directly. The vacuum measured at the mouth of the diffusion pump at the same time was still better than an order of magnitude. The vacuum inside the chamber is generated using a diffusion pump of 500 Liter/s pumping speed being backed by a rotary pump. The connection of the vacuum line between diffusion pump and the vircator is done using a 50 mm diameter stainless steel bellow connected with a high voltage isolator of KF-50 port.
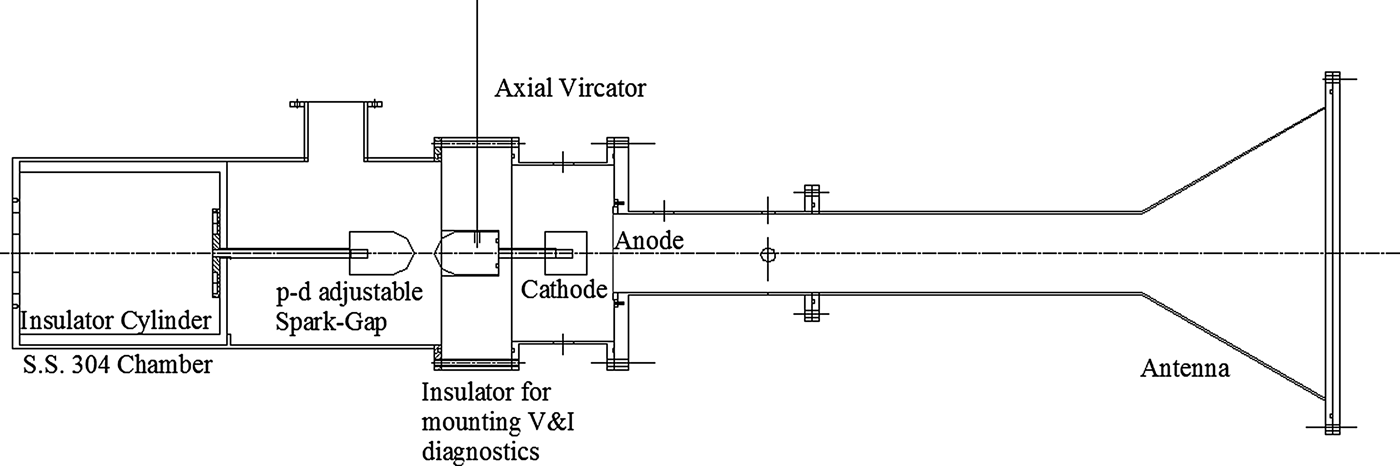
The experiments were conducted with different anode cathode gaps like 8 mm, 7 mm, 5 mm, and also at 3 mm to enhance the microwave emission to a detectable/measurable value. It was observed during the series of such experiments that the anode-cathode gap of 3 mm leads to maximum microwave radiation for fixed diameter of the cathode that is 50 mm in all such cases of study. Consequently, we are presenting the results of 3 mm anode-cathode spacing in this paper, which has shown maximum microwave emission from the device. We also have connected a conical horn antenna to the vircator output window made of Nylon. The input of the conical horn antenna matches with the diameter of drift tube that is 112 mm in dimension and output side of the horn antenna is 412 mm aperture diameter, which is flared at an angle of 30° (cone half angle) from the antenna input end. The calculated gain of horn antenna is nearly 16 dB at frequency of 6.0 GHz. The length of the drift tube between antenna input port and anode is 1 m. The complete vircator system is made in such a way so that it can be fitted with the cable based pulse forming line (PFL) very easily. The central electrodes of all four cables of PFL are press-fitted with a common point connected with one electrode of pressure-distance controlled spark gap, which is connected between pulse forming line and the vircator and also controls the pulse forming line discharge into vircator. The braid part of the high voltage cables are connected to the S.S. chamber connected with the anode of the vircator using a flange based bolting method. Extra insulation inside the S.S. chamber between cable terminals is provided by using a properly shaped poly-propelene cylinder of 1.5 Inch thickness. The spark gap between the pulse forming line and vircator is filled with 2 atm of absolute pressure of air. Figure 1 presents the physical picture of the virtual cathode oscillator used in the experiment and Figure 2 is geometrical drawing of the virtual cathode oscillator with input ports for 450 kV, 60 ohm cables fitted with its standard connectors.
(Color online) Picture of virtual cathode oscillator assembly fitted with the cable based PFL.

Geometrical drawing of the virtual cathode oscillator system.
Energizing the Vircator
PFL is made using four equal lengths (5 m) of the high voltage (450 kV) 60 ohm characteristic impedance cables connected in parallel to make a 450 kV pulse forming line of 15 ohm characteristic impedance and nearly 50 ns pulse-width. The capacitance of the pulse forming line is nearly 2 nF. The pulse forming line is being charged using unipolar high voltage pulse in order to utilize the cable breakdown strength safely. For achieving this condition, a high voltage pulse transformer is made with a higher coupling (80%) in between its primary and its secondary. The transformer is made using the same technique (Shukla et al., Reference Shukla, Banerjee, Sharma, Das, Deb, Prabaharan, Das, Adhikary, Verma and Shyam2011) in which the capacitor bank is shaped in form of its single turn primary but to have a higher coupling ratio. The primary capacitor bank has an assembly of 7 axial-capacitors of 2 µF, 5 kV each connected in parallel and four such combinations connected in series in order to provide a net capacitance of 3.5 µH and a peak voltage rating of 20 kV. The primary inductance is computed to be 215 nH considering sheet equivalent of the primary turn with 320 mm diameter. The secondary of transformer is made using Teflon insulated wire wound 40-turns at a pitch of 10 mm on a cylindrical former of 280 mm diameter made of perspex. The computed secondary inductance is 240 µH and mutual coupling is as high as 0.8 with a mutual inductance of 5.75 µH. The energy efficiency if computed for the first peak (of secondary) comes out to be nearly 56%. It is to be noteworthy here that it is chosen to have an energy-efficiency less than 100% in order to get monopolar charging of the pulse forming line. The primary capacitor bank of the pulse transformer discharges its energy in the form of single turn loop through a spark gap which is at present operating in self-breakdown mode by over-volting of the spark gap beyond its dielectric strength. The spark gap can also be triggered using optical isolation to have repetitive operation at such low energy and low voltage. As far as the charging of the primary capacitor bank is concerned, it is done by very simple method which involves a high voltage step up transformer delivering 14 kV in secondary when the primary is fed at 230 Volts. The output is half wave rectified using a diode chain of 25Amperes and 1000 V ratings. Some inductive isolation is also provided between primary capacitor bank and the high voltage step up transformer output terminals in order to isolate the rectifier diode chain during the discharge of the primary capacitor bank. The charging voltage of the primary is controlled by using a variac which limits the input voltage of high voltage step up transformer from 0 volts to 230 volts eventually leading to the limiting of high-voltage step-up transformer output going to the primary of the capacitor bank.
Diagnostics
In order to characterize the vircator, we have used the diagnostics that are essentially electromagnetically coupled with the system and give their output as a time-dependent voltage pulse. To measure the diode current and diode voltage we have used current transformer and voltage divider respectively. The current transformer is connected to one segment of ground connection done in 12 parts using stainless steel bolts. In this way, the peak current to be measured by the current transformer is reduced to a factor of 12. The rise-time of the current transformer is 5 ns. The voltage appearing at the diode is measured by a series cascading of two standard 100 MHz bandwidth resistive voltage divider of 100 kV peak voltage measurement capacity. The cascaded voltage divider assembly can measure a peak voltage of 200 kV at a well estimated bandwidth of 100 MHz multiplied with square-root of two. This factor certainly leads to a rise-time better than 7 ns to be measured by the probe made after combining the two of 100 MHz probes. For this reason, the output waveform of the voltage divider is smoothened to 50 MHz bandwidth by numerical techniques in order to incorporate the bandwidth loss of the assembled probe resulted due to the series cascading and also due to additional connections used in the series cascading of the two similar probes. In order to measure the charging voltage on the pulse forming line, another high voltage divider is made in-house. It has 5 ohm disk resistor in its lower arm whereas the upper arm is made of 40 kohm impedance disk resistor. The whole divider chain upper arm is kept inside an insulator housing filled with transformer oil in order to increase its maximum voltage measurement capacity. The length of oil filled upper arm is nearly one meter and hence is expected to successfully measure 450 kV peak charging voltage applied on the pulse forming line.
The emitted microwaves are measured using wide-band double-ridged horn antenna with a gain of 12.5 dB at nearly 6 GHz with approximately flat frequency response from 4–8 GHz connected to a high-bandwidth 50-ohm coaxial cable for final connection with the high bandwidth oscilloscope (10 GHz, 40 GSa/s). To attenuate the received signal from the antenna, so that oscilloscope is not damaged by the input signal, we have used standard attenuators of broad DC-18 GHz frequency range 40 dB power attenuation depending upon the measurement requirements. The attenuation imposed by the cables connecting the antenna with the oscilloscope is 3 dB as is measured by the high frequency signal generator (operating in frequency range 4–10 GHz) and the oscilloscope. The high bandwidth oscilloscope with 10 GHz bandwidth and 40 GSa/s sampling rate was kept inside a 50 dB shielded chamber with all its electrical power being provided by the uninterrupted power supply (UPS) kept inside the chamber. The diagnostic cable and power chord for UPS were provided inside the chamber using specialized input ports to maintain its shielding effectiveness for the frequencies of our concern.
MODELING RESULTS (XOOPIC TWO AND HALF DIMENSIONAL PARTICLE-IN-CELL CODE)
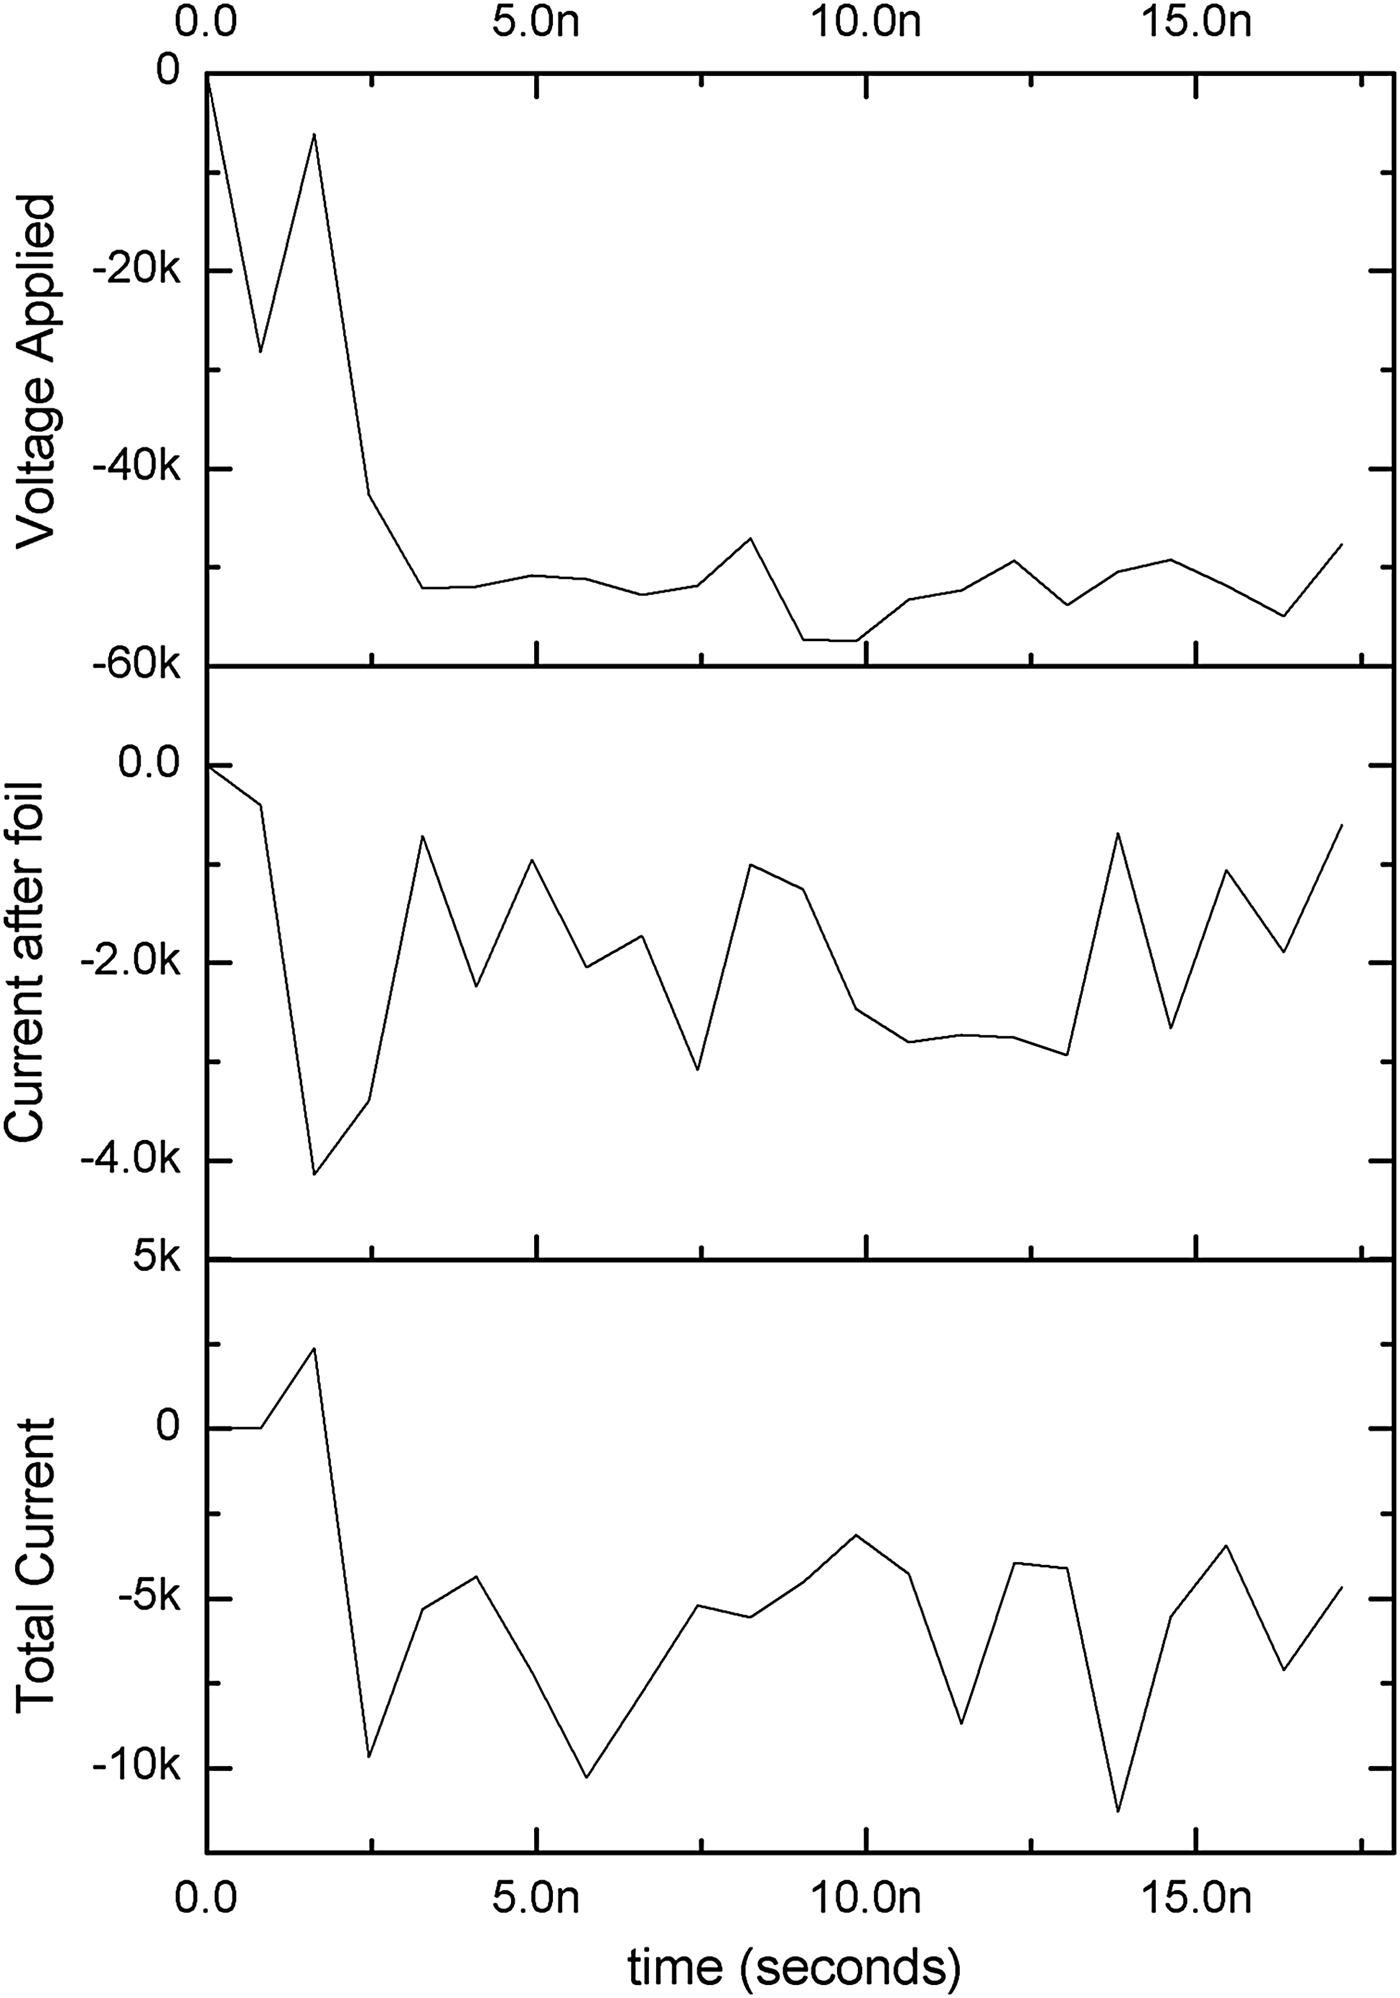
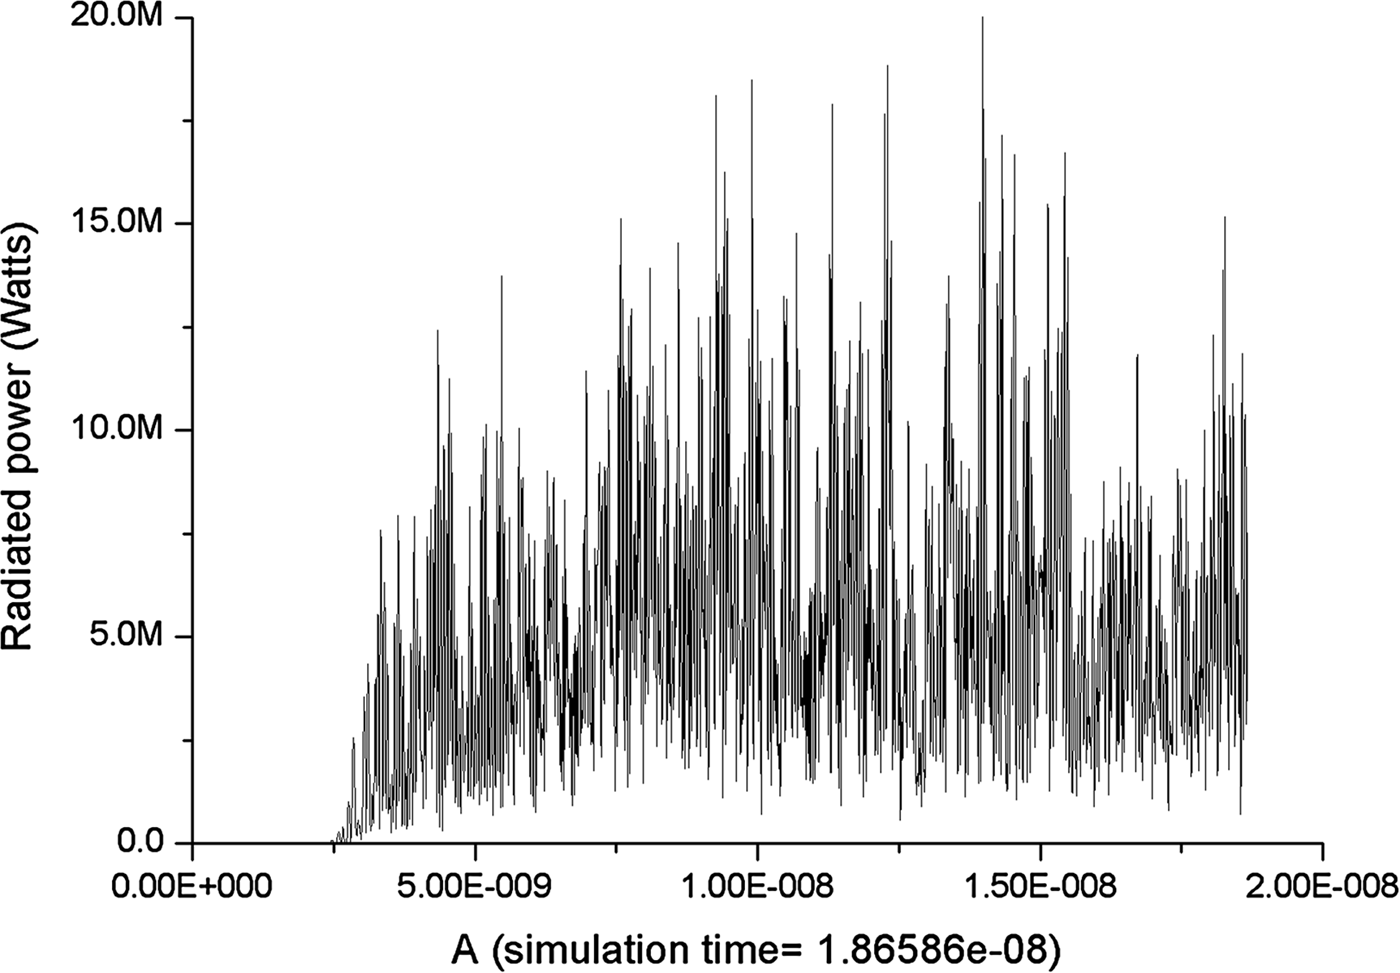
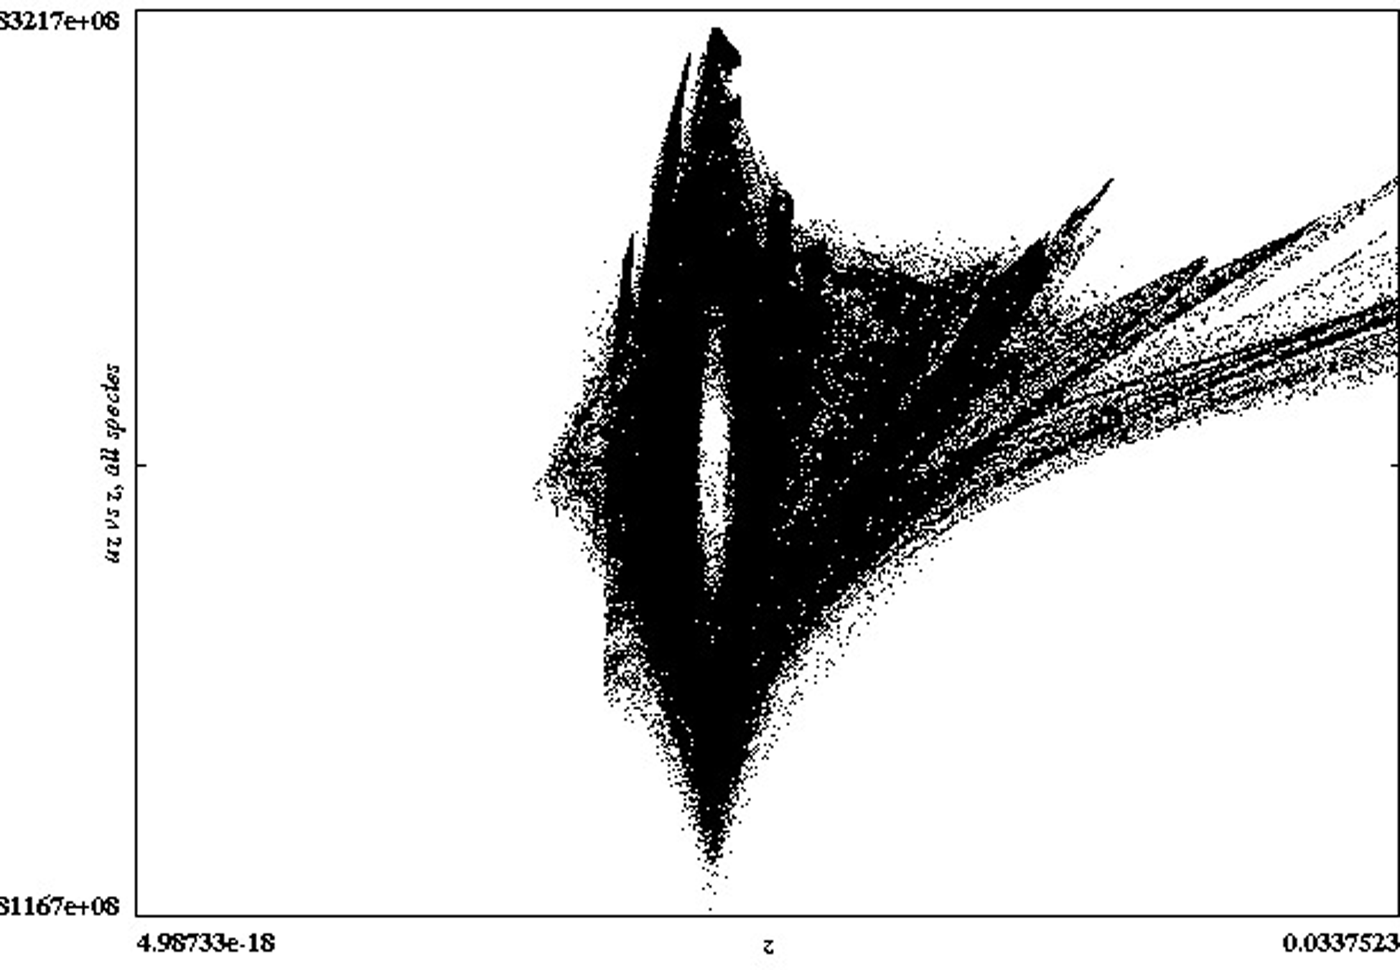
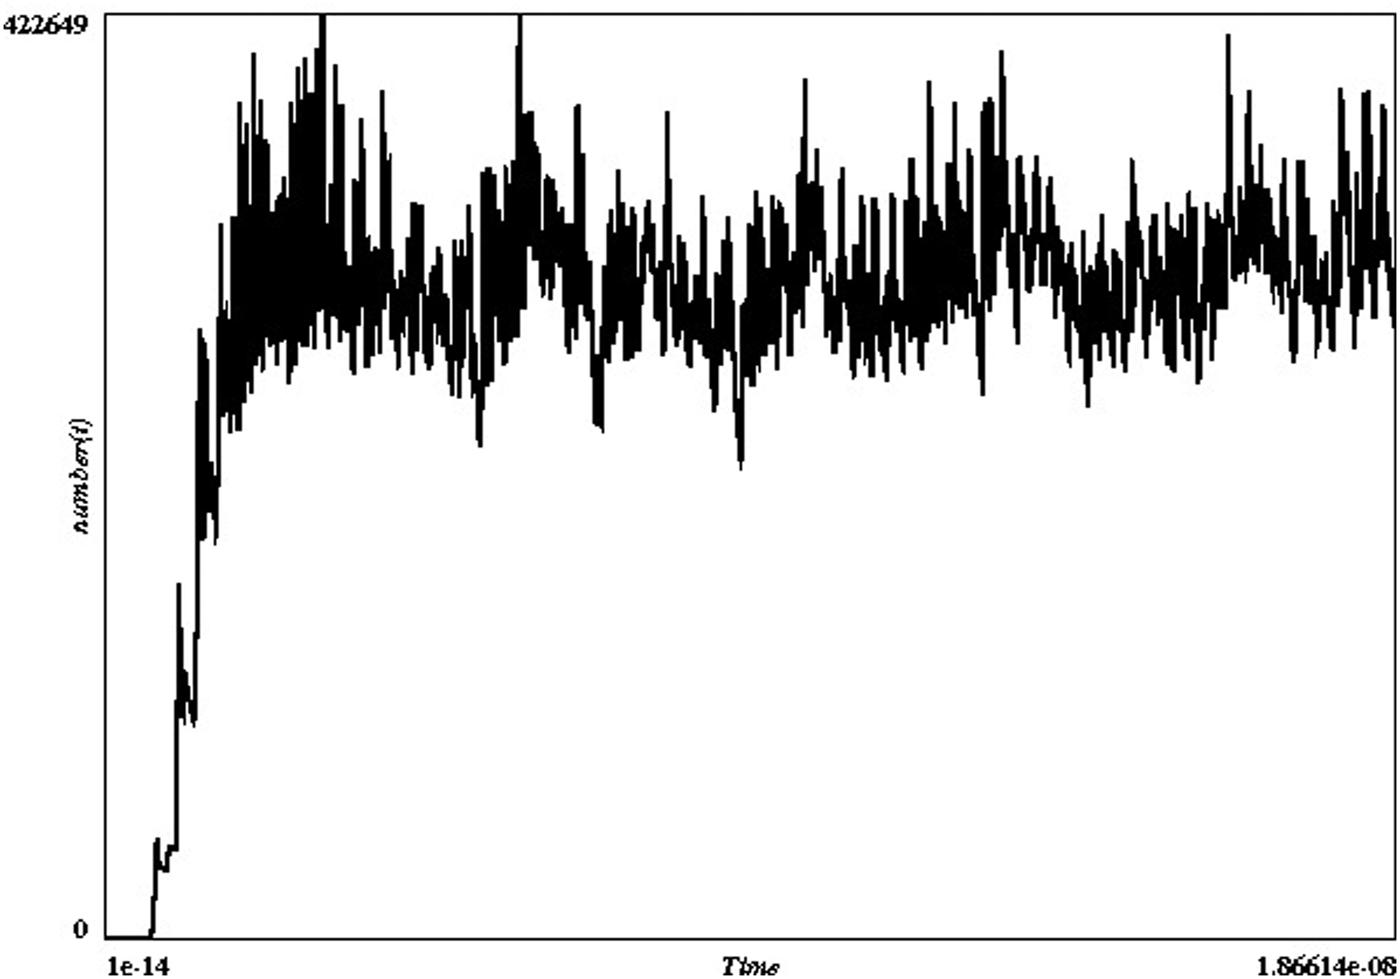
Extensive modeling for the results of low voltage vircator was done in a two-and-half-dimensional computer code called XOOPIC (made available online by Plasma Theory Simulation Group, Electrical Computer Engineering Department, Michigan State University, and Nuclear engineering Department University of California, Berkeley), which uses particle-in-cell technique to solve the electromagnetic computational problem. The necessary modifications in the available code were done in accordance with the scheme described by Singh et al. (Reference Singh and Chaturvedi2008) and the results were obtained in the computation by using a time step of 0.01 pS and a mesh size in axial direction is 0.25 mm and in the radial direction is 0.5 mm in the computational space. The applied voltage pulse total emitted current and current after the foil are collectively shown in Figure 3. The results are well depicting that the current emitted by the emitter is nearly 5–6 kA that matches well with the obtained results for the same experimental setup as shown by the experimental results in the next section. The voltage pulse applied is having 1nS rise-time and has been applied in radial direction through a gap, which distributes the fields in the radial direction as per the radial location of respective mesh. Figure 4 shows the radiation pulse as measured at the output port as the integral of pointing flux at the output window. The graph shows that the emitted power is averaged at 5 MW even though intermittent peaks of very short durations are seen for 15 MW. The fast Fourier transform of the measured radiated power is shown in Figure 5 and lies from 8 GHz to 12 GHz which is not very far away from our experimental findings reported in the next section. Figure 6 presents the uz versus z graph of the charged particles trapped between the cathode and anode and is showing that the velocity is limited to 1.8 × 10⁸ m/s and hence the frequency of the radiation is not very high for very small gap spacing. Figure 7 presents the total number of simulation particles which is nearly 4 × 10⁵ particles stabilized after 2nanoseconds from the beginning of the modeling. The number of simulation particles number of meshes and simulation time step decide the total time of computation or the problem space. For the computation of 18.66 nS problem duration it is observed that computational run time is nearly 72 hours on a 4 GB RAM computer having 3 GHz speed.
Simulation voltage, total current and the current after foil measured in the XOOPIC simulation.
Power radiated in the simulation.
(Color online) Instantaneous FFT of the radiated power and halved frequency to find the frequency spectrum of radiation in simulation.
Uz versus z for the electrons trapped between cathode and vircual cathode at 18.66 ns.
Number of simulation particles with time.
EXPERIMENTAL RESULTS
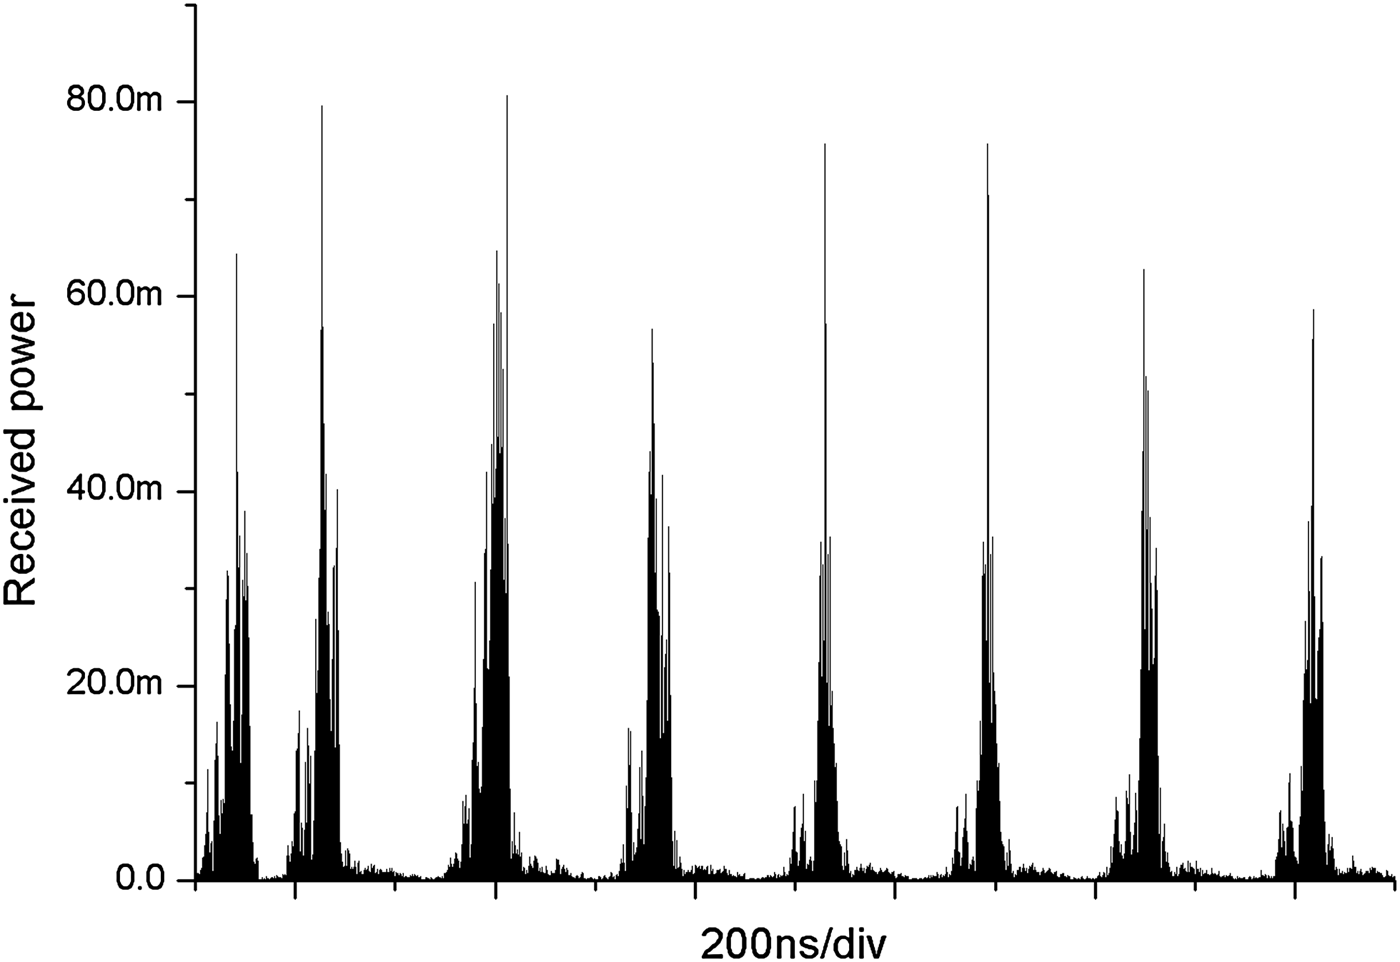
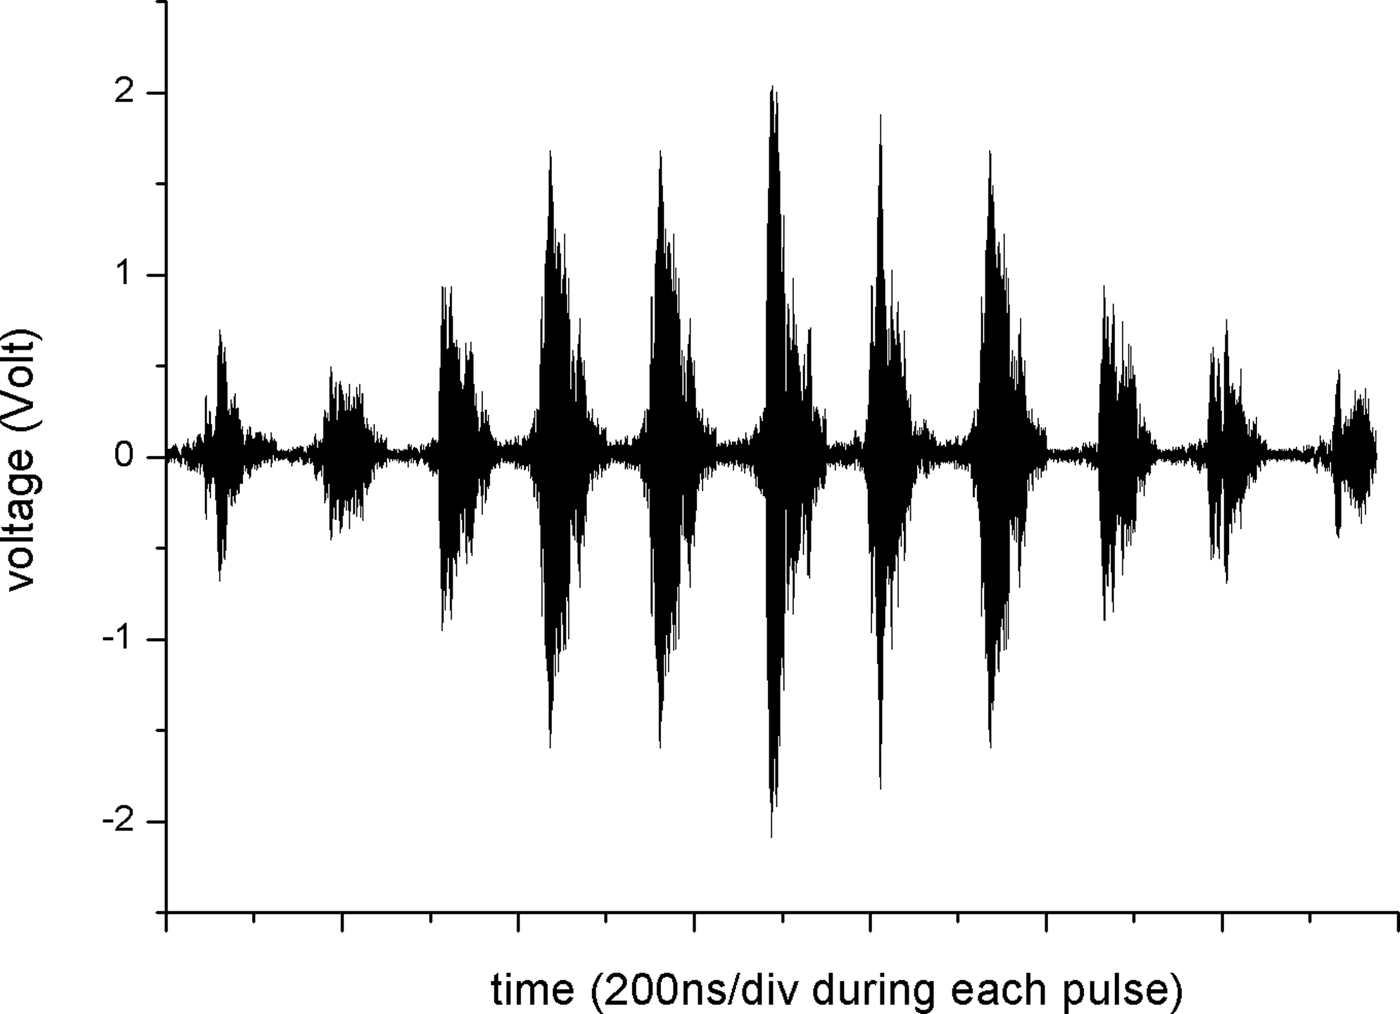
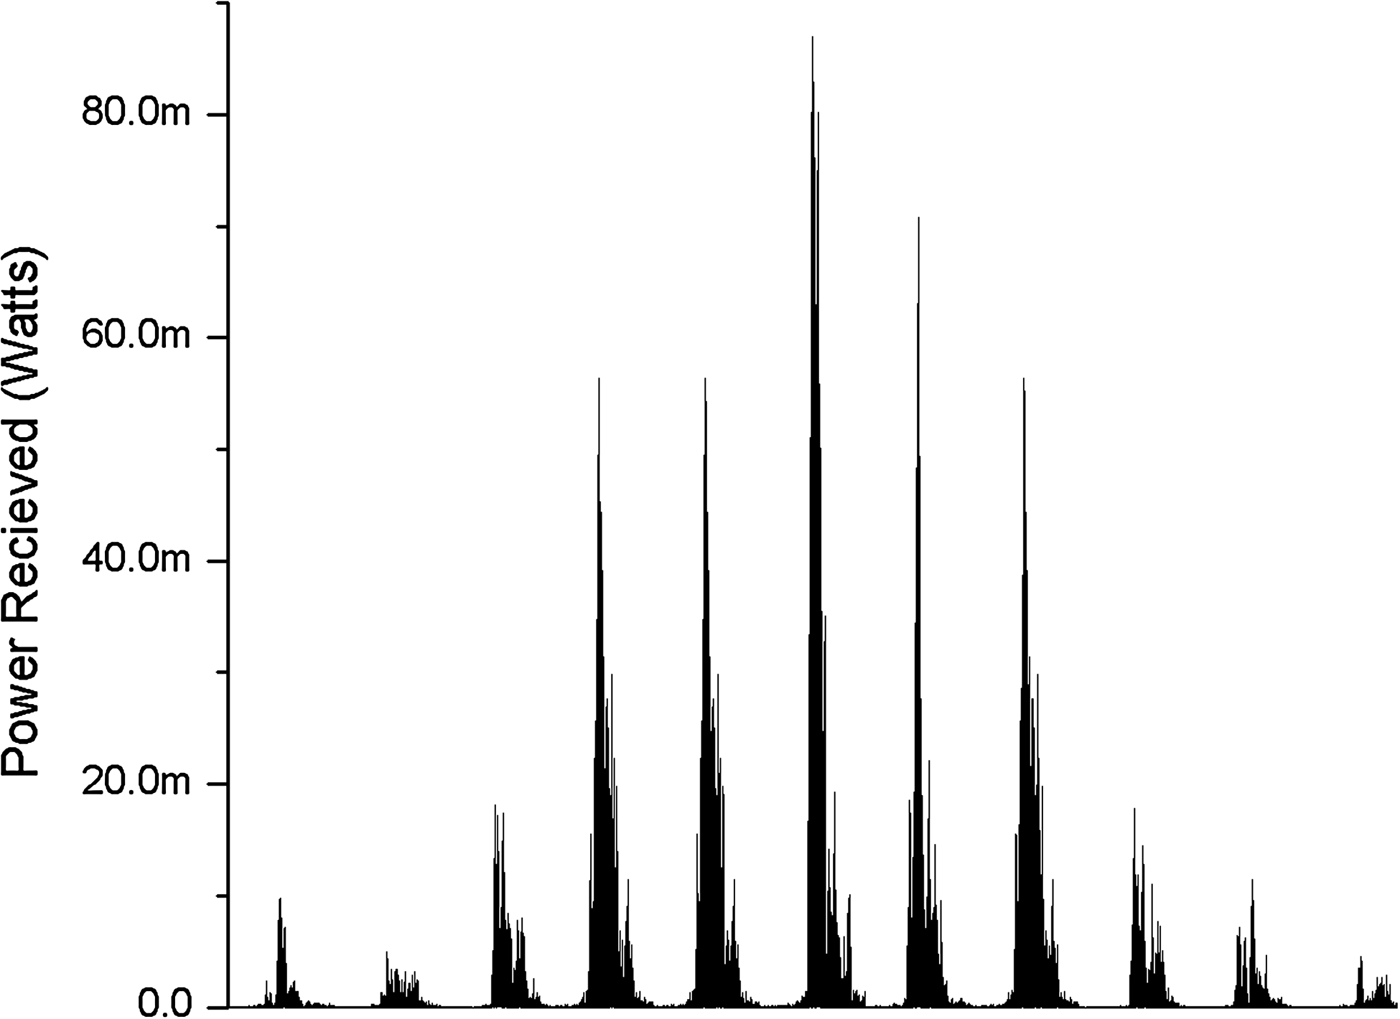
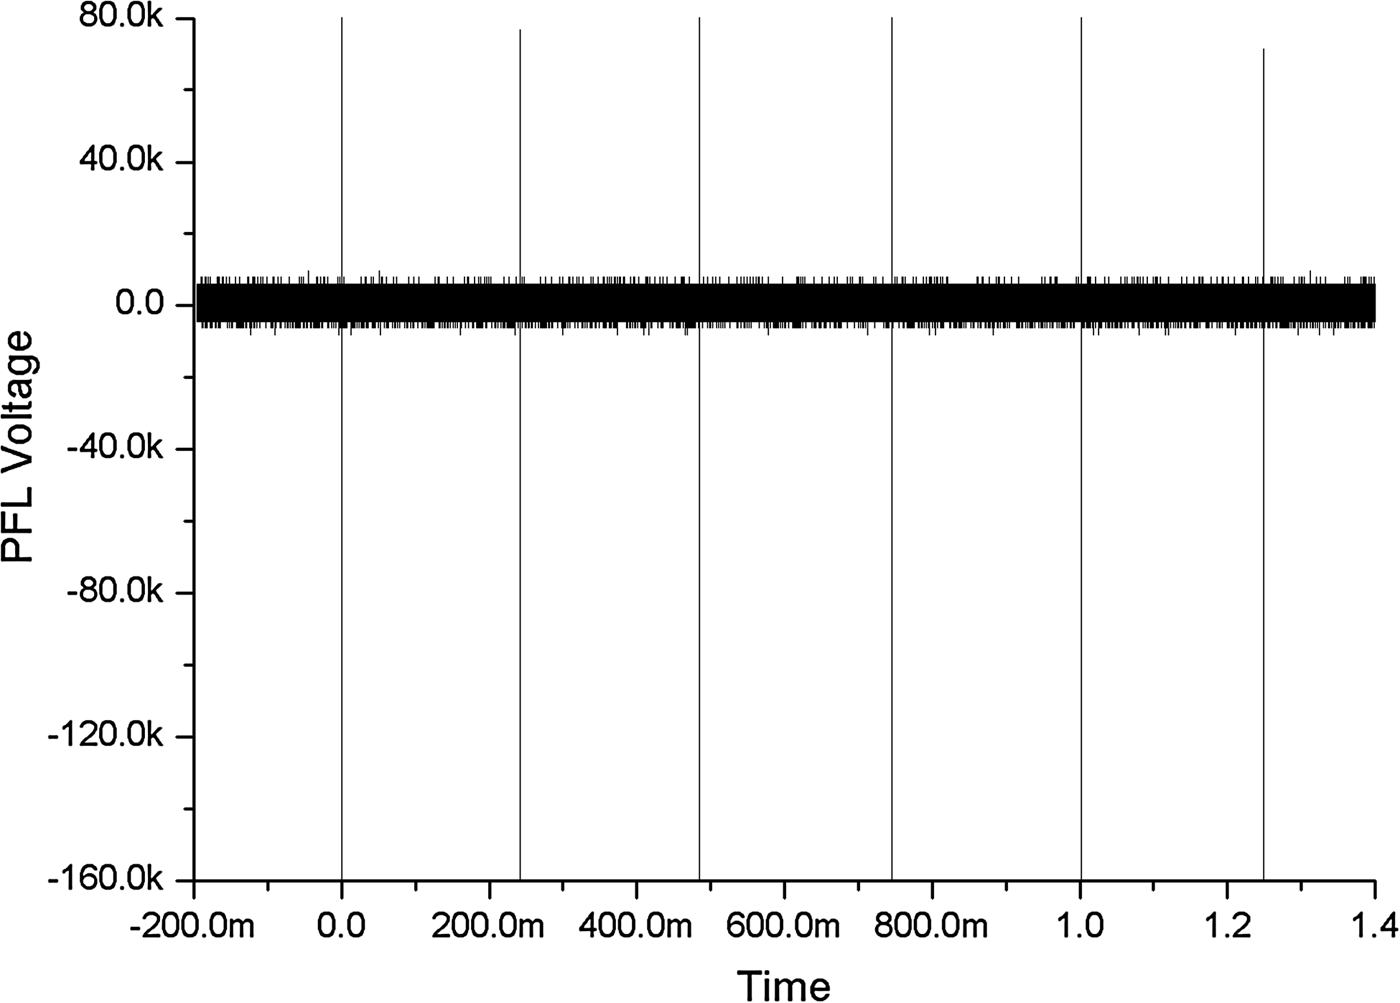
In Figure 8, the pulse forming line charging voltage and the diode voltage is shown. It is shown that the charging of pulse forming line is done using monopolar pulse within 1µS from the beginning of the charging which is quite fast. The diode voltage is nearly 50-kV peak which are very low for the conventional vircator operation as is mentioned in the literature to the best knowledge of the authors. In Figure 9, the current and voltage inside the diode are simultaneously shown for showing a comparison and also to show that main power consumption is taking place in the first pulse only. It turns out that the diode current is 6 kA leading to the diode impedance estimation of nearly 8 ohms. As we know that the pulse forming line has a characteristic impedance of 15 ohm and is charged to 160 kV peak voltage hence a load impedance of 8 ohm will have nearly 50 kV voltage on it. It again shows that the voltage pulse appearing on the diode is well distributed as per the voltage division ratio with its source (PFL) impedance. The experiment was conducted to capture full amplitude by inserting a 40dB attenuator before the oscilloscope after the signal cable. The captured waveform is shown in Figure10, which is received by receiving antenna kept at 2.5 m away from radiating antenna. This figure contains the information about measured power in eight different shots showing that the power variation between different shots is insignificant. To show the frequency stability in the different shots the instantaneous FFT of the measured waveform of Figure 10 is shown in Figure 11. The frequency comes out to be ranging from 4.5 GHz to 8 GHz consistently in all the eight shots. To verify that the antenna measurements are done in the far field region, we conducted the measurements at axis that are differing in the distance from the radiating antenna at three different points viz 1.5 m, 2.5 m, and 3.5 m away from the radiating horn antenna. Three waveforms at each point were noted and plotted in form of Figure 12 and it is evident from the figure that measurement at each point follows nearly r 2 dependency while going away from source after 1.5 m away from radiating antenna hence the conducted measurement can be approximated with the far field measurement for the power estimation. Figures 13 and 14 show the measured electric field and measured power, respectively, when the receiving antenna was rotated with an angular displacement of 7.5° from −45° to +45° in a radius of 2.5 m from the radiating antenna to capture the radiation pattern of vircator. A peak power of 85 milliwatt at the central axis was measured. A cone half angle of 15° was observed by the noted radiation pattern and records. The peak radiated power after calibration factor put into the calculation comes out to be 0.85 MW (megawatts). The efficiency of the low voltage vircator reported in this paper is coming out to be nearly 0.3% if compared with the input power of the electron beam that is 50 kV and 6 kA, respectively. The spectral density as a function of time of the recorded waveform is shown in Figure 15 that shows that the frequency content has chirping in every shot staring from 4 GHz to 8 GHz and the frequency content is not changing from shot to shot. The repetitive operation of the vircator is shown in Figure 16 which shows the PFL voltage during six sequential shots at 4 Hz. The respective radiation patterns of all sequential shots are shown in Figure 17 with the time scale adjusted so that we may easily compare the modulation and amplitude of each pulse to see the stability of radiation in different shots.
(Color online) PFL charging voltage and the diode voltage waveforms.
(Color online) Diode voltage and diode current waveforms.
Microwave pulse with 40dB external attenuator measured at 2.5 m from radiating antenna in 8 shots (power stability in different shots).
(Color online) Instantaneous FFT of the acquisitions of previous electric field measurement (frequency stability in different shots).
(Color online) Microwave pulse with 40 dB external attenuator measured at 1.5 m, 2.5 m, and 3.5 m from radiating antenna at the axis (showing r 2 power attenuation).
Electric field measured at 2.5 m from radiator when the receiving antenna is scanned from −45° to 45° on axis varying in angle of 7.5°.
Power measured at 2.5 m from radiator when the receiving antenna is scanned from −45° to 45° on axis varying in angle of 7.5°.
(Color online) Instantaneous FFT of the signal of Figure 13 showing frequency stability between different shots.
4Hz discharge of the primary capacitor bank for the generation of the microwave in vircator.
(Color online) Radiation of vircator at 4 Hz (six shots electric-field recorded) shifted in time scale to show the peaks and modulation.
CONCLUSION AND DISCUSSION
In the present experiment, if we consider that the maximum area that can cause the formation of measured electron current is equal to the cathode area and the electron beam is nearly uniform, then interestingly the current densities achieved with velvet cathode are also nearly 300 A/cm2. The simple method of capacitor bank charging topology makes it possible to operate the vircator at nearly 4 Hz of repetition frequency which is shown in results of the discharge waveforms of the primary capacitor bank. The glow on neon lamps array and resetting of the computers kept in front of output window with assisted microwave coupling from the vircator are the qualitative inferences of electromagnetic emission form the vircator device whereas the Fast Fourier Transform of oscilloscope signal gives the frequency spectrum of radiated emission lying in the receiving range of the antenna. It comes out that the emission ranges in the range of 4–8 GHz and frequency chirping during each shot is also well observed in the recorded radiation pulse of the virtual cathode oscillator. The shot to shot stability of power and frequency is also well demonstrated in the experiment. The experimental results are very much consistent with the extensive simulation/modeling results presented in this paper.