1 Introduction
The Social Security Disability Insurance (SSDI) program received approximately $119 billion in payroll tax contributions and paid approximately $143 billion in benefit payments in 2015 (Social Security Administration Board of Trustees, 2016, Table 4. A2). According to projections, the SSDI trust fund will be depleted in 2023, and the program will no longer be able to pay benefits as scheduled. The economic efficiency of the program depends heavily on several factors, including, for instance, the relationship between economic conditions and benefit applications and awards and the capacity of SSDI recipients to continue working (Autor and Duggan, Reference Autor and Duggan2003; Maestas et al., Reference Maestas, Mullen and Strand2013). In this paper, we examine another aspect of the efficiency of the program, namely the retirement incentives for healthy older workers that arise from the tax and benefit structure of the program. This aspect is important given policy makers’ interest in extending working lives in order to shore up entitlement programs and improve retirement security. To the extent that contributions toward payroll taxes differ from the present discounted value of expected benefits earned by those contributions, the SSDI portion of payroll taxes (equal to 1.8% of earnings) may create work incentives or disincentives. Work incentives could arise if the additional benefits earned from additional payroll taxes paid are larger than the payroll taxes paid, and disincentives could result from little or no additional benefits earned from additional contributions.Footnote 1
We use stylized earnings histories and population disability hazard rates to illustrate the extensive margin work incentives from participating in the labor force for an additional year as measured by the expected value of additional SSDI benefits from additional earnings. The eligibility requirements to qualify for disability benefits stipulate that an individual must have worked 5 of the most recent 10 years. Thus, for an individual who has worked continuously, extending his or her career by 1 year is equivalent to purchasing a 1-year term disability insurance policy 5 years into the future. The value of this policy depends on the probability of becoming disabled during that year, the annual benefit amount that would be paid, and the length of the benefit period over which the benefit would be paid. While the probability of becoming disabled increases with age, the length of time a person is expected to receive disability benefits declines. Overall, our results show that the expected present value of benefits declines with age for individuals 50 and older, as the increase in expected benefits from the higher probability of being disabled is outweighed by the reduction in expected benefits from the shorter potential benefit horizon.
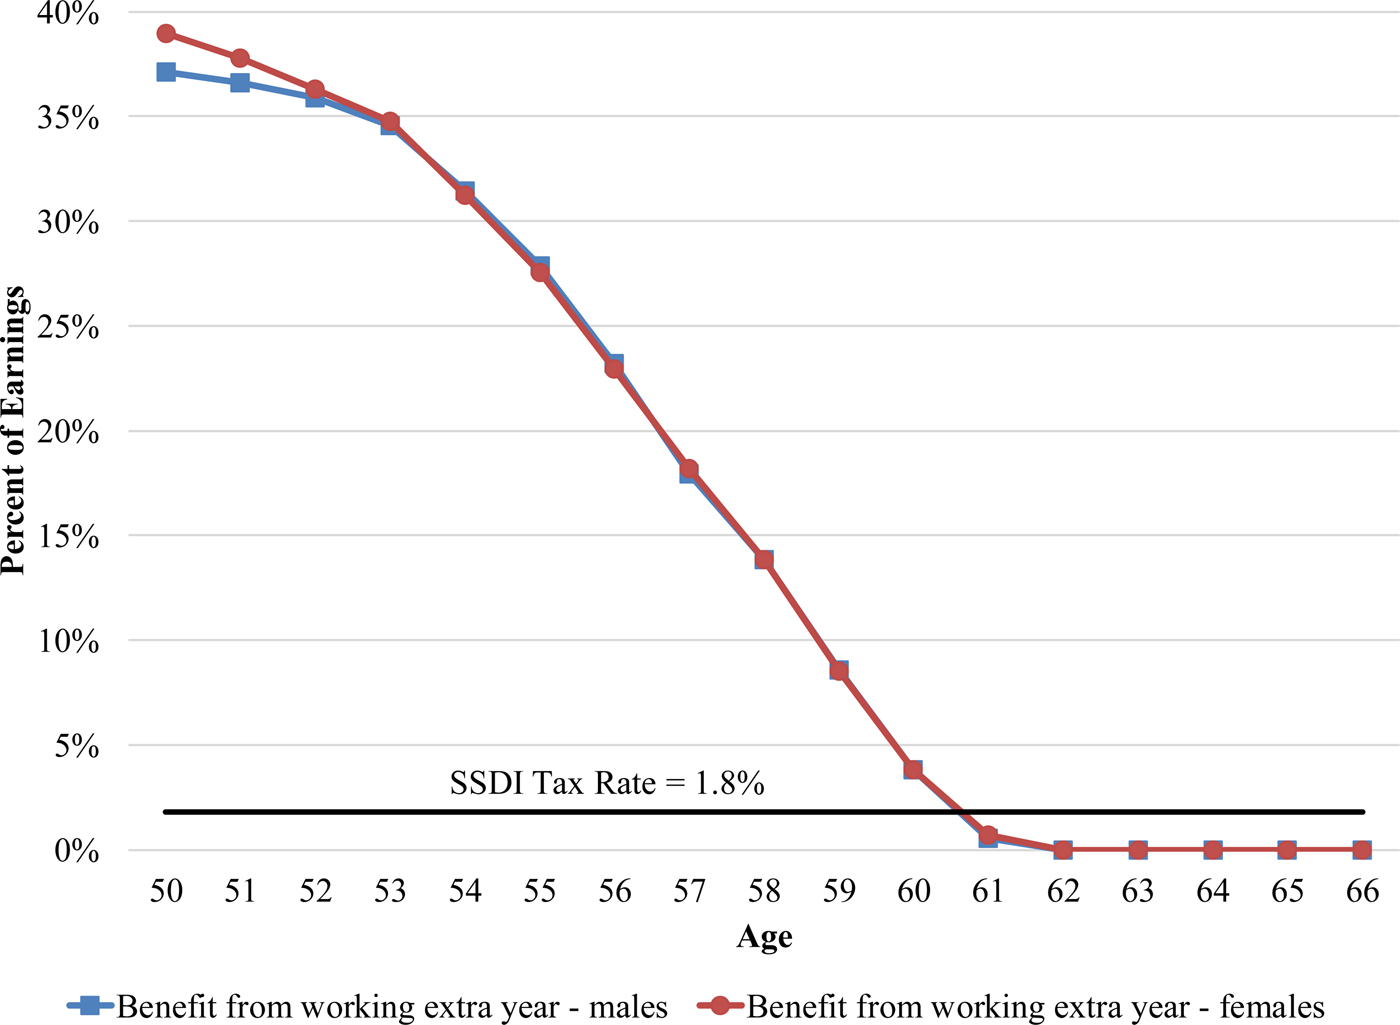
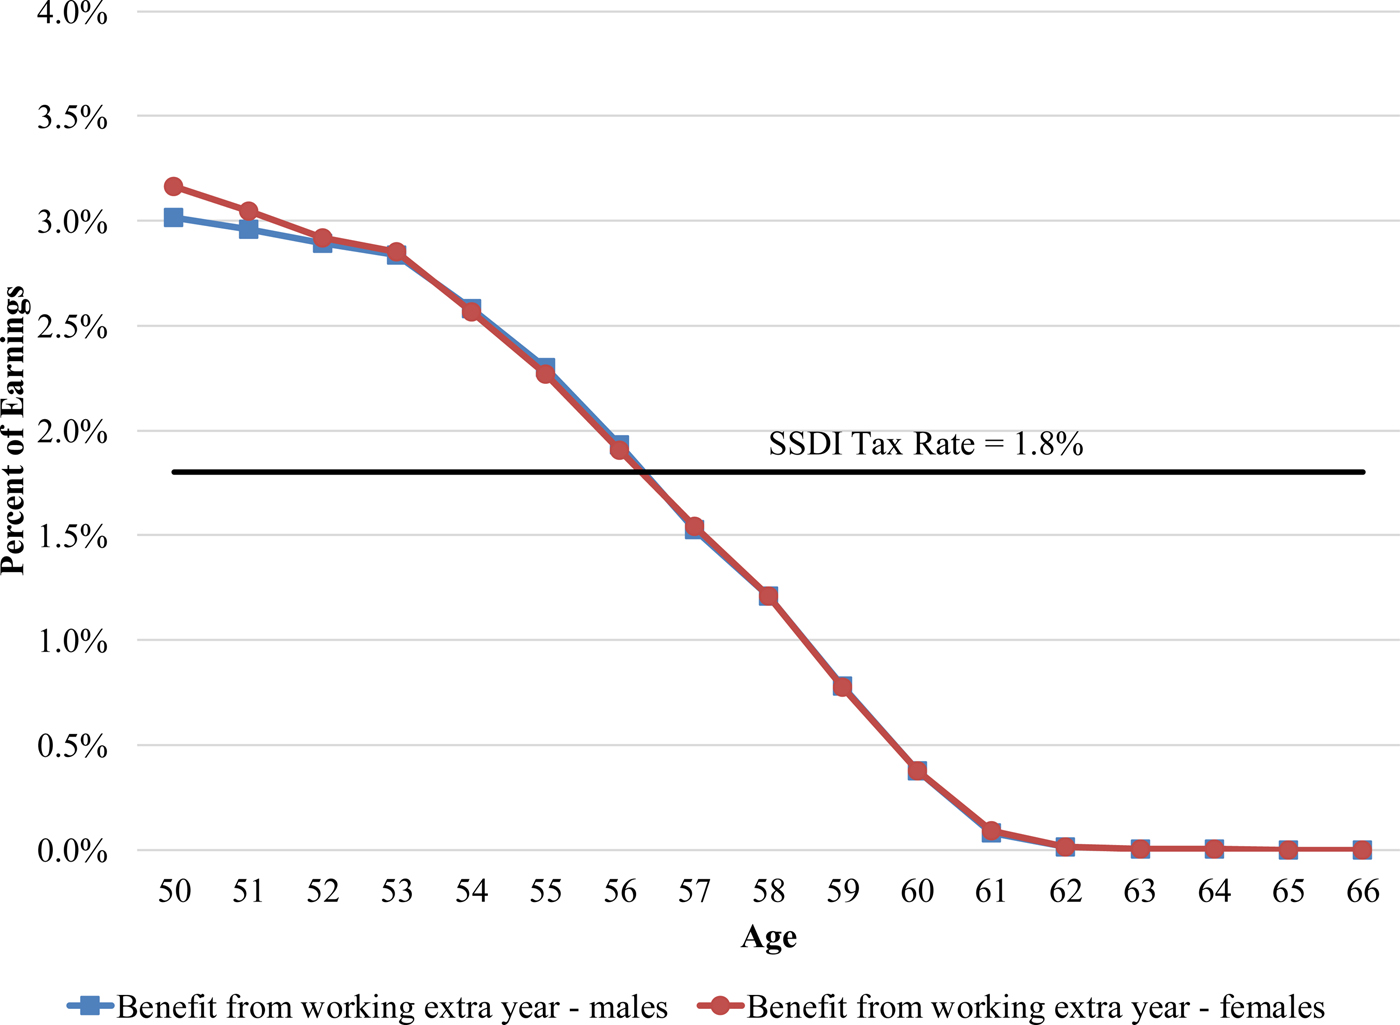
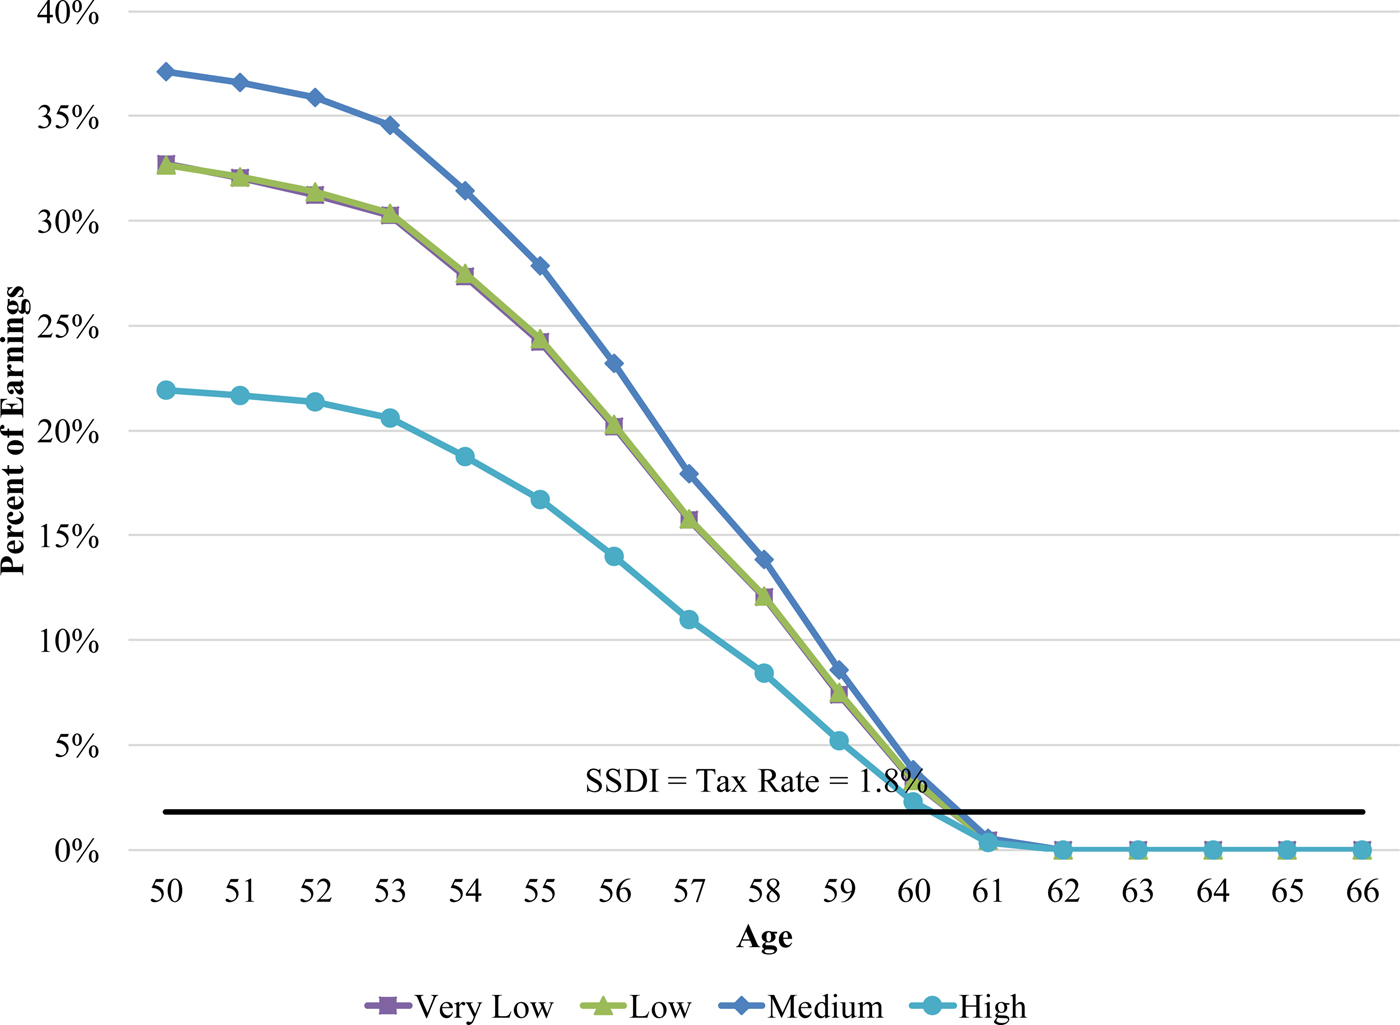
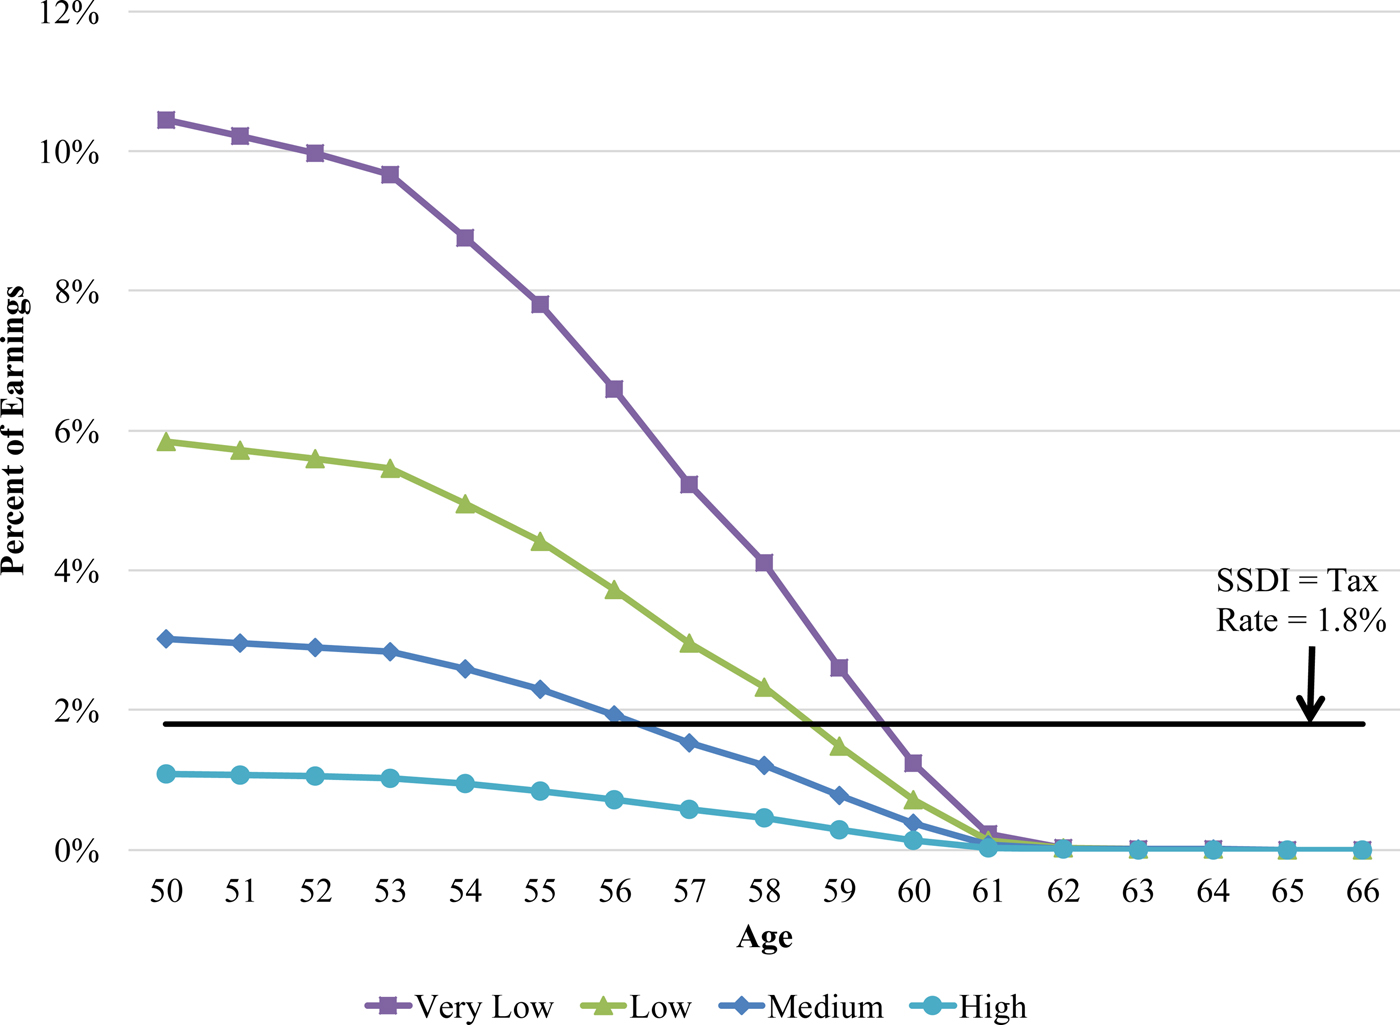
The size of the extensive margin benefit relative to the SSDI payroll tax depends on the amount of income earned during the additional year of work. On the one hand, if a worker earns the minimum required to extend eligibility under SSDI, the return on working an additional year can be substantial, equal to more than 35% of the additional earnings at age 50. However, the return rapidly declines with age and becomes negative at age 61. On the other hand, an additional full year of earnings provides a much more modest return net of the 1.8% payroll tax, equal to <1.5% of earnings at age 50 and becoming negative by age 57. This difference occurs because the extension of eligibility does not depend on the amount earned during the additional year of work. Thus, earning more than the minimum required to extend eligibility does not provide much additional benefit. This is confirmed by a calculation of the intensive margin return to work – the net benefit from earning an additional dollar – which is negative for all workers 50 and older.Footnote 2
In either scenario, after one reaches age 62, the value of the 1-year term disability insurance policy 5 years into the future is zero. At this point, eligibility is already guaranteed through normal retirement age, and the 1-year extension of the eligibility window occurs after normal retirement age. Thus, individuals who become disabled during the additional year of eligibility are simply paid the retirement benefit to which they would be entitled anyway. Although earnings at ages 62–65 (if they are large enough) can still boost any disability benefits claimed before normal retirement age, this effect is small, and the 1.8% payroll tax is almost a pure tax on work at these higher ages.
We repeat this analysis for stylized workers at different levels of earnings. We assume that workers with higher levels of earnings have lower probabilities of becoming disabled, using differences in disability hazards by education as a proxy (von Wachter, Reference von Wachter2012). We find that the SSDI program provides high-earning individuals with lower returns from working on the intensive and extensive margins; this difference results from the group's lower disability hazards and higher levels of earnings combined with the progressive nature of the benefit formula. However, the patterns of retirement incentives discussed here persist for all earnings groups.
A number of other papers have examined work and retirement incentives at older ages that arise from the Social Security retirement program, focusing on both the intensive (e.g., Feldstein and Samwick Reference Feldstein and Samwick1992; Cushing Reference Cushing2005) and extensive (e.g., Butrica et al., Reference Butrica, Johnson, Smith and Steuerle2006; Goda et al., Reference Goda, Shoven, Slavov, Brown, Liebman and Wise2009; Reznik et al., Reference Reznik, Weaver and Biggs2009) margins. Other studies have examined work and retirement incentives in employer-sponsored pensions (e.g., Kotlikoff and Wise Reference Kotlikoff, Wise and Wise1985, Reference Kotlikoff, Wise, Bodie, Shoven and Wise1987; Stock and Wise Reference Stock and Wise1988; Butrica et al., Reference Butrica, Johnson, Smith and Steuerle2006), retiree health insurance (e.g., Gruber and Madrian Reference Gruber and Madrian1995; Blau and Gilleskie Reference Blau and Gilleskie2001; French and Jones Reference French and Jones2011; Kapur and Rogowski Reference Kapur and Rogowski2011; Marton and Woodbury Reference Marton and Woodbury2012; Nyce et al., Reference Nyce, Schieber, Shoven, Slavov and Wised2013), and Medicare (Glied and Stabile, Reference Glied and Stabile2001; Goda et al., Reference Goda, Shoven and Slavov2007). The main conclusion from this literature is that older workers can face strong work disincentives from the pattern of benefit accrual in the Social Security retirement programs and private pensions, from the availability of group health coverage that is independent of employment (such as retiree health insurance or Medicare), and from the Medicare as secondary payer policy that effectively forces Medicare-eligible individuals who work for an employer that offers health insurance to give up their Medicare coverage. The studies of extensive margin incentives in the Social Security retirement program have shown that the implicit tax from working an additional year generally increases with age because benefit accrual declines after 35 years of work, after which additional years of earnings are unlikely to have a big effect on future retirement benefits.
Our work here is probably most directly related to Cushing (Reference Cushing2005), who describes the work incentives on the intensive margin for both disability and retirement benefits. Cushing finds that the disability program creates strong intensive margin work disincentives for older workers because additional earnings have only a small impact on expected future benefits. This occurs because disability benefits are based on workers’ average wages until the year of disability (so earnings later in life have a smaller impact on the average), and the fact that older workers who qualify for disability receive benefits for a shorter period. Eligibility is not a factor since the decision to earn an additional dollar does not affect eligibility for workers who are already above the minimum required to earn credits. We extend this work by calculating extensive margin work incentives, which are most relevant to the decision to retire versus continue working. We show that extensive margin work incentives can be quite different from intensive margin ones, and that these incentives result mainly from eligibility rules.
The remainder of this paper proceeds as follows. Section 2 describes the relevant aspects of the SSDI program, including eligibility for benefits and the calculation of benefits. We also describe the data sources that we use to construct stylized earnings profiles, disability, and mortality hazards. Section 3 describes how we calculate the present discounted value of additional benefits earned from an additional year of work. Section 4 presents results for average earners and high and low earners, and Section 5 discusses policies that could change the incentives faced by workers. Section 6 provides our conclusions.
2 Background and data
2.1 SSDI financing and benefit calculations
The SSDI program is financed by a payroll tax levied on employees and employers equal to 0.90% of earnings each, for a total of 1.8% of earnings. Economists generally believe that the incidence of both the employee and the employer portions of the payroll tax falls on workers; that is, after-tax earnings would be 1.8% higher without the SSDI program. All earnings below a taxable maximum, which is $118,500 in 2015 and 2016, and increases each year with the average wage index (AWI), are subject to the SSDI tax. Earnings above the taxable maximum are not subject to Social Security taxes and do not contribute to calculated benefits.
Disability benefits are paid by Social Security to people who ‘cannot work because they have a medical condition that is expected to last at least 1 year or result in death’ (Social Security Administration, 2015). The application process is lengthy and involves several steps to classify individuals as disabled and unable to work. In this paper, we do not focus on the criteria for determining disability, but rather on how earnings before disability onset affect eligibility for SSDI and the benefits received under the program.Footnote 3
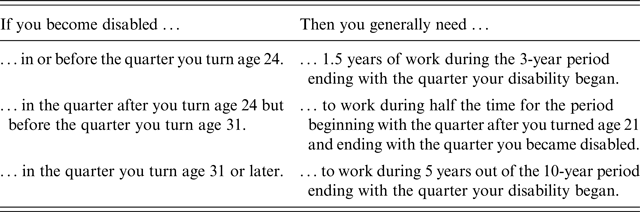
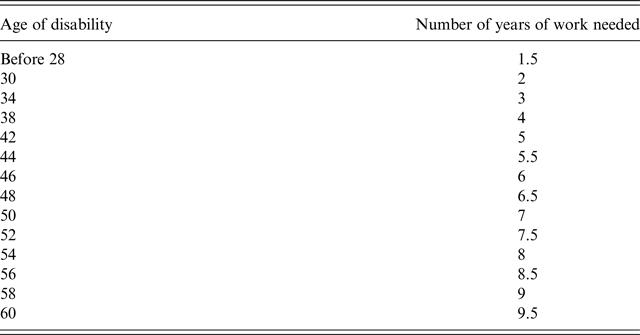
Qualifying for disability benefits requires individuals to meet an insured-status requirement that ensures they have worked long enough and recently enough. An individual receives a Social Security credit for one-quarter of work by earning a minimum amount of income. The minimum amount of income was $1,220 in 2015 (the year in which our stylized workers are assumed to enter the labor force) and increases each year with average wages. Up to four credits can be earned each year. Insured status is met by passing a ‘recent work’ test and a ‘duration of work’ test. The requirements for passing the recent work test and the duration of work test depend on the age at which a person becomes disabled and are summarized in Tables 1 and 2. While the qualification rules for eligibility before age 31 are somewhat different, an individual who becomes disabled at age 31 or older must have worked during 5 of the previous 10 years in order to pass the recent work test. This rule essentially implies that someone who has worked for several years before exiting the labor market will continue to have eligibility for another 5 years. This requirement is the main driver of work incentives on the extensive margin, as each additional year worked extends eligibility by 1 year.
Recent work test

Source: Social Security Administration, Disability Benefits (Washington, DC: Social Security Administration, 2015), http://www.ssa.gov/pubs/EN-05-10029.pdf.
Duration of work test

Source: Social Security Administration, Disability Benefits (Washington, DC: Social Security Administration, 2015), http://www.ssa.gov/pubs/EN-05-10029.pdf.
Note: The table does not cover all situations.
Work incentives are also affected by how benefits are calculated if one is deemed to be disabled. The computation of disability benefits is somewhat similar to the computation of retirement benefits under Social Security, but differs in some important ways. SSDI benefits are calculated based on the worker's average indexed monthly earnings (AIME). The AIME is calculated in a series of steps. First, annual covered earnings are indexed either to the second calendar year before the year of disability or to the year in which the individual turns age 60, whichever is earlier. The indexing is performed using the AWI, which reflects economy-wide average wage growth and is updated each year by the Social Security Administration (SSA). Our simulations assume that the AWI increases by 3.83% per year, in line with the intermediate assumption of the 2014 Social Security Trustees Report (SSA Board of Trustees 2014) regarding the long-run growth rate of covered wages. Earnings in years after the indexing year are counted at their nominal value. Second, the number of computation years is determined. The number of years of earnings used to calculate the AIME is the number of full calendar years elapsed between age 21 and the year of disability, less the number of dropout years. One dropout year is allowed for every 5 years elapsed, up to a maximum of 5 dropout years.Footnote 4 The number of computation years must be at least 2 and at most 35. Finally, the highest years’ indexed earnings are summed and divided by the number of months in the computation period. For example, consider someone who began working upon turning age 18 and became disabled upon turning age 39. The number of full calendar years between ages 21 and 39 is 17.Footnote 5 One dropout year is allowed for each of the three full 5-year periods in 17 years. Therefore, the person's 14 highest indexed years of earnings would be averaged to calculate the AIME.
The AIME is then translated to a monthly benefit amount, known as the primary insurance amount (PIA). This translation occurs through a non-linear formula that provides a proportionally higher PIA for individuals with lower AIMEs. For workers who become disabled in 2015 (the year in which our stylized workers start their careers), the PIA equals the sum of 90% of the first $826 of AIME, 32% of the next $4,154 of AIME, and 15% of AIME over $4,980. These dollar thresholds – or ‘bend points’ – used to calculate PIA change each year with the AWI. The PIA calculation uses the bend points that are in place during the year of disability or the year in which the individual turns 62, whichever is sooner. Cost of living adjustments (COLAs) are applied to the PIA each year after it is calculated. Our simulations assume that future COLAs are 2.7% per year, in line with the long-run inflation assumption made in the intermediate scenario of the 2014 Trustees report (SSA Board of Trustees 2014).
Disabled beneficiaries are paid the PIA initially in the sixth month after disability occurs and until either recovery or attainment of normal retirement age, whichever comes first.Footnote 6 Once a beneficiary attains normal retirement age, disability benefits are converted to retired worker benefits. However, the period of disability affects the calculation of retired worker benefits as years of disability are disregarded in the retirement PIA calculation. Thus, the level of benefits does not change at normal retirement age, and the presence of SSDI boosts retirement benefits relative to what could have been received by a worker with an identical earnings history who is ineligible for disability.
2.2 Stylized earnings
We perform our analysis on stylized earnings histories to plainly illustrate the effect of program rules on work incentives. Our stylized-earnings histories are based on a methodology developed by the SSA Office of the Chief Actuary, which produces hypothetical earnings histories to illustrate a variety of different features of the Social Security program, including benefit levels, replacement rates, money's worth measures, and internal rates of return (Clingman and Burkhalter, Reference Clingman and Burkhalter2014). Please note that, while stylized earnings isolate the effect of program rules, they do not reflect years spent out of the labor force or fluctuations in earnings levels over one's career.
The Office of the Chief Actuary develops a set of scaled factors, on which their stylized earnings histories are based, through a series of steps. Using earnings from the Continuous Work History Sample, raw scaled factors are calculated by taking the ratio of average earnings at each age relative to the economy-wide AWI in each particular year. This type of calculation is superior to one that assumes workers earn a constant percentage of the AWI each year throughout their careers, as that method tends to ignore the life-cycle patterns of earnings that are typically low for younger and older ages and higher during prime working ages. An adjustment is applied to the raw factors for ages 62 and older to account for the fact that workers who tend to work beyond age 62 in the data may be selected from a non-representative sample. The factors are also multiplied by the percentage of individuals at each age who are working to make them representative of all individuals, working or non-working.
We generate stylized earnings histories by starting with these scaled factors and modifying them as follows. First, we adjust the factors to be representative of someone who works in each year of life and therefore divide by the percentage of individuals with earnings at each age. Second, we are interested in simulating earnings for a wider set of ages (18–66) than is provided by the SSA (21–64), so we make some assumptions to extend the series. In particular, we assume that workers earn the same percentage of the AWI at ages 18–20 as they earn at age 21 and that the same fraction of individuals work at ages 18–20 as at age 21. We assume that 65- and 66-year-olds earn the same nominal earnings as someone age 61 (an assumption similar to what SSA uses for earnings after age 61). We also assume that the same percentage of individuals works at ages 65 and 66 as at age 64. While these assumptions are not completely plausible, our results are insensitive to reasonable changes in the stylized earnings levels for these years. Finally, we convert the earnings histories to the 1997 cohort (which turns 18 in 2015) using a projected AWI increase of 3.83% per year.
2.3 Disability and mortality hazards
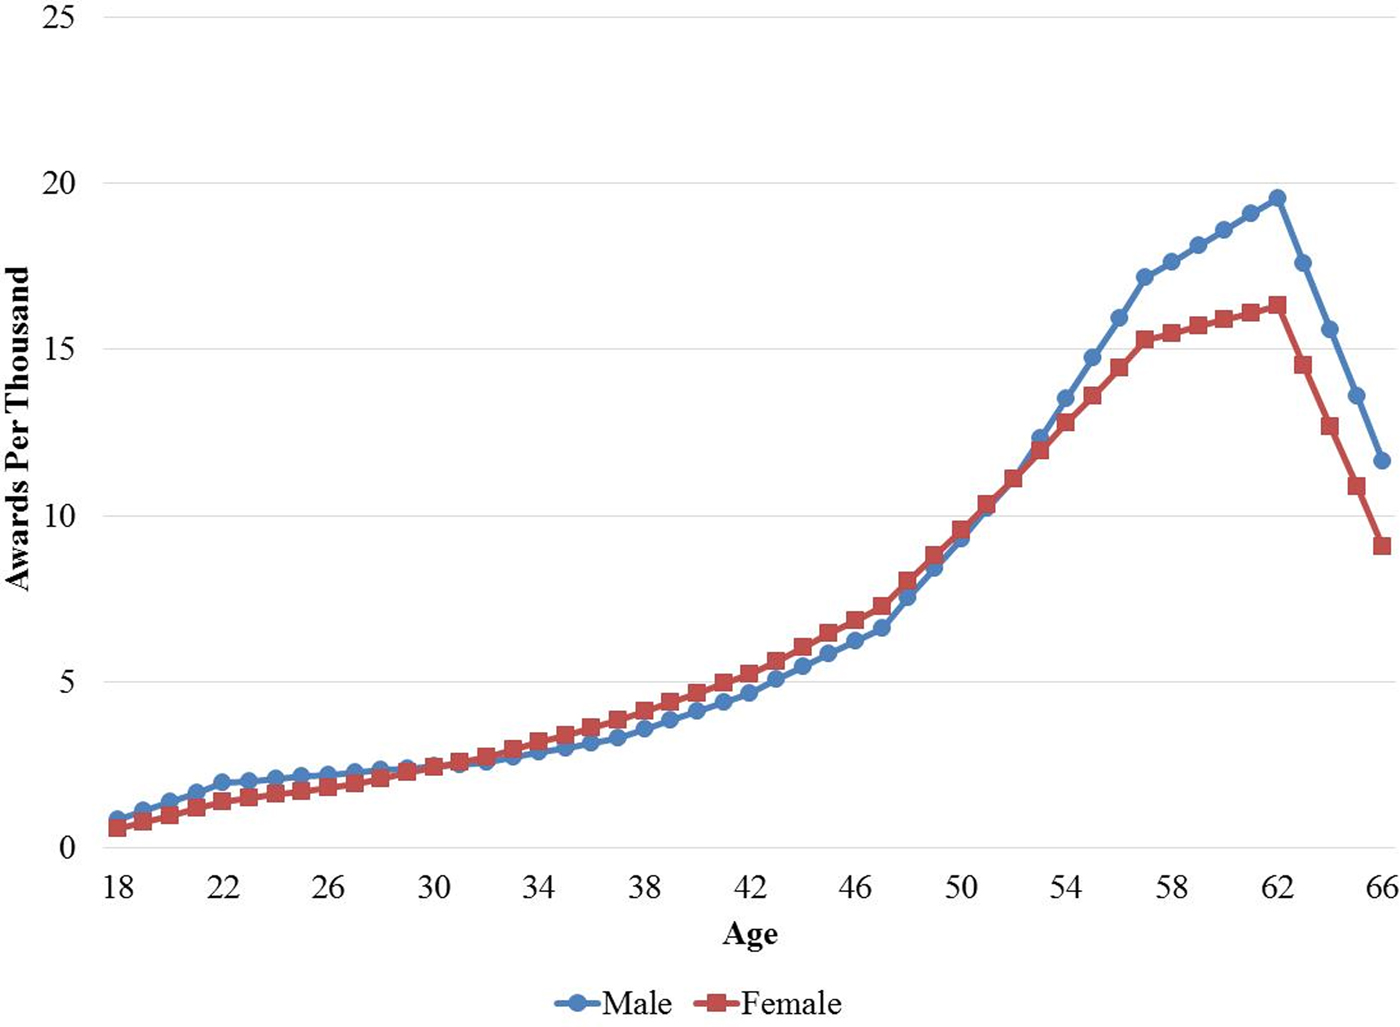
We use disability incidence rates and mortality hazards to determine the expected present value of changes in SSDI resulting from additional earnings or career length. Disability incidence rates are drawn from Table 4 of Zayatz (Reference Zayatz2011), which reports awards per thousand by age, year of award, and gender for years between 1986 and 2009. We use the incidence rates for 2009 in our simulations. These incidence rates are reported in 5-year age intervals, from ages 15–19 through ages 60–64. There is also an incidence rate reported for age 65+. The 5-year age buckets create artificial discontinuities from one interval to the next. Therefore, we smooth the incidence rates by assuming the values shown apply to the midpoint of each 5-year interval (e.g., the incidence rate for the age 20–24 age bucket applies to age 22) and by linearly interpolating from one point to the next. The incidence rate for age 65+ is assumed to apply at age 67, the last year in our model. This allows us to interpolate between age 62 (based on the 60–64 incidence rate) and age 67. The resulting incidence rates for 2009, which we use in our simulations, are shown in Figure 1. Disability incidence rates increase with age until age 62 but then decline. The decline after age 62 likely reflects the fact that many disabled individuals simply stop working and claim retirement benefits.
(Colour online) Disability incidence rates, 2009.

Mortality hazards for disabled individuals differ by age and by the length of time one is disabled. Zayatz (Reference Zayatz2011), in Tables 8A–8C, reports survival tables for male and female disabled workers based on data during 2001–2005. These appear to be based on period, rather than cohort, mortality, but to our knowledge, this is the best available data on mortality for disabled individuals. We use these survival probabilities to discount any income received during years of disability to the year in which the individual became disabled. Survival probabilities for non-disabled individuals are based on 1997 birth cohort mortality tables from the intermediate scenario of the 2013 Social Security Trustees Report (SSA Board of Trustees 2013). We combine the disabled and non-disabled survival probabilities to discount the expected value of any potential future disability awards. For example, consider the risk that a 50-year-old faces of becoming disabled at age 55. In calculating the expected present value of the disability award that would be received in this scenario, the disabled survivor probabilities are used to discount income received after age 55 to the year in which the individual is age 55. The non-disabled survivor probabilities are used to further discount this amount to the year in which the individual is age 50. The disabled survival probabilities vary greatly from the non-disabled survival probabilities. For example, the Zayetz table indicates that of 96,912 men who become disabled at age 33,79,551 survive to age 43, a survival rate of 82.1%. In contrast, the SSA cohort mortality table suggests that 98.5% of 33-year-old men survive to age 43.
2.4 Differences by earnings
We are interested in examining how work incentives vary for workers with different levels of earnings, which are also likely to be associated with different levels of disability incidence rates.
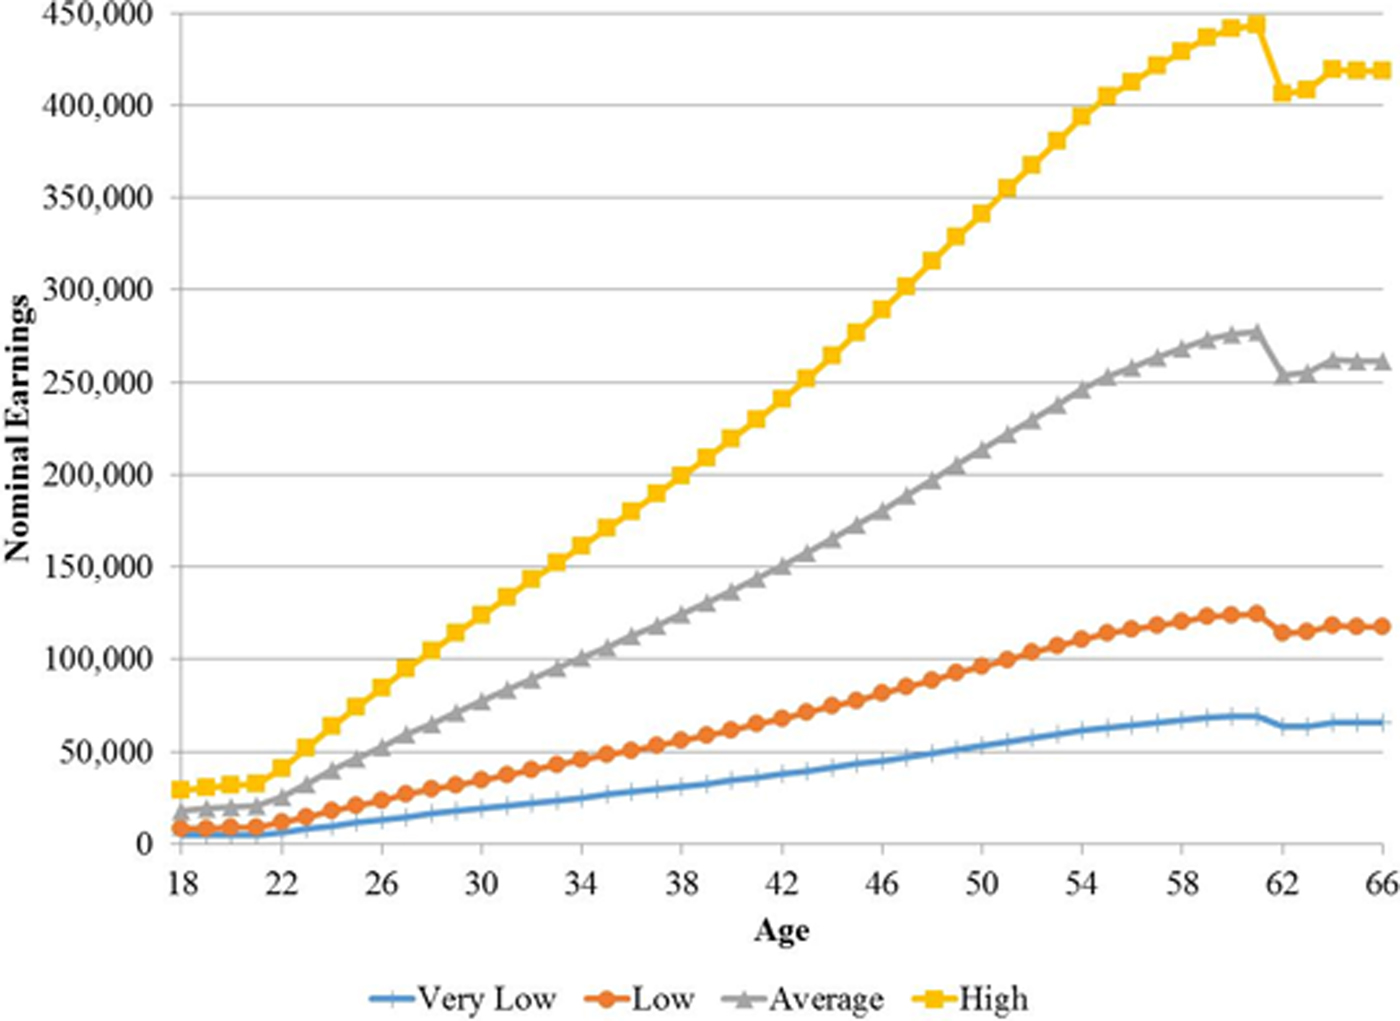
The Office of the Chief Actuary reports scaled factors that represent workers with career-average earnings levels equal to 25%, 45%, 100%, and 160% of the AWI. These factors simply shift the age-earnings profile up or down by a proportionate amount at each age. We refer to workers with career earnings equal to the AWI as ‘average’ workers. Workers with career earnings equal to 25%, 45%, and 160% of the AWI are referred to as ‘very low’, ‘low’, and ‘high’ earners, respectively. The stylized earnings profiles for each of the four earner types are shown in Figure 2.Footnote 7
(Colour online) Stylized earnings profiles.

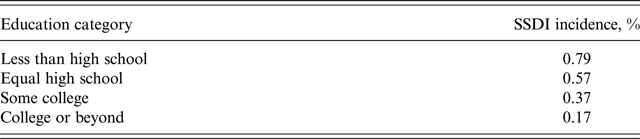
We combine these earnings profiles with information from von Wachter (Reference von Wachter2012) about disability incidence by education, reproduced in Table 3. Von Wachter uses Current Population Survey data to report how incidence rates differ by education. We assume that the differences in incidence rates by education roughly correspond to differences in incidence rates by earnings levels as follows: the worker with career earnings equal to 25% of the AWI has disability incidence rates similar to those among individuals with less than a high school education, the worker with career earnings equal to 45% of the AWI has disability incidence rates similar to those among individuals with a high school education, the worker with career earnings equal to the AWI has disability incidence rates similar to those among individuals who have completed some college, and the worker with career earnings equal to 160% of the AWI has incidence rates similar to those among individuals with a college education or more. We use ratios from Table 3 to generate incidence rates by earnings that imply the same proportional differences in incidence by education that are reported by von Wachter (Reference von Wachter2012), assuming that individuals with some college reflect the incidence rates for average earners.Footnote 8 For instance, to generate incidence rates for very low earners, whom we assume to have disability hazards similar to those with less than a high school education, we multiply the incidence rates in Figure 1 by (0.79/0.37).
Disability incidence rates by educational attainment

Source: Reproduced from von Wachter (Reference von Wachter2012), using first definition of SSDI receipt, which counts a person as receiving SSDI if the reason for receiving Social Security benefits is disability and the person is under age 64.
3 Methodology
3.1 Calculating the expected value of SSDI
We assume that each stylized earner was born on January 2, 1997,Footnote 9 that decisions about labor force participation and earnings for each year are made at the beginning of the year, and that disability may occur on any subsequent birthday. Individuals in the 1997 birth cohort turn 18 in 2015 and have a normal retirement age of 67. We assume that work begins at age 18 and ends upon either disability or reaching age 67, whichever is sooner. We also assume that, once disabled, an individual remains disabled for the remainder of life; that is, we ignore the possibility of recovery.Footnote 10 We focus on work incentives at ages 50 and older, as the extensive margin work decision we consider – extending work by an additional year versus retiring now – is not likely to be relevant for younger workers.
Mathematically, the expected present value of SSDI benefits in the event of disability starting at age a, and discounted to the year in which the individual turns a, is given by the following:
 $$B_a(E_{a - 1}) = \mathop \sum \limits_{t = a}^T \displaystyle{{s_t^{d,a} b_t(E_{a - 1})} \over {{\left[ {(1 + r)\,(1 + \pi )} \right]}^{t - a}}} - \mathop \sum \limits_{t = \max (62,a)}^T \displaystyle{{s_t^{d,a} b_t^R (E_{a - 1})} \over {{\left[ {(1 + r)\,(1 + \pi )} \right]}^{t - a}}}.$$
Here E a−1 = (e 18, e 19, …, e a−1) is the vector of earnings from age 18 through age a − 1;  $s_t^{d,a} $ is the probability of a disabled person surviving to age t conditional on having survived to age a (so, in the first term,
 $s_a^{d,a} = 1$); r is the real interest rate; π is the inflation rate; and t is the maximum possible lifespan (assumed to be 110 years). In the first term, b t is the SSDI or converted retirement benefit received at age t; the SSDI benefit received in the first year is assumed to begin in June because of the 5-month waiting period, and COLAs are applied to benefits in subsequent years. Note that the first term includes payments made at or after normal retirement age, which are technically classified as retirement benefits. While these benefits are generally higher than the retirement benefits that would be available to someone who is not eligible for disability, the value of maintaining eligibility for disability insurance is only the net gain in benefits relative to what would already be available through the retirement program. The second term accounts for this. In this term,
 $b_t^R $ denotes the retirement benefit that could be received at age t by an ineligible individual with the same earnings history (i.e., with an earnings history in which work stops at the age of disability). The retirement benefit is assumed to be claimed at either age 62 or the age at which earnings stop, whichever is later.Footnote 11, Footnote 12 The appropriate actuarial reduction is applied for claims made before normal retirement age, and COLAs are applied to retirement benefits paid after age 62. In this formula, the real interest rate is set to 2.9%, in line with the long-run intermediate assumption made in the 2014 Trustees report (SSA Board of Trustees, 2014). The inflation rate is set to 2.7%, the same value used for the COLAs.
Now consider an individual currently age i who faces a risk of disability onset at any future age a = i + 1, i + 2, …, 66. The expected present discounted value of disability coverage for this individual is
 $$EV_i(E) = \mathop \sum \limits_{a = i + 1}^{66} \displaystyle{{I_ap_as_a^{n,i} B_a(E_{a - 1})} \over {{\left[ {(1 + r)\,(1 + \pi )} \right]}^{a - i}}}.$$
Here, E = (e 18, e 19, …, e 66) is the full earnings history from age 18 to age 66 assuming that no disability occurs, I a is an indicator equal to 1 if the individual is eligible for SSDI at age a and 0 otherwise,  $s_a^{n,i} $ is the probability that a non-disabled person survives to age a conditional on survival to age i, and p a is the probability of becoming disabled at age a. In other words, the overall expected value of SSDI is the discounted sum of the expected value of SSDI across all possible future ages of disability onset.
For example, consider a male average earner (i.e., someone with career-average earnings equal to the AWI) who begins work at age 18. Suppose this individual becomes disabled at age 64 (in January 2061). Earnings are indexed to their 2057 level (the year of turning 60). AIME is $23,834.78 and PIA is $10,131.01.Footnote 13 This PIA calculation assumes that the 2015 bend points of $826 and $4,980 are increased by 3.83% per year, reflecting growth in the AWI. The individual receives his or her PIA during each of the last 7 months of 2061 (reflecting the 5-month delay period). In subsequent years, the individual receives the PIA each month, with the addition of a 2.7% COLA for each year after 2061. If the worker was not eligible for disability, he could claim a retirement benefit of $8,548.38 per month starting immediately, with COLAs added in subsequent years.Footnote 14 SSDI provides income only to the extent that it boosts that amount.Footnote 15 Discounting the stream of income from SSDI, net of what would be available anyway from the retirement program, produces a sum of $168,194.95. The large difference is because an individual who claims disability at age 64 does not face an actuarial reduction in benefits for claiming 3 years before full retirement age, while the person who claims retirement benefits at age 64 does.Footnote 16 This value is B 64(E 63) from Equation (1), the expected present value of SSDI if disability occurs at age 63. A similar calculation can be performed for every potential age of disability onset from 50 through 66. From the perspective of any age i, taking the expectation of B a(E a−1) across all future ages (a > i) produces EV i(E) from Equation (2).
To calculate the extensive margin work incentive at each age i, we assume that individuals have worked until age i − 1 and received earnings according to the profiles in Figure 2. Then, we examine the effect of working for an additional year compared with stopping work forever. That is, we calculate
 $$Extensive\,\,margin_i = \displaystyle{{EV_i(e_{18}, \ldots, \,e_i,\,0, \ldots, 0) - EV_i(e_{18}, \ldots, \,e_{i - 1},\,0, \ldots, 0)} \over {e_i}}.$$
We consider two alternative assumptions about e i, the earnings in the additional year of work. First, we assume that the individual earns the minimum amount required to earn four-quarters worth of Social Security credits for the year. This minimum amount is $4,880 (i.e., $1,220 × 4) in 2015, and we assume it increases by 3.83% per year, in line with expected increases in the AWI, in each subsequent year.Footnote 17 In other words, the individual earns just enough to extend eligibility under the recent work test. This calculation captures the effect of working at the minimum income versus not working, and we refer to it as the minimum earnings extensive margin. Second, we assume the individual earns the amount specified in the stylized earnings profile. This calculation captures the effect of working a full year versus not working, and we refer to it as the full earnings extensive margin.Footnote 18
An additional year of work can have two effects on expected disability benefits: it can extend eligibility, and it can raise benefits received during years of existing eligibility. For example, consider a male average earner who has just turned 55 in January 2052 and has worked since age 18. This individual clearly meets the duration of work test shown in Table 2. Under the recent work test shown in Table 1, if this individual stops work now, eligibility for SSDI would continue for another 5 years, to age 60. On the other hand, if the individual continues working for an additional year and earns at least the minimum income required to earn credits, eligibility is extended for an additional year, to age 61. If the individual earns the minimum needed to continue eligibility, then the disability benefit that could be received at ages 56 through 60 remains the same as the additional year of earnings is small and therefore gets dropped from AIME calculation. But if the additional year of work represents a full year of earnings – that is, at the earnings specified in the earnings profile from Figure 2 – then the additional year of work also boosts SSDI benefits conditional on disability at ages 56 through 60 as well. Both of these effects are included in our calculations of the extensive margin.
For illustration, we also calculate the intensive margin work incentive for our stylized workers under the assumption that they work a full career, with the earnings profiles given in Figure 2. We examine the effect of increasing earnings by $1 at each age on the expected present value of SSDI benefits at that age. That is, for each age i, we calculate
 $$\eqalign{Intensive\,\,margin_i = & EV_i(e_{18},\, \ldots e_{i - 1},\,e_i + 1,\,e_{i + 1}, \ldots, e_{66}) \cr & - EV_i(e_{18}, \ldots e_{i - 1},\,e_i,\,e_{i + 1}, \ldots, \,e_{66}).}$$
We calculate intensive margin incentives for workers at all ages since the choice to earn an additional dollar is also applicable to younger people.
For example, consider a male average earner (with career-average earnings equal to the AWI) who began work at 18, has just turned 24, and is considering earning an extra dollar during the coming year. This additional dollar changes the present value of SSDI benefits in subsequent years. For example, the value of future SSDI benefits conditional on disability onset at age 25 goes up by $2.17; this is the increase in B 25(E 24) from Equation (1). In fact, the expected value of SSDI – B a(E a−1) from Equation (1) – increases at all ages of disability onset until age 37. For disability onset at age 37 or later, earnings at age 24 get dropped and no longer increase SSDI payments – the first term in Equation (1). However, age 24 earnings do increase the retirement benefits that would be available anyway – the second term in Equation (1) – until age 59, as retirement benefits for non-disabled individuals are calculated based on the highest 35 years of earnings. Thus, an additional dollar of earnings reduces the net value of SSDI for onset between 37 and 59 and has no effect on the net value of SSDI for onset after age 59. Discounting and summing these changes in B a(E a−1) over all future possible dates of disability onset produces an increase of 1.97 cents (1.97% of the additional dollar earned) in the overall present discounted value of SSDI benefits. To examine the intensive margin work effort, we compare this value with the 1.8% SSDI payroll tax that would be paid on the extra dollar earned.
4 Results
4.1 Extensive margin work incentives
Figures 4 and 5 show the minimum earnings and full earnings extensive margin effects, respectively, for men and women by comparing the increase in the expected value of SSDI from working an additional year with the 1.8% SSDI payroll tax rate. For both extensive margins, each additional year of work extends eligibility by exactly 1 year (through age 62, at which point eligibility is guaranteed until retirement). The value of that additional year of eligibility varies as a result of two factors. First, the hazard of disability generally increases with age (at least until the early 60s), a factor that tends to increase the value of the additional year of eligibility. Second, the benefits awarded later in life are paid over a shorter period, a factor that tends to reduce the value of any benefits commenced during the extra year of eligibility. From age 50 onwards, the latter factor is larger, resulting in a declining benefit from an additional year of work.Footnote 19
On the minimum earnings extensive margin (Figure 3), the benefit from an additional year of work is substantial for both men and women. At age 50, the return from working an additional year, net of the 1.8% payroll tax, is more than 35%. The value of an additional year of work drops below the 1.8% SSDI tax rate at age 61 for both men and women. It becomes zero at age 62 and later as the additional year of work at such a low level of income neither extends eligibility nor increases benefits in the event of disability. On the full earnings extensive margin (Figure 4), the benefit from an additional year of work is much more modest, starting at <1.5% of earnings (net of the 1.8% payroll tax) at age 50. The value of an additional year of work drops below 1.8% at age 57. It reaches close to (but not exactly) zero at age 62, as additional years of work at full earnings do not extend eligibility but do modestly increase benefits in the event of disability.
(Colour online) Minimum earnings extensive margin work incentives by gender (average earners).

(Colour online) Full earnings extensive margin work incentives by gender (average earners).

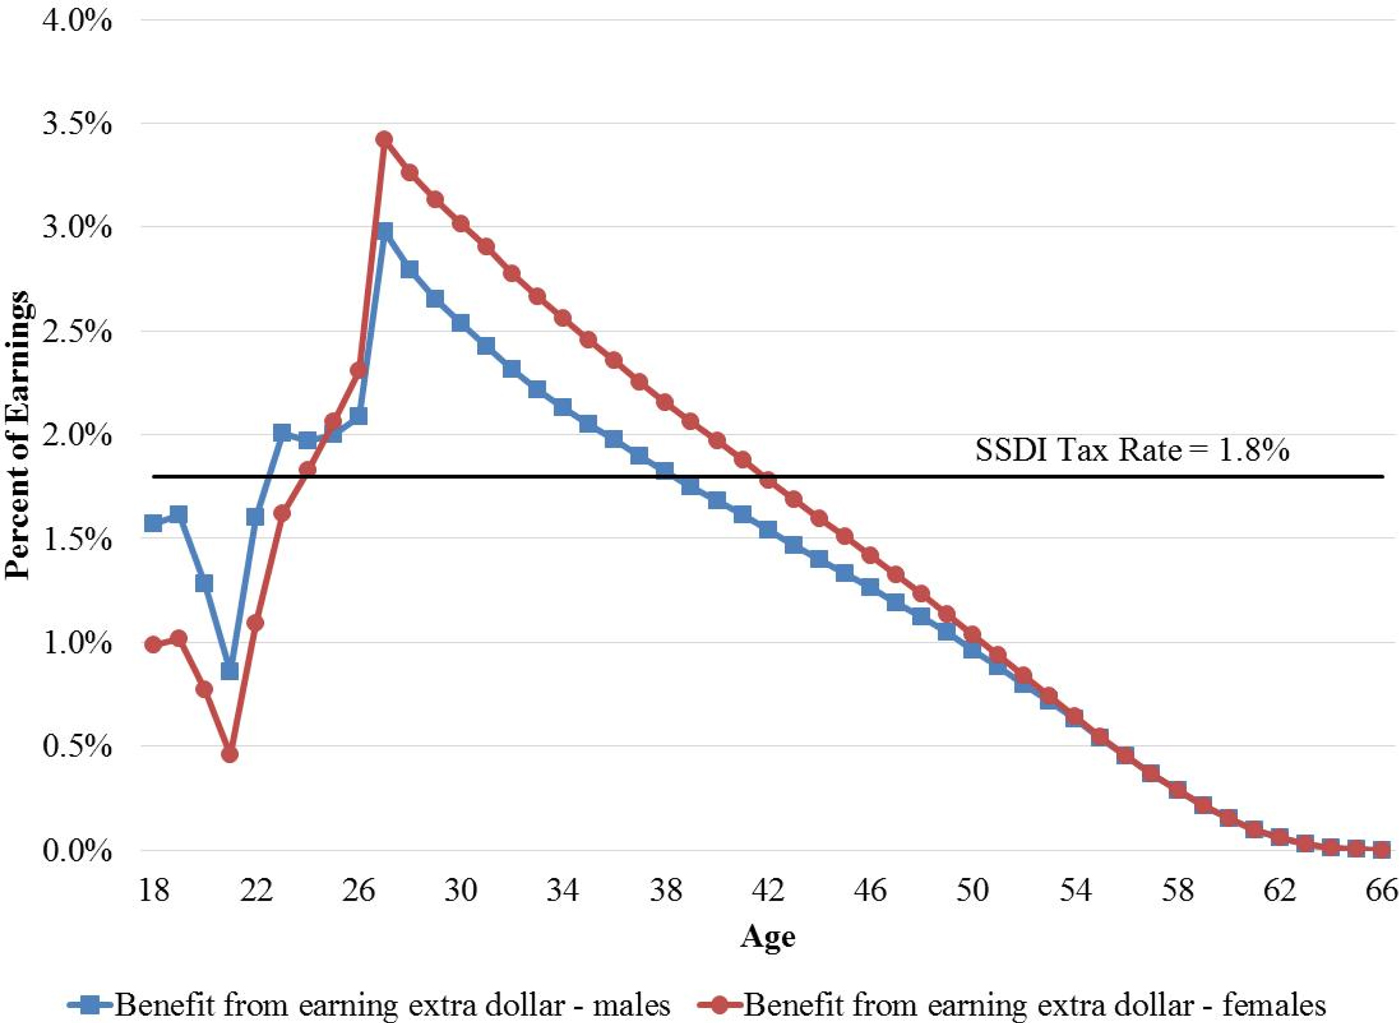
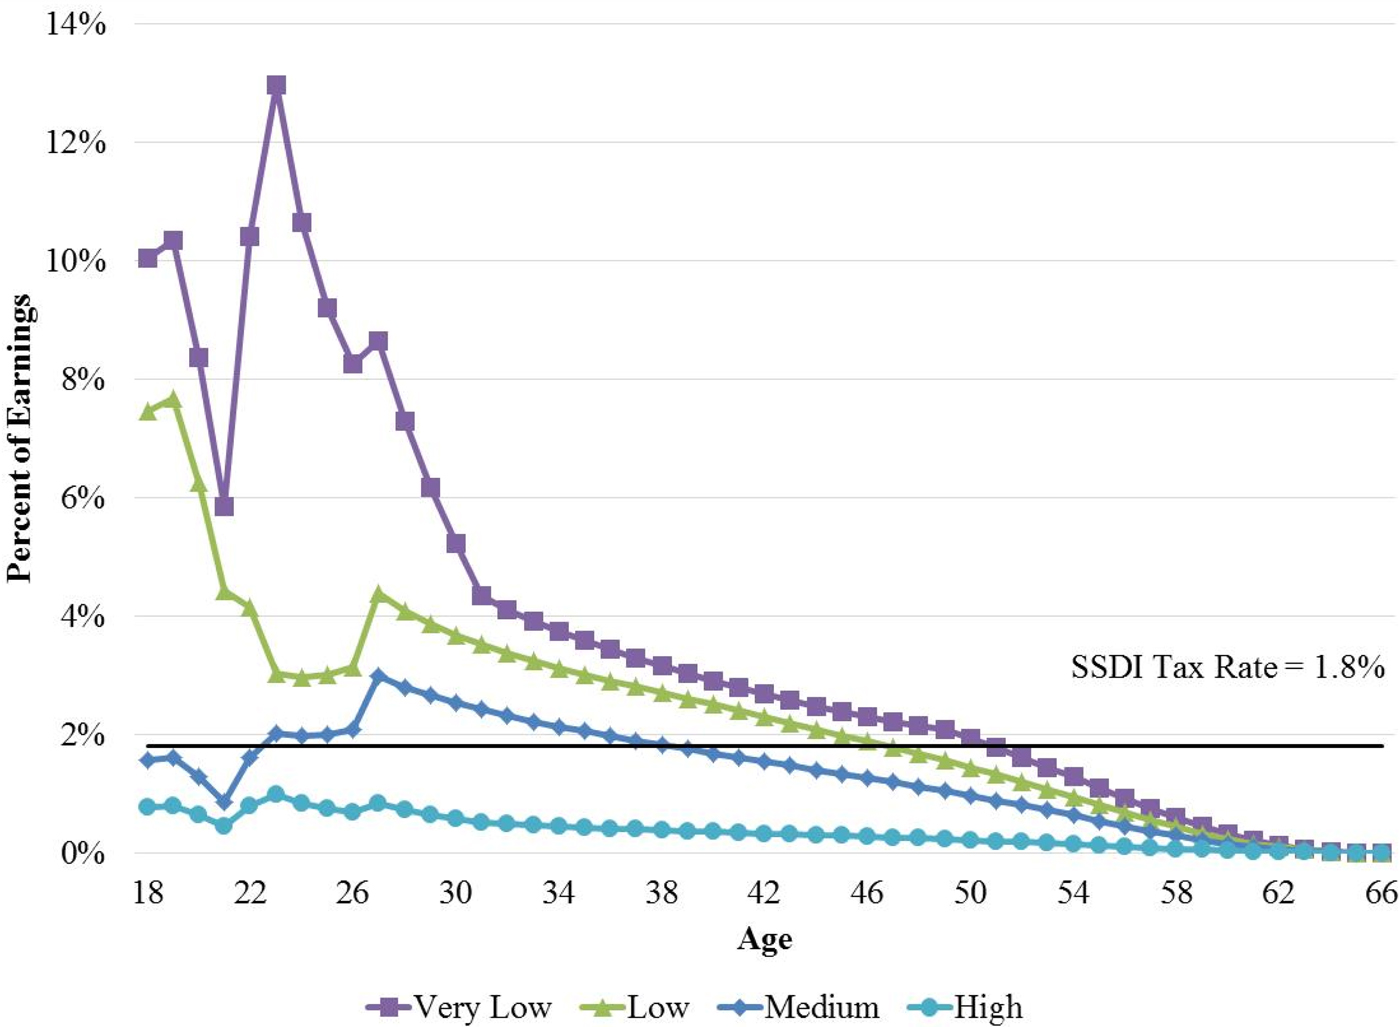
These results suggest that there is a strong incentive to work enough to maintain eligibility for SSDI through age 62; however, there is not much incentive to earn additional income beyond that threshold. This disincentive to earn additional income is a reflection of the intensive margin, which we also calculate for illustration. Figure 5 shows the increase in the value of SSDI benefits from earning an additional dollar for men and women with average earnings. Comparing these increases with the 1.8% SSDI tax rate (the solid horizontal line) reveals the intensive margin work incentive. For both men and women, the benefit from earning an extra dollar is relatively low early in life. This level is low because these low-earning years stop affecting SSDI benefits once they are replaced by higher earning years in the AIME calculation. Indexed earnings are lowest at age 21; therefore, this year of earnings is the first to be dropped, resulting in a very small increase in SSDI benefits. The benefit from earning an extra dollar peaks at age 27, after which it declines gradually, reaching (almost) zero at age 63. This pattern arises because (a) the increase in SSDI benefits applies to disability that occurs in any future year before normal retirement age and (b) SSDI benefits after the normal retirement age are limited. As normal retirement age approaches, there are fewer future years in which disability could occur. In addition, benefits received at younger ages are paid over a longer period. Starting at age 66, there are no future years in which disability could occur, and therefore the benefit from earning an additional dollar at this age is exactly zero.
(Colour online) Intensive margin work incentives by gender (average earners).

The increase in the value of SSDI from earning an additional dollar exceeds the 1.8% tax paid until age 38 for men and age 41 for women. At this point, the return from earning an additional dollar relative to the tax paid becomes negative. Once workers reach their early 60s, they face a net tax rate that is very close to the full 1.8% payroll tax rate. While the patterns for men and women are similar, there are some gender differences that arise from differences in disability incidence and mortality. In particular, as shown in Figure 1, disability incidence rates tend to be similar for men and women until the mid-50s, at which point the incidence rate rises for men relative to women. Both healthy and disabled women also tend to have lower mortality.
These results are similar to the intensive margin calculations that Cushing (Reference Cushing2005) reports. Cushing's results suggest that workers initially receive a positive net return on their SSDI taxes. However, this return declines steadily, becoming negative around age 35. Workers in their early 60s face net tax rates that are close to the full 1.8%.
Overall, extensive margin work incentives remain positive late in life despite negative intensive margin work incentives. However, in the early 60s, both intensive and extensive margin work incentives are negative, and workers face close to the full 1.8% SSDI tax. The extensive margin benefit is close to zero starting at age 62, as additional years of work do not extend eligibility at all. All 62-year-olds who have worked for the past 5 years have already met the recent work test through age 67, at which point they receive only retirement benefits that would have been available anyway. If earnings are high enough, additional years of work at age 62 or later can boost AIME, and therefore, the benefit that would be paid upon disability. However, this effect is very small. Thus, the structure of SSDI provides a strong incentive for older workers to continue working part time at least through age 60, but a disincentive to earn a full level of earnings beyond age 55 or to earn additional income after around age 40. There is also a disincentive to both participate in the labor force and earn additional income beyond age 60.
We note that our analysis abstracts from several important features of SSDI. First, individuals who qualify for SSDI become eligible for Medicare after receiving SSDI for 2 years. Second, individuals who do not qualify for SSDI (or who qualify for a very low SSDI benefit) may qualify for Supplemental Security Income (SSI) as well as Medicaid. Finally, SSDI provides insurance and liquidity value to risk-averse and credit-constrained individuals that goes beyond an expected present value calculation. However, we argue that considering these features would not change our qualitative results. On the extensive margin, Medicare eligibility substantially increases the expected lifetime benefit from SSDI and therefore the payoff from extending SSDI eligibility by a year by working longer. The insurance value of SSDI has the same effect. The possibility of receiving SSI and Medicaid in the absence of SSDI eligibility reduces the net expected lifetime benefit from SSDI and therefore lowers the payoff from extending eligibility. However, the general pattern – that the value of extending SSDI eligibility by an additional year declines as individuals age (because they collect disability payments over a shorter time horizon), and becomes zero at age 62 (because individuals no longer gain from extending eligibility) – does not change. On the intensive margin, Medicare eligibility does not change the work incentives. Earning an additional dollar increases the cash disability payment an individual receives but not the value of Medicare. SSI and the associated Medicaid eligibility may affect the intensive margin for individuals earning low levels of income as earning additional income may not increase the total payment they receive in the event of disability. But higher income individuals who are not close to qualifying for SSI can still increase the value of their disability benefit by working additional hours. The insurance value of SSDI increases the payoff from earning an additional dollar but is unlikely to change the age profile of this payoff.
4.2 Differences by earnings
Figures 6–8 show the minimum earnings extensive margin, full earnings extensive margin, and intensive margin effects, respectively, for male workers with different levels of earnings. While the pattern of work incentives over the life cycle is similar, Figures 7 and 8 show that SSDI clearly transfers income from high to low earners. This transfer results from the progressivity of the benefit formula and from the fact that the risk of disability is assumed to decline with earnings. High earners face work disincentives (i.e., benefit accrual rates that are <1.8%) on both the intensive and full earnings extensive margins throughout their careers. Workers with very low earnings face positive work incentives on the intensive margin until age 50 and on the full earnings extensive margin until age 59. Figure 6 shows that workers at all levels of earnings face positive work incentives on the minimum earnings extensive margin throughout most of their careers. Thus, older workers at any earnings level face positive incentives to earn a minimum level of earnings through age 61, but they often face disincentives for earning additional income, particularly at higher earnings levels. The pattern of redistribution is less obvious from Figure 6 as the additional year of work for all levels of earnings is assumed to produce the same (minimum) level of earnings. The absolute level of benefits is greater for individuals with higher earnings but their probability of disability is lower, so there is no clear pattern in the increase in the expected value of SSDI relative to the additional income earned.
(Colour online) Minimum earnings extensive margin work incentives by earnings (males).

(Colour online) Full earnings extensive margin work incentives by earnings (males).

(Colour online) Intensive margin work incentives by earnings (males).

5 Policy implications
The patterns in the extensive and intensive margin work incentives from the SSDI program mainly stem from two features of the program. First, to be eligible to receive benefits, individuals must pass a recent work test, implying that exiting the labor force affects benefit eligibility at some point in the future. Second, disability benefits are converted to retirement benefits at the normal retirement age and terminated at death, leading to a declining period over which benefits are paid as workers advance in age. The combination of these two features leads to almost no increase in the present value of SSDI benefits as a result of working beyond age 61. Once an individual has worked to age 61, eligibility for SSDI is already guaranteed through age 66. At this point, extending eligibility has no value, as the additional years of eligibility occur after normal retirement age. Moreover, any substantial increase in benefits as a result of the extra work is paid over an extremely short period. This result is true regardless of the level of earnings assumed or gender, and it suggests that the 1.8% SSDI payroll tax is almost a pure tax on earnings, which could discourage work at older ages.
We are not aware of any empirical evidence on the effect of these incentives on labor supply. The disability benefit formula is complicated, and it is possible that individuals do not calculate or understand the labor supply incentives it creates. However, other studies have examined the perceived labor supply incentives (Liebman and Luttmer, Reference Liebman and Luttmer2014) and effect on labor supply (Liebman et al., Reference Liebman, Luttmer and Seif2009) of the Social Security retirement program, which has similarly complex rules. Liebman and Luttmer (Reference Liebman and Luttmer2014) find that people are generally aware of the link between Social Security benefits and earnings, although they are less familiar with the rules governing the earnings test, the spousal benefit, and the number of years that enter into the benefit calculation. Liebman et al. (Reference Liebman, Luttmer and Seif2009) find that, on the extensive margin, a 10% increase in the net-of-tax share (which is defined as 1 minus the effective tax rate and represents the fraction of income that is retained by the worker) reduces the probability that a worker will retire in the next 2 years by around 14%. On the intensive margin, they find that hours worked, but not earnings, respond to changes in benefit accrual. Whether the incentives in the SSDI program are perceived similarly or have a similar effect on behavior remain questions for further research.
To provide a starting point for thinking about the incentive effect of modifications to the benefit formula, we discuss one policy that might reduce work disincentives for older workers: exempt earnings from the SSDI payroll tax beyond age 60. Under this policy, workers would remain eligible for SSDI benefits if they were eligible at age 60, and any earnings beyond this age would not affect their benefit calculation. The payroll tax at younger ages could be increased slightly to keep the system revenue-neutral in the aggregate. Depending on the incidence of the payroll tax, this policy could affect either labor supply among older workers by increasing the take-home pay of those affected or labor demand by encouraging more firms to hire older workers. While the SSDI payroll tax is small relative to that dedicated to retirement benefits or Medicare, it is imposed on top of other payroll taxes, and older workers have relatively high labor supply elasticities (French, Reference French2005). Thus, exempting workers age 61 and older from SSDI payroll taxes could have an important effect.
Our results also show stark differences in the value of extending eligibility for SSDI benefits versus the value of marginal increases in these benefits from additional earnings. Generally speaking, the main benefit from the SSDI program of continued work is to insure against the risk of becoming disabled in the future rather than to transfer resources from working years into retirement (as the Social Security retirement program does). Because the hazard of becoming disabled increases with age, the benefit of continuing in the labor force increases until age 50.Footnote 20 After this point, the shrinking period over which benefits are paid reduces the return from the SSDI program of participating in the labor force. The program could be made more age neutral by adjusting the minimum required earnings amount by age. However, it is not clear from our results that the existing pattern creates distortions that concentrate earnings at ages at which the work incentives from the minimum earnings extensive margin are high.
6 Conclusions
This paper summarizes the returns to working on the extensive margin from the SSDI program. We use stylized earnings histories, disability incidence, and mortality rates from recent Social Security experience, and details of the eligibility and benefit computation rules to show how the expected increase in disability benefits received from working an additional year varies for older workers. Our results suggest that the returns to extending one's career depend on the level of earnings one is expected to receive. If an individual is considering participating in the labor force just enough to extend his or her eligibility, the return to working is substantial and as high as 35% of earnings at age 50. However, the return to earning amounts above the minimum required for eligibility are much lower. Therefore, an additional full year of earnings provides a much more modest return relative to the disability payroll tax paid. The returns to extending one's career are positive at age 50 but drop below the SSDI payroll tax rate after that. The benefit from working an additional year approaches zero at age 62, implying that the payroll tax is almost a pure tax after this point. These results, which are driven primarily by eligibility rules, are different from prior research on intensive margin work incentives. On the intensive margin, the returns to earning an additional dollar of income at a full level of earnings start above the combined SSDI payroll tax rate of 1.8% of earnings but decline gradually to almost zero as one approaches the normal retirement age.
The implication of these findings is that the returns to participating in the labor force and earning the minimum required to extend eligibility for SSDI benefits, net of the payroll tax, is positive for workers in their 50s. However, the returns become negative after age 60 for average earners and therefore provide a disincentive to remain in the labor force. Earning more than the minimum required provides much smaller returns, only affecting disability benefits paid if earnings in the year in question increase the calculated disability benefit. Starting at age 57, workers face disincentives for earning a full year of earnings.
We also explore how work incentives vary by earnings levels and find similar patterns over the life cycle, although at different levels because of redistribution in the SSDI program. In addition to the fact that disability benefits are higher as a percentage of predisability earnings for low earners, we also assume that stylized workers with lower levels of earnings experience higher rates of disability incidence. As a result, the returns to working are much higher for those with lower levels of earnings than for those with higher levels of earnings.
One limitation of our analysis is that it is based on stylized workers and therefore may not represent the different earnings patterns and career interruptions that actual workers experience. Differences in lifetime earnings patterns may affect our conclusions, and examining actual workers’ earnings histories remains an important direction for future work.
The SSDI payroll tax rate of 1.8% of earnings is low relative to that dedicated to retirement benefits, and we are not aware of any empirical evidence on how much the work incentives in the benefit formula actually change behavior. However, the SSDI payroll tax is layered on top of payroll taxes levied for the retirement program and income taxes, and other research shows that older workers are particularly responsive to work incentives. One policy option that could reduce work disincentives at older ages is a ‘paid up’ rule, under which workers over a certain age are exempt from SSDI payroll taxes.