


Introduction
Over the past 40-50 years, warming trends in near-surface air temperature over Antarctica (Reference JonesJones, 1995) have generally exceeded those observed elsewhere on Earth. However, temperature records from all Antarctic stations show considerable interannual variability which, together with the short length of most station records, makes it difficult to assess the significance of these trends. One region of Antarctica where large temperature changes do appear to have occurred is the west coast of the Antarctic Peninsula between about 65° and 70° S. Reliable climatological records are available from a number of slations in this region from the mid-1940S. These indicate a higher level of interannual variability than seen elsewhere in Antarctica, together with a warming of about 2°C in annual average temperature between 1945-54 and the most recent decade (King, 1994). The warming appears to have been responsible for driving recent rapid retreat of theWordie, Prince Gustav Channel and Larsen-A ice shelves (Reference Vaughan and DoakeVaughan and Doake, 1996).
King (1994) examined possible causes of the interannual variability in west Antarctic Peninsula temperature records and identified two mayor factors. First, atmosphere—ice-ocean interaction is seen to play an important role in controlling climate variability in the Peninsula. This is apparent from the strong negative correlation between winter temperatures in this region and winter sea-ice extent just to the west of the Peninsula, also noted by Weathcrly and others (1991). Second, variability in the adveclion of warm air masses also exerts an important control on climate. Peninsula winter temperatures are strongly correlated with the meridional component of the atmospheric flow, with an anomalously northerly circulation associated with warm winters and vice versa.
While both of these factors are important in controlling variability on interannual time-scales, their role in driving longer-period changes is not so clear. King (1994) was unable to identify any significant long-term trends in either atmospheric-circulation indices or sea-ice extent. in this paper we return to the question what is driving the longer-period temperature variations in the Peninsula, making use of additional data on atmospheric circulation and sea-ice extent that were not available at the time of the earlier analysis.
Observed Temperature Variability in The Peninsula
High levels of interannual variability and significant warming trends are observed at Faraday station and at stations in the region of Marguerite Bay (see Figure 1 for a location map), as discussed by King (1994). Both interannual variability and long-term warming are smaller in the South Shetland Islands at the northern end of the Peninsula. The southern limit of the region of high variability and change is not well defined, because of the lack of coastal observing stations south of Marguerite Bay. However, a recent analysis of a rather fragmentary temperature record from Fossil Bluff station (Harangozo and others, 1997) indicates that the region extends at least as far south as Alexander Island.
Time series of winter (June August) and summer (December-February) mean temperatures at Faraday and Rothera stations are shown in Figure 2 (the “Rothera” record is actually a composite of several station records from the Marguerite Bay area). The largest warming trend is seen in the winter season at Faraday (0.087°C a−1 over the period 1945-96 from a least-squares fit), although the higher interannual variability during this season somewhat obscures the trend and reduces its statistical significance. Variations in the Rothera winter temperature record closely follow those at Faraday, with the more northerly station being, on average, 2.2°C warmer. However, while winter temperatures at Faraday have remained high since the record warmth of 1989, those at Rothera have returned to close to the long-term average, reducing the overall trend at this station. Interannual variability is lower in summer at both stations, and the warming trend (0.022°Ca−1 at Faraday), though also reduced in this season, is more immediately apparent. Summer temperatures at Faraday and Rothera follow each other closely throughout the record and there is even a tendency for Rothera to be slightly warmer than Faraday in this season.
A map of the Antarctic Peninsula region, showing Slime of the places mentioned in the text.

Summer (December February) and winter (June-August) temperatures at Faraday (solid line) and Rothera ( broken line). Kote the different scales on the two graphs.

Possible Driving Mechanisms
Atmospheric circulation changes
King (1994) demonstrated that there was a good correlation between interannual variations in Faraday winter temperatures and an index, M1, of the atmospheric meridional circulation based on the pressure difference between Faraday and the South Orkney Islands. However, this index did not reveal any significant long-term trend in the strength of the meridional circulation. Examination of hemispheric numerical weather-prediction analyses suggests that the index used by King may not be ideal for resolving the circulation changes most likely to affect Peninsula temperatures. There is a “pole of variability” in mean sea-level pressure (MSLP) associated with the climatológica! low-pressure centre in the South Pacific sector of the Southern Ocean (Connollcy, 1997) and it is clear that circulation variability in this region, which will not be resolved by M1, will have a major impact on Peninsula temperatures through changes in the advection of warm, mid-latitude air to the region.
The longest series of atmospheric analyses covering the Antarctic region is the series of Southern Hemisphere numerical analyses produced by the Australian Bureau of Meteorology (ABM) between 1973 and 1994. While this is long enough to relate interannual variability in circulation and Peninsula temperatures, it is still loo short to determine whether there have been any long-term circulation trends associated with the Peninsula warming. We have thus sought earlier data to show whether there is evidence of long-term changes in the South Pacific sector and have identified two sourc es of such information:
-
(i) Manually drawn daily charts of Southern Hemisphere MSLP, produced by the South African Weather Bureau (SAWB) for the years 1957-64 and published in the SAWB journal Notos.
-
(ii) Daily MSLP charts for the Antarctic Peninsula sector, prepared by the lalkland Islands and Dependencies Meteorologieฝ Service (FIDMET) in 1965 and 1966.
We have digitised daily pressure data from selected points on these charts. Data obtained from both of the above chart series must be treated with a degree of caution, particularly in the Pacific sector of the Southern Ocean, which was almost devoid of data away from the coastal stations in the pre-satellite era. An assessment of the quality of the FIDMET charts is given by Reference MayesMayes (1981), and the SAWB charts are described byReference Taljaard and van LoonTaljaard and Van Loon (1964).
Using data from these chart series and the later ABM analyses, we have constructed a new meridional circulation index. This is the monthly pressure difference between two points located to the west and east of Faraday, at 65° S, 75° wand 65° S, 60° W. A negative index indicates lower pressures in the eastern Bellingshausen Sea, and a positive index denotes lower pressures in the western Weddell Sea. This index, hereafter referred to as M2, is superior to the Ml index because it resolves pressure variations in the active region to the west of the Peninsula. Faraday monthly mean temperatures are strongly anticorrelated with monthly M2 values, with correlation coefficients exceeding 0.5 in magnitude and significant at the 1 % level in all months from May to October.
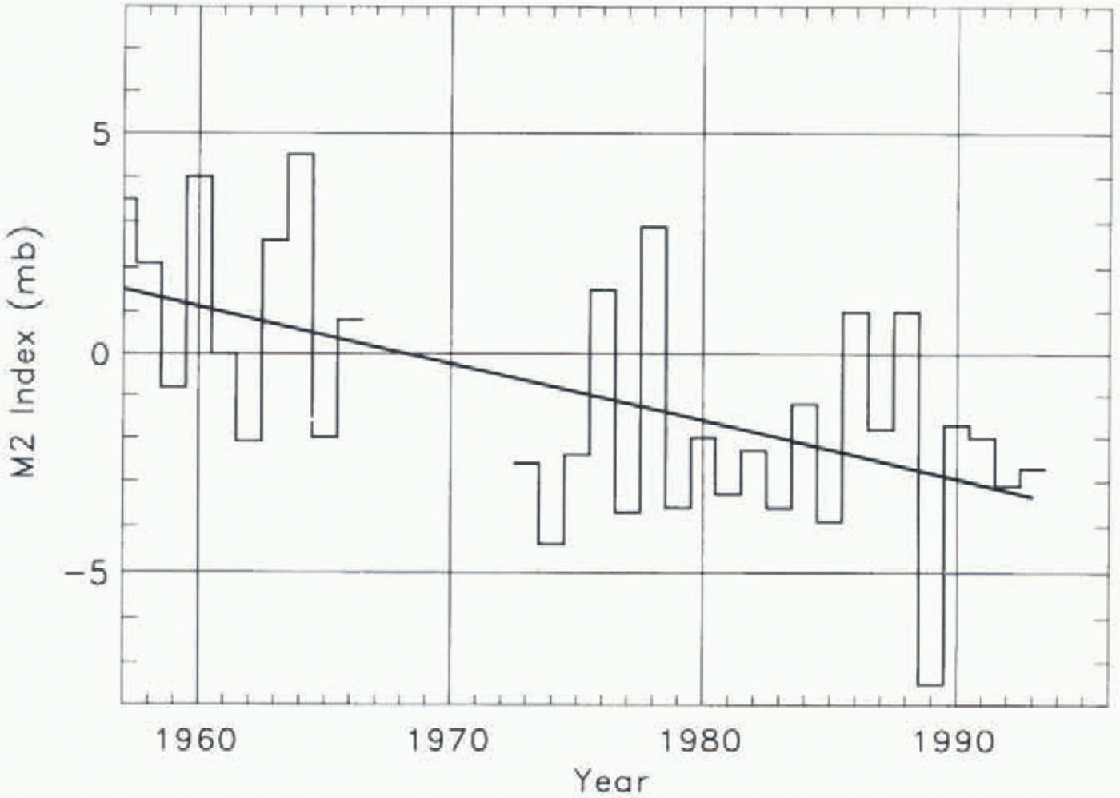
A least-squares regression analysis of the new index shows that it has decreased in all months in the May-October period. This decrease is statistically significant at the <1% level in August (Fig. 3), when the trend is -0.14 ml) a−1 (standard error — 0.04). The break in the data makes it difficult to determine whether there has been a gradual trend or if a more abrupt change has taken place around 1970. Appreciable negative trends are also found in May ( 0.09 mb a−1) and October ( 0.07 mb a−1). The May trend is marginally significant (<8%), although it ought to be treated with some caution as there is weak autocorrelation in the M2 series at this time of year. Moreover, there has been a statistically significant (<5%) decrease in absolute pressure at 65°S, 75 win August, of 0.25 mb a−1. This compares with just 0.11 mba−1 at 65° S, 60° W, which is not statistically significant, suggesting that August absolute pressures have mainly changed in the eastern Bellingshausen Sea.
Monthly mean values of the M2 index for August. The straight line is a least-squaresfit to the data.
The M2 index data point to a secular change in the atmospheric circulation having affected the Antarctic Peninsula throughout much of the May-October period since the 1950S. This change denotes an increased frequency and/or intensification of northerly flows (and hence warm advection) in the region over time. Independent analyses of the ABM data for the period from 1973 (Van Loon and others, 1993; Reference Hurrell and van LoonHurrell and Van Loon, 1994) have also found a statistically significant reduction in winter and spring surface pressures south of 60° S between the 1970S and 1980S, but with the most pronounced change in October. in contrast, present results indicate that the long-term pressure decrease in the Antarctic Peninsula area has been greatest in late winter. in addition, present results suggest that inter-decadal change in the springtime circulation found in the 1970S and 1980S may in fact be part of a long-term change taking place in the region.
In order to gel around possible inaccuracies in the absolute pressure data west of Faraday in the period 1957-66, when analyses lacked the benefit of satellite data, the derived M2 data have been used to produce a simple count of the frequency of days of northerly (negative index) and southerly (positive index) flow. Only cases with |M2| > 2 mb have been counted, this being the approximate accuracy of the daily M2 index, and data for 1965 have been excluded because a number of charts are missing in this year. On average, the winter (June-August) frequency of northerly (lows in the 1957—66 period is 37.6 d a−1 compared to 36.8 d a−1 of southerly flow. This compares with 46.3 d of northerly flow and 28.1 d of southerly flow in the 1973-93 period. A chi-squared test on these data confirms that there is a highly statistically significant (<1%) difference in the frequency of northerly and southerly flows in the two periods. Taken together, all these results point to a long-term increase in winter cyclonic circulation upstream of the Antarctic Peninsula over the last four decades. in particular, it appears that wintertime anti-cyclonic circulations, which occurred frequently in the 1950S and 1960S, are now rarely seen. Further support for this view comes from the observation that winter precipitation at western Antarctic Peninsula stations (which, in this region, is generally associated with cyclonic weather systems originating west of the Peninsula) has increased significantly over the same period (Reference Turner, Colwell and HarangozoTurner and others, 1997). We thus conclude that secular winter climate change found in the western Ant-arctic Peninsula has in fact been attended by systematic atmospheric circulation changes.
Sea-ice changes
We have re-examined the relationships that King (1994) found between Peninsula temperatures and the extent of sea ice to the west of the Peninsula, using a new ice-edge dataset derived from a re-analysis of satellite passive microwave radiometer data by the University of Bremen ( Heyg-ster and others, 1996). This covers the period 1979-94 and provides daily ice-edge (15% concentration) positions at a resolution of 50 km. Monthly mean icc-cdgc positions at 5° longitude intervals have been derived from these dala. Additionally, the ice-edge data have been extended back to 1973, using positions derived from the U.S. Joint Ice Center charts for this period.
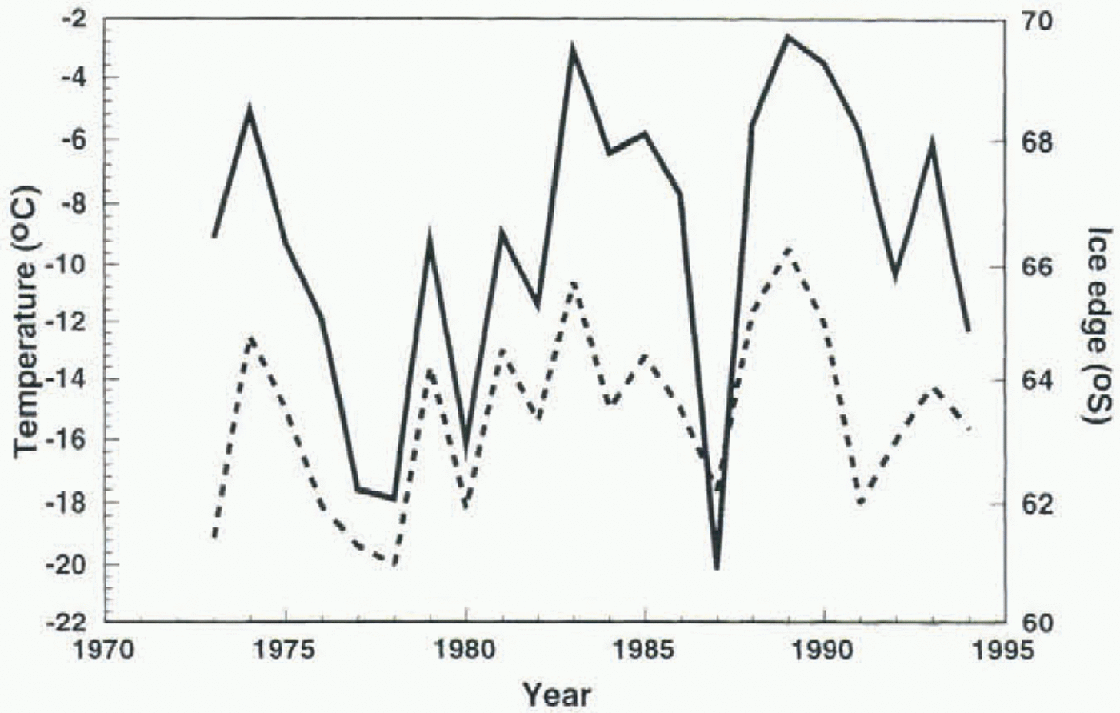
Figure 4 shows the year-by-year variation of the July mean ice-edge position at 70° Wand of mean July temperatures at Faraday. As noted by King (1994), there is a strong correlation between these two variables, and, with the new sea-ice dataset, thejuly correlation coefficient has increased from 0.67 to 0.79. Correlation coefficients are also high in other autumn and winter months, and the correlation between monthly mean temperature and ice-edge position is significant at the 1 % level or better from April through to August. These strong correlations point to ocean-ice atmo-sphere interaction in the Bellingshausen Sea as exerting the main control on the west coast Peninsula climate. Correlation analysis alone cannot identify whether ice-extent anomalies are being driven by temperature changes, or vice versa, or both have a common cause, and, in any case, there will be strong feedbacks between these two variables. Recent work (Harangozo, 1997) points to the importance of atmospheric circulation changes in establishing ice anomalies in this region. If we postulate that ice extent is the controlling variable, we can pose the question: flow large a retreat of the ice edge to the west of the Peninsula would be required to account for the warming observed since 1945?
Annual variations in July mean temperature at Faraday (solid line) and the July mean ice-edge latitude at 70° w(dashed line).
Monthly mean latitude of the ice edge at 70° W. The solid curve is the meanfor 1973-94, with extremes for this period shown by the bold dashed lines. The dotted line is a “reconstructed” position for 1945-54, based on ice-extent-temperature regression relationships. Symbols are individual ice-edge observations, made as follows; squares 1929-34; plus sign, 1960; inverted triangle, ice edge north of this latitude in 19.59.
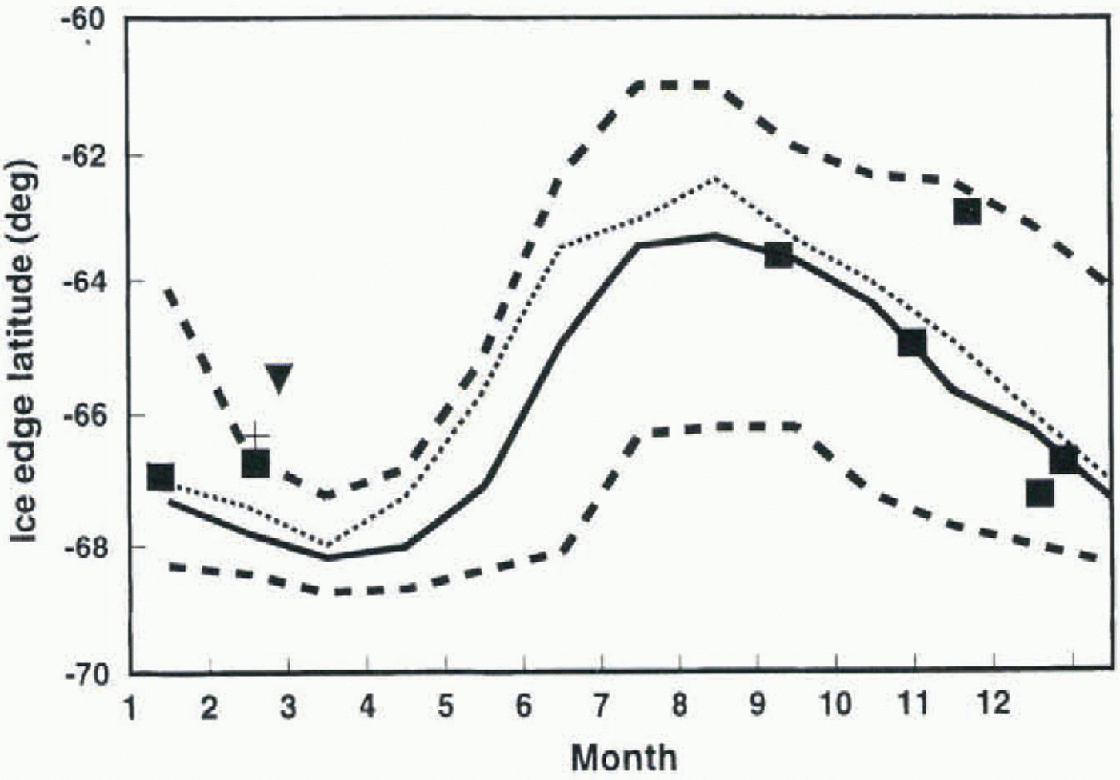
The mean and extreme monthly positions of the ice edge at 70° wover the period 1973-94 are shown in Figure 5. Also shown is a “reconstructed” ice edge for the period 1945-54. This has been produced by carrying out a month-by-month linear regression of ice-edge position on Faraday temperature for the period 1973-94 and then using these regression relationships to “hindcast” ice-edge positions from 1945-54 mean temperature data. The calculated ice edge is seen to fall well with in the range of present-day observed variability, implying that if present-day ice-extent-tempcr-ature relationships have held over the past 50 years, the change in mean ice extent required to drive the observed warming is small compared with the observed interannual variability in ice extent. Even if satellite observations had been available since 1945, such a small change would be difficult to detect. Very limited ice-edge observations prior to 1973 are available from ship reports, and these are restricted almost entirely to the summer months. Reference Mackintosh and HerdmanMackintosh and Herdman (1940) catalogued observations made between 1929 and 1934 by ships of the Discovery Committee. Observations around 70° whave been plotted in Figure 5 and are seen to lie with in the observed extrema of recent years. Reference Heap, Priestly, Adie and de Q. RobinHeap (1964) noted the severity of ice conditions in this sector during the 1958-59 and 1959 60 summer seasons. in the earlier of these seasons, the ice edge at 70° wlay north of 65.5° S, well north of the 1973-94 extreme. The winter of 1958 was the coldest on record at Faraday and, given the observed tendency of ice anomalies to persist from one season to the next (พeatherly and others, 1991), the extensive summer ice almost certainly indicates very extensive ice in the preceding winter.
Thus, while recent ice-edge extrema may have been exceeded occasionally prior to 1973, it seems likely that any trend in the position of the mean ice edge in this sector over the past 70 years has been small compared with the range of interannual variability. Regression analysis of the 1973-94 ice-edge record does not show significant trends in any months, but it should be stressed that Faraday temperature trends are also not significant over this relatively short period.
Conclusions
Analysis of historical winter atmospheric circulation data for the South Pacific sector of the Southern Ocean indicates that the circulation over the Antarctic Peninsula is now more northerly than it was in the 1950S and 1960S. Such a change is consistent with the warming trend observed in Peninsula temperatures. Although the observed changes appear to be significant, they must be treated with some caution since the atmospheric analyses for the earlier period are based on limited data and thus may not be fully reliable at all times.
Changes in circulation will impact directly on Peninsula temperatures through changed warm-air advection, and indirectly through their effect on the extent of sea ice to the west of the Peninsula. The post-1972 satellite record shows no overall trend in sea-ice extent in this region, but a great deal of interannual variability. However, the limited ice observations from the extremely cold period of the late 1950s do indicate more extensive ice than has been recorded in recent years. Earlier ice observations from the period around 1930 fall with in the extremes of the satellite record, suggesting that Peninsula temperatures at that time were certainly no colder than those prevailing during the early part of the Faraday temperature record. The satellite record suggests that Peninsula temperatures are extremely sensitive to small changes in the ice-edge position, and the changes required to account for the observed Peninsula warming are small. Given the high interannual variability in ice extent in this sector and the very limited information on ice extent available in the pre-satellite era, it would be difficult to detect such a trend.
The data presented in this paper are all consistent with previous observations of climatic variability and change over the past 50 years in the western Antarctic Peninsula. It seems most likely that the observed atmospheric-circulation changes are driving the temperature changes, with interactions with sea ice enhancing the sensitivity to change. Additionally, ice cover may have been reduced as a result of changes in the regional océanographie regime (Reference Jacobs and ComisoJacobs and Comiso, 1997). The ultimate cause of the circulation variability has yet to be determined. Recent studies (Reference Cullather, Bromwich and van WoertCullather and others, 1996) have shown fairly robust links between the atmospheric circulation in the vicinity of West Antarctica and the state of El Niño-Southern Oscillation. It is thus plausible that the circulation variations have been driven by long-term change in the tropical Pacific climate system. Alternatively, the change could be purely locally driven. Atmosphere—ice^ocean interaction appears to make the region very climatically sensitive, and the coupled system could exhibit considerable internal variability. Thus, even if the ultimate driving for the observed changes comes from outside Antarctica, the response of the local climate-system processes will be important in determining the magnitude of the change.
Acknowledgement
We thank D. G. Low for undertaking the manual extraction of pressure data from the SAWB and FIDMETcharts.



