



1. Introduction
Particle-laden wall-bounded turbulent flows exist widely in many engineering and environmental applications. For example, the particle erosion caused by atmospheric dust may decrease the performance of gas turbine engines (Szczepankowski & Szymczak Reference Szczepankowski and Szymczak2011) and damage turbine vanes (Dunn Reference Dunn2012). Particle-laden turbulent channel flow is widely used to explore the interaction between small particles and wall-bounded turbulence. Particle–turbulence interaction consists of two aspects, i.e. particle motion driven by turbulence and turbulence modulation caused by particles (Balachandar & Eaton Reference Balachandar and Eaton2010), which have been extensively investigated by experimental approaches (Kulick, Fessler & Eaton Reference Kulick, Fessler and Eaton1994; Kussin & Sommerfeld Reference Kussin and Sommerfeld2002) and numerical simulations (Peng, Ayala & Wang Reference Peng, Ayala and Wang2019; Costa, Brandt & Picano Reference Costa, Brandt and Picano2020a; Jie et al. Reference Jie, Cui, Xu and Zhao2022) in turbulent channel flows.
Owing to the advances of computation power, numerical simulation has become a vital means in understanding particle-laden multiphase flows (Brandt & Coletti Reference Brandt and Coletti2022). The particle-resolved (PR) method and point-particle (PP) method are the most popular numerical approaches to simulate turbulent dispersed multiphase flows. The PR method needs to resolve the detailed flow around single particles. The force applied to the solid particle by the fluid is obtained by integrating the fluid stress tensor on the particle's surface. Different PR methods have been applied to particle-laden turbulent channel flows. Peng et al. (Reference Peng, Ayala and Wang2019) use the PR lattice Boltzmann method to study turbulent channel flow laden with neutrally buoyant finite-size spheres. Shao, Wu & Yu (Reference Shao, Wu and Yu2012) develop a direct-forcing fictitious domain method for resolved numerical simulation of particle-laden horizontal channel flows. Costa, Brandt & Picano (Reference Costa, Brandt and Picano2021) employ the immersed boundary method to resolve particles in turbulent channel flow. However, PR methods are usually very expensive and the number of simulated particles is limited to up to  ${O}(10^5)$. Therefore, it is necessary to develop the PP method for fast simulation of multiphase dispersed flow to satisfy the requirements of environmental research and industrial application. In addition, it should be pointed out that the PR method is a very useful and powerful tool for the validation of the PP method.
Unlike the PR method, the PP method assumes that the diameter of spherical particles  $d$ is smaller than the Kolmogorov length scale
 $\eta$. Thus, the flows around particles need not be resolved. The consequence of the PP assumption is that the hydrodynamic force applied to the particles cannot be obtained by directly integrating the fluid stress tensor on the particle's surface. Therefore, a hydrodynamic force model must be introduced into the particle motion equation. The history of modelling hydrodynamic forces on a solid sphere can be traced back to Stokes (Reference Stokes1850), who derived the drag on a moving sphere in uniform flow. Tsai derives the forces applied to a solid sphere in non-uniform flows independently from Maxey & Riley (Reference Maxey and Riley1983) when he studied the sedimentation of sand particles in moving water in 1957. Unfortunately, Tsai's paper was published in Chinese and is thus less known to the international academic community. Recently, Tsai's paper was translated into English and republished (Tsai Reference Tsai2022). Therefore, the equation of solid spherical particle motion in non-uniform flow is referred to as the Tsai–Maxey–Riley equation hereafter. Furthermore, Armenio & Fiorotto (Reference Armenio and Fiorotto2001) report that the Stokes drag dominates Tsai–Maxey–Riley equation when the particle–fluid mass density ratio
 $\rho _p/\rho _f$ is over
 ${O}(10^3)$.
Saffman (Reference Saffman1965, Reference Saffman1968) showed that a lift force will be exerted on a solid sphere when it traverses a linear shear flow. McLaughlin (Reference McLaughlin1989) was among the first to study the effect of Saffman lift on particle motion in turbulent channel flow, and reports that Saffman lift is comparable to Stokes drag in the near-wall region. However, Zeng et al. (Reference Zeng, Balachandar, Fischer and Najjar2008) show that the Stokes drag could almost recover the hydrodynamic forces on a solid particle compared with the results of the PR method in turbulent channel flow. Recent research work (Costa et al. Reference Costa, Brandt and Picano2020a) evaluates the magnitude of the ratio of the Saffman lift to the Stokes drag and shows that the Saffman lift can be neglected when the particle diameter in wall units  $d^+$ is smaller than
 $1$. When the Saffman lift is non-negligible, their result reveals that the near-wall particle velocities from PP simulation with Saffman lift agree well with the result from PR simulation. By contrast, the PP method without Saffman lift seems to underestimate the near-wall particle velocities.
Apart from the hydrodynamic force model applied to a solid particle, the fluid–particle interaction model is another key issue for the PP method. Fluid–particle interaction modes can be classified as one-way coupling, two-way coupling and four-way coupling based on the particle volume fraction  $\varPhi _V$ (Elghobashi Reference Elghobashi1994). One-way coupling considers a very dilute particle loading (
 $\varPhi _V<10^{-6}$), where the particle effect on turbulence is negligible. The one-way coupled PP method is frequently used to study particle preferential concentration (Rouson & Eaton Reference Rouson and Eaton2001), particle accumulation (Sardina et al. Reference Sardina, Schlatter, Brandt, Picano and Casciola2012) and particle streaks (Jie et al. Reference Jie, Cui, Xu and Zhao2022) in turbulent channel flow. The two-way coupled PP method should be employed in moderately dilute conditions (
 $10^{-6}<\varPhi _V<10^{-3}$), where the momentum transfer between dispersed particles and turbulence is large enough to alter the background turbulence. Therefore, the two-way coupling method is widely used to investigate turbulence modulation by small particles (Eaton Reference Eaton2009; Zhao, Andersson & Gillissen Reference Zhao, Andersson and Gillissen2010, Reference Zhao, Andersson and Gillissen2013; Horwitz et al. Reference Horwitz, Iaccarino, Eaton and Mani2022). The four-way coupled PP method corresponds to a dense particle loading (
 $\varPhi _V>10^{-3}$), where inter-particle collisions must be considered (Nasr, Ahmadi & Mclaughlin Reference Nasr, Ahmadi and Mclaughlin2009; Vreman Reference Vreman2015; Dritselis Reference Dritselis2016).
One of the main concerns for the PP simulation of particle-laden turbulent channel flow is the inclusion of Saffman lift in the particle motion equation. The neglect of the Saffman lift in the reported literature seems to be rather casual. Costa et al. (Reference Costa, Brandt and Picano2020a) try to give a criterion for the neglect of the Saffman lift. However, their criterion seems to overestimate the critical value of the particle diameter, under which the Saffman lift can be neglected. Moreover, they evaluate the effect of the Saffman lift on the near-wall particle velocity by comparing one-way coupled PP direct numerical simulation (DNS) with PR DNS, but do not offer a reasonable theoretical explanation. In addition, their work lacks the influence of the Saffman lift on the turbulence because the one-way coupling PP DNS method is employed in their research work.
This paper is intended to answer the following three questions regarding Saffman lift in a two-way coupled PP DNS of gravity-free turbulent channel flow. (i) Can we set up a more accurate criterion for the neglect of the Saffman lift in comparison with Stokes drag for heavy particles? (ii) Is there a self-consistent theoretical explanation for the effect of Saffman lift on the particle velocity? (iii) What is the influence of Saffman lift on turbulence modulation?
The remaining paper is structured as follows. Introduced in § 2 are the governing equations and numerical methods for two-way coupled PP DNS of turbulent channel flow. The numerical settings and validation of clean channel flow are presented in § 3. The criterion for neglect of the Saffman lift and the theoretical model for particle velocities are established in § 4. The numerical results are presented and discussed in § 5. Specifically, we first investigate the effect of the Saffman lift on particle motion and turbulence modulation in turbulent channel flow. Then, we validate the new criterion and theoretical models built in § 4 using the present numerical data. Finally, we summarize this paper in § 6.
2. Numerical configuration
In this section, a brief review is given of the governing equations and numerical methods employed to simulate the particle-laden turbulent channel flow. An Euler–Lagrange particle-tracking strategy is used to realize a two-way coupled PP DNS. The carrier phase (fluid) is simulated under the Eulerian framework by solving the dimensionless compressible Navier–Stokes equations (detailed in § 2.1). The dispersed phase (solid particles) is individually tracked under the Lagrangian framework by solving the particle motion equations (introduced in § 2.2). Finally, described in § 2.3 is the particle feedback effect on the fluid. This set of equations has been widely employed to simulate different types of compressible turbulent flows, such as compressible turbulent boundary layers (Xiao et al. Reference Xiao, Jin, Luo, Dai and Fan2020) and compressible turbulent mixing layers (Dai et al. Reference Dai, Jin, Luo and Fan2019).
2.1. Governing equations for carrier phase
The carrier phase is assumed to be air, a typical Newtonian fluid. Thus, the background flow is governed by the three-dimensional (3-D) compressible Navier–Stokes equations, including the conservations of mass, momentum and energy. The governing equations are non-dimensionalized by the following characteristic parameters:  $\rho _0 = \rho _{air}$ for density,
 $\mu _0=\mu _{air}$ for dynamic viscosity,
 $T_0=288.15\,\mbox {K}$ for temperature,
 $c_0=\sqrt {\gamma r T_0}$ for sound speed (where
 $\gamma = C_p/C_V$ is the ratio of specific heat at constant pressure
 $C_p$ to that at constant volume
 $C_V$, and
 $r=R/M_{air}$ is the individual gas constant of air with
 $R$ the universal gas constant and
 $M_{air}$ the molecular weight of air),
 $C_0 = \gamma r Ma^2$ for specific heat,
 $\kappa _0 = C_p C_0 \mu _0 /Pr$ for conductivity,
 $u_0 = c_0 Ma$ for velocity,
 $L_0=Re\mu _0/(\rho _0u_0)$ for length,
 $t_0 = L_0/u_0$ for time,
 $p_0=\rho _0 c_0^2/\gamma$ for pressure and
 $E_0=\rho _0 u_0^2$ for energy per unit volume. The dimensionless numbers are the Reynolds number
 $Re$, Mach number
 $Ma$ and Prandtl number
 $Pr$. Therefore, the dimensionless equations of density, momentum and energy can be written as
 $$\begin{gather} \frac{\partial \rho}{\partial t}+\frac{\partial \rho u_j}{\partial x_j}=0, \end{gather}$$
 $$\begin{gather}\frac{\partial \rho u_i}{\partial t}+\frac{\partial (\rho u_i u_j + p_m\delta_{ij})}{\partial x_j} = \frac{1}{Re} \frac{\partial \sigma_{ij}}{\partial x_j}+f_i+\varphi_{ui}, \end{gather}$$
 $$\begin{gather}\frac{\partial E}{\partial t}+\frac{\partial [(E+p_m) u_j]}{\partial x_j}=\frac{1}{(\gamma-1)Re Pr Ma^2}\frac{\partial}{\partial x_j}\left(\kappa\frac{\partial T}{\partial x_j}\right) + \frac{1}{Re}\frac{\partial \sigma_{ij}u_i}{\partial x_j}+f_iu_i+\varphi_e, \end{gather}$$
and the dimensionless equation of state for ideal gas reads
 \begin{equation} p=\rho T. \end{equation}
Here,  $\rho$,
 $u_i$,
 $T$ and
 $p$ are dimensionless density, velocity component in the
 $i$th direction, temperature and pressure of the fluid. The modified pressure is defined as
 $p_m\equiv p/(\gamma Ma^2)$. The Kronecker delta is denoted by
 $\delta _{ij}$. The dimensionless total energy per unit volume
 $E$ is defined as
 \begin{equation} E=\rho(C_V T+u_i^2/2)=\frac{p}{\gamma(\gamma-1)}+\frac{1}{2}\rho u_i^2. \end{equation}
The viscous shear stress tensor for Newtonian fluid is
 \begin{equation} \sigma_{ij}=\mu \left(\frac{\partial u_i}{\partial x_j}+ \frac{\partial u_j}{\partial x_i}\right)-\frac{2}{3}\mu\frac{\partial u_l}{\partial x_l}\delta_{ij}. \end{equation}
The dynamic viscosity and thermal conductivity follow Sutherland's law
 \begin{equation} \mu = \kappa = \frac{(1+T_{sb}/T_0) T^{3/2}}{T+T_{sb}/T_0}, \end{equation}
with  $T_{sb}=110.4\,\mbox {K}$. The feedback force and energy source of particles are denoted as
 $\varphi _{ui}$ and
 $\varphi _e$, respectively. The exact expressions for these feedback terms will be given below. An external body force
 $f_i$ is used to drive the turbulent channel flow, as done by Coleman, Kim & Moser (Reference Coleman, Kim and Moser1995). The external body force is obtained by a relaxation algorithm developed by Lenormand, Sagaut & Ta Phuoc (Reference Lenormand, Sagaut and Ta Phuoc2000).
2.2. Governing equations for dispersed phase
The solid particles are assumed to be identical spheres of diameter  $d$ and mass density
 $\rho _p=1600$, which corresponds to the real mass density ratio of sand to air. The particle diameter is much smaller than the Kolmogorov scale, i.e.
 $d \ll \eta _{K}$. Therefore, the Eulerian–Lagrangian PP method is employed to track the particles (Balachandar & Eaton Reference Balachandar and Eaton2010; Kuerten Reference Kuerten2016). The inter-particle collisions, particle rotation and heat transfer between particles and fluid are neglected in the present study.
The Tsai–Maxey–Riley equation (Maxey & Riley Reference Maxey and Riley1983; Tsai Reference Tsai2022) is employed to describe an individual particle's motion. Owing to the large mass density of particles, the Stokes drag is dominant in the Tsai–Maxey–Riley equation (Armenio & Fiorotto Reference Armenio and Fiorotto2001). The gravity is neglected to avoid a high streamwise velocity in the vertical channel and particle sediment (Zhu et al. Reference Zhu, Hu, Lei, Shen and Zheng2022) in the horizontal channel. We can add Saffman lift into the particle motion equation to study its influence. Using the same characteristic parameters for the fluid equations, the dimensionless equations for particle motions are formulated as
 $$\begin{gather} \frac{{{\rm d}\kern0.7pt x}^p_i}{{\rm d} t} = u^p_i, \end{gather}$$
 $$\begin{gather}\frac{{\rm d} u^p_i}{{\rm d} t} =f^D_i+f^L_i, \end{gather}$$
with the Stokes drag
 \begin{equation} f^D_i=\frac{f_1}{\tau_p}[u_i(\boldsymbol{x}^p)-u^p_i] ,\end{equation}
and the Saffman lift
 \begin{equation} f^L_i=\frac{6.46}{\tau_p}\frac{{\rm d}}{12{\rm \pi}}\frac{\partial u_1/\partial x_2}{|\partial u_1/\partial x_2|} \left(Re\frac{\rho}{\mu}\left|\frac{\partial u_1}{\partial x_2}\right|\right)^{1/2} [u_1(\boldsymbol{x}^p)-u^p_1]\delta_{i2}. \end{equation}
The particle relaxation time is given as  $\tau _p=Re\rho _p d^2/(18\mu )$. The finite particle Reynolds number effect is considered by the empirical correction
 $f_1=1+0.15Re_p^{0.685}$ (Schiller & Naumann Reference Schiller and Naumann1933) in (2.10), with the particle Reynolds number defined as
 $Re_p=Re\rho |\boldsymbol {u}(\boldsymbol {x}^p)-\boldsymbol {u}^p|d/\mu$. The compressibility correction to drag is neglected owing to the small particle slip Mach number (details are given in § 3.2) defined as
 $Ma_p = Ma |\boldsymbol {u}(\boldsymbol {x}^p)-\boldsymbol {u}^p| / c= Ma |\boldsymbol {u}(\boldsymbol {x}^p)-\boldsymbol {u}^p| / \sqrt {T}$ (Xiao et al. Reference Xiao, Jin, Luo, Dai and Fan2020). Various wall corrections can be included in the Saffman lift model, as done by Mei (Reference Mei1992) and Chen & McLaughlin (Reference Chen and McLaughlin1995). Costa, Brandt & Picano (Reference Costa, Brandt and Picano2020b) propose a new lift model by replacing the particle–fluid slip velocity with a characteristic velocity defined by shear (velocity gradient) and the particle diameter. The new lift leads to similar particle statistics to their PR DNS (Costa et al. Reference Costa, Brandt and Picano2020a). However, the reason for the success of this new lift model remains unclear. The performances of these two lift models and corresponding dimensional effect are preliminarily investigated in Appendix A. It turns out that the original Saffman lift model is more reliable than the new mode proposed by Costa et al. (Reference Costa, Brandt and Picano2020b) in the present simulations when compared with experimental data. Readers are referred to Appendix A for more details. Therefore, the original Saffman lift model is employed for the subsequent simulations and discussions in this paper and the more detailed effects of corrections to the Saffman lift model are open for further studies.
2.3. Two-way coupling feedback terms
The two-way coupling feedback source terms in momentum equation  $\varphi _{ui}$ and energy equation
 $\varphi _{e}$ are obtained by using the particle-in-cell method (Crowe, Sharma & Stock Reference Crowe, Sharma and Stock1977). The feedback terms are simply distributed onto the nearest grid to the particle. The feedback terms in a grid cell domain
 $\varOmega$ can be formulated as
 $$\begin{gather} \varphi_{ui}={-}\frac{{\rm \pi} d^3}{6}\rho_p\sum_{n \mbox{ in } \varOmega} H(\boldsymbol{x}-\boldsymbol{x}^{p,n}) a^{p,n}_i, \end{gather}$$
 $$\begin{gather}\varphi_{e}={-}\frac{{\rm \pi} d^3}{6}\rho_p\sum_{n \mbox{ in } \varOmega} H(\boldsymbol{x}-\boldsymbol{x}^{p,n}) a^{p,n}_i u_i, \end{gather}$$
with the weight function
 \begin{equation}
H(\boldsymbol{x}-\boldsymbol{y})=\left\{\begin{array}{@{}ll}
1/\Delta V & \mbox{if } |x_i-y_i|<\Delta x_i/2, i=1,2,3, \\
0 & \mbox{otherwise}, \end{array}\right.
\end{equation}
where  $a^p_i$ denotes the particle acceleration in the
 $i$th direction and
 $\Delta V$ denotes the volume of a computational grid cell.
2.4. Numerical methods
In this study, the finite difference method is used for solving the governing equations of the fluid phase. The Steger–Warming method (Steger & Warming Reference Steger and Warming1981) is employed to split the flux. A hybrid seventh-order linear scheme, seventh-order-weighted essentially non-oscillatory (WENO) scheme and fifth-order WENO scheme (Jiang & Shu Reference Jiang and Shu1996) is utilized for spatial discretization. The diffusion terms are discretized by an eighth-order accurate central difference scheme. The third-order total variation diminishing Runge–Kutta multistage method (Shu & Osher Reference Shu and Osher1988) is applied for time integration. For the disperse phase, the particles are tracked by an explicit second-order Adams–Bashworth scheme. The third-order Lagrange interpolation scheme is employed to compute the fluid velocity at the particle position (Yeung & Pope Reference Yeung and Pope1988). The open-source code Opencfd-SC (Guo et al. Reference Guo, Fang, Zhang and Li2022) is used as the solver for the fluid phase, and the solver for the particle phase is implemented by the authors.
3. Numerical settings and validations
3.1. Numerical settings of particle-laden channel flow
In this study, low Mach number ( $Ma=0.2$, approximately incompressible) turbulent channel flow is obtained through the DNS method. The values of the Prandtl number
 $Pr = 0.7$ and
 $\gamma = 1.4$ are assigned for air. The computational domain is
 $L_x \times L_y \times L_z = 4{\rm \pi} \delta \times 2\delta \times 4{\rm \pi} \delta /3$, with
 $\delta$ being the half-width of the channel and
 $x$,
 $y$ and
 $z$ the streamwise, wall-normal and spanwise directions of the channel, respectively. No-slip boundary conditions are applied at the walls. Periodic boundary conditions are applied in the streamwise and spanwise directions. The isothermal condition
 $T=1$ is applied at the walls (Coleman et al. Reference Coleman, Kim and Moser1995). A laminar parabolic Poiseuille velocity profile is imposed as the initial velocity condition.
The Reynolds number is set to  $Re=3000$, which leads to a friction Reynolds number of
 $Re_{\tau } = 192$. The friction Reynolds number is defined as
 $Re_{\tau } \equiv Re \rho _w u_{\tau } \delta / \mu _w$, with
 $\rho _w = \langle \rho \rangle _w$ being the mean fluid density at the wall,
 $\mu _w = \langle \mu \rangle _w$ the mean fluid viscosity at the wall and
 $u_{\tau }$ the friction velocity at the wall given by
 $u_{\tau } = \sqrt {\tau _w/(Re \rho _w)}$. Here,
 $\tau _w$ is the total shear stress at the wall, and
 $\langle {\cdot } \rangle$ represents the Reynolds average (or ensemble average). In this paper, the ensemble average is equivalent to the time average and spatial average in the
 $x$-
 $z$ plane after the system reaches statistically steady state. Thus, the wall unit is given by
 $y^+ = Re \rho _w u_{\tau } y / \mu _w = y/\delta _{\nu }$, where
 $y$ is the distance to the wall and
 $\delta _{\nu }= \mu _w/(Re \rho _w u_{\tau })$ is the viscous length scale.
The grid resolutions in the streamwise, wall-normal and spanwise directions are  $N_x\times N_y \times N_z = 240 \times 129 \times 140$. Uniform grids are generated in the streamwise and spanwise directions, which leads to
 $\Delta x^+ \approx 10.05$ and
 $\Delta z^+ \approx 5.75$, satisfying the grid size requirement for DNS (Bernardini, Pirozzoli & Orlandi Reference Bernardini, Pirozzoli and Orlandi2014). A hyperbolic tangent-type mesh is used in the wall-normal direction with
 $\Delta y^+_{min} \approx 0.2$ to resolve the viscous sublayers.
The particles are seeded into the channel when the flow reaches a fully developed state (denoted as  $t=0$). The particles are uniformly distributed in the channel at
 $t=0$. The initial velocities of particles are set to the fluid velocities at the particle positions, i.e.
 $u_i^p(t=0) = u_i(\boldsymbol {x}^p,t=0)$. The particles are reflected at the wall by keeping the same streamwise and spanwise velocities and reversing the direction of the wall-normal velocity. If particles leave the computational domain in the streamwise and spanwise directions, they will be re-injected into the channel through periodic boundary conditions without modifying their velocities.
Particle inertia is evaluated by the Stokes number defined as the ratio of the particle relaxation time to the turbulence characteristic time, i.e.  $St\equiv \tau _p/\tau _f$. The choice of
 $\tau _f$ can be diverse due to the scale separation of turbulent channel flow (Jiménez Reference Jiménez2013). In this paper, the Kolmogorov time scale at the centre plane
 $\tau _{k,cp}$ is employed to define the Stokes number. This choice is based on the following considerations. (i) The same definition of the Stokes number is used in previous experimental studies (Kulick et al. Reference Kulick, Fessler and Eaton1994). (ii) The particles gain the largest kinetic energy at the central plane of the channel. (iii) The particles spend most of their lifetime in the outer layer. For an
 $St$-known particle, its diameter can be determined by
 \begin{equation} d = \sqrt{\frac{18\mu St \tau_{k,cp}}{Re \rho_p}}. \end{equation}
The density and diameter of the particles in all simulation cases are listed in table 1. It can be seen that the particle diameters in all cases are smaller than the near-wall Kolmogorov length scale (the smallest eddy size in the channel), which validates the PP approach. The Stokes numbers defined by both the Kolmogorov time scale at the central plane  $St$ and the wall friction time
 $St^+$ are also displayed in table 1 as these two forms of the Stokes number are most frequently used in the literature.
Properties of the particles under consideration: density  $\rho _p$, diameter
 $d$, diameter in wall units
 $d^+$, ratio of diameter to the smallest eddy scale
 $\eta _w$ in the channel, the Stokes number defined by the Kolmogorov time scale
 $St_{K,cp}$ and that by the wall friction time scale
 $St^+$.

Besides, the particle mass fraction is kept unchanged with a value of  $\varPhi _m=10\,\%$ for different Stokes numbers because the particle mass fraction dominates turbulence modulation caused by small particles (Kulick et al. Reference Kulick, Fessler and Eaton1994). Thus, the total particle number can be calculated by
 \begin{equation} N_p = \frac{6L_x L_y L_z}{{\rm \pi} d^3} \frac{\varPhi_V}{1+\varPhi_V} \approx \frac{6L_x L_y L_z \varPhi_V}{{\rm \pi} d^3}. \end{equation}
The transfer between  $\varPhi _v$ and
 $\varPhi _m$ takes the form (Brandt & Coletti Reference Brandt and Coletti2022)
 \begin{equation} \varPhi_V = \frac{\varPhi_m\rho_f}{\varPhi_m\rho_f+(1-\varPhi_m)\rho_p}, \end{equation}
leading to  $\varPhi _V \approx 6.9\times 10^{-5}$, which satisfies the criterion of the two-way coupling method.
3.2. Validation of clean channel flow
The flow statistics of clean (single-phase) turbulent channel flow are first validated in this section. Vreman & Kuerten (Reference Vreman and Kuerten2014) report a DNS study on an incompressible turbulent channel flow at  $Re_{\tau }=180$ using the finite difference method. They compare their results with other DNS data based on the Fourier–Chebyshev method by Moser et al. (Reference Moser, Kim and Mansour1999). All these numerical data are available on open websites. In this paper, the main turbulence statistics are compared with these two sets of DNS data. Figure 1 displays the profiles of mean streamwise velocity normalized by the wall friction velocity
 $\langle u \rangle ^+ = \langle u \rangle /u_{\tau }$ obtained in different numerical simulations. It is manifested that the mean streamwise velocity in the current simulation agrees well with those calculated by Vreman & Kuerten (Reference Vreman and Kuerten2014) and Moser et al. (Reference Moser, Kim and Mansour1999).
Profile of mean streamwise velocity obtained in current simulation (black solid line). The same profiles reported by Moser, Kim & Mansour (Reference Moser, Kim and Mansour1999) (squares) and Vreman & Kuerten (Reference Vreman and Kuerten2014) (circles) are also included for comparison.

Furthermore, the second moments of the turbulence statistics are depicted in figure 2. Figure 2(a) shows the Reynolds stress  $-\langle u'v' \rangle$ normalized by
 $u_{\tau }^2$, with
 $u' = u - \langle u \rangle$ being the streamwise velocity fluctuation and
 $v'$ the wall-normal velocity fluctuation. Figure 2(b) displays the turbulence intensities, i.e. the root-mean-square (r.m.s.) values of velocity fluctuations, in the streamwise, wall-normal and spanwise directions, respectively. The present results coincide with the DNS data from Vreman & Kuerten (Reference Vreman and Kuerten2014) and Moser et al. (Reference Moser, Kim and Mansour1999). The above comparisons confirm the validity of the present solver in simulating clean turbulent channel flow.
Profiles of (a) Reynolds stress and (b) turbulence intensities obtained in current simulation (black solid lines). The same profiles from Moser et al. (Reference Moser, Kim and Mansour1999) (squares) and Vreman & Kuerten (Reference Vreman and Kuerten2014) (circles) are also plotted for comparison.

In addition, one needs to evaluate the particle Reynolds number and particle Mach number to guarantee the rationality of using the drag correction proposed by Schiller & Naumann (Reference Schiller and Naumann1933) and neglecting the Mach correction proposed by Loth (Reference Loth2008). The particle Reynolds number and particle Mach number are defined in § 2.2. Shown in figure 3(a) are the profiles of the mean particle Reynolds number and r.m.s. particle Reynolds number fluctuations. The particle Reynolds number in the channel is smaller than  $10$, which validates the correction of drag by Schiller & Naumann (Reference Schiller and Naumann1933). Depicted in figure 3(b) are the mean and r.m.s. particle Mach numbers in terms of
 $y^+$, which demonstrate that the particle Mach number is very small and the compressible effect in the particle motion equations can be neglected.
Profiles of mean (solid line) and r.m.s. fluctuations (dashed line) of (a) particle Reynolds number and (b) particle Mach number.

4. Theoretical analysis
4.1. Criterion for the neglect of Saffman lift
This subsection is devoted to studying the conditions under which Saffman lift can be neglected for the particle motion. Following the encouraging work by Costa et al. (Reference Costa, Brandt and Picano2020a), the Saffman lift and Stokes drag can be rewritten in vectorial form by approximating the shear with vorticity  $\boldsymbol \omega$
 $$\begin{gather} \boldsymbol{f}^L \approx{-}0.171\frac{d}{\tau_p}\left(Re\frac{\rho}{\mu}|\boldsymbol{\omega}|^{{-}1}\right)^{1/2} \boldsymbol{\omega} \times [\boldsymbol{u}(\boldsymbol{x}^p)-\boldsymbol{u}^p], \end{gather}$$
 $$\begin{gather}\boldsymbol{f}^D = \frac{f_1}{\tau_p} [\boldsymbol{u}(\boldsymbol{x}_p)-\boldsymbol{u}_p]. \end{gather}$$
Comparing the Saffman lift in (4.1) with the Stokes drag in (4.2), one obtains
 \begin{equation} \biggl|\frac{\boldsymbol{f}^L}{\boldsymbol{f}^D}\biggr| \approx \frac{0.171}{f_1} d \left(Re\frac{\rho}{\mu}|\boldsymbol{\omega}|\right)^{1/2}. \end{equation}
As the lift plays most of its role in the vicinity of wall, (4.3) is then estimated in the near-wall region. If the vorticity is approximated by the near-wall mean shear  $\mathcal {S} \equiv \partial \langle u \rangle /\partial y$,
 $\sqrt {Re \rho |\boldsymbol {\omega }| /\mu }$ in (4.3) is equivalent to
 $1/\delta _{\nu }$, which yields the criterion of
 $d^+ \lesssim 1$ for neglect of Saffman lift, as suggested by Costa et al. (Reference Costa, Brandt and Picano2020a) through an order analysis of (4.3). However, it is argued by Jiménez (Reference Jiménez2013) that the near-wall small-scale vortices are very strong. Thus, it is necessary to take the small-scale vortices into account for estimation of the magnitude of the vorticity. It is assumed herein that the magnitude of vorticity is decomposed into two parts, i.e. the mean shear, which is equal to the mean vorticity, and small-scale vorticity
 $\omega '$, and thus we have
 $|\boldsymbol {\omega }| = \mathcal {S}+\omega '$. Consequently, (4.3) can be rewritten as
 \begin{align} \biggl|\frac{\boldsymbol{f}^L}{\boldsymbol{f}^D}\biggr| &\approx \frac{0.171}{f_1} d \left(Re\frac{\rho}{\mu} \mathcal{S}\right)^{1/2} \left( 1+\frac{\omega'}{\mathcal{S}} \right)^{1/2} \nonumber\\ &= \frac{0.171}{f_1} d^+ \left( 1+\frac{\omega'}{\mathcal{S}} \right)^{1/2}. \end{align}
It turns out that the results of  $\mathcal {S}/\omega '$ at different Reynolds numbers almost collapse onto each other in the near-wall region (see, e.g. figure 2(c) reported by Jiménez Reference Jiménez2013). Therefore, a value of
 $0.22$ is taken for
 $\mathcal {S}/\omega '$ as demonstrated by Jiménez (Reference Jiménez2013). For simplicity, we ignore the finite particle Reynolds number correction, i.e.
 $f_1^2 \approx 1$. If the Saffman lift is supposed not to be ignored when
 $|\boldsymbol {f}^L/\boldsymbol {f}^D|$ exceeds a threshold
 $\epsilon$, one can readily obtain the corresponding criterion with respect to
 $d^+$ and the critical particle diameter
 $d^+_c$ reads
 \begin{equation} d^+_c = \frac{\epsilon}{0.171} \left( 1+\frac{\omega'}{\mathcal{S}} \right)^{{-}1/2}. \end{equation}
Up to now, the threshold is only unknown for determination of the critical Stokes number. When the Saffman lift is very small and negligible, the total force on the solid particle is the Stokes drag. In turbulent channel flow, the Stokes drag is mainly along the streamwise direction and the vorticity is approximately along the spanwise direction, as shown in figure 4. Therefore, the Saffman lift is nearly perpendicular to the Stokes drag. In other words, the Saffman lift will not only cause the increase of total force, but change the direction of total force. Here, the angle between the Stokes drag and total force is termed the deviation angle and denoted by  $\alpha$. It is believed that the direction change caused by the Saffman lift is very important for the motion of particles in turbulent channel flow. Especially, a little deviation angle may cause a particle to travel out of the viscous layer when it is within the near-wall region. Therefore, it is conjectured that the Saffman lift cannot be neglected when the deviation angle
 $\alpha$ exceeds
 ${\rm \pi} /18$ (same value can be obtained from Costa et al. (Reference Costa, Brandt and Picano2020a)). This leads to
 $\epsilon = \tan ({\rm \pi} /18)$.
Schematic of forces applied to a single particle at different wall positions in turbulent channel flow.

By substituting the above-mentioned numerical value into (4.5), the critical particle diameter can be simplified as  $d_c^+ \approx 0.438$. The new criterion gives a smaller range of particle diameter for neglect of the Saffman lift than the Costa–Brandt–Picano criterion. The critical particle diameter corresponds to a unique particle Stokes number. According to the definition of the Stokes number, this critical Stokes number takes the form
 \begin{equation} St_c \equiv \frac{\tau_p}{\tau_{k,cp}} = Re \frac{\rho_p {d_c^+}^2 \delta_{\nu}^2 }{18 \mu \tau_{k,cp}}. \end{equation}
The wall viscous length scale  $\delta _{\nu }$ equals
 $u_{\tau } \tau ^+$, with
 $\tau ^+ \equiv 1/\mathcal {S}_w$ being the wall friction time scale. Considering the definition of the wall friction velocity, one obtains
 \begin{equation} St_c = \frac{{d_c^+}^2}{18} \frac{\mu_w}{\mu} \frac{\rho_p}{\rho} \frac{\tau^+}{\tau_{k,cp}}. \end{equation}
In an approximately incompressible turbulent channel flow ( $Ma = 0.2$), the variation of viscosity in the flow field is very small and thus
 $\mu _w/\mu \approx 1$. By contrast,
 $\tau _{k,cp}/\tau ^+$ varies with friction Reynolds number. In the channel flow under consideration, numerical simulation manifests that
 $\tau _{k,cp}/\tau ^+ \approx 15$. Eventually, we can obtain a numerical estimation of the critical Stokes number in the present turbulent channel flow, i.e.
 $St_c \approx 0.7 \rho _p / (1000 \rho )$. Now, we have a round view of the criterion for consideration of the Saffman lift effect. In what follows, we shall investigate how Saffman lift influences the motion of particles.
4.2. Particle velocities
Mean particle velocity is one of the most important quantities to characterize particle motions in turbulent channel flow. However, there exist very few effective analytical models for the particle velocity in wall-bounded turbulent flow. This section is intended to establish an empirical model for the mean streamwise particle velocity. First of all, an Eulerian model for the particle velocity is established by integrating the particle motion equation along the trajectory of a particle. Then, the averaged streamwise particle velocity is deduced from the instantaneous Eulerian field of the particle velocity. Finally, the model of the mean streamwise particle velocity is closed with a gradient diffusivity approximation and the Prandtl turbulent mixing length.
To simplify the derivation, the drag correction is ignored in (2.10). Thus, the equation of streamwise particle motion can be written as
 \begin{equation} \frac{{\rm d} u^p}{{\rm d} t} = \frac{u(\boldsymbol{x}^p)-u^p}{\tau_p}. \end{equation}
It was Maxey (Reference Maxey1987) who first integrated (4.8) and successfully predicted the preferential concentration of inertial particles in incompressible homogeneous isotropic turbulence. Following Maxey's work, we integrate the same equation for turbulent channel flow, a typical inhomogeneous and anisotropic turbulence. Unlike in incompressible flows, where the particle relaxation time  $\tau _p$ (dependent on fluid viscosity) is constant,
 $\tau _p=\tau _p(\boldsymbol {x}^p)$ is a function of temperature and thus of distance to the wall in compressible turbulent channel flow. Although the very low Mach number results in very small variations of
 $\tau _p$, variations along the wall-normal direction are still taken into account in this paper to guarantee the generality of the present analysis in all compressible flows.
First, integrating (4.8) yields
 \begin{equation} u^p(t) =u^p(t=0)\exp\left(- \int_0^t \frac{{\rm d} t'}{\tau_p} \right) + \int_0^t \frac{u}{\tau_p}(\boldsymbol{x}^p,s)\exp\left(-\int_s^t \frac{{\rm d} t'}{\tau_p} \right){\rm d} s. \end{equation}
Using the method of integration by parts, one then has
 \begin{align} u^p(t) &= u(\boldsymbol{x}^p,t) +[ u^p(t=0) - u(\boldsymbol{x}^p,t=0) ] \exp\left(- \int_0^t \frac{{\rm d} t'}{\tau_p} \right) \nonumber\\ &\quad -\int_0^t \frac{{\rm d} u}{{\rm d} t}(\boldsymbol{x}^p,s)\exp\left(-\int_s^t \frac{{\rm d} t'}{\tau_p} \right){\rm d} s. \end{align}
At  $t=0$, the velocity of a particle is set to that of the fluid at the particle's position, i.e.
 $u^p(t=0) = u(\boldsymbol {x}^p,t=0)$. Therefore, one obtains
 \begin{equation} u^p(t) = u(\boldsymbol{x}^p,t)- \int_0^t \frac{{\rm d} u}{{\rm d} t}(\boldsymbol{x}^p,s) \exp\left(-\int_s^t \frac{{\rm d} t'}{\tau_p} \right){\rm d} s. \end{equation}
Applying again the method of integration by parts to the second term on the right-hand side of (4.11) yields
 \begin{align} u^p(t) &= u(\boldsymbol{x}^p,t)-\tau_p \frac{{\rm d} u}{{\rm d} t}(\boldsymbol{x}^p,t) + \tau_p \frac{{\rm d} u}{{\rm d} t}(\boldsymbol{x}^p,t=0) \exp\left(- \int_0^t \frac{{\rm d} t'}{\tau_p} \right) \nonumber\\ &\quad + \int_0^t \frac{{\rm d}^2u}{{\rm d} t^2}(\boldsymbol{x}^p,s)\exp\left(-\int_s^t \frac{{\rm d} t'}{\tau_p} \right){\rm d} s. \end{align}
Since we are interested in the long-time statistical properties of particle motion, the initial perturbation decays exponentially with time and can be ignored after a sufficiently long time of evolution. Thus, one reaches
 \begin{equation} u^p(t) = u(\boldsymbol{x}^p,t)-\tau_p \frac{{\rm d} u}{{\rm d} t}(\boldsymbol{x}^p,t) + \int_0^t \frac{{\rm d}^2u}{{\rm d} t^2}(\boldsymbol{x}^p,s)\exp\left(-\int_s^t \frac{1}{\tau_p}{\rm d}\tau \right){\rm d} s. \end{equation}
By repeating the above-described integral, the streamwise particle velocity can be written as an infinite series in the form
 \begin{equation} u^p(t) = u(\boldsymbol{x}^p,t) + \sum_{n=1}^{\infty} (-\tau_p)^n \frac{{\rm d}^n u}{{\rm d} t^n}(\boldsymbol{x}^p,t). \end{equation}
The establishment of the present material derivative  ${\rm d}/{\rm d} t$ needs special attention. This term comes from the integral by parts of the fluid velocity along the particle trajectory. It represents the change rate of the fluid velocity seen by the particle. As shown in figure 5, the solid particle coincides with fluid particle 1 at instant
 $t$. However, following the solid particle's trajectory, the solid particle meets fluid particle 2 at instant
 $t+\delta t$. By definition
 \begin{align} \frac{{\rm d} u}{{\rm d} t} &= \lim_{\delta t\to 0}\frac{u(\boldsymbol{x}^p(t+\delta t),t+\delta t)- u(\boldsymbol{x}^p(t),t)}{\delta t}, \nonumber\\ &= \frac{\partial u}{\partial t} + \frac{{\rm d}\kern0.7pt \boldsymbol{x}^p}{{\rm d} t} \boldsymbol{\cdot} \boldsymbol{\nabla} u, \end{align}
from which one can readily obtain
 \begin{equation} \frac{{\rm d} u}{{\rm d} t} = \frac{\partial u}{\partial t}+u^p \frac{\partial u}{\partial x} + v^p\frac{\partial u}{\partial y}+ w^p\frac{\partial u}{\partial z}. \end{equation}
Schematic of the material derivative  ${\rm d} u/{\rm d} t$ following the motion of a solid particle, which is represented by black circles.

The above derivation procedure is slightly different from that given by Maxey (Reference Maxey1987), who approximates  ${\rm d}\kern0.7pt \boldsymbol {x}^p/{\rm d} t$ by the fluid velocity at the particle position
 $u(\boldsymbol {x}^p,t)$ in the absence of gravity. It is noteworthy, however, that Maxey's theory is not wrong because it was originally limited to very small Stokes number cases, for which the solid particle follows approximately the fluid particle. Note that
 $u(\boldsymbol {x}^p,t)$ stands for fluid velocity seen by the particle at
 $\boldsymbol {x}^p$, and thus (4.14) can be rewritten in Eulerian framework as
 \begin{equation} u^p(t) = u(t) + \sum_{n=1}^{\infty} (-\tau_p)^n \frac{{\rm d}^n u}{{\rm d} t^n}(t). \end{equation}
With the help of (4.16), one can qualitatively explain the effect of Saffman lift on the particle's motion. It is clear from (2.11) that the Saffman lift will directly change the particle velocity in the wall-normal direction  $v^p$, which also appears in (4.16). The change of wall-normal particle velocity will finally result in the enhancement of the streamwise particle velocity via (4.16) and (4.17).
The above-described analysis can not only help one explain the way Saffman lift alters the streamwise particle velocity, but also allows one to develop an empirical model for the mean streamwise particle velocity  $\langle u^p \rangle$. The ensemble average of (4.17) gives rise to
 \begin{equation} \langle u^p \rangle = \langle u \rangle + \sum_{n=1}^{\infty} \left\langle (-\tau_p)^n \frac{{\rm d}^n u}{{\rm d} t^n}(t) \right\rangle. \end{equation}
When the particle-laden flow system reaches a statistically steady state, the first term in the series of (4.18) writes
 \begin{align} \left\langle -\tau_p \frac{{\rm d} u}{{\rm d} t} \right\rangle &={-}\left\langle \tau_p \frac{\partial u}{\partial t} \right\rangle - \left\langle \tau_p u^p\frac{\partial u}{\partial x} \right\rangle - \left\langle \tau_p v^p\frac{\partial u}{\partial y} \right\rangle - \left\langle \tau_p w^p\frac{\partial u}{\partial z} \right\rangle \nonumber\\ &\approx{-} \left\langle \tau_p v^p\frac{\partial u}{\partial y} \right\rangle, \end{align}
as the derivatives of  $u$ in the streamwise and spanwise directions are much smaller than that along the wall-normal direction in turbulent channel flow. Thus, the high-order derivative terms on the right-hand side of (4.18) are expanded in the form
 \begin{equation} \left\langle (-\tau_p)^n \frac{{\rm d}^n u}{{\rm d} t^n}(t) \right\rangle \approx \left\langle (-\tau_p)^n v^p \frac{{\rm d}}{{\rm d}y} \left(\cdots v^p \frac{{\rm d}}{{\rm d}y}\left(v^p \frac{{\rm d} u}{{\rm d}y}\right)\right) \right\rangle, \end{equation}
which is of  $O(\delta _p^n)$, with
 $\delta _p \equiv \tau _p v^p$ being the displacement of the particle in the wall-normal direction. Under the assumption of small displacements of particles in the wall-normal direction, the high-order terms can be neglected.
If one assumes that the particle velocities in the wall-normal direction are evenly distributed in the sense of up and down fluctuations, the expansion to second-order terms gives
 \begin{equation} \langle u^p \rangle = \langle u \rangle - \langle \tau_p \rangle \left\langle v^{p\prime} \frac{{\rm d} u'}{{\rm d}y} \right\rangle + \langle\tau_p\rangle^2\left(\frac{{\rm d}\langle k^p \rangle}{{\rm d}y}+ \left\langle \frac{{\rm d} k^p}{{\rm d}y}\frac{{\rm d} u'}{{\rm d}y}\right\rangle\right) + 2\langle\tau_p\rangle^2 \left\langle k^p\frac{{\rm d}^2 u}{{{\rm d}y}^2} \right\rangle, \end{equation}
where ‘ $\prime$’ represents the Reynolds fluctuation, i.e.
 $u=\langle u \rangle + u'$ and
 $k^p\equiv (v^{p\prime })^2/2$. There are three terms to be closed, i.e.
 $\langle v^{p\prime } ({{\rm d} u'}/{{\rm d}y}) \rangle$,
 $\langle ({{\rm d} k^p}/{{\rm d}y})({{\rm d} u'}/{{\rm d}y}) \rangle$ and
 $\langle k^p({{\rm d}^2 u}/{{{\rm d}y}^2}) \rangle$. The first and second terms are closed by gradient diffusion hypothesis and the last term is modelled through the concept of the Prandtl mixing length. As a result, (4.21) is simplified as
 \begin{equation} \langle u^p \rangle = \langle u \rangle + \langle\tau_p\rangle^2 \frac{{\rm d}\langle u \rangle}{{\rm d}y} \left(\frac{\langle k^p \rangle}{l} -\beta \frac{{\rm d} \langle k^p \rangle}{{\rm d}y}\right), \end{equation}
with  $l$ being a length scale and
 $\beta$ a dimensionless parameter. As the distance to the nearest wall is the only length scale in the logarithmic region, it is assumed that
 $l=Re_{\tau } y$ in this paper and the value of
 $\beta$ is fixed with numerical data. It is worth noting that the dimensionless parameter
 $\beta$ can be dependent on the Stokes number of the particles. The detailed derivation of the averaged particle streamwise velocity is given in Appendix B.
5. Results
5.1. Effect of Saffman lift on particle motion
Firstly, the effect of Saffman lift on particle motion is investigated for particles of Stokes number  $St=3$. Three different cases are compared with one another, i.e. single-phase turbulent channel flow (denoted as SP), particle-laden turbulent channel flow with Saffman lift included in particle motion equation (denoted as SL) and particle-laden turbulent channel flow without Saffman lift (denoted as no SL).
Wall accumulation of particles is a typical flow pattern in particle-laden wall-bounded turbulent flows. Shown in figure 6 are spatial-temporal evolutions of the particle number for cases no SL and SL, respectively. The spatial-temporal contours of particle number are plotted in both the inner scale and outer scale of the channel for each case. The particles are uniformly injected into the flow at  $t=0$. When the Saffman lift is absent, the particles are observed to be constantly transported to the near-wall regions. As is seen in figure 6(a), the particles tend to accumulate in the region of
 $y^+<1$ (viscous sublayer) with the advance of time. There are very few particles above the viscous sublayer, as depicted in figure 6(c). However, the numerical results show a totally different trend when the Saffman lift is present. Unlike case no SL, the particles do not exhibit successive movement toward the wall. Meanwhile, the profile of particle number reaches a statistically steady regime within a very short period. By contrast, the case without Saffman lift requires much more time to achieve a statistically steady state. It should be mentioned here that the statistical results presented in what follows are obtained after the case no SL reaches the statistically steady state. The particle number in the viscous sublayer of case SL (figure 6b) is much smaller than that of case no SL. Figure 6(d) allows a better observation of the particle distribution for case SL because the maximum particle number is located at the channel centre. When the Saffman lift is present, the difference in particle numbers within different layers of the channel is not very large along the wall-normal direction. By contrast, the particle number in the viscous layer is more than 5 times that at the centre of the channel in case no SL. Therefore, it is believed that the Saffman lift should significantly reduce the wall accumulation of particles, and rapidly lead the near-wall particle distribution to a statistically steady state. It needs to be emphasized that such an obvious difference in the particle distribution caused by the Saffman lift along the wall-normal direction accounts for all the discrepancies in turbulence modulation, which will be discussed in § 5.2.
Contours of spatial-temporal evolution of particle numbers normalized by the total number of particles in the channel: (a) case no SL in inner coordinates, (b) case SL in inner coordinates, (c) case no SL in outer coordinates and (d) case SL in outer coordinates.

Then, the effects of Saffman lift on the mean particle streamwise velocity and the fluctuating particle velocities are examined as they are very important in understanding and predicting the wall erosion caused by particles. Shown in figure 7 are the mean streamwise velocities for the fluid and particles normalized by the friction velocity  $u_{\tau }$. The numerical results confirm the experimental observation that the particles have little influence on the mean flow as the particles hardly change
 $\langle u \rangle ^+$ (Kulick et al. Reference Kulick, Fessler and Eaton1994). Whether the Saffman lift is present or not, the mean streamwise fluid velocity agrees well with the results of single-phase flow, which obeys the law of the wall. However, the Saffman lift alters significantly
 $\langle u^p \rangle ^+$ in the near-wall region. In a statistical sense, particles under the action of Saffman lift tend to move faster along the streamwise direction than those in the absence of Saffman lift under the buffer layer (
 $\kern0.7pt y^+<10$). This is consistent with the experimental results reported by Kulick et al. (Reference Kulick, Fessler and Eaton1994) for large Stokes numbers, i.e. the mean streamwise velocity profile of particles is flatter than that of the fluid phase in the near-wall region and the corresponding slip velocity between the particle and fluid is substantial. This proves that the particle velocities given by PP DNS with Saffman lift are closer to reality than those obtained by PP DNS without Saffman lift. It should be stressed, however, that the effect of gravity needs to be included in numerical simulations in order to fully explain the experimental observations.
Mean streamwise velocity profiles for fluid phase (lines) and particle phase (symbols). The grey lines are theoretical solutions of incompressible turbulent channel flow.

In addition, Saffman lift will also increase the fluctuating velocities of particles in the near-wall region of  $y^+<10$ in the streamwise, wall-normal and spanwise directions. Depicted in figure 8 are r.m.s. velocity fluctuations of particles normalized by the friction velocity
 $u_{\tau }$. It is manifested in figure 8(a) that Saffman lift will not only augment the mean streamwise particle velocity, but also increase the particle velocity fluctuations in the streamwise direction. Figure 8(b) shows the profile of r.m.s. particle velocity fluctuations in the wall-normal direction, which should naturally be altered by Saffman lift as it is applied in this direction. It is observed that the fluctuating velocity
 $v^{p\prime }$, i.e. the major contributor to the wall-normal particle velocity, tends to decrease from the centre of channel to the wall until it reaches the local minimum at approximately
 $y^+=10$. When the particles go through
 $y^+=10$, they will be accelerated toward the wall. These results correspond to the mean slip velocity
 $\langle u_s \rangle \equiv \langle u(\boldsymbol {x}^p)-u^p \rangle$ derived from figure 7, which decides the direction of Saffman lift. A positive
 $\langle u_s \rangle$ leads to a Saffman lift pointing to the centre of the channel, and a negative one orients the Saffman lift toward the wall. Therefore, there exists a ‘barrier’ at
 $y^+ \approx 10$ pushing the particles away from this position (as illustrated in figure 4). This ‘barrier’ corresponds to the unstable balance point of the particle velocity in the wall-normal direction. It is this ‘barrier’ that maintains the dynamic balance of particle number in the whole channel, unlike the case without Saffman lift, in which the particles are continuously transported toward the wall.
The r.m.s. velocity fluctuations of particles normalized by friction velocity  $u_{\tau }$ with (blue circles) and without (red circles) Saffman lift in the (a) streamwise direction, (b) wall-normal direction and (c) spanwise direction.

To better understand the impact of Saffman lift on particle motion, we show the joint probability density function (p.d.f.) of the particle velocity fluctuations  $u^{p\prime }$ and
 $v^{p\prime }$ in figure 9. The results are classified into four types according to the position of particles in the channel, i.e. viscous sublayer, buffer layer, logarithmic region and wake region. Specifically, the joint p.d.f.s of case SL and case no SL are compared with each other. As can be seen, the Saffman lift influences a lot the joint p.d.f. in the viscous sublayer and buffer layer. With Saffman lift, one can observe two branches of the joint p.d.f. in the viscous sublayer, which intersect at
 $u^{p\prime }\approx -0.3$. The two branches represent the particle rebound caused by the wall condition. However, these two branches cannot be observed when Saffman lift is absent and the centre of the joint p.d.f. is located at the origin, which confirms that particles are captured by the viscous sublayer. Above the buffer layer, the p.d.f. patterns of these two cases are similar to each other in shape but not in strength due to the difference in particle numbers within these regions. In particular, the Q2 and Q4 patterns of particle motion in the buffer region are much more important when Saffman lift is considered. It reveals that Saffman lift will not only increase the near-wall particle velocities, but also change the near-wall motion patterns of particles.
Joint probability distribution function of  $u^{p\prime }$ and
 $v^{p\prime }$ in the viscous sublayer (a,b), buffer layer (c,d), logarithmic region (e, f) and wake region (g,h). Left and right columns are for case SL and case no SL, respectively. Eight contours between the minimum and maximum values of each region are plotted for different cases.

The present numerical results also show that Saffman lift has little effect on the motions of particles in the logarithmic and wake regions where the joint p.d.f.s of two cases are very similar to each other. The little difference in joint p.d.f.s in these two regions is mainly caused by the number of particles. As few particles are present in the logarithmic and wake regions for case no SL, the joint p.d.f. is very spotty due to the lack of sample points.
It should be pointed out that the aforementioned statistical results for the particle velocities are mostly described as being altered at a fixed location or time. To make the discussion more convincing to readers, it is necessary to look into the particle dynamics when it traverses the channel, especially under the buffer region where the Saffman lift is important. Figure 10 shows the position of a particle in the wall-normal direction as a function of its velocity components in the (a) streamwise and (b) wall-normal directions when it travels in the near-wall region. The instantaneous particle is coloured by its acceleration in the corresponding directions. Figure 10(a) confirms that this particle transfers high momentum towards the wall and low momentum away from wall because the particle is decelerated towards the wall and accelerated away from the wall, with the deceleration greater than the acceleration. Figure 10(b) shows how a particle moves in the  $y$ direction within the near-wall region. When the particle travels downwards, the particle is first decelerated and then accelerated before it rebounds from the wall and moves upwards. During its upward movement, the particle velocity in the wall-normal direction starts to oscillate due to the interaction between the particle and turbulence. It is the Saffman lift that accelerates the particle when it approaches the wall, which gives the particle enough momentum to traverse the buffer region. Once the particle leaves the viscous sublayer, the particle velocity in the streamwise direction starts to be accelerated, as seen in figure 10(a).
Wall-normal particle position at different moments vs its velocity components in the (a) streamwise and (b) wall-normal directions. The instantaneous particle (solid circle) is coloured by its acceleration in the same direction. The arrows are oriented to the direction of particle movement.

Figure 11 shows the joint p.d.f. of the particle velocity in the wall-normal direction and particle accelerations under the buffer region at a fixed time. Figure 11(a,b) indicates that there are more particles accelerated and moving away from the wall than those decelerated and moving towards the wall in both the streamwise and wall-normal directions. Interestingly, very few particles are accelerated towards the wall. As a result, the number of particles moving away from the wall is larger than that of particles moving towards the wall. The particles moving towards the wall will transfer high momentum towards the wall and leave with less momentum. Therefore, the mean near-wall particle velocity is mainly determined by the particles moving upwards in a statistical sense. Again, this demonstrates that the streamwise particle velocity is affected by the component in the wall-normal direction.
Joint p.d.f. of particle velocity in the wall-normal direction normalized by  $u_{\tau }$ and particle acceleration normalized by
 $u_{\tau }/\tau ^+$ in the (a) streamwise and (b) wall-normal directions.

5.2. Effect of Saffman lift on turbulence modulation
This section is intended to investigate the effect of Saffman lift on turbulence modulation based on the same numerical simulations as in previous § 5.1, i.e. particle-laden turbulent channel flows with  $St=3$. We first study the turbulence intensities, which are defined as the r.m.s. velocity fluctuations in three different directions as shown in figure 12. It can be observed that the turbulence attenuation caused by particles is very weak in all three directions when Saffman lift is absent. Particularly, the wall-normal and spanwise turbulence intensities in case no SL are very close to the profiles in the clean channel case. By contrast, obvious turbulence attenuation is present in case SL, which leads to the conclusion that Saffman lift will increase the turbulence attenuation. This is because the Saffman lift plays two roles. One is to prevent all particles from being captured by the viscous sublayer, and another is to result in a larger slip velocity in the near-wall region. The former guarantees the existence of enough particles in each layer along the wall-normal direction and the latter makes sure that the feedback force is not too small. These two functions of the Saffman lift finally cause a more important turbulence attenuation.
Turbulence intensities normalized by friction velocity  $u_{\tau }$ in the (a) streamwise direction, (b) wall-normal direction and (c) spanwise direction for cases SP (black solid line), no SL (red dashed line) and SL (blue dash-dotted line).

Another aspect to the study of turbulence modulation is the balance of total stress. Integrating the ensemble-averaged conservation equation of momentum and applying the 1-D statistically steady hypothesis of turbulent channel flow, one obtains
 \begin{equation} \tau(\kern0.7pt y) \equiv \frac{1}{Re} \left \langle \mu\frac{{\rm d} u}{{\rm d}y} \right \rangle- \langle \rho \rangle \{ u''v'' \} + \int_{0}^{y} \langle \varphi_{u1}\rangle (s) \,{\rm d} s = \tau_w \left( 1-\frac{1}{\delta} \int_{0}^{y} \frac{\langle \rho \rangle}{\rho_w}{\rm d} s \right), \end{equation}
in which  $\{\}$ represents the density-weighted average (Favre average) defined as
 $\{{\cdot }\} = \langle \rho {\cdot } \rangle /\langle \rho \rangle$, and
 $''$ denotes the Favre fluctuation. The three terms in (5.1) represent the viscous stress
 $\tau _V$, Reynolds stress
 $\tau _R$ and particle-induced stress
 $\tau _P$, respectively. The numerical results of cases SP, no SL and SL are compared in figure 13. In comparison with the clean channel flow, particles cause a reduction of the Reynolds stress, which also serves as evidence for turbulence attenuation. Similar to the turbulence intensity, the reduction in Reynolds stress is more important when the Saffman lift is considered. Besides, the particle-induced stress in case SL is also greater than that in case no SL. These phenomena can be explained by the same argument as employed for the turbulence intensity.
Profiles of the total stress and its contribution components normalized by  $\tau _w$: (a) case SP (symbols) and case no SL (lines); (b) case SP (symbols) and case SL (lines).

The evolution of turbulent kinetic energy (TKE, defined as  $k\equiv \{u_i''u_i''\}/2$) can help us understand the interphase energy exchange. The equation of TKE reads
 \begin{align} \frac{\partial \langle\rho\rangle k}{\partial t} + \frac{\partial \langle\rho\rangle \{u_j\} k}{\partial x_j} + \frac{\partial T_j''}{\partial x_j} &={-}\langle\rho\rangle \{u_i''u_j''\} \frac{\partial \{u_i\}}{\partial x_j} - \frac{1}{Re} \left\langle \sigma_{ij} \frac{\partial u_i''}{\partial x_j} \right\rangle + \langle u_i''\varphi_{ui}\rangle \nonumber\\ &\quad +\frac{1}{\gamma Ma^2} \left\langle p'\frac{\partial u_j''}{\partial x_j}\right\rangle + \frac{1}{\gamma Ma^2} \langle u_j'' \rangle\frac{\partial \langle p \rangle}{\partial x_j}, \end{align}
with  $T_j'' = \frac {1}{2}\langle \rho u_i''u_i''u_j'' \rangle - ({1}/{Re}) \langle \sigma _{ij}u_i'' \rangle +({1}/{\gamma Ma^2}) \langle p'u_j'' \rangle$ being the turbulent energy flux,
 $\mathcal {P} = -\langle \rho \rangle \{u_i''u_j''\}({\partial \{u_i\}}/{\partial x_j})$ the turbulent production term,
 $\varepsilon = ({1}/{Re}) \langle \sigma _{ij} ({\partial u_i''}/ {\partial x_j}) \rangle \approx 2 ({\langle \mu \rangle }/{Re}) \langle S_{ij}''S_{ij}'' \rangle$ the turbulent dissipation and
 $F_b = \langle u_i''\varphi _{ui}\rangle$ the particle feedback term. Here,
 $({1}/{\gamma Ma^2}) \langle p'({\partial u_j''}/{\partial x_j})\rangle$ and
 $({1}/{\gamma Ma^2}) \langle u_j'' \rangle ({\partial \langle p \rangle }/{\partial x_j})$ are the dilatation and compression by pressure and energy transport by the mean pressure gradient, respectively, which are found to be very small and negligible in compressible turbulent channel flows (Huang, Coleman & Bradshaw Reference Huang, Coleman and Bradshaw1995). In other words, the equation of TKE is dominated by turbulence production, turbulence dissipation and the particle feedback term. Figure 14(a,b) implies that the attenuation of turbulence production and turbulence dissipation is stronger in case SL than in case no SL compared with that in clean channel flow. It needs to be pointed out that the turbulence production and turbulence dissipation in case no SL almost collapse onto the corresponding profiles for clean channel flow. This agrees with our observation for turbulence intensity and Reynolds stress, and proves again that the Saffman lift will increase turbulence attenuation. It is interesting to notice that the particle feedback effect is nearly zero in case no SL. By contrast, the particle feedback term is positive in the viscous sublayer and then becomes negative in the buffer region in case SL. This indicates that the particle feedback force will increase TKE in the viscous sublayer and decrease TKE in the buffer region. However, the particle feedback term is much smaller compared with turbulence production and turbulence dissipation. Therefore, the main effect of the Saffman lift on TKE is the reduction of turbulence production and turbulence dissipation but not the particle feedback term
 $F_b$ itself.
Profiles of turbulence production, turbulence dissipation and particle feedback term in the TKE equation normalized by  $u_{\tau }^2/2$: (a) case SP (symbols) and case no SL (lines); (b) case SP (symbols) and case SL (lines).

The spectral analysis may help one understand the effect of Saffman lift on turbulence structures. Here, the 1-D pre-multiplied spectral energy density is employed, which is defined as  $\phi _{u'u'} = k_z E_{u'u'}(k_z)$, with
 $E_{u'u'}$ being the streamwise TKE spectrum and
 $k_z$ the spanwise wavenumber. Figure 15 displays contours of
 $\phi _{u'u'}$ in the plane of normalized spanwise wavelength
 $\lambda _z^+$ and wall-normal distance in wall units
 $y^+$. The TKE at the wavelength around
 $100\delta _{\nu }$ is massively reduced by particles in the buffer region when Saffman lift is considered. When the Saffman lift is absent, the pattern of pre-multiplied spectral energy density is very similar to that for single-phase flow in the buffer region, which suggests that the particles in the no SL case seem not to modulate the near-wall fluid streaks. Depicted in figure 16(a,b) are contours of
 $u'$ in the buffer layer (
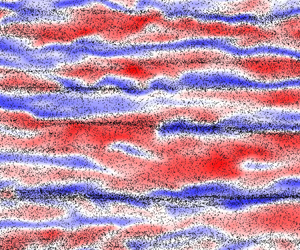
 $\kern0.7pt y^+ \approx 10$) and all the particles located below this layer for cases SL and no SL, respectively. On the one hand, there exist clear small-scale particle streaks in the near-wall region while the Saffman lift is absent due to an intermediate particle inertia (Jie et al. Reference Jie, Cui, Xu and Zhao2022). The spanwise length scale of near-wall small-scale particle streaks is of the order
 $\sim 100 \delta _{\nu }$ (Sardina et al. Reference Sardina, Picano, Schlatter, Brandt and Casciola2011), which is the same as that of the near-wall fluid streaks in single-phase channel flow (Kim, Moin & Moser Reference Kim, Moin and Moser1987). Unlike the fluid streaks, the collaborative behaviour of the particles renders the particle streaks very long and straight (Sardina et al. Reference Sardina, Picano, Schlatter, Brandt and Casciola2011). These collective particle streaks are pretty much like long streamwise fins embedded on the walls, which tend to separate the near-wall fluid streaks, as observed in figure 16(b). On the other hand, Saffman lift reduces significantly the wall accumulation of particles when it is included in the particle motion equation. Consequently, Saffman lift prevents the particles from forming streak-like structures, as observed in figure 16(a).
Contours of 1-D pre-multiplied spectral energy density  $\phi _{u'u'}$ in the plane of spanwise wavelength and wall-normal distance in wall units: (a) case SP, (b) case SL and (c) case no SL. Eight contours are plotted between 0.1 and 0.8 times the maximum value based on the single-phase flow.

Contours of instantaneous streamwise velocity fluctuation  $u'$ in the normalized
 $x$–
 $z$ plane at
 $y^+ \approx 10$ overlaid on particles below this layer: (a) case SL and (b) case no SL.

The modulation of very-large-scale motion (VLSM) suggested by (Wang & Richter Reference Wang and Richter2019) is not observed in the present simulation due to the small Reynolds number. However, the large-scale motion (LSM), which is represented by the ‘handle-like’ structure located at  $y^+ \approx 100$ (logarithmic region) of length scale
 $400<\lambda _z^+<500$ in figure 15(a), is modulated by inertial particles and shows different patterns in case no SL and case SL. This ‘handle’ bends to
 $y^+ \approx 40$ in case SL (figure 15b) and vanishes in case no SL (figure 15c). In case SL, the intense particle concentration in the logarithmic region (see figure 6b) prevents the LSM from penetrating into the outer region, which limits LSM under the upper edge of the buffer region. In case no SL, the particle accumulation in the near-wall region (see figure 6a) breaks the LSM structures. Therefore, It is believed that the inertial particles not only directly modulate the turbulence but also change the interaction among multi-scale turbulence structures due to particle concentration or clustering along the wall-normal direction.
5.3. Validation of theoretical criterion and models
In this section, the Saffman lift is included in all numerical simulations. The aim is to validate the criterion for neglecting Saffman lift given by (4.5) and the mean streamwise particle velocity model formulated as (4.22) by considering various Stokes numbers. Specifically, numerical simulations with mono-dispersed particles ( $\rho _p = 1600$) are carried out by setting
 $St$ to
 $0.5$,
 $0.7$,
 $1$,
 $2$,
 $3$ and
 $5$.
First of all, the Stokes number (or inertia) effect on particle motion is evaluated as shown in figure 17. The mean streamwise particle velocities at  $St=0.5$,
 $0.7$ and
 $1$ are very small in the near-wall region, and nearly collapse onto the profile of the mean streamwise velocity of a clean channel flow (black solid line in figure 17a). This is very similar to the result of the case without Saffman lift at
 $St=3$ in § 5.1. When the particle diameter
 $d^+$ is larger than the critical value (
 $d_c^+=0.438$), the mean streamwise particle velocity behaves similarly to that in case SL, i.e. the near-wall particle velocity is larger than that of the background flow. A similar phenomenon can be observed for fluctuating particle velocities. All this evidence leads us to the conclusion that Saffman lift can be neglected for particles of
 $d^+< d_c^+$ (or equivalently
 $St< St_c$) in wall-bounded particle-laden turbulent flows. It is clearly seen from figure 17 that the Saffman lift cannot be neglected for the cases with
 $St>2$ (corresponding to the particle diameter
 $d^+ > 0.587$). In fact, the particle diameters (
 $d^+$) in these cases are all smaller than
 $1$ (as can be seen from table 1), which declares the failure of the criterion
 $d^+ < 1$ proposed by Costa et al. (Reference Costa, Brandt and Picano2020a). By contrast, the new theoretical criterion for neglecting Saffman lift agrees very well with the present numerical results.
Profiles of (a) mean streamwise particle velocity and r.m.s. fluctuating particle velocities in the (b) streamwise, (c) wall-normal and (d) spanwise directions normalized by the wall friction velocity. Mean streamwise velocity of the background flow (black solid line) is also included in (a) for comparison purposes.

Another issue is the particle-to-fluid density ratio effect on turbulence modulation at the same  $St$ when keeping the particle volume fraction or mass fraction the same. To this end, a series of simulations is conducted to compare the TKE in single-phase turbulent channel flow with that in turbulent channel flows laden with particles of different densities. The particle Stokes number and particle mass loading are fixed to
 $St=2$ and
 $\varPhi _m = 0.1$, respectively. According to the criterion for neglect of the Saffman lift in either its particle diameter version or its Stokes number version given in this manuscript, the Saffman lift is considered to be negligible for particles with density ratio
 $\rho _p/\rho > 1000St/0.7=2000/0.7 \approx 2860$, or equivalently a diameter normalized by the wall viscous length scale of less than
 $0.438$. Figure 18(a) depicts the TKE in case SP and cases with particles of different densities under the action of Saffman lift. The numerical results show that the TKE is attenuated by inertial particles and the level of turbulence attenuation decreases with the increasing particle density. When the particle-to-fluid density ratio equals
 $4500$ or
 $7800$, the attenuation of TKE is weaker than in other cases. However, it is hard to arrive at the conclusion that the Saffman lift plays very little role in turbulence modulation when the criterion is satisfied. It can be observed that, as long as Saffman lift is present, the near-wall turbulence is modified regardless of the particle-to-fluid density ratio. By contrast, figure 18(b) confirms again the conclusion that Saffman lift can be neglected for particle motion when the previous criterion is satisfied. Therefore, the newly proposed criterion is intended to describe the effect of shear-induced lift on particle motion, and the Saffman lift is probably non-negligible for turbulence modulation even when it may not be very important for particle motion.
(a) The TKE normalized by  $u_{\tau }^2$ of the background fluid and (b) the mean streamwise particle velocity in turbulent channel flow laden with particles at
 $St=2$ with different particle densities.

Then, the streamwise particle velocity  $\langle u^p \rangle$ is found to be obviously associated with the Stokes number as shown in figure 17(a). Understanding and predicting the behaviour of
 $\langle u^p \rangle$ can be of importance for further study of the particle erosion dynamics. A second-order approximation of
 $\langle u^p \rangle$ is provided in § 4.2 as shown in (4.22). Both the present numerical results and theoretical result are plotted in figure 19 for different Stokes numbers. For the particles with
 $St$ smaller than the critical value, the theoretical model fits very well with the numerical simulations. For the particles with
 $St$ larger than the critical value, the theoretical model can recover major information of
 $\langle u^p \rangle$ down to the near-wall regions, except the region
 $y^+<1$. The reasonable explanations are twofold, i.e. the statistical aspect and the model aspect. There exist incomplete statistics due to the lack of particles in the very near-wall region, as shown in figure 6, which will introduce oscillations in the calculation of the gradient of
 $\langle k^p \rangle$. Besides, combining (3.1) and (3.2), one obtains that the total particle number decreases with the increase of Stokes number when the mass loadings for different cases are the same as one another. Therefore, the larger the Stokes number is, the fewer the particles existing in the near-wall region. In other words, the incompleteness of the statistics is more serious in the near-wall region for large Stokes number. Thus, the present theoretical model works worse for the region
 $y^+<1$ for large Stokes numbers (such as
 $St=5$) than for smaller ones. The second-order approximation may be another reason for the inaccurate prediction in the near-wall region. However, the theoretical estimation agrees pretty well with numerical simulations in a general view. It is believed that this model can be extended to various wall-bounded flows and inhomogeneous turbulence owing to the generality of (4.16).
Profiles of mean streamwise particle velocity from the present numerical simulations (black solid lines) and theoretical model (4.22) (symbols) for different Stokes numbers: (a)  $St=0.5$; (b)
 $St=0.7$; (c)
 $St=1$; (d)
 $St=2$; (e)
 $St=3$; ( f)
 $St=5$.

Furthermore, the success of this theoretical model also proves that the use of the particle velocity in the development of  ${\rm d} u/{\rm d} t$, i.e. (4.16), is better than the fluid velocity seen at the particle position, as in Maxey's model, for large inertial particles. In Maxey's model, the wall-normal particle velocity is replaced by the wall-normal fluid velocity. Repeating the same derivation as in Appendix B and expanding
 $\langle u^p \rangle$ to the first order, one obtains
 \begin{equation} \langle u^p \rangle \approx \langle u \rangle - \left\langle v'\frac{{\rm d} u'}{{\rm d}y} \right\rangle \langle \tau_p \rangle. \end{equation}
The first-order term can be rewritten as
 \begin{equation} \langle u^p \rangle \approx \langle u \rangle - \left(\frac{{\rm d} \langle u'v' \rangle}{{\rm d}y}- \left\langle u'\frac{{\rm d} v'}{{\rm d}y} \right\rangle \right) \langle \tau_p \rangle. \end{equation}
Introducing the turbulent dilatation term  $\theta ' \equiv {\partial u'}/{\partial x} + {\partial v'}/{\partial y} + {\partial w'}/{\partial z}$, (5.4) can be reorganized as
 \begin{equation} \langle u^p \rangle \approx \langle u \rangle - \left(\frac{{\rm d} \langle u'v' \rangle}{{\rm d}y}- \langle u'\theta' \rangle - \left\langle u'\frac{\partial u'}{\partial x} \right\rangle -\left\langle u'\frac{\partial w'}{\partial z} \right\rangle \right) \langle \tau_p \rangle. \end{equation}
Under the 1-D hypothesis of channel flow, the terms containing partial derivatives with respect to  $x$ and
 $z$ are negligible. The Reynolds stress in the very near-wall region is also insignificant. The dilatation term is generally very small compared with other terms in compressible channel flow (Huang et al. Reference Huang, Coleman and Bradshaw1995). As a result, Maxey's model gives
 \begin{equation} \langle u^p \rangle (\kern0.7pt y^+ \to 0) \approx \langle u \rangle (\kern0.7pt y^+ \to 0) = 0, \end{equation}
which implies that  $\langle u^p \rangle$ in the near-wall region is always zero regardless of the Stokes number and the particle trajectory along the wall-normal direction. This is obviously unreasonable and does not agree with the experimental and numerical results for particles of large Stokes number. Again, Maxey's model can be applied to the particles of Stokes number smaller than the critical value because Saffman lift does not play an important role, and therefore the particle velocity in the wall-normal direction is approximately equal to the fluid velocity in the wall-normal direction. However, Maxey's model is no longer valid when the Saffman lift effect is non-negligible. This manifests that the new model can be applied to a wider range of Stokes number and contains more physical information than Maxey's model.
In addition, it is necessary to discuss a little about the weakness and prospectives of the present theoretical model (4.22). To the authors’ knowledge, this is the first time a theoretical model has successfully predicted the mean streamwise particle velocity profile in turbulent channel flow. However, the determination of the dimensionless parameter  $\beta$ in this model is still an open question. The present data-based method is evidently not good enough. What is more, the parameter
 $\beta$ may be dependent on the Reynolds number and Mach number, which needs to be evaluated in further studies. The authors believe that the closure of the present model can also be improved. It should be mentioned that the methodology developed in this paper can be extended to all types of wall-bounded turbulent flows. Therefore, it is encouraging to establish and test this methodology in other particle-laden wall-bounded flows such as boundary layer and pipe flows.
6. Conclusions and discussion
In this paper, we investigate the Saffman lift effect on particle motion and turbulence modulation by PP DNS of low Mach number turbulent channel flow laden with mono-dispersed heavy particles.
The numerical results for the case of  $St=3$ show that the Saffman lift can significantly reduce the strength of turbophoresis and the near-wall accumulation of particles. Without the Saffman lift, the particles will be constantly transferred to the wall and concentrate therein. As a consequence, the majority of the particles will be eventually captured by the viscous sublayer. However, Saffman lift will lead the profile of the particle distribution to the statistically steady regime in a very short period, and the particles are mostly distributed in the logarithmic and central regions of the channel. Besides, Saffman lift can also increase the near-wall particle velocities. The wall rebound and sweep–ejection events of particles are also enhanced by Saffman lift beneath the logarithmic region.
Furthermore, the statistical results reveal that Saffman lift tends to augment the turbulence attenuation caused by small particles. The turbulence intensity, Reynolds stress, turbulence production and turbulence dissipation are all found to be smaller when the Saffman lift is present. This is because that Saffman lift not only enhances the near-wall particle-to-fluid slip velocity but also increases the number of particles in the buffer and logarithmic regions. Spectral analysis indicates that Saffman lift inhibits the formation of near-wall particle streaks and restricts the structures of LSM under the upper edge of the buffer region.
Moreover, a theoretical condition is established for neglecting Saffman lift in the particle motion equation, suggesting that the particle diameter should be smaller than the critical value  $d_c^+$, which is approximately 0.438. The new criterion is equivalent to a critical particle Stokes number based on the Kolmogorov time scale at the centre plane
 $St_c \approx 0.7 \rho _p/(1000\rho )$. The new criterion is more accurate than the Costa–Brandt–Picano criterion. The present numerical results confirm the new criterion. It is observed that the particle velocity profiles are very similar to the results without Saffman lift when the Stokes number is smaller than the critical value. This demonstrates that the influence of Saffman lift on particle motion is negligible for small Stokes number cases. However, the effect of Saffman lift on turbulence modulation seems not to be negligible even when it can be neglected for the particle motion.
In addition, we propose a new methodology to theoretically reproduce the profile of the mean streamwise velocity of particles. Following Maxey's pioneering work, the new method replaces the classical material derivative along a fluid particle trajectory with the material derivative along a solid particle trajectory. Based on the small displacement assumption and a 1-D statistically steady hypothesis, the mean streamwise particle velocity can be expanded to the second order, and then closed by the gradient diffusivity model and the mixing length model. The newly obtained model demonstrates that the streamwise particle velocity is dependent on the wall-normal component, which explains why the Saffman lift alters the profile of the streamwise velocity of solid particles. The numerical results manifest that the new model successfully reproduces the streamwise particle velocity at different Stokes numbers.
Acknowledgements
Numerical simulations were carried out on the Polars computing platform of Peking University in Beijing, China. Special thanks are addressed to X. Li for providing the single-phase fluid solver Opencfd-SC Ver 2.2b. The authors would also like to express their sincere thanks to the referees whose comments contributed a lot to improving the quality of this paper.
Funding
The authors acknowledge the financial supports provided by National Natural Science Foundation of China under grants No. 92152202 and No. 11988102.
Declaration of interests
The authors report no conflict of interest.
Appendix A
To address the validity of Saffman lift model, performances of the original Saffman lift (Saffman Reference Saffman1965, Reference Saffman1968) and a new lift model proposed by Costa et al. (Reference Costa, Brandt and Picano2020b) are compared with each other in this appendix. Marchioli & Soldati (Reference Marchioli and Soldati2002) suggest approximating the lift as a 1-D force along the wall-normal direction in the boundary layer. However, the lift is indeed a 3-D force according to its definition. Therefore, the dimensional effect of the lift model is also studied in this appendix. Specifically, four different forms of lift models are employed in the validation tests, i.e. the 1-D and 3-D original Saffman lift models (denoted by Saffman 1D and Saffman 3D, respectively), and the 1-D and 3-D Costa lift models (Costa et al. Reference Costa, Brandt and Picano2020b) (denoted by Costa 1D and Costa 3D, respectively). These four different lift models are used to simulate turbulent channel flow laden with particles of density  $\rho _p = 1600$ and diameter
 $d^+ = 0.718$, which can be found in table 1.
The lack of proper and reliable experimental or PR numerical data makes validation of the force model employed in the PP simulation very difficult. Listed in table 2 are some of the experiments and PR DNS of particle-laden turbulent channel flows with the corresponding friction Reynolds number of turbulent channel flow, particle diameter in wall units and particle-to-fluid density ratio. On the one hand, the experiments are usually conducted at high Reynolds numbers, which are computationally expensive and hard to achieve for numerical simulations. On the other hand, PR DNS mimics mostly finite-sized particles of small particle-to-fluid density, which is also problematic for PP simulation. Costa et al. (Reference Costa, Brandt and Picano2020a) compared PP and PR simulations for particles of  $d^+ = 3$ in a channel flow at
 $Re_{\tau } = 180$. However, the particle size is larger than the smallest turbulence length scale in turbulent channel flow, which leads to the collapse of the PP hypothesis. Hence, the employment of PP DNS and its accuracy in this case is questionable. The low particle-to-fluid density ratio (such as the neutrally buoyant particles considered by Peng et al. Reference Peng, Ayala and Wang2019) invalidates the simplification of the Tsai–Maxey–Riley equation because the added mass force needs to be taken into account for light particles. Therefore, the validation of the current PP DNS requires that the data should have the following characteristics: small friction Reynolds number, small particle size satisfying the PP hypothesis and large particle-to-fluid density ratio such that the particle's motion is dominated by the Stokes drag. With these conditions in mind, the experimental data reported by Fong et al. (Reference Fong, Amili and Coletti2019) are the best choice because the corresponding Reynolds number, particle size and particle-to-fluid density ratio are all very similar to those in the present PP simulation.
Characteristic parameters of gas-particle turbulent channel flows in several experimental and PR DNS studies. Unless otherwise pointed out in the cited references, the parameters are calculated using the information therein.

Depicted in figure 20(a) are profiles of the mean streamwise particle velocities calculated by using the different lift models and normalized by the wall friction velocity. The numerical results show that the 1-D and 3-D Saffman lift models give very similar mean streamwise particle velocities. However, Costa 3D leads to a much lower profile of mean streamwise particle velocity in comparison with the other lift models. Due to the limitation of the experimental measurement technique, it is difficult to obtain the particle velocity in the very near-wall region ( $\kern0.7pt y^+<5$). Thus, the present numerical results can be compared with the experimental data only above the viscous sublayer. It can be seen that Costa 3D tends to underestimate the particle velocities in the buffer region, where the Saffman lift plays a very important role. By contrast, the original Saffman lift can approximately recover the experimental observation in the buffer region. A similar conclusion can be reached by inspecting figure 20(b), where the root-mean-square streamwise particle velocity fluctuations given by Saffman 1D and Saffman 3D are very similar to each other. The particle velocity fluctuation given by Costa 3D in the near-wall region is much smaller than those by other models. Although all the four lift models cannot accurately capture the particle velocity fluctuation in the near-wall region, the particle velocity fluctuations predicted by using the original Saffman lift models is closer to the experimental observation.
Profiles of the (a) mean streamwise particle velocities normalized by the friction velocity  $u_{\tau }$ and (b) r.m.s. fluctuating streamwise particle velocities normalized by the mean streamwise fluid velocity at the central plane
 $U_{cp}$ obtained by using different lift models (lines). The corresponding experimental data from Fong et al. (Reference Fong, Amili and Coletti2019) (circles) are also included for comparison.

In summary, the original 1-D and 3-D Saffman lift models have similar performances and can give a particle dynamics much closer to the experimental observations in comparison with the Costa model. Therefore, the original Saffman lift or other corrected form of Saffman lift is suggested when the shear-induced lift needs to be taken into consideration. It should be pointed out that the gravity effect of particles is not involved for comparison study in this paper. Even though it is argued that the Froude number is large and the gravity effect is negligible (Fong et al. Reference Fong, Amili and Coletti2019), gravity can still play its part in the vicinity of the wall where the fluid velocity is nearly zero. Therefore, it is better for the gravity effect to be included to effectively validate the PP DNS with experiments. Besides, it is strongly suggested that PR DNS of small particles with high particle-to-fluid density ratio should be carried out by the academic community as a benchmark for PP DNS.
Appendix B
The details of the derivation of (4.22) are given as follows. The expansion of the mean streamwise particle velocity in (4.18) to the second order gives
 \begin{equation} \langle u^p \rangle \approx \langle u \rangle - \left\langle \tau_p \frac{{\rm d} u}{{\rm d} t}(t) \right\rangle + \left\langle \tau_p^2 \frac{{\rm d}^2 u}{{\rm d} t^2}(t) \right\rangle, \end{equation}
with the material derivative given by (4.16). Thus
 \begin{align} \left\langle \tau_p \frac{{\rm d} u}{{\rm d} t}(t) \right\rangle &= \left\langle \tau_p \left( \frac{\partial u}{\partial t}+u^p \frac{\partial u}{\partial x} + v^p\frac{\partial u}{\partial y}+ w^p \frac{\partial u}{\partial z} \right) \right\rangle \nonumber\\ &\approx \left\langle \tau_p v^p\frac{{\rm d} u}{{\rm d}y} \right\rangle, \end{align}
under the 1-D statistically steady hypothesis of turbulent channel flow. Therefore, the second-order approximation of the mean streamwise velocity of particle reads
 \begin{align} \langle u^p \rangle &\approx \langle u \rangle - \left\langle \tau_p v^p\frac{{\rm d} u}{{\rm d}y} \right\rangle + \left\langle \tau_p^2 v^p\frac{{\rm d}}{{\rm d}y} \left( v^p \frac{{\rm d} u}{{\rm d}y}\right) \right\rangle \nonumber\\ &\approx \langle u \rangle - \left\langle \tau_p v^p \frac{{\rm d} u}{{\rm d}y} \right\rangle + \left\langle \tau_p^2 v^p\frac{{\rm d} v^p}{{\rm d}y} \frac{{\rm d} u}{{\rm d}y} \right\rangle + \left\langle \tau_p^2 {v^p}^2 \frac{{\rm d}^2 u}{{{\rm d}y}^2} \right\rangle. \end{align}
From the Reynolds decomposition of the particle wall-normal velocity  $v^p = \langle v^p \rangle + v^{p\prime }$,
 $v^p$ can be well approximated by the fluctuation velocity
 $v^{p\prime }$ as the mean value is much smaller compared with the fluctuating part. Therefore, (B3) can be rewritten as
 \begin{align} \langle u^p \rangle &\approx \langle u \rangle - \left\langle \tau_p v^{p\prime} \frac{{\rm d} u}{{\rm d}y} \right\rangle + \left\langle \tau_p^2 v^{p\prime}\frac{{\rm d} v^{p\prime}}{{\rm d}y} \frac{{\rm d} u}{{\rm d}y} \right\rangle + \left\langle \tau_p^2 {v^{p\prime}}^2 \frac{{\rm d}^2 u}{{{\rm d}y}^2} \right\rangle \nonumber\\ &\approx \langle u \rangle - \langle v^{p\prime} \tau_p^{\prime}\rangle \frac{{\rm d} \langle u \rangle}{{\rm d}y} - \left\langle v^{p\prime} \frac{{\rm d} u^{\prime}}{{\rm d}y} \right\rangle \langle \tau_p \rangle - \left\langle \tau_p^{\prime} v^{p\prime} \frac{{\rm d} u^{\prime}}{{\rm d}y} \right\rangle \nonumber\\ &\quad +\langle\tau_p \rangle^2 \frac{{\rm d} \langle u \rangle}{{\rm d}y} \left\langle\frac{{\rm d} k^p}{{\rm d}y}\right\rangle + \left\langle \frac{{\rm d} u'}{{\rm d}y} \frac{{\rm d} k^p}{{\rm d}y}\right\rangle \langle\tau_p \rangle^2 + 2 \left\langle \tau_p^{\prime} \frac{{\rm d} k^p}{{\rm d}y} \right\rangle \langle\tau_p \rangle \frac{{\rm d} \langle u \rangle}{{\rm d}y} \nonumber\\ &\quad + 2 \left\langle \tau_p^{\prime} \frac{{\rm d} u'}{{\rm d}y} \frac{{\rm d} k^p}{{\rm d}y} \right\rangle \langle\tau_p \rangle + \left\langle {\tau_p^{\prime}}^2 \frac{{\rm d} k^p}{{\rm d}y} \right\rangle \frac{{\rm d} \langle u \rangle}{{\rm d}y} + \left\langle {\tau_p^{\prime}}^2 \frac{{\rm d} u'}{{\rm d}y} \frac{{\rm d} k^p}{{\rm d}y} \right\rangle \nonumber\\ &\quad +2 \langle k^p \rangle \langle\tau_p \rangle^2 \frac{{\rm d}^2 \langle u \rangle}{{{\rm d}y}^2} + 2 \left\langle k^p \frac{{\rm d}^2 u'}{{{\rm d}y}^2} \right\rangle \langle\tau_p \rangle^2 + 4\langle \tau_p^{\prime} k^p \rangle \langle\tau_p \rangle \frac{{\rm d}^2 \langle u \rangle}{{{\rm d}y}^2} \nonumber\\ &\quad +4\left\langle \tau_p^{\prime} k^p \frac{{\rm d}^2 u'}{{{\rm d}y}^2} \right\rangle \langle\tau_p \rangle + 2\langle {\tau_p^{\prime}}^2 k^p \rangle \frac{{\rm d}^2 \langle u \rangle}{{{\rm d}y}^2} + 2\left\langle {\tau_p^{\prime}}^2 k^p \frac{{\rm d}^2 u'}{{{\rm d}y}^2} \right\rangle. \end{align}
The above expansion can be further simplified by neglecting all high-order fluctuations and the terms regarding the fluctuating particle relaxation time, which is very small at low Mach numbers. Thus, the simplified approximation for  $\langle u^p \rangle$ takes the form
 \begin{align} \langle u^p \rangle &\approx \langle u \rangle - \left\langle v^{p\prime} \frac{{\rm d} u^{\prime}}{{\rm d}y} \right\rangle \langle \tau_p \rangle + \langle\tau_p \rangle^2 \frac{{\rm d} \langle u \rangle}{{\rm d}y} \frac{{\rm d} \langle k^p \rangle}{{\rm d}y} + \left\langle \frac{{\rm d} u'}{{\rm d}y} \frac{{\rm d} k^p}{{\rm d}y}\right\rangle \langle\tau_p \rangle^2 \nonumber\\ &\quad + 2 \langle k^p \rangle \langle\tau_p \rangle^2 \frac{{\rm d}^2 \langle u \rangle}{{{\rm d}y}^2} +2 \left\langle k^p \frac{{\rm d}^2 u'}{{{\rm d}y}^2} \right\rangle \langle\tau_p \rangle^2. \end{align}
There are three terms to be closed in (B5), i.e.  $\langle v^{p\prime } ({{\rm d} u^{\prime }}/{{\rm d}y}) \rangle$,
 $\langle ({{\rm d} u'}/{{\rm d}y})({{\rm d} k^p}/{{\rm d}y}) \rangle$ and
 $\langle k^p ({{\rm d}^2 u'}/{{{\rm d}y}^2}) \rangle$. The first term can be closed by the gradient diffusivity hypothesis as
 \begin{equation} \left\langle v^{p\prime} \frac{{\rm d} u^{\prime}}{{\rm d}y} \right\rangle = \tau \frac{{\rm d} \langle k^p \rangle}{{\rm d}y} \frac{{\rm d} \langle u \rangle}{{\rm d}y}, \end{equation}
with  $\tau$ being an unknown time. The second term is closed by assuming that the gradient of fluctuation is proportional to that of mean flow, i.e.
 \begin{equation} \left\langle \frac{{\rm d} u'}{{\rm d}y} \frac{{\rm d} k^p}{{\rm d}y} \right\rangle = c_1 \frac{{\rm d} \langle k^p \rangle}{{\rm d}y} \frac{{\rm d} \langle u \rangle}{{\rm d}y}, \end{equation}
with  $c_1$ being a dimensionless parameter. The last term is modelled based on the classical Prandtl mixing length theory by
 \begin{equation} \left\langle k^p \frac{{\rm d}^2 u'}{{{\rm d}y}^2} \right\rangle = \frac{1}{l_1} \langle k^p \rangle \frac{{\rm d} \langle u \rangle}{{\rm d}y}, \end{equation}
with  $l_1$ being the mixing length. Substituting (B6), (B7) and (B8) into (B5) yields
 \begin{equation} \langle u^p \rangle \approx \langle u \rangle - \langle \tau_p \rangle^2 \frac{{\rm d} \langle k^p \rangle}{{\rm d}y} \frac{{\rm d} \langle u \rangle}{{\rm d}y} \left(\frac{\tau}{\tau_p}-1-c_1\right) + 2\langle \tau_p \rangle^2 \langle k^p \rangle \left(\frac{1}{l_1}\frac{{\rm d} \langle u \rangle}{{\rm d}y}+ \frac{{\rm d}^2 \langle u \rangle}{{{\rm d}y}^2}\right). \end{equation}
Here,  $\beta \equiv {\tau }/{\tau _p}-1-c_1$ is a dimensionless parameter, which is dependent on the particle Stokes number as
 $\tau$ comes from the closure model of the particle velocity. The second-order derivative of
 $\langle u \rangle$ with respect to
 $y$ can also be estimated by the gradient of
 $\langle u \rangle$ over a length scale
 $l_2$. Finally, the effect of
 $l_1$ and
 $l_2$ can be reflected by a single length scale
 $l$, i.e.
 \begin{align} \langle u^p \rangle &\approx \langle u \rangle - \beta(St) \langle \tau_p \rangle^2 \frac{{\rm d} \langle k^p \rangle}{{\rm d}y} \frac{{\rm d} \langle u \rangle}{{\rm d}y} + \frac{1}{l}\langle \tau_p \rangle^2 \langle k^p \rangle \frac{{\rm d} \langle u \rangle}{{\rm d}y} \nonumber\\ &= \langle u \rangle + \langle \tau_p \rangle^2 \frac{{\rm d} \langle u \rangle}{{\rm d}y} \left(\frac{\langle k^p \rangle}{l} - \beta(St)\frac{{\rm d} \langle k^p \rangle}{{\rm d}y} \right). \end{align}
Specifically, the classical mixing length is used as the length scale, i.e.  $l=Re_{\tau } y$. The values of
 $\beta$ obtained using the numerical data are given as a function of
 $St$ in figure 21. The numerical results manifest that
 $\beta$ obeys a power law in regard to particle Stokes number.
The values of  $\beta$ vs different particle Stokes numbers obtained using numerical simulation data (red solid circles). The black solid line denotes a power law of
 $\beta \sim St^{-1.77}$.



