I. INTRODUCTION
The application areas of structural steel are numerous. 45 steel is the most widely used structural steel due to its good comprehensive properties, including tensile strength, plasticity, toughness as well as its low cost. It is generally used to produce shafts, crankshafts, gear wheels, plunger pistons, bushes, and connecting rods.Reference Yan and Zhu1, Reference Yang, Chen, Liu, Zhong, Wang and Kokawa2 However, its poor resistance to sliding wear limits it for a wider range of applications. It is important to enhance its wear and corrosion resistance and increase its surface hardness by some kind of surface treatment.Reference Ma, Li and Xu3 Wear resistance coatings produced by conventional techniques are not good enough in some cases.Reference Zlatanovic, Gredic, Kunosic, Backovic and Whittle4 In recent years, laser cladding technique has been used widely due to the extraordinarily distinct advantages of laser cladding, such as negligible distortion, low dilution, high hardness, narrow heat-affected zone (HAZ), reduced cracking susceptibility, and excellent metallurgical bond at the coating/substrate interface.Reference Lei, Sun, Lei, Tang and Niu5
A great variety of clad materials have been deposited on steels. Pei et al.Reference Pei and Zuo6 produced a gradient TiC–Ni composite coating by laser cladding with preplaced powder mixtures on 1045. The clad coatings consisted of TiC particles, γ-Ni primary dendrites, and interdendritic eutectics. Zhang et al.Reference Zhang, Li and Lei7, Reference Zhang, Lei and Li8 fabricated coatings on 1045 by laser cladding using Cr3C2 particles coated with Ni–Cr alloy and Ni–base alloy. The microhardness of Cr3C2/(Ni + Cr) composite coatings was 350–400 HV higher than that of the Ni–base alloy coating. The composite coatings also possess higher wear resistance than Ni–base alloy coating under the dry sliding wear. Li et al.Reference Li, Lei and Chen9 clad TiC–NiCrBSiC composite coatings on 1045 substrate. The coating consisted of TiCp particles, feather-like colonies (CrB distributed in γ-Ni solid solution) and a small amount of (γ-Ni + M23C6) eutectics. Tobar et al.Reference Tobar, Álvarez, Amado, Rodríguez and Yáñez10 fabricated composite WC–NiCrBSi coatings on stainless steel by laser cladding. When the fraction of WC particles was <50%, homogeneous, dense, and crack-free clad layers were obtained, with hardness ranging between 600 and 1000 HV.
Due to the interaction of processing parameters, such as the laser beam properties, scanning velocity and the thickness of the preplaced layer, the localized nature of laser energy, and high heating and cooling rate, it is difficult to monitor the cladding process.Reference Sun, Wang, Tang and Yang11 Few experimental or theoretical literature about the thermodynamics taking place during the laser cladding process have been published.
In laser cladding, the clad material can be either preplaced on the substrate or injected into the molten pool with powder form. The preplaced layer has a better absorption of laser energy and lower thermal conductivity than the bulk material because of the pores present in the layer. It ensures that the laser energy is absorbed by the preplaced layer more easily and excessive melting of the substrate would not occur.Reference Tam, Cheng and Man12 In fact, cladding materials in the laser surface modification of steel were usually introduced by preplacement as reported by other groups to circumvent the high reflectivity of steel.Reference Viswanathan, Sastikumar, Rajarajan, Kumar and Nath13, Reference Chen and Wang14 So the preplaced cladding technique was selected to prepare Ni–base alloy coatings on 45 steel in the present study.
To gain a deep and theoretical understanding of the laser cladding process, Ni–base alloy coatings were prepared on the surface of 45 steel by laser cladding using Ni–base alloy powders, and a detailed analysis of the phase constituents and microstructure of the coatings was carried out. The temperature-dependent phase fractions and phase compositions in the coatings on 45 steel were calculated using the most developed Thermo-Calc software.Reference Sundman, Jansson and Andersson15 Combining with the calculated temperature-dependent phase fractions and phase compositions, the solidification process, precipitation behavior, and reaction scheme of the coatings during the laser cladding process were analyzed.
II. EXPERIMENTAL PROCEDURE
45 steel with dimensions of 50 × 20 × 10 mm was used as the substrate. The substrate was ground to a surface finish of Ra = 0.2 μm using abrasive paper and rinsed with acetone prior to the cladding process to remove the surface oxide and to enhance the adhesion to preplaced layer. Ni–base alloy powders, with composition (wt%) of: 16.0 Cr, 3.3 B, 0.9 C, 8 Fe, and balance Ni, were used as the clad material. Ni–base alloy powders were mixed with 4 wt% polyvinyl alcohol (PVA) to form a slurry and then pasted onto the substrate surface. The thickness of the preplaced layer was controlled to about 1.0 mm. This was done by taping the edges of the substrate with a relatively thick adhesive tape and then the slurry pasted on the substrate was leveled with the tapes using a knife edge and gently polished to ensure the thickness of the preplaced layer. The samples were dried in an electric furnace at 120 °C under argon protective atmosphere to vaporize the water moisture and part of PVA prior to laser cladding. The remaining chemical binder will be completely degraded during the cladding process.
Laser cladding was performed on a CW ML-108 CO2 laser processing system. To optimize the processing parameters, a number of clad tracks were produced by varying laser power P in the range of 2–5 kW, the laser beam diameter D in the range of 5–8 mm and the scanning velocity V in the range of 3–10 mm/s. The optimal process parameters selected for laser cladding were: laser power P = 4 kW, scanning velocity V = 8 mm/s, and laser beam diameter D = 6 mm. Laser cladding was carried out under Ar protective atmosphere, using side jet shielding with Ar flux of 20 L/min. A single track was prepared for microstructure examinations, and several laser tracks were prepared for XRD tests by overlapping each other with an overlapping ratio of 50%.
After laser cladding, the clad samples were sectioned perpendicular to the track and were mounted, polished, and etched with an etchant (10 mL HF, 30 mL HNO3, and 50 mL distilled water). The microstructure of the coatings was examined using an Olympus GX-51 optical microscope (OM; Olympus Optical Co., Ltd., Japan), QUANTA200 scanning electron microscope (SEM; Philips FEI Co., Netherlands), and transmission electron microscope (TEM) with an energy dispersive spectroscope (EDS). The TEM samples were cut along the direction parallel to the track, and the foils were prepared by ion-thinning. Phase constituents of the coatings were analyzed on a D8 x-ray diffractometer (XRD; Bruker AXS Ltd., UK) operated at an acceleration voltage of 40 kV, a current flow of 40 mA, and a scanning velocity of 2°/min.
III. THERMODYNAMIC MODEL
According to the above experiments, the phase fractions, phase compositions, and phase transformations at different temperatures for laser clad Ni–base alloy coatings on the surface of 45 steel were calculated using Thermo-Calc software together with commercial thermo-chemical database TCNI5 (Ni-based Alloys' Database). To validate the reliability of the simulation process, the calculated results were compared with the experimental data. Based on the general thermodynamic models and the principle of minimum Gibbs energy,Reference Hillert and Staffansson16 Thermo-Calc software constructs a systematic database with a set of reasonable and self-consistent thermodynamic parameters and the calculated results can be obtained with the help of developed computer technology.Reference Hu, Guo, Dong, Yang, Liu and Cao17, Reference Hu, Tian, Bai, Cao, Sun and Yang18
IV. RESULTS AND DISCUSSION
A. Microstructure of laser clad coatings
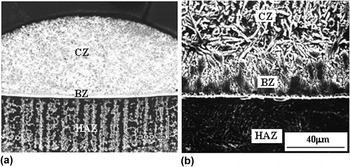
Figure 1(a) is the transverse cross-section macrograph of a single laser clad track. The clad coatings are free from pores and cracks with a thickness of about 0.9 mm. Figure 1(b) is the SEM morphology of the coatings. It can be divided into three regions: clad zone (CZ), bonding zone (BZ), and HAZ of the substrate.
Cross-section morphology and microstructure of the coatings. (a) cross-section macrograph of coating and (b) cross-section microstructure of coating.

The BZ consists of a thin layer of planar grains (bright-white band) and orientated growth columnar grains. The planar grains in the BZ show no obvious characteristics. The columnar grains grow on the bright-white band and are perpendicular to the melting surface of the substrate, as shown in Fig. 1(b). It leads to a good metallurgical bond at the coating/substrate interface.
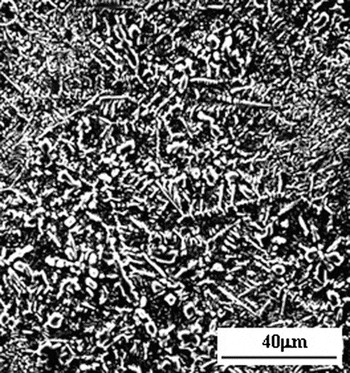
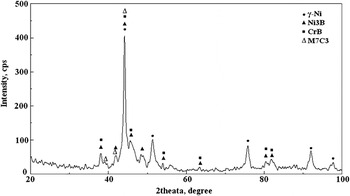
The microstructure and x-ray diffraction spectrum of the CZ are presented in Figs. 2 and 3. The microstructure of the CZ is fine, uniform, and dense. The phase constituents of the CZ are γ-Ni, M7C3, CrB, and Ni3B according to the index results of the x-ray diffraction spectrum as shown in Fig. 3.
SEM microstructure of the CZ.

X-ray diffraction spectrum of the coatings.

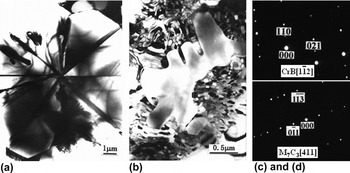
Figures 4(a) and 4(c) are TEM bright field image and selected area electron diffraction (SADP) of the CrB particles in the coatings. The particles appear irregular shape and the composition of the particles determined by TEM EDS analysis is enriched in Cr, B and contains minute quantity of Ni, Fe. Combining with the analysis results of SADP and x-ray diffraction spectrum, the particles were identified as CrB intermetallic compound with orthorhombic structure. The fringe contrast reveals that there are stacking fault substructures in CrB intermetallic compound.
TEM bright field image and SADP of CrB and M7C3 phases in the coatings. (a) Bright field image of CrB particle, (b) bright field image of M7C3 dendrite, (c) SADP of CrB particle, and (d) SADP of M7C3 dendrite.

Figures 4(b) and 4(d) are TEM bright field image and SADP of the M7C3 dendrites in the coatings. The composition of the dendrites determined by TEM EDS analysis is enriched in Cr, Fe, C and contains minute quantity of Ni. Combining with the analysis results of SADP and x-ray diffraction spectrum, the dendrites were identified as M7C3 intermetallic compound with orthorhombic structure. Here, the M represents Cr, Fe, Ni, etc.
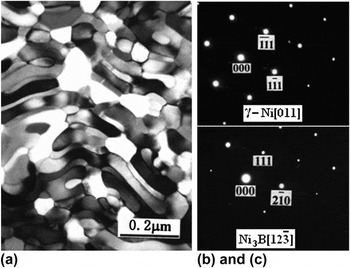
Figure 5 is TEM bright field image and SADP of the γ-Ni and Ni3B particles in the coatings. The bright particles appear quasi-spherical shape, whereas the dark particles have short rod or elliptical shapes. The composition of the dark particles as determined by TEM EDS analysis is enriched in Ni, Fe and contains minute quantity of Cr. Combining with the analysis results of SADP and x-ray diffraction spectrum, the dark phase was characterized as a γ-Ni solid solution with a face centered cubic structure, as shown in Fig. 5(b).
TEM bright field image and SADP of γ-Ni and Ni3B particles in the coatings. (a) Bright field image of γ-Ni and Ni3B particles, (b) SADP of γ-Ni particles, and (c) SADP of Ni3B particles.

On the other hand, the composition of the bright particles as determined by TEM EDS analysis is enriched in Ni, Fe, B and contains minute quantity of Cr. Combining with the analysis results of SADP and x-ray diffraction spectrum, the bright phase was characterized as an Ni3B intermetallic compound with an orthorhombic structure, as shown in Fig. 5(c).
B. Phase diagram calculation
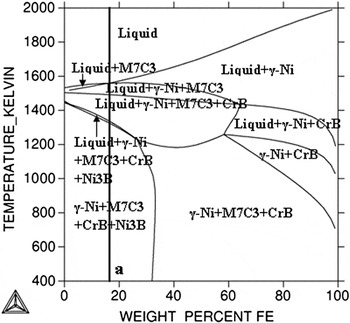
In this paper, Ni–base alloy powders, with composition (wt%) of: 16.0 Cr, 3.3 B, 0.9 C, ≤8 Fe, and balance Ni were used as the clad material and preplaced on the substrate. During the laser cladding process, the dilution of the substrate led to an amount of Fe coming into the molten pool and altered the content of Fe in the coatings. The ratio among Cr, B, C, and Ni elements in the coatings was not changed during the laser cladding process. Thus, the phase diagram was calculated by varying the Fe content and temperature and keeping a fixed ratio among Cr, B, C, and Ni elements as the constraint condition using Thermo-Calc software, as shown in Fig. 6.
Calculated phase diagram of Ni–base alloy. Keeping fixed ratio among Cr, B, C, and Ni elements as the constraint condition.

According to the calculated phase diagram, the phase diagram is complicated and contains several different phase regions at high temperature (above 1300 K) and the phase diagram is relatively simple and contains only two phase regions at low temperature (below 1300 K). The large area of γ-Ni + M7C3 + CrB + Ni3B phase region at low temperature part of the phase diagram indicates that the content of Fe element in the coatings will only affect the quantity of the specific phases. At relatively low temperature, the phase constituents of the coatings were not altered when the content of Fe element in the coatings was <30%. In this paper, Fe element that came from the substrate will not uniformly distribute in the coatings as the diffusion and convection of Fe element in the molten pool were not sufficient. The content of Fe element in the bottom layer of the coatings is relatively higher than that of the upper layer. According to the previous research,Reference Lei, Sun, Lei, Tang and Niu5 about 10% of molten substrate will come into the coating under optimized processing parameters. Due to the contents of Fe in the bottom layer and upper layer of the coatings did not exceeded 30%, the phase constituent of the bottom layer is similar to that of the upper layer.
At high temperature (above 1560 K), the solidification process of the molten pool will be affected by the content of Fe element. When the content of Fe element is <16%, M7C3 phase firstly precipitated from the liquid. On the other hand, γ-Ni phase firstly precipitated in the melt pool when the content of Fe element is in the range between 16 and 30%. At relatively low temperature (below 1560 K) and Fe element content <30%, the reaction scheme in the coatings will not be affected by the content of Fe element, as shown in Fig. 6.
Combining the above analysis with the metallographic observations of the laser clad Ni–base alloy coatings, the average content of Fe element in the coatings should be in the range of 10–20%. To simplify the reaction scheme in the coatings, the composition of the Ni–base alloy coatings was located at point a, as shown in Fig. 6.
C. Phase fractions and reaction scheme of laser clad coatings
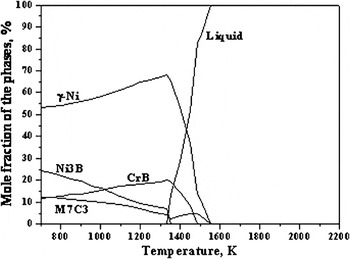
It is necessary and interesting to analyze the solidification process, the phase fractions and phase compositions of laser clad Ni–base alloy coatings on 45 steel. In Fig. 7, the horizontal axis denotes the temperature and the vertical one denotes the mole fractions of the phase for the coatings. So the relationship between phase fractions and temperature can be expressed from this figure. The lines express the mole fraction of the phases calculated by Thermo-Calc.
Calculated phase fractions as a function of temperature for the coatings.

During laser cladding processing, laser beam irradiated the surface of the preplaced layer, photon energy converted into heat and propagated toward interior. When the temperature is higher than the melting point of the clad material and the substrate, a molten pool is formed and part of the molten substrate comes into the coatings. And then the temperature of the molten pool decreases quickly due to the cooling down of the substrate. The solidification process and reaction scheme in the coatings during the laser cladding process are as follows:
(i) γ-Ni and M7C3 phases nucleated and grew up from the molten pool at 1560 K. At the temperature range from 1560 to 1340 K, the mole fraction of γ-Ni phase quickly increased from zero to the maximal value 68%, whereas the fraction of M7C3 phase increased to the maximal value 4.3% at about 1490 K and then decreased. The amount of liquid phase continuously reduced.
(ii) CrB and Ni3B phases started to precipitate at 1490 and 1350 K, respectively. The mole fractions of CrB and Ni3B phases increased to 19% and 7% at 1340 K. All the remaining liquid phase crystallized as CrB and Ni3B phases and the liquid phase disappeared at 1340 K. The solidification process of the molten pool completed.
(iii) As the temperature continuously decreased (lower than 1340 K), the solid-state phase transformation would occur in the coatings due to the solid-state diffusion of the atoms. At the temperature range from 1340 to 700 K, the mole fraction of γ-Ni and CrB phases decreased and M7C3 and Ni3B phases were on the contrary. It illustrates that part of the γ-Ni and CrB phases decomposed and some M7C3 and Ni3B phases formed by solid-state phase transformation in this temperature interval, as shown in Fig. 7.
According to the above analysis, the solidification process and reaction scheme of the molten pool during the laser cladding process are Liquid → Liquid + γ-Ni + M7C3 → Liquid + γ-Ni + M7C3 + CrB → Liquid + γ-Ni + M7C3 + CrB + Ni3B → γ-Ni + M7C3 + CrB + Ni3B.
D. Phase composition of laser clad coatings
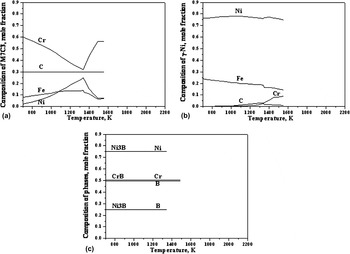
The phase compositions (i.e., mole fraction of Ni, Cr, B, C, and Fe elements in the phases) were computed as a function of temperature in the coatings, as shown in Fig. 8. The simulated results show that M7C3 phase is alloyed carbide and M represents Cr, Fe, and Ni elements. The relationship between M7C3 phase composition and temperature can be divided into two parts, as shown in Fig. 8(a). In the temperature range from 1560 to 1340 K, M7C3 phase precipitated from the molten pool. As the temperature decreased in that interval, the mole fractions of Fe and Ni elements in M7C3 phase increased, the mole fraction of Cr element in it decreased, whereas the mole fraction C element in it kept unchanged. The second part is the solid-state transformation stage at temperature range from 1340 to 700 K. The relationship between composition and temperature of M7C3 phase is on the contrary to the first part, as shown in Fig. 8(a). Figure 8(b) presents the relationship between the γ-Ni phase composition and the temperature. It indicates that γ-Ni is a solid solution with Fe and a small quantity of Cr and C in γ-Ni solid solution and its composition was slightly changed in the temperature range of 1560 to 700 K. Figure 8(c) presents the relationship between the composition of CrB and Ni3B phases and temperature. The simulated results show that CrB and Ni3B are stoichiometric compounds and their compositions were not changed during the cooling process. The mole fractions of Cr and B elements in CrB phase are both 0.5 and the mole fractions of Ni and B elements in Ni3B phase are 0.75 and 0.25, respectively.
Calculated phase compositions as a function of temperature for the coatings. (a) M7C3, (b) γ-Ni, and (c) CrB and Ni3B.

According to the simulated mole fractions and compositions of different phases, the solid-state phase transformation process in the coatings in the temperature range of 1340–700 K is illustrated in more detail. In this temperature interval, the composition of γ-Ni phase in the coatings was almost unchanged, so the decreasing fraction of γ-Ni phase in the coatings provided the source of Ni, Fe, Cr, and C elements, as shown in Figs. 7 and 8(b). As the CrB phase is a stoichiometric compound, the decreasing fraction of CrB phase in the coatings provided the source of Cr and B elements, as shown in Figs. 7 and 8(c). On the other hand, the fractions of M7C3 and Ni3B phases in the coatings increased in the temperature range of 1340–700 K. It means that part of γ-Ni and CrB phases were decomposed and part of M7C3 and Ni3B phases were formed by the solid-state phase transformation process. As a stoichiometric compound, Ni3B phase absorbed Ni and B elements from the coatings. M7C3 phase absorbed Cr, Fe, Ni, and C elements from the coatings during the solid-state phase transformation process, as shown in Figs. 7 and 8(a) and 8(c).
According to the above analysis, the solid-state phase transformation process in the coatings in the temperature range of 1340–700 K is as follows:
Part of γ-Ni and CrB phases decomposed and part of M7C3 and Ni3B phases formed in the coatings. Ni, Fe, Cr, and C elements coming from γ-Ni and CrB phases transformed into M7C3 phase and Ni and B elements coming from γ-Ni and CrB phases transformed into Ni3B phase.
V. CONCLUSIONS
(1) A dense crack- and porous-free Ni–base alloy coating with good metallurgical bond is fabricated on 45 steel by laser cladding.
(2) The coatings can be divided into three regions: CZ, BZ, and HAZ of the substrate. The CZ consisted of γ-Ni, M7C3, CrB, and Ni3B phases.
(3) The solidification process of the molten pool during the laser cladding process is Liquid → Liquid + γ-Ni + M7C3 → Liquid + γ-Ni + M7C3 + CrB → Liquid + γ-Ni + M7C3 + CrB + Ni3B → γ-Ni + M7C3 + CrB + Ni3B.
(4) In the temperature range of 1340–700 K, γ-Ni and CrB phases decomposed and M7C3 and Ni3B phases formed in the coatings. Ni, Fe, Cr, and C elements diffuse from γ-Ni and CrB phases to M7C3 phase, on the other hand, Ni and B elements diffuse from γ-Ni and CrB phases to Ni3B phase.
(5) The experimental and calculated phase compositions and fractions of the phases in the coatings agree well. It is beneficial to design coatings with a desirable microstructure and mechanical properties.
ACKNOWLEDGMENTS
The authors would like to thank the financial support provided by Tianjin Research Program of Application Foundation and Advanced Technology (Grant No. 11JCZDJC21400) and the Ph.D. Programs Foundation of Ministry of Education of China (Grant No. 20091201110002).