Implications
The possibility of binding dairy incomes to environmentally friendly practices would add more interest to formulating diets with a high efficiency of nutrient utilization. A reduction of N emissions from dairy cows can be readily achieved by decreasing the CP concentration of diets. In order to minimize the negative impact of low N diets on milk protein yield, the efficiency of N utilization can be improved by replacing a percentage of dietary fiber by starch at iso-energetic concentrations. Lessening the dietary CP concentration and changing the carbohydrate composition can be two complementary strategies to improve the milk N efficiency.
Introduction
Important measures to achieve the EU Water Framework Directive (European Union, 2000) include reducing N emissions from animal livestock. In ruminants, N intake has been identified as the principal driver of N excretion and so lowering the N intake reduces N excretion in feces and urines (Castillo et al., Reference Castillo, Kebreab, Beever and France2000). This may necessitate feeding ruminants with low N diets, even lower than those recommended by the current feeding systems. However, this strategy is detrimental to dairy performance. In this sense, one of the most promising ways to decrease N losses from dairy farms, with minimal detrimental effects on animal performance, is by improving the milk N efficiency (MNE; Kohn et al., Reference Kohn, Dou, Fergurson and Boston1997).
Although MNE is mainly driven by the dietary CP concentration (Huhtanen and Hristov, Reference Huhtanen and Hristov2009), other covariates may influence the N partitioning, such as the dietary energy supply (Firkins and Reynolds, Reference Firkins and Reynolds2005) or the type of absorbed energy-yielding nutrients (Leiva et al., Reference Leiva, Hall and Van Horn2000). Results from literature concerning the effect of the dietary carbohydrate composition (CHO; starch v. fiber) on milk protein yield are variable and inconsistent (Kebreab et al., Reference Kebreab, Castillo, Beever, Humphries and France2000; Khalili and Sairanen, Reference Khalili and Sairanen2000; Hristov and Ropp, Reference Hristov and Ropp2003), likely because the effect of the CHO is often confounded with the total amount of energy consumed. However, in a recent meta-analysis study using a large Northern European data set (Huhtanen and Hristov, Reference Huhtanen and Hristov2009), the effects of starch on MNE were significantly positive, whereas effects of NDF concentrations were negative at any given energy and protein intake.
Information about the impact of CHO on mitigation of urinary N excretion is scarce, and as far as we know no evidences exist whether the extent of the MNE improvement mediated by the CHO can be different when feeding cows below the recommended N requirements. Thus, the aim of this work was to test whether milk protein yield reduction associated to low N intakes could be partially compensated for by a higher MNE when dairy cows are fed diets rich in starch compared with diets rich in fiber at similar energy intakes.
Material and methods
The experiment was conducted according to the national legislation on animal care (Certificate of Authorization to Experiment on Living Animals, No. 004495, Ministry of Agriculture, France).
Animals, experimental design and diets
Four multiparous Jersey cows in late lactation, averaging 354±23 kg of BW and 211±13 days in milk at the onset of the experiment, were used in a 4×4 Latin Square design experiment, with a 2×2 factorial arrangement of dietary treatments. Cows were maintained in tie stalls. Each treatment was applied for 21 days, consisting of 15 days of animal adaptation to diets and 6 days of measurements.
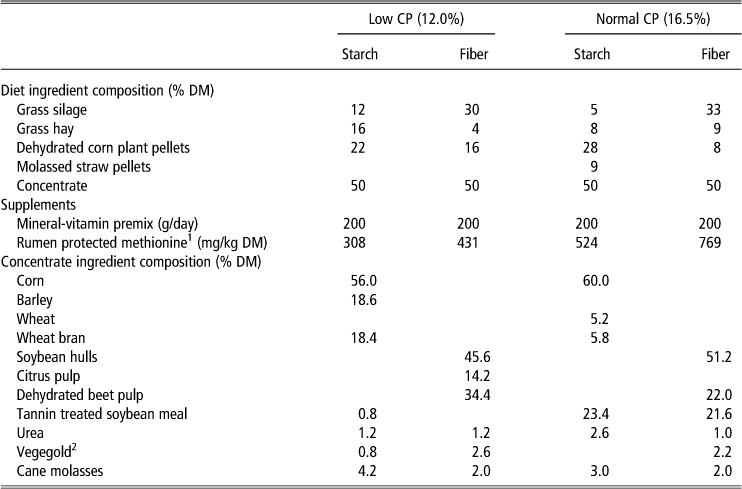
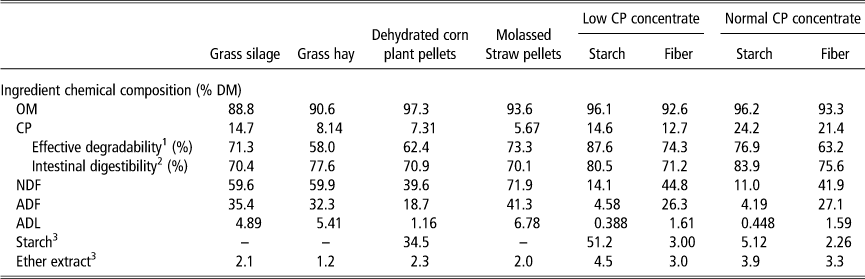
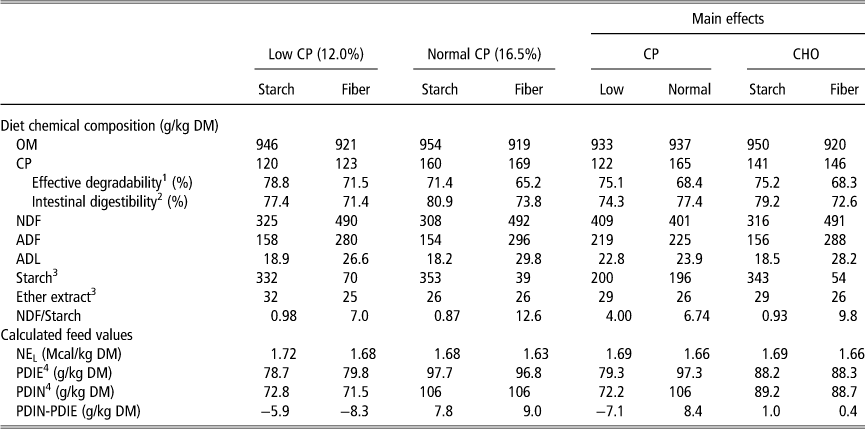
Four diets (Table 1) were formulated to be iso-caloric on a net energy for lactation (NEL) basis and with a constant 50 : 50 forage to concentrate ratio. The chemical composition of major feed and experimental diets are shown in Table 2 and Table 3, respectively. The dietary treatments varied in the dietary CHO (starch diets (35.0% starch and 32.0% NDF, in a dry matter (DM) basis) v. fiber diets (5.0% starch and 49.0% NDF, in a DM basis)) and the dietary CP (12.0% (Low) v. 16.5% (Normal), in a DM basis). Diets were formulated to meet 80% (Low CP) and 100% (Normal CP) of the protein to energy ratio recommended by the INRA feeding system (PDIE/NEL=246 g/MJ; INRA, 2007). Care was taken to ensure an optimum supply of rumen degradable N (PDIN) with regard to the available rumen fermentable energy (PDIE) for Normal CP diets (INRA, 2007), with an intended small deficit for Low CP diets (within tolerable limits, PDIN–PDIE/NEL>−60 g/MJ; INRA, 2007) in order to benefit from the urea-N recycling into the rumen. Differences in CHO and CP concentration as well as in the supply of rumen degradable protein between dietary treatments were achieved by changing both the nature and the proportion of the ingredients in both the forage and in the concentrate fractions. Finally, diets were supplemented with rumen protected methionine (Smartamine M; Adisseo France SAS, Antony, France) in order for all diets to approach the balanced intestinal digestible lysine and methionine ratio of 3.0 (INRA, 2007). A standard commercial mineral–vitamin premix (Galaphos, Centraliment, Aurillac, France) was also included into the diet.
Ingredient composition of diets
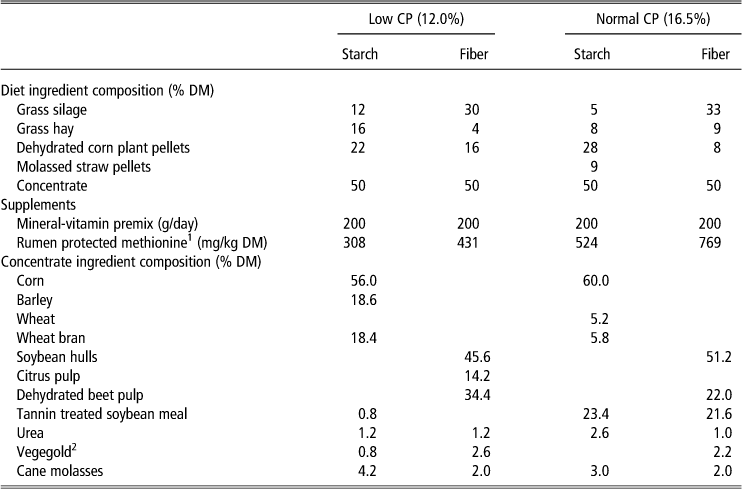
DM=dry matter.
1 Smartamine M.
2 Vegegold: hydrogenated palm fatty acids (palmitic acid 45.5%, stearic acid 45.5% and oleic acid 9%).
Chemical composition of major feed ingredients
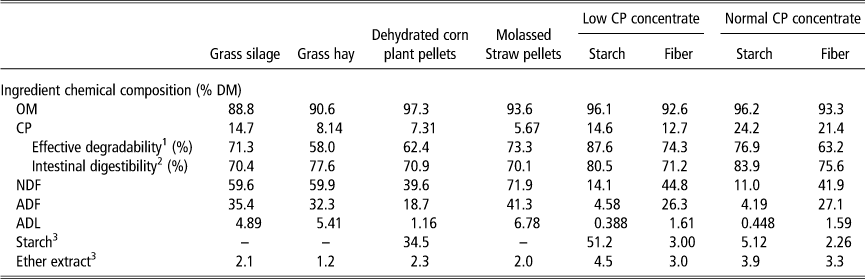
DM=dry matter; OM=organic matter.
1 Effective degradability analyzed according to the enzymatic procedure by Aufrère et al. (Reference Aufrère, Graviou, Demarquilly, Vérité, Michalet-Doreau and Chapoutot1991).
2 Intestinal digestibility of rumen undegraded dietary CP according to the three step in vitro procedure by Calsamaglia and Stern (Reference Calsamiglia and Stern1995).
3 From ingredients pooled from period 1 to 4 (n=1).
Chemical composition and feed values of diets
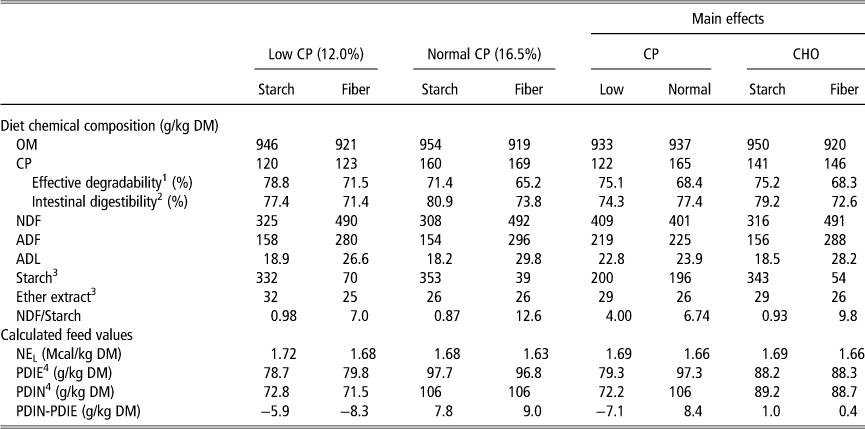
DM=dry matter; OM=organic matter; NEL=net energy for lactation.
1 Effective degradability analyzed according to the enzymatic procedure by Aufrère et al. (Reference Aufrère, Graviou, Demarquilly, Vérité, Michalet-Doreau and Chapoutot1991).
2 Intestinal digestibility of rumen undegraded dietary CP according to the three step in vitro procedure by Calsamaglia and Stern (Reference Calsamiglia and Stern1995).
3 From ingredients pooled from period 1 to 4 (n=1).
4 PDIE, PDIN: protein digestible in the small intestine when rumen fermentable energy or nitrogen, respectively, are limiting.
To prevent confounding the effects of CHO and the energy intake, the animals were fed fixed and limited quantities of rations throughout the experiment according to INRA (2007). Dietary allowances were calculated to meet 100% of the cow NEL requirements at the middle of the trial. As-fed quantities of grass silage were adjusted twice a week to reflect changes in DM content.
Because digestibility values from this experiment were intended to be used as an aid in interpreting data from a subsequent metabolic study involving multicatheterized cows fed the same diets in steady state conditions, animals were individually fed every 3 h, using automatic feeders, in eight equal portions (from 0800 h onwards), except for the grass silage and grass hay, which were separately distributed three times per day (25% at 0800 h, 25% at 1200 h and 50% at 1700 h). Water was freely available to all cows.
Measurements, sampling and analyses
Animals were weighed at the beginning and the end of each experimental period. Cows were milked twice a day at 0800 and 1600 h. The N balance and digestibility measurements were made on the last 6 days of each 3-week periods. From days 16 through 21 offered feed and refusals were weighed daily to determine feed intake. Total feces and urine output were measured daily. Feces were collected into wooden containers placed over the gutter behind each stall. Urine was collected using an external urine collector attached to the vulva of the cow by a tail support harness, into polyethylene containers previously filled with 1000 ml of 10% H2SO4 (vol/vol). Representative samples of individual feeds (200 g/day), refusals (25%), feces (1%) and urine (1%) were taken each day and frozen at −20ºC before analysis. Feed samples were pooled by period, whereas samples of refusals, feces and urines were composited over the 6-day sampling period by cow and treatment as they were obtained. In addition, on the last 3 days of the measurements daily weighed urine samples were diluted 10-fold with distilled water and stored at −20°C for PD analysis. Individual milk yield was recorded twice daily from days 16 through 21 and milk samples were collected at each milking on days 17 and 19 of each period.
Before analyses, feed, refusals and fecal samples were thawed, dried at 60ºC for 48 h and ground at 1 mm before DM, OM, NDF and ADF analyses. The Kjeldahl N content was determined on thawed fecal as well as urine subsamples and on dried and ground feed and refusal subsamples.
The DM, OM and N concentrations of samples were determined according to the Association of Official Analytical Chemists (AOAC, 2005). The ether extract was assessed for feed samples pooled over the entire experiment by extraction with petroleum ether (AOAC, 2005). The NDF and ADF analyses were performed by the sequential procedure of Van Soest et al. (Reference Van Soest, Robertson and Lewis1991) using the Ankom 200 Fiber Analyzer (ANKOM Technology Corporation, Macedon, NY, USA). Additionally, starch was analyzed in dried starch rich feeds pooled over the entire experiment as well as in refusals and feces from animals fed starch diets after grinding through a 0.5 mm sieve (Faisant et al., Reference Faisant, Planchot, Kozlowski, Pacouret, Colonna and Champ1995). The starch content was not measured for fiber diets as the theoretical starch concentration in feces was below the quantification limits of the analytical technique. In vitro N degradability (Aufrère et al., Reference Aufrère, Graviou, Demarquilly, Vérité, Michalet-Doreau and Chapoutot1991) as well as intestinal digestibility (Calsamiglia and Stern, Reference Calsamiglia and Stern1995) were assayed in feed samples, composited over the entire experiment, as estimates of rumen effective degradability and intestinal digestibilty of rumen undegraded dietary protein, respectively. Urinary PD (allantoin and uric acid) were determined by liquid chromatography with diode array detection. Separation of PD was performed on a hydrophilic interaction liquid chromatography (HILIC) column (125 mm×2 mm, 3 µm, Macherey Nagel, Hoerd, France), using a gradient solvent system at 0.5 ml/min (solvent A: 20 mM ammonium formate adjusted to pH 4 and solvent B: acetonitrile). The solvent program was as follows: the initial percentage of solvent A (10%) was maintained for 4 min, then raised to 60% in 10 min, lowered to 10% in 0.1 min and kept constant for 10 min to re-equilibrate the column before the next injection. After thawing, urine samples were diluted 1/5 in acetonitrile (Sigma-Aldrich, Taufkirchen, Germany) containing 20 µM of allopurinol (Sigma Chemical Co., St Louis, MO, USA) as internal standard. The samples were vortex-mixed for 1 min, centrifuged (10 000 × g, 10 min), an aliquot of the supernatant was transferred into a clean vial and 10 µl were injected into the liquid chromatography system. Allantoin and uric acid were detected at 218 and 254 nm, respectively. Quantification of PD in urine samples was performed by external calibration with artificial urines spiked with different mixed standard solutions to obtain five different concentrations of each metabolite (from 25 to 300 and 100 to 1200 µM for uric acid and allantoin, respectively). The peak area ratio (allantoin or uric acid to allopurinol) in urinary samples was used to calculate the metabolite concentration from the standard curves.
Individual (n=4 per treatment and cow) fresh milk sub-samples, preserved with K2Cr2O7 and stored at 4°C, were analyzed for fat, lactose and MUN concentration by IR analysis (CILAL Laboratory, Saint Genès Champanelle, France). Frozen (−20°C) milk sub-samples (n=4) without preservatives were subsequently thawed, pooled (n=1) by treatment and cow based on daily milk production, and thoroughly homogenized before being analyzed for total Kjeldahl-N and non-NPN concentrations as described elsewhere (Lemosquet et al., Reference Lemosquet, Delamaire, Lapierre, Blum and Peyraud2009).
Jugular blood samples were taken on day 19 at 1100 h to determine plasma amino acids, albumin, urea, glucose, lactate, β-hydroxybutyrate (BHBA), non-esterified fatty acids (NEFA) and insulin as detailed before (Majdoub et al., Reference Majdoub, Vermorel and Ortigues-Marty2003; Savary-Auzeloux et al., Reference Savary-Auzeloux, Kraft, Bequette, Papet, Rémond and Ortigues-Marty2010).
Calculations and statistical analyses
Dietary PDIE and PDIN contents were calculated from the analyzed ingredients chemical composition and the in vitro estimates of the rumen effective degradability of CP and the intestinal digestibility of rumen undegraded dietary protein. The rumen outflow rate for effective CP degradability was set as 6%/h (INRA, 2007).
Microbial N flow (MNF) was estimated from the urinary PD according to the equations proposed by Chen and Gomes (Reference Chen and Gomes1995), and using a value of 0.158 as the mean ratio of purine-N : total-N for mixed rumen bacteria measured in our laboratory from an experiment using similar diets (Fanchone et al., Reference Fanchone, Nozière, Portelli, Duriot, Largeau and Doreau2013). Milk component yield was calculated multiplying the average milk yield from days 16 through 21 (n=6) by the average milk component composition measured at each milking on days 17 and 19 (n=4). Energy-corrected milk (ECM) was calculated according to Reist et al. (Reference Reist, Erdin, Von Euw, Tschuemperlin, Leuenberger, Delavaud, Chilliard, Hammon, Kuenzi and Blum2003).
Statistical analyses were carried out as a 4×4 Latin Square using the PROC MIXED of SAS v.9.2 (2008) according to the following model: Y ijkl =µ+CP k +CHO l +CP×CHO kl +P i +C j +ε ijkl , where Y ijkl is the dependent variable, µ is the overall mean, P i is the fixed effect of the experimental period i, C j is the random effect of cow j, CP k is the fixed effect of dietary CP concentration (Low v. Normal), CHO l is the fixed effect of dietary carbohydrate composition (starch v. fiber), CP×CHO kl is the fixed effect of the two-way interaction between CP and CHO, and ε ijkl is the random residual error. Effects were declared significant at P≤0.05 and a tendency was considered when 0.05<P<0.10. In order to assess whether at similar total N and PDIE intake (general predictors) the milk N and milk CP yield were affected by the dietary CHO residuals from the regression equations were analyzed for the effect of the CHO by ANOVA (SAS v.9.2, 2008).
Results
Diet intake and digestibility and MNF
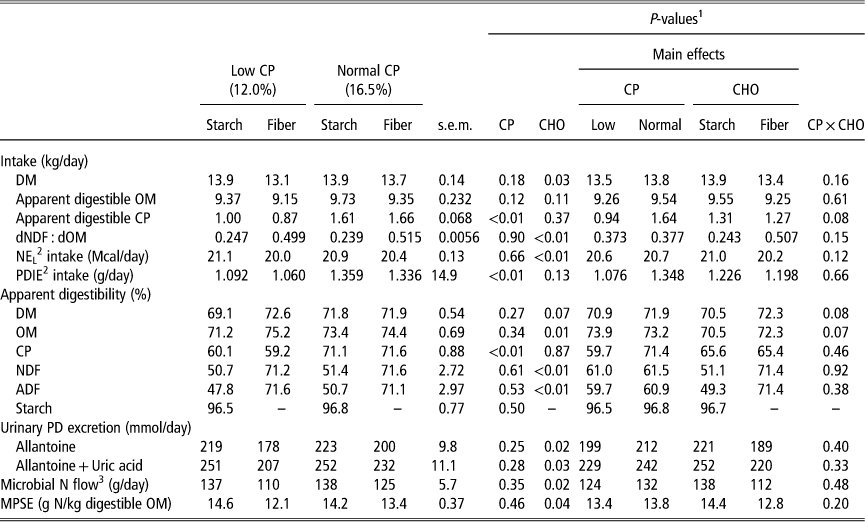
Animals consumed all feeds offered, except in the two last periods where the hot weather was responsible for partial refusals of grass silage (around 20%). Consequently, the DM and the calculated NEL intakes were on average 3.6% (P=0.03) and 2.6% (P=0.006), respectively, lower for fiber diets compared with starch diets (Table 4). However, because the DM (P=0.07) and OM (P=0.01) digestibilities were on average 1.8 and 2.5 percentage units higher for the fiber diets compared with the starch diets, the digestible organic matter intake (DOMI) was similar (P=0.11) across dietary CHO. The apparent CP digestibility was similar (P=0.87) between starch and fiber diets, with no effects of the CHO on the apparent digestible CP (P=0.37) or PDIE (P=0.13) intakes. The NDF and ADF digestibilities were greater (P<0.01) for the fiber compared with the starch diets. As a result of a higher fiber content and digestibility, the proportion of DOMI consumed as digestible NDF was double (50.7% v. 24.3% on average; P<0.01) for fiber diets compared with starch diets. Starch digestibility was almost complete for starch diets (96.6% on average). The dietary CP modified neither the dry matter intake (DMI; P=0.18) nor the apparent DM and OM digestibilities (P=0.27 and 0.34, respectively). The apparent CP digestibility was 11.8 percentage units higher (P<0.01) for Normal compared with Low CP diets. Low CP diets resulted in similar digestibilities of NDF (P=0.61), ADF (P=0.53) and starch (P=0.50) compared with Normal CP diets. Urinary PD (allantoine+uric acid) excretion was higher (P=0.03) for starch diets v. fiber diets, and consequently the estimated MNF was around 17.0% (on an absolute basis, P=0.02) or 13.2% (per unit of DOMI, P=0.04) higher for the former. The dietary CP content had no effect on these parameters (P=0.28 to 0.46).
Effect of the dietary CP concentration (CP) and carbohydrate composition (CHO) on nutrient intake, digestibility and urinary purine derivative excretion
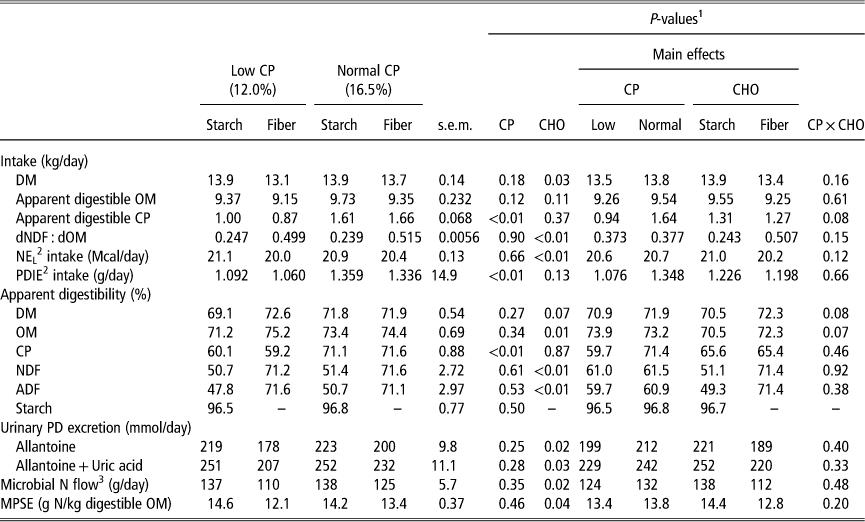
DM=dry matter; OM=organic matter; dNDF=digestible nutral detergent fibre; dOM=digestible organic matter; NEL=net energy for lactation; PD=purine derivatives; MPSE=microbial protein synthesis efficiency.
1 Effects: CP=dietary CP content; CHO=carbohydrate composition; CP×CHO=interaction between CP and CHO.
2 Calculated feed values; PDIE=protein digestible in the small intestine when rumen fermentable energy is limiting.
3 Calculated as reported by Chen and Gomes (Reference Chen and Gomes1995).
Milk yield and composition
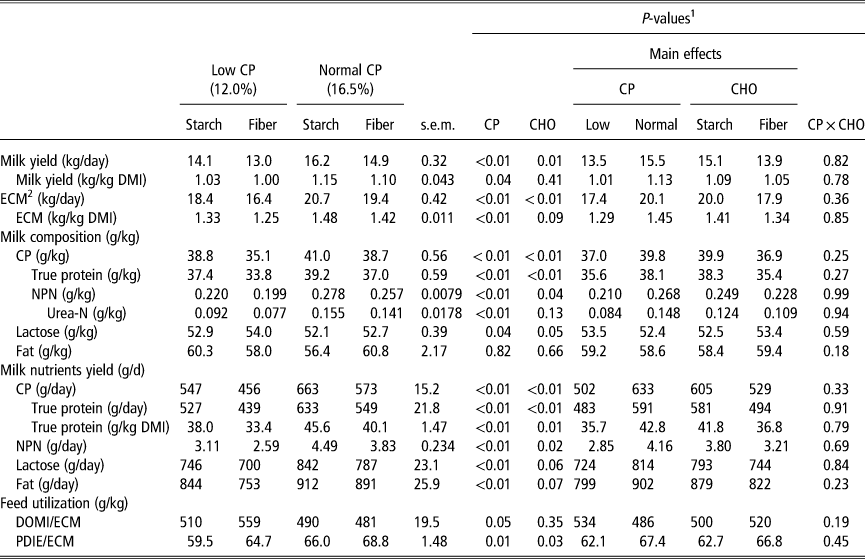
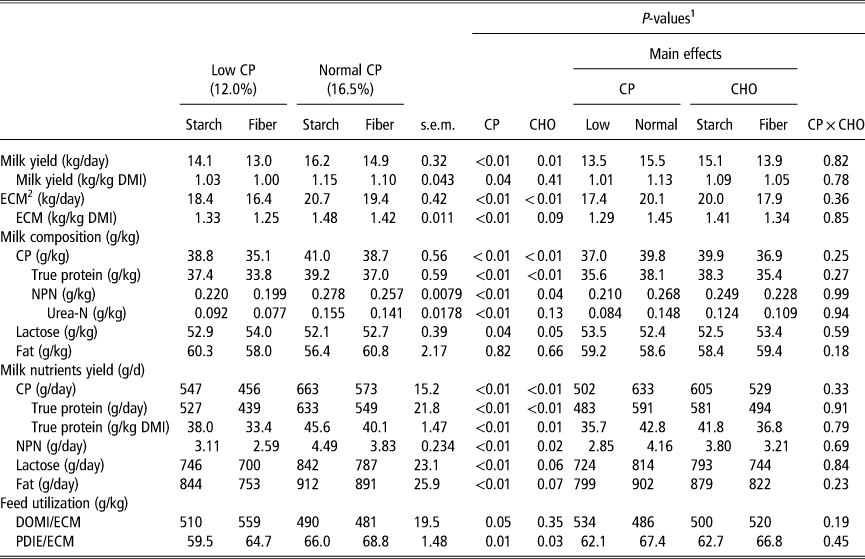
Milk yield and composition are presented in Table 5. Starch diets increased milk or ECM yield (+8 and +12%, respectively, P⩽0.01) as well as milk CP, true protein and NPN yield (about +18%, P⩽0.02) and concentrations (P⩽0.04) compared with fiber diets. When data were expressed by DMI to account for the limited intake differences, there was still an effect of CHO on milk true protein yield (+14%, P=0.01) but not on milk or ECM yield (+4 and +5%, respectively, P>0.05). The MUN was not modified by the dietary CHO (P=0.13). Finally, lactose and fat yield tended to be higher for starch v. fiber diets (P=0.06 and 0.07, respectively) even though their concentrations were lower (P=0.05) or not modified (P=0.66), respectively.
Effect of the dietary CP concentration (CP) and carbohydrate composition (CHO) on milk composition and yield
DMI=dry matter intake; ECM=energy-corrected milk; NPN=non-protein N; DOMI=digestible organic matter intake; PDIE=protein digestible in small intestine.
1 Effects: CP=dietary CP content; CHO=carbohydrate composition; CP×CHO=interaction between CP and CHO.
2 ECM calculated=[(0.038×g of crude fat+0.024×g of CP+0.017×g of lactose)×kg of milk]/3.14.
Normal CP diets promoted greater milk yield (+15%, P<0.01) as well as greater milk CP (+23%, P<0.01), true protein (+22%, P<0.01), NPN (46%, P<0.01) yields and concentrations (P<0.01) compared with Low CP diets. Both milk and milk true protein yield expressed by the DMI was still improved (P⩽0.04) by increasing the dietary CP concentration. The MUN increased (+74%, P <0.01) in cows fed Normal v. Low CP diets. Although milk lactose and milk fat yields were lower (P<0.01, respectively) for cows fed the Low CP compared with Normal CP, the concentration of milk lactose was improved (P=0.04), whereas milk fat percentage was unchanged (P=0.82).
Efficiency of N and feed utilization
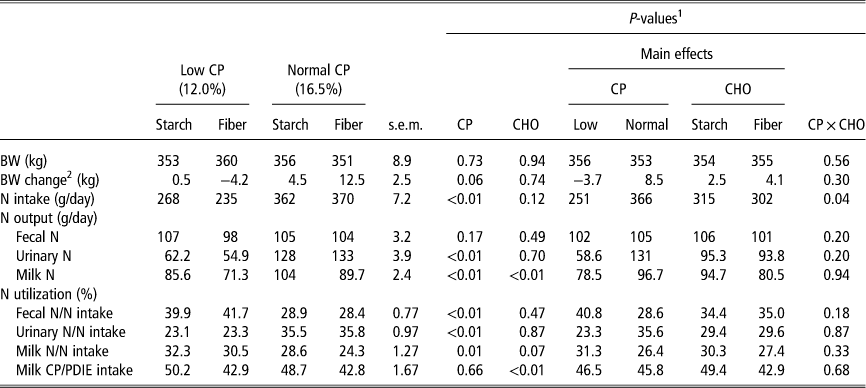
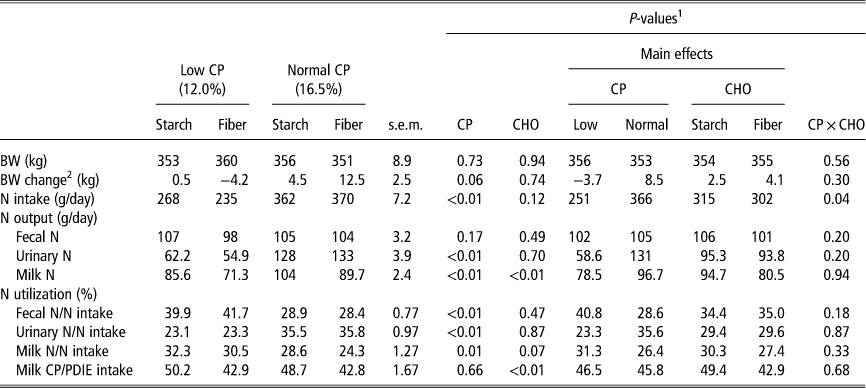
The N partitioning is presented in Table 6. As N intake increased (P<0.01), urinary N excretion (+124%; P<0.01) and milk N yield (+23%; P<0.01) increased as well as the BW change (P=0.06), but not the fecal N excretion (P=0.17), which remained at an average of around 7.5 g fecal N/kg DMI. As expected, when data were expressed per unit of N intake, fecal N excretion and milk N yield decreased (P⩽0.01) with Normal v. Low CP diets while urinary N excretion increased (P<0.01).
Effect of the dietary CP concentration (CP) and carbohydrate composition (CHO) on N partitioning
BW=body weight; PDIE=protein digestible in small intestine.
1 Effects: CP=dietary CP content; CHO=carbohydrate composition; CP×CHO=interaction between CP and CHO.
2 BW change per period.
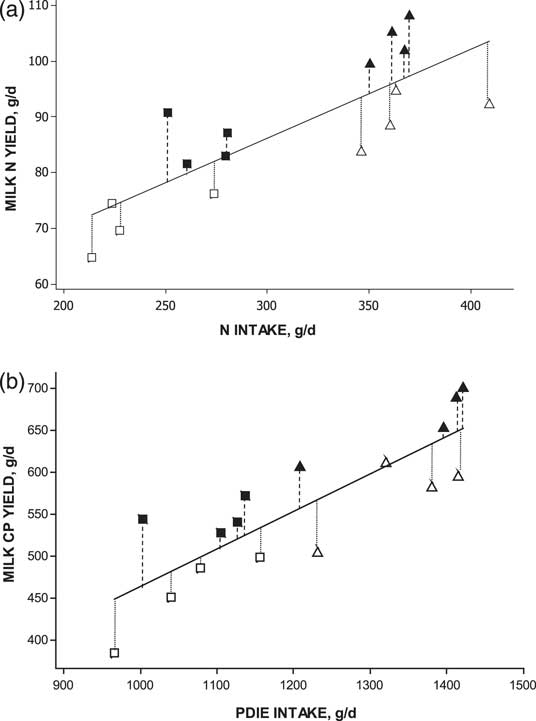
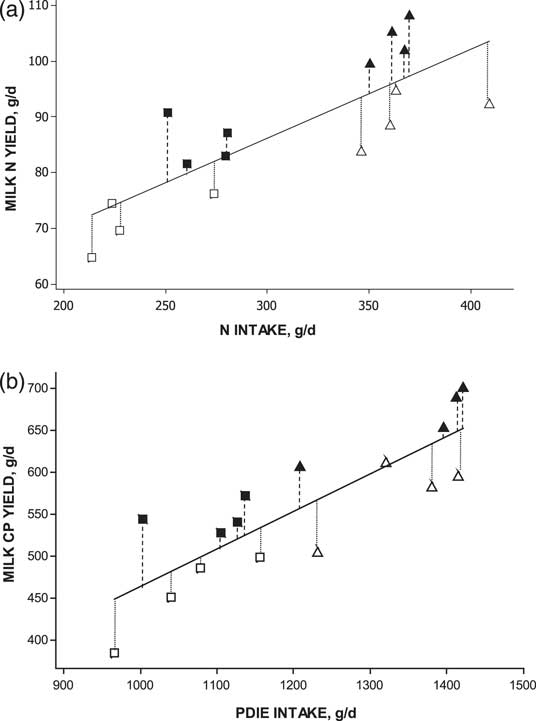
On the other hand, starch diets promoted similar N intakes than fiber diets (P=0.12), but differences at Low CP level (+33 g of N) were greater and opposite (CP×CHO, P=0.04) with regard to what happened at Normal CP level (−8 g of N). Starch diets increased milk N secretion (+18%; P<0.01) compared with fiber diets, with no differences in fecal (P=0.49) and urinary (P=0.70) N excretion, and BW change (P=0.74). Moreover, starch diets tended to increase (P=0.07) the MNE (milk N/N intake) compared with fiber diets, without, however, any change in the urinary and fecal N excretion as a % of the N intake (P=0.47 and 0.84, respectively). When milk N yield was regressed against the N intake (Figure 1a), the analysis of residuals showed that at a given N intake starch diets increased (P<0.01) the milk N yield compared with fiber diets. Likewise, the milk CP yield (Figure 1b), positively correlated with PDIE intake (r 2=50.1%, P<0.01), was also higher (P<0.01) with starch v. fiber diets.
Milk N efficiency in late lactation Jersey cows fed the experimental diets: Low CP – starch diet ( ■ ), Low CP – fiber diet ( □ ), Normal CP – starch diet (▲) and Normal CP – fiber diet (△). (a) Milk N yield according to the N intake and adjusted for animal and period effects (fitted equation is: milk N yield=0.16 (s.e.=0.043)×N intake+38.22 (s.e.=11.7); r 2=47.2%; P<0.01), (b) milk CP yield according to the protein digestible in the small intestine (PDIE) and adjusted for animal and period effects (fitted equation is: milk CP yield=0.448 [s.e.=0.115]×PDIE intake+15.5 [s.e.=140]; r 2=50.1%; P<0.01). Analysis of residuals from both equations shows that starch diets increased (P<0.01) the milk N efficiency (milk N yield v. N intake and milk CP yield v. PDIE intake) compared with fiber diets.
Finally, regarding the feed utilization, Low CP diets needed lower (P=0.05) energy (g of DOMI) and higher (P=0.01) protein (g PDIE) intakes to produce 1 kg of ECM compared with Normal CP diets, whereas starch v. fiber diets decreased (P=0.03) the amount of protein (g PDIE) needed to produce 1 kg of ECM.
Plasma metabolites
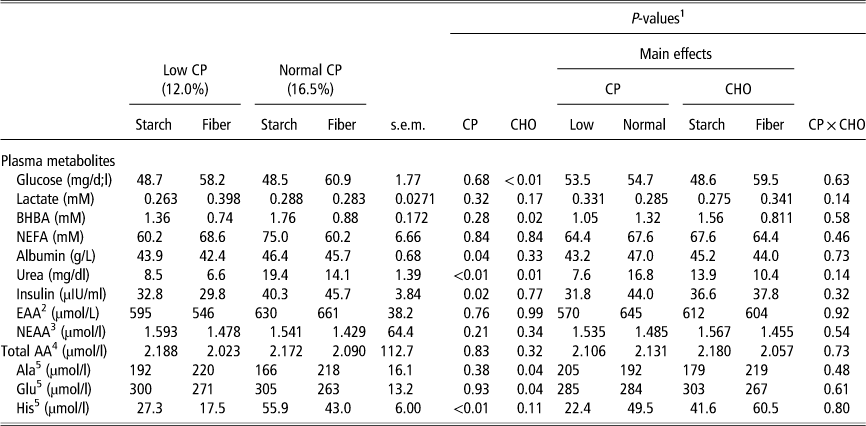
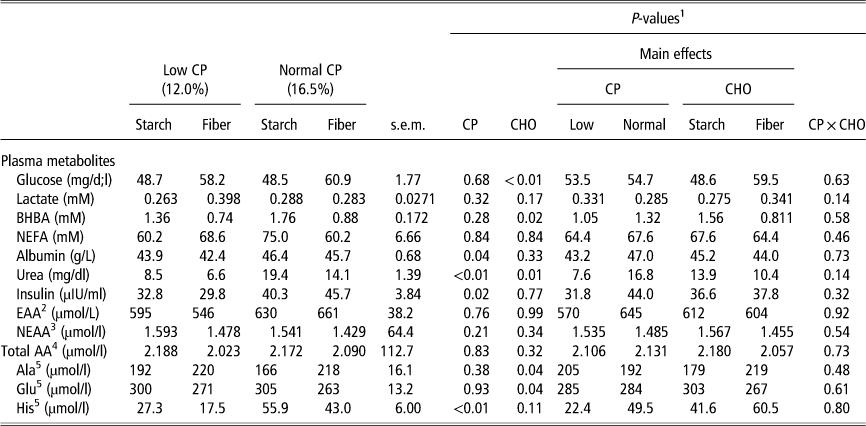
Starch diets promoted lower (P<0.01) plasma glucose concentrations and higher BHBA (P=0.02) and urea (P=0.01) compared with fiber diets (Table 7). On the other hand, Normal CP diets showed higher albumin (P=0.04), urea (P<0.01) and insulin (P=0.02) concentrations than Low CP diets. Total AA plasma concentrations were similar across dietary CHO (P=0.32) and CP concentrations (P=0.83). However, starch diets promoted lower (P=0.04) Ala and higher (P=0.04) Glu concentrations than fiber diets, whereas Normal CP diets showed greater concentrations for His (P<0.01) than Low CP diets. Concentration of individual AA other than Ala, Glu and His did not change across treatments (P>0.05; data not shown).
Effect of the dietary CP concentration (CP) and carbohydrate composition (CHO) on plasma metabolites
BHBA=β-hydroxybutyrate; NEFA=non-essential fatty acids; EAA=essential amino acids; NEAA=non-essential amino acids.
1 Effects: CP=dietary CP content; CHO=carbohydrate composition; CP×CHO=interaction between CP and CHO.
2 EAA=His+Ile+Leu+Lys+Met+Phe+Thr+Tyr+Val.
3 NEAA=total AA−EEA.
4 Total AA does not include tryptophane.
5 Only individual AA showing statistical (P>0.05) differences are shown.
Discussion
Our data support the general concept that a decrease in the dietary CP content (from 16.5% to 12.0%) improves MNE (Huhtanen and Hristov, Reference Huhtanen and Hristov2009), decreasing the urinary N excretion by more than 50%. However, the fall in milk (−2 kg/day) and milk protein yield (−108 g milk true protein/day; −18%) associated with Low CP diets might preclude the use of low protein diets for production purposes. Thus, the question arises: does any improvement in MNE necessarily imply a reduction in milk protein yield? As pointed out by Huhtanen and Hristov (Reference Huhtanen and Hristov2009) and Calsamiglia et al. (Reference Calsamiglia, Ferret, Reynolds, Kristensen and Van Vuuren2010) who characterized EU and US dairy diets from a large data set, it appears that under certain feeding conditions a higher MNE is compatible with higher milk production. The strategy followed in the present experiment was to modify the dietary CHO as a means to further improve the high MNE usually found at low CP levels. In this situation, our results indicated that diets rich in starch improved milk protein yield compared with diets rich in fiber, with a tendency for starch diets to promote higher MNE than fiber diets.
Although we did not find a significant CP×CHO interaction on milk protein yield and MNE, likely because of the low number of animals, some results support the concept that CHO (starch v. fiber) may behave different at low and high dietary CP levels (Sloan et al., Reference Sloan, Rowlinson and Armstrong1988). MNF was greater with starch compared with fiber diets in agreement with other studies conducted in dairy cows (Keady et al., Reference Keady, Mayne and Marsden1998; Broderick, Reference Broderick2003; Fanchone et al., Reference Fanchone, Nozière, Portelli, Duriot, Largeau and Doreau2013) as well as to predictions of the revised Dutch protein evaluation system (DVE/OEB2010; Van Duinkerken et al., Reference Van Duinkerken, Blok, Bannink, Cone, Dijkstra, Van Vuuren and Tamminga2011). Nevertheless this improvement was more than double at Low v. Normal CP diets (24.5% v. 10.5%). Preliminary published results from a metabolic study using these same diets (Cantalapiedra-Hijar et al., Reference Cantalapiedra-Hijar, Rodriguez-Lopez, Illovies, Messad and Ortigues-Marty2013) showed that the net portal absorption of essential AA was 20% higher for starch v. fiber diets at Low CP, whereas similar at Normal CP levels. A significant lower OM digestibility has been reported in the literature (Brandt et al., Reference Brandt, Rohr and Lebzien1981; Doreau et al., Reference Doreau, Delacroix, Jouany, Durier and Rémond1990; Peyraud et al., Reference Peyraud, Le Liboux and Verite1997) as the rumen protein balance become negative (higher N flowing to the duodenum compared with N intake). The OM digestibility in our study was significantly depressed with starch compared with fiber diets, in line with a higher microbial protein synthesis, but this reduction was higher at Low when compared to Normal CP level (−4.0 v. −1.0 percentage points, respectively; P=0.07). This reinforces the idea that microbial protein synthesis and consequently the rumen protein sparing effect of starch diets compared with fiber diets is higher at protein deficient diets than with Normal CP levels. Finally, some data on milk performances also support this synergy between Low protein and starch diets. For instance, the difference in feed utilization found in our study between fiber and starch diets was numerically higher at Low v. Normal CP levels (+9.6% v. −1.8% for DOMI/ECM and +8.7% v. +4.2% for PDIE/ECM, respectively).
Results from literature concerning the effect of CHO on milk protein yield are inconsistent (Kebreab et al., Reference Kebreab, Castillo, Beever, Humphries and France2000; Khalili and Sairanen, Reference Khalili and Sairanen2000; Hristov and Ropp, Reference Hristov and Ropp2003), likely because: (i) the effect of the CHO is often confounded with the total amount of energy and protein consumed or (ii) variations of CHO composition was not high enough to detect biological or statistical differences. In the present experiment diets were formulated with three objectives: (1) to ensure iso-caloric feeding levels across the four treatments, (2) to ensure similar N intakes within each CP level and (3) to promote an intake of carbohydrates highly different in composition between starch and fiber diets. Although small refusals with fiber diets were found, all four diets were iso-energetic on an ME basis (ME=15.58×DOMI; Agricultural Research Council (ARC) 1984) and iso-PDIE within each dietary CP level. As intended, the digestible NDF to DOMI ratio differed widely between fiber and starch diets, suggesting different rumen fermentation profile and energy-yielding nutrient absorption (Nozière et al., Reference Nozière, Ortigues-Marty, Loncke and Sauvant2010). Finally, although the particle size of feed ingredients (not measured in this study) could impact the rumen fermentation through changes in rumen pH, the steady feeding pattern imposed in this experiment (eight meals per day) may have prevented big differences across diets. Our results showed that at similar energy (digestible OM) and protein (PDIE) intakes, diets rich in starch improve milk protein yield, in agreement with others (Sutton et al., Reference Sutton, Morant, Bines, Napper and Givens1993; Keady et al., Reference Keady, Mayne and Marsden1998; Kebreab et al., Reference Kebreab, Castillo, Beever, Humphries and France2000) and increased the MNE (Figure 1a) compared with diets rich in fiber. Conversely, results by Van Knegsel et al. (Reference Van Knegsel, van den Brand, Graat, Dijkstra, Jorritsma, Decuypere, Tamminga and Kemp2007) as well as Hristov and Ropp (Reference Hristov and Ropp2003) comparing glucogenic v. ketogenic diets in early and late lactation dairy cows, respectively, did not find any differences in milk protein yield ascribed to the CHO. When the limited number of observations from the present study were combined with data from two other INRA-trials (total number of observations=48) sharing the same iso-NEL treatment effects (CP level and CHO) the MNE was found to be significantly (P<0.01) improved by 8.6% (Cantalapiedra-Hijar et al., Reference Cantalapiedra-Hijar, Fanchone, Noziere, Peyraud, Lemosquet, Doreau and Ortigues-Marty2012) with diets rich in starch compared with fiber, in agreement with larger data analysis (Northern European data set in Huhtanen and Hristov, Reference Huhtanen and Hristov2009). The uniqueness of our study is that this effect was present even when cows were fed diets supplying protein below requirements (INRA, 2007).
Whether the positive effects of the dietary CHO composition on milk protein yield may partially arise from metabolic adaptations has long been a matter of debate. In the present experiment, both digestive and metabolic mechanisms may be involved. At similar DOMI, the conversion of the protein digestible in the small intestine (PDIE) into milk CP is improved by starch compared with fiber diets (Figure 1b), which could indicate either a higher metabolic efficiency of AA utilization or a different true protein supply non predicted by the actual INRA feeding system or a combination of both. Leiva et al. (Reference Leiva, Hall and Van Horn2000) suggested that differences in the type and quantity of absorbed metabolizable nutrients provided by starch v. fiber diets may explain differences in MNE in dairy cattle. Plasma metabolite concentrations are indicators of the relative glucogenic v. ketogenic potentials of rations, even if some are not fully discriminant (Van Knegsel et al., Reference Van Knegsel, van den Brand, Dijkstra, Tamminga and Kemp2005). Unexpectedly (see review by Van Knegsel et al., Reference Van Knegsel, van den Brand, Dijkstra, Tamminga and Kemp2005), glycemia was reduced for the starch diets, whereas plasma BHBA and insulin levels were increased and not modified, respectively. Recent results from a metabolic trial using identical diets on multi-catheterized Jersey cows (Cantalapiedra-Hijar et al., Reference Cantalapiedra-Hijar, Rodriguez-Lopez, Illovies, Messad and Ortigues-Marty2013) showed that net portal absorption of glucose was higher for starch compared with fiber diets. In this situation, the lower glycemia observed in the present study with starch compared with fiber diets could indicate a higher utilization of glucose by both the splanchinc and the peripheral tissues with starch diets. On the other hand, in absence of increased mobilization of adipose tissues, as suggested by measured plasma NEFA concentrations and the calculated energy balance, the higher plasma BHBA concentrations likely arise from increased butyrate absorption and conversion to BHBA in the rumen wall (Kristensen et al., Reference Kristensen, Pierzynowski and Danfaer2000). Because animals were fed every 3 h at restricted intake levels, the possibility of a subacute butyric acidosis associated with starch diets (Eadie et al., Reference Eadie, Hyldgaard-Jensen, Mann, Reid and Whitelaw1970) should be considered here. Results from the aforementioned metabolic trial (Cantalapiedra-Hijar et al., Reference Cantalapiedra-Hijar, Rodriguez-Lopez, Illovies, Messad and Ortigues-Marty2013) confirmed an almost twofold higher butyrate net portal absorption for starch compared with fiber diets.
Other metabolite data, limited to the systemic circulation where concentrations are the result of supply minus utilization, give some hints of metabolic adaptations without allowing a detailed interpretation. The fact that plasma concentrations of Glu and Ala, both playing important roles in N and carbon shuttles in the body, were affected by the dietary CHO suggest that the different type of absorbed energy-yielding nutrients between starch and fiber diets could interact with the AA utilization at the organ and tissue levels (Cantalapiedra-Hijar et al., Reference Cantalapiedra-Hijar, Rodriguez-Lopez, Illovies, Messad and Ortigues-Marty2013). In this sense, both the duodenal infusion of glucose and the ruminal infusion of C3 in dairy cows fed diets based on grass silage were shown (Lemosquet et al., Reference Lemosquet, Delamaire, Lapierre, Blum and Peyraud2009) to decrease Ala and increase Glu plasma concentrations, as in our study.
Despite the higher secretion of N into milk with starch diets (Figure 1a), the urinary N excretion did not decrease compared with fiber diets, in accordance with a similar MUN (Kohn et al., Reference Kohn, Kalscheur and Russek-Cohen2002). This unexpected finding disagrees with most published results in the literature, where an increase in milk N output is generally associated with a decrease in urinary N excretion (Kebreab et al., Reference Kebreab, Castillo, Beever, Humphries and France2000; Broderick, Reference Broderick2003). The fact that in our study animals were in late lactation could have favoured a different pattern of nutrient partitioning compared with studies using early to mid lactation dairy cows. However, experimental errors and N losses associated with the 24-h urine collection (Spanghero and Kowalski, Reference Spanghero and Kowalski1997) should not be rejected.
This study confirms that the manipulation of the dietary CP concentration is an adequate strategy for increasing MNE in dairy cows, and thus to potentially decrease the urinary N excretion. The decline in milk and milk protein yield observed at Low CP content (12.0%) might preclude the general use of this strategy for production purposes. However, present results show that at similar digestible OM and protein (PDIE) intakes, diets with greater amount of starch improve the MNE compared with diets rich in fiber while increasing milk production, and thus, partially compensate the negative effects of low dietary CP content on milk production. Further investigation on the mechanisms actually involved in this improvement is warranted.
Acknowledgments
This study was granted by the Commision of the European Communities; project FP7-KBBE-2007-1 ‘Rednex’. G. Cantalapiedra-Hijar gratefully acknowledges the receipt of a scholarship from PHASE department (INRA). The authors thank Adisseo (Commentry, France) for financial support to conduct the study. They also thank C. Cossoul, A.S. Bage, J. Fernández, T. Garcia as well as the experimental unit “Les Cèdres” for technical assistance.