I. INTRODUCTION
Silicon carbide (SiC) is a semiconductor with a wide band gap, a high electrical breakdown field, and a high saturated electron velocity, which make it suitable for high power, high frequency, and high temperature applications. SiC is also chemically stable, resistant to radiation damage, and extremely hard (high Young’s modulus). Due to these exceptional properties, as compared with silicon (Si), SiC is now receiving added attention.
Among the polytypes of SiC, cubic SiC (i.e., 3C–SiC) possesses unique properties, such as high electron drift velocity, which is more suitable for high frequency power devices.Reference Nelson, Halden and Rosengreen1 However, the most important property of 3C–SiC is that it can be grown on large diameter Si substrates, offering the possibility for low-cost batch processing, which makes SiC more attractive for sensors and device applications.Reference Sarro2 Unfortunately, due to high residual stresses (which normally arise during the growth process), the use of SiC processed using Si-based sensor or device fabrication techniques has been somewhat limited. In thin films, the residual strain/stress field determines the final wafer bow that has important implications with regard to processing, epitaxial quality, and films properties.Reference Reddy, Volinsky, Frewin, Locke, Saddow, Le Bourhis, Morris, Oyen, Schwaiger and Staedler3, Reference Anzalone, Camarda, Locke, Alquier, Severino, Italia, Rodilosso, Tringali, La Magna, Foti, Saddow, La Via and D’Arrigo4Therefore, it is necessary to reduce and control the residual stress in 3C–SiC films for high performance micro-electro-mechanical-system (MEMS) devices.
During epitaxial growth, the flux ratio of Si and H, which determines the growth rate, drastically alters the growth conditions and affects the wafer bow and the residual stress. It was observed that reducing the growth rate (and thus increasing the growth duration) resulted in an inversion of the stress from tensile to compressive.Reference Zielinski, Ndiaye, Chassagne, Juillaguet, Lewandowska, Portail, Leycuras and Camasse5For a better understanding of the impact that the growth rate has on the residual stress and film crystallinity of low pressure chemical vapor deposition (LPCVD)-grown 3C–SiC heteroepitaxial films, in this work, three 3C–SiC films of the same thickness were grown at three different deposition rates on individual 50-mm diameter (100) Si wafers. In this work, through profilometer analysis, micro-Raman, x-ray diffraction (XRD), and micromachined freestanding structures, crystal quality, and residual stress related to the growth rate were evaluated.
II. EXPERIMENT
For this experiment, a 3C–SiC heteroepitaxial film was grown on 2 inches on-axis (100) oriented Si wafers in a hot-wall chemical vapor deposition (CVD) reactor. The (100) orientation was chosen for its crystal proprieties and the (100) Si allows a better etch selectivity for the KOH solution during the freestanding structure releasing.Reference Coletti, Saddow, Frewin, Hetzel, Virojanadara and Starke6, Reference Anzalone, Severino, D’Arrigo, Bongiorno, Abbondanza, Foti, Saddow and La Via7 A high-quality 3C–SiC epitaxial growth process was used to reduce the defect density in the growing layer and to improve its crystalline quality.Reference Frewin, Locke, Wang, Spagnol and Saddow8 The entire deposition consisted of two different steps, namely carbonization followed by growth. During carbonization, propane (C3H8) and hydrogen (H2) flow through the reactor, while the temperature is ramped to 1135 °C at a process pressure of ∼400 Torr. Once the temperature stabilizes at 1135 °C, the wafer is held under a steady-state condition of gases flow, temperature, and pressure for 4 min. This allows the conversion of the Si wafer surface to a 3C–SiC buffer layer. This process was adapted to reduce the formation of voids underneath the interface between 3C–SiC and Si, due to the selective out-diffusion of silicon from the substrate by a reaction of silicon with a suitable hydrocarbon gas. After the 4-min carbonization plateau, the growth phase began. Silane (SiH4) was then introduced into the gas stream; the temperature was ramped to 1370 °C, while the process pressure was maintained at 400 Torr. The SiH4 flow was incrementally increased with the C3H8 flow to maintain a stoichiometric ratio conducive for growth of crystalline 3C–SiC. Were used 2, 2.5, and 3 sccm of C3H8 and 54, 67, and 81 sccm of SiH4 for the films grown at 2.45, 3.21, and 4.00 μm/h, respectively. This process was used for the three 3C–SiC films grown on (100) Si substratesReference Reyes, Shishkin, Harvey, Saddow, Dudley, Capano, Kimoto, Powell and Wang9 at 2.45, 3.21, 4 μm/h of growth rate measured at the wafer center. The FTIR measurements show that, due to the lack of wafer rotation during film growth, the sample thickness varied between 2.3 μm (center) and 2.5 μm (edge) across the 50-mm wafer diameter in a direction [110], parallel to the main flat (transverse to the flow direction), while the thickness varied between 3.3 μm (upstream) and 2.2 μm (downstream) along a directionReference Nelson, Halden and Rosengreen1–Reference Klein10perpendicular to the main flat (flow direction).
III. RESULTS
The stress in the 3C–SiC films was determined using a profilometer system, which measures the changes in the surface profile caused by deposition of a stressed thin film. The initial stress (σ) was calculated using a modified Stoney’s equation that takes into account the elastic relation of the film to wafer bendingReference Klein10:
 $${\rm{\sigma }}\, = \,{{M_{{\rm{film}}} \times h} \over {\Delta R}}\,{{1 + 4mn + 6mn^2 + 4mn^3 + m^2 n^4 } \over {6mn(1 + n)}}\quad,$$
where m = M film/M sub are the biaxial modulus [M = E/(1 − ν)] of the film substrate and n = t/h, where t and hare the individual thicknesses of the substrate and film, respectively.
The values of Young’s modulus (E) along the <100> axis and Poisson’s ratio (ν) were taken to be 130 GPa and 0.279 for siliconReference Wortman and Evans11 and 379 GPa and 0.44 for SiC, respectively.Reference Kunc, Balkanski and Nusimovici12 ΔR is the change in radius of curvature determined from (1/R) = (1/R 2) − (1/R 1), where R 1 is the average radius of the substrate before film deposition. The substrate deforms to a new radius R 2after the film is deposited.
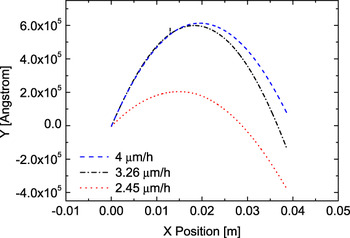
Samples profile z(x) was deduced from ex situ surface profiler measurements along 40-mm wafer diameter, [110] direction (parallel to the wafer flat). The film profiles are shown in Fig. 1for the three growth rates, where the nonsymmetry of the measured data is due to a slight tilt of the wafer. From this analysis, all three films are under apparent (see later) compressive stress.
Wafer profile for the three different growth rate values: 2.45, 3.21, 4.00 μm/h. All the measurements were performed along the [110] direction (parallel to the wafer flat).

The value of curvature (not shown) was obtained by fitting the measured wafer profile with a parabolic curve [ $z(x) = a + bx + cx^2 $] where the quadratic term is the proper curvature value [
 $K(x) = {{\partial ^2 z(x)} \mathord{\left/ {\vphantom {{\partial ^2 z(x)} {\partial x^2 }}} \right. \kern-\nulldelimiterspace} {\partial x^2 }}$. The calculated curvature values are −0.08, −0.15, and −0.26 m−1 for the films grown at 2.45, 3.21, and 4.00 μm/h, respectively. From these values, it is possible to observe that the wafer curvature (the inverse of the curvature radius) decreases with decreasing growth rate. From the measured sample curvature, one can determine the average stress within the layer using Eq. (1). The calculated stress increases with growth rate, from 0.3 to 0.92 GPa for 3C–SiC films grown at 2.45 and 4.00 μm/h, respectively. From the modified Stoney’s equation, the lower stress value corresponds to the lower growth rate, with all films under compressive stress. We will show later that, due to defects generated in the silicon substrate during the first stages of the growth process, this analysis, i.e., the use of the Stoney’s equation to determine the stress status of the film, is quantitatively and qualitatively wrong.
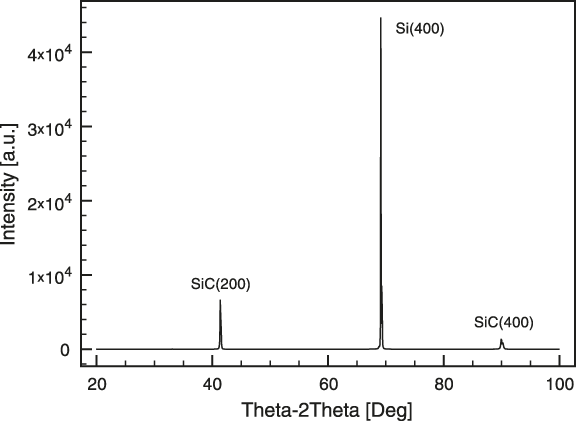
The effect of the growth conditions (i.e., reactor pressure, substrate temperature, and inlet gas composition) on the density of defects is related to the growth rate.Reference Yun, Takahashi, Ishida and Okumura13 The structural information and the crystal plane orientation of the 3C–SiC film grown on Si were determined using high-resolution XRD. Bragg diffraction through θ–2θ XRD patterns was recorded on a Phillips X’pert Diffractometer. A typical diffraction pattern related to the 3C–SiC(100) orientation was observed (Fig. 2).
XRD analysis: θ–2θ line scans of 3C–SiC on silicon substrate. In the spectra, in addition to the (400) silicon peak (2θ ≈ 69.1°), only the SiC (200) (2θ ≈ 41.3°) and the second-order SiC (400) peaks (2θ ≈ 90°) related to the (100) orientation are present.
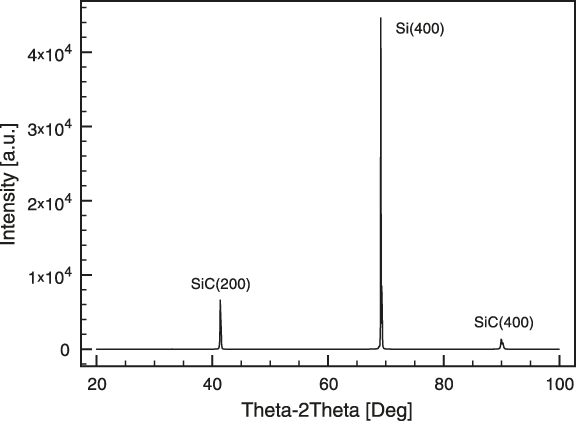
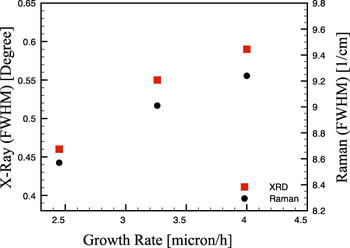
In the spectra, in addition to the (400) silicon peak (2θ ≈ 69.1°), only the SiC(200) (2θ ≈ 41.3°) and the second-order SiC(400) peaks (2θ ≈ 90°) related to the (100) orientation are present. In this work, the crystalline quality of the samples was determined by high-resolution XRD measurements of the (200) 3C–SiC diffraction planes via rocking curve analysis. The relative density of defects was determined from the full-width at half-maximum (FWHM) value of the rocking curve.Reference Cullity14 The FWHM rocking curve values are 0.46°, 0.55°, and 0.59° for 3C–SiC films grown at 2.45, 3.21, and 4.00 μm/h, respectively (Fig. 3—squared point). All measurements were performed at the center of the wafer. From the rocking curve analysis, it is possible to observe that by reducing the growth rate, the defect density decreases.
Squared points: FWHM of the XRD rocking curve data. Circled points: FWHM of the Raman TO vibration mode. Both measurements were performed at the wafer center.

The crystalline quality was measured also by Raman spectroscopy using a HR800 integrated system by Horiba Jobin Yvon (Stanmore, UK) in a backscattering configuration with a microscope coupled confocally to an 800-mm focal length spectrograph. The excitation wave length is supplied by a He–Ne laser (with wave length 632.8 nm and power 20 mW) that was focalized on the sample by a ×100 objective with numerical aperture of 0.95. We analyzed the transverse optical (TO) mode because it is not affected by doping (in this case, unintentionally doping) and it is suitable to probe not only the crystal quality (order of the crystal lattice) but also the stress fields. Raman FWHM values of the TO vibration mode of 8.57, 9.01, and 9.24 cm−1 were found for 3C–SiC films grown at 2.45, 3.21, and 4.00 μm/h, respectively (Fig. 3—circled point). From the FWHM of the x-ray rocking curve and TO Raman mode peaks, it is clear that the quality of the growth film is strictly related to the growth condition, with an evident increase of the film quality (in terms of the defect density) with decreasing growth rate, consistent with the XRD results.
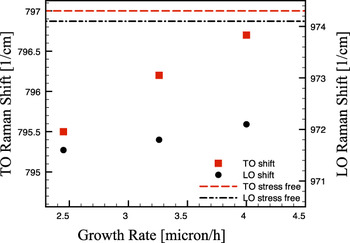
Fig. 4 shows the TO and longitudinal optical (LO) Raman shift for the three different growth rates. From this analysis, it is possible to observe that the stress nature is tensile and the sample growth at 2.45 μm/h is farther from the theoretical stress-free value (797 and 974 cm−1 for TO and LO Raman modeReference Rohmfeld, Hundhausen, Ley, Zorman and Mehregany15, Reference Pezoldt, Stauden, Niebelschütz, Alsioufy, Nader and Masri16) than the other samples, thus the 2.45 μm/h sample results as the “most stressed” one. With emphasize here that, considering the downward curvature of the wafers, all three films shows compressive stress with the 2.45 μm/h sample being, apparently, the “less stressed” one.
TO (dots) and LO (circles) Raman shifts of 3C–SiC/Si for the three different growth rate. Dashed and dashed dotted lines are the TO and LO stress-free values, respectively.Reference Rohmfeld, Hundhausen, Ley, Zorman and Mehregany15, Reference Pezoldt, Stauden, Niebelschütz, Alsioufy, Nader and Masri16

To clarify this inconsistency and discern the true stress status of the SiC film, on the three samples, we micromachined different freestanding structures as stress probes.Reference Anzalone, D’Arrigo, Camarda, Locke, Saddow and La Via17The planar rotating microstructure is an extremely sensible stress probe, both for the mean and gradient one, more than the freestanding cantilever, which is commonly used for the stress analysis. From this measure, all the films are under tensile stress, consistent with the Raman results.
Following the theory developed by Drieenhuizen et al.,Reference Drieenhuizen, Goosen, French and Wolffenbuttel18 the rotation of the tip (δx) can be expressed by the geometric configuration of the system, with a linear relationship between the stress and the deflection of the tip of the pointer for both compressive and tensile stress:
 $$ \lt {\rm{\sigma }}_T >\, = \,{{L_{\rm{O}} E} \over {\left( {L_{\rm{A}} + L_{\rm{B}} } \right)\left( {L_{\rm{C}} + {1 \over 2}L_{\rm{O}} } \right)}}{\rm{\delta }}_x \quad,$$
where L C is the length of the central arm (probe arm), L A and L B are the lengths of the two anchorage arms, and L O is the distance between the turning points (see Fig. 5). From the planar rotation (δx) of the rotating probe, it is possible to evaluate the total average stress (<σT>).
To this end, a Zeiss Scanning Electron Microscope was used to observe the released structures after micromachining. The micromachined rotating probe displays the center probe arm (L C) turned to the left under a “tensile” force applied from the lateral arms (not shown).
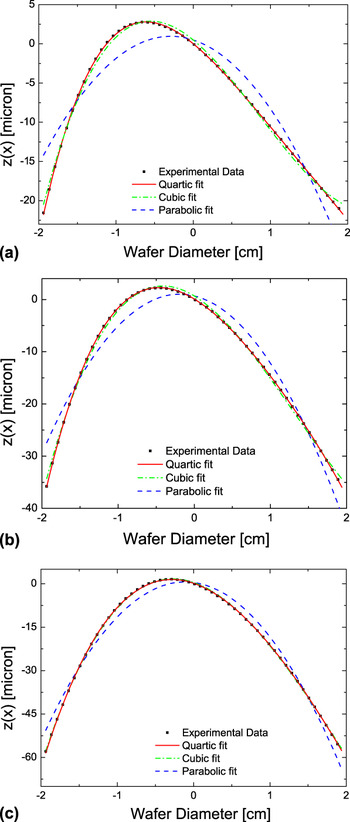
Wafer profile (square), parabolic fit (dashed line), and polynomial cubic fit (continuous curve) for the three growth rate values, (a), (b), and (c) for 2.45, 3.21, and 4.00 μm/h, respectively.

IV. DISCUSSION
Comparing the experimental data reported in Figs. 3, 4 and Table I, it is possible to observe that to the lower crystal quality (observed by XRD and micro-Raman FWHM) of the 4 mm/h sample corresponds a lower residual stress value (observed by TO Raman shift). This result is consistent with literature.Reference Anzalone, Severino, D’Arrigo, Bongiorno, Abbondanza, Foti, Saddow and La Via7 In literature, it was also observedReference Anzalone, Camarda, Canino, Piluso, La Via and D’Arrigo19–Reference Cimalla, Pezoldt and Ambacher21 that to a higher film quality corresponds a higher Young Modulus, i.e., a higher rigidity of the film. This higher rigidity would result in a lower bow, which is again consistent with our results (Table I and Fig. 3). Furthermore, considering the relation between the stress and quality, observed for the difference processes, it is evident that defects allow for a reduction of the residual stress inside the film and that the growth rate plays a fundamental role on the crystal quality, and thus on the residual stress, of the grown films.
Growth Rate measurement

a Planar rotating probe in-plane rotation.Reference Anzalone, D’Arrigo, Camarda, Locke, Saddow and La Via17
On the other hand, as noted in Refs. Reference Camarda, Anzalone, La Magna and La Via22 and Reference Camarda, Anzalone, Piluso, Severino, Canino, La Via and La Magna23 and presented in the first part of the paper, there is an inconsistency between local analysis: both confocal Raman and planar rotator deflections indicate a tensile residual stress in the film, while the convex bow of the wafer, assuming the validity of the conventional theory of wafer bow,Reference Klein10 seems to indicate a film under compressive stress. As can be seen in Table I, this inconsistency is present for all the grown samples. In Refs. Reference Camarda, Anzalone, Piluso, Severino, Canino, La Via and La Magna23 and Reference Watts, Attolini, Besagni, Bosi, Ferrari, Rossi, Riesz and Jiang24,this inconsistency was explained making the hypothesis of the presence of a defective region in the silicon substrate, near the heterointerface, that generated an intense compressive stress capable of bowing the whole heterosystem downwards (i.e., “pulling” downward the SiC film and generating the observed tensile stress).
This defective region could be generated during the early stage of the growth (i.e., the “carbonization” step) where it is known that voids and other defects nucleate underneath the interface between the 3C–SiC and the silicon substrate.Reference Watts, Attolini, Besagni, Bosi, Ferrari, Rossi, Riesz and Jiang24
In this work, we extend this analysis considering the influence of the growth rate and the film thickness. Specifically, by taking advantage of the resulting thickness gradient along the gas flow direction due to the lack of wafer rotation, we can experimentally determine the curvature of the wafer K (h film) as function of film thickness h filmfor the three different growth rate values and compare it with the theoretical one using finite element simulations.
Figure 5 shows the film profiles z(x) and the fits along the 40-mm-wide diameter of the wafer in the direction of the gases flow (i.e., the [110] direction orthogonal to the wafer flat and to the profiles shown in Fig. 1), for the three different growth rate values: (a) 2.45, (b) 3.21, and (c) 4.00 μm/h, respectively. Fitting the profiles, we can extract the, local, curvature as  $K(x) = {{d^2 z(x)} \mathord{\left/ {\vphantom {{d^2 z(x)} {dx^2 }}} \right. \kern-\nulldelimiterspace} {dx^2 }}$. To determine
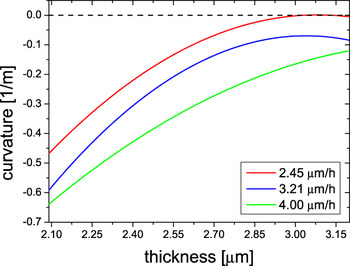
 $K(h_{{\rm{film}}} (x))$, we measured the thickness variation for the three samples using FTIR analysis obtaining variations in the following ranges: 1.6–2.78, 1.78–3.06, and 2.04–3.27 μm for the low, medium, and high growth rates, respectively. Using these values, we can determine the local curvature of the films as function of the thickness for the three growth rates considered (Fig. 6).
From the comparisons with the different fitting functions (see Fig. 6), it is possible to observe that the parabolic curve ( $z(x) = a + bx + cx^2 $, dashed lines) does not fit the experimental data. This result is justified with the nonuniformity of the thickness profile along the flow direction (thickness gradient), which results in a variation of the curvature along the gas line (x).Reference Camarda, Anzalone, Piluso, Severino, Canino, La Via and La Magna23 For this reason, we tried also a cubic [
 $z(x) = a + bx + cx^2 + dx^3 $, dashed and dotted lines] and a quartic [
 $z(x) = a + bx + cx^2 + dx^3 + ex^4 $, solid lines] fitting functions. The first one generates a linear relation between the curvature and the film thickness [
 $K(x) = {{d^2 w(x)} \mathord{\left/ {\vphantom {{d^2 w(x)} {dx^2 }}} \right. \kern-\nulldelimiterspace} {dx^2 }} = 6dx + c$], whereas, in the second case, this relation is nonlinear [
 $K(x) = {{d^2 w(x)} \mathord{\left/ {\vphantom {{d^2 w(x)} {dx^2 }}} \right. \kern-\nulldelimiterspace} {dx^2 }} = 12ex^2 + 6dx + c$] (note that, based on the FTIR analysis, we assume a linear variation of the film thickness along the gas line, i.e.,
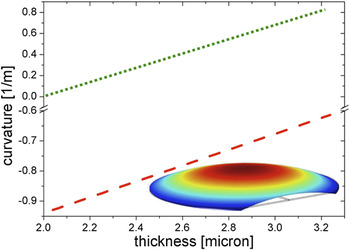
 $h_{{\rm{film}}} \propto (h_{\min } - h_{\max } )(x/L) + h_{\max } $, where L is the length of the wafer along the gas line). The Stoney’s equation predicts, in the thin film limit and assuming a constant stress in the film, a linear relation between the curvature and the film thickness.Reference Klein10, Reference Freund, Floro and Chason25 On the other hand, when a stress gradient in present in the film, this linearity is lost.Reference Camarda, Piluso, Anzalone, La Magna and La Via26 The comparison of the data with the different fitting functions shows that only the quartic polynomial function correctly describes the data; this implies that a stress gradient is present in all the analyzed films and that this stress variation is larger in the case of the lowGr sample. This result is consistent with the higher quality of this film, which implies a strong variation of the defect density (and thus of the stress) from the interface to the surface. Furthermore, independently of the presence of a stress gradient in the film, if we assume a defect-free substrate (i.e., if we assume that the bending stress is totally located only in the film), we would expect a monotonically decreasing curvature (either linear or nonlinear) passing through the origin (i.e., zero film thickness corresponds to zero curvature, see Fig. 7 and Ref. Reference Camarda, Anzalone, Piluso, Severino, Canino, La Via and La Magna23) for increasing film thickness. This is in odd with what found since we obtain, instead, an increasing (not a decreasing) curvature for increasing thickness. These results can be explained with our hypothesis of defective substrate and are fully justifiable if we consider that the curvature is mainly generated from a defective layer inside the silicon substrate. Indeed, when film thickness increases, the effect of the defective substrate on the overall curvature is less relevant, and
 $K(h_{{\rm{film}}} )$ decreases with h film, eventually reaching an inversion point for a certain value h inv for thick enough films. h inv is closely connected, among others, to the elastic properties of the film and, thus, to its quality, so that we obtain a smaller value of h invin correspondence of the lowGr sample.
Curvature along the gases flow, [110] direction (orthogonal to the wafer flat) as a function of film thickness for the three different growth rate values.

To theoretically support these results and to verify that the coexistence of different film thicknesses on the same sample (wafer) could no be responsible for such observed anomalous profiles and stress status [all the analytical models are generally derived neglecting boundary effects (i.e., infinite wafers) and assuming constant film thickness (neglecting shear terms)], we simulated, using finite element simulations,27 a 2-inch wafer with the observed thickness gradient with and without a silicon defective region (see the simulation results in Fig. 7). As it can be seen by the comparison of the two cases, the simulation analysis is fully consistent with the existence of the defective region.
Simulated curvature of the wafer along the thickness gradient, with (red dashed line) and without (green dotted line) the compressive/defective silicon region. Caption shows the simulated wafer, and the different colors show the vertical deflection (exaggerated for clarity). In both cases, the film is assumed under an initial tensile stress.

V. CONCLUSIONS
In this work, the influence of the growth rate on the 3C–SiC heteroepitaxial residual stress was studied. In the experiment, three films with different growth rate values were analyzed by profilometer system, XRD, and micro-Raman spectroscopy. We found that an increase of the growth rate resulted in a decrease the crystal quality of the film. The profilometer analysis performed shows the negative curvature of the film for all the three growth rates considered, which means a compressive residual stress of the film, but micromachining analysis and micro-Raman shift show the 3C–SiC film as being under a tensile stress status. We interpret these contradictions as generated by a compressive/defective region, located in the substrate, which is dominating the overall deflection of the wafer. We support this hypothesis both using an analytical theory, Refs. Reference Camarda, Anzalone, Piluso, Severino, Canino, La Via and La Magna23 and Reference Watts, Attolini, Besagni, Bosi, Ferrari, Rossi, Riesz and Jiang24, and finite element simulations. Specifically, using the latter technique, and taking advantage of the thickness gradient of the films, we were able to compare the simulated, local, wafer curvature as function of the thickness with that observed for the three grown samples. This comparison supports the hypothesis of the existence of the defective region and the simulated deflections and residual stress have been found in agreement with micro-Raman and micromachining analyses.