Over a decade after the Great Recession, household indebtedness has been rising again in many advanced economies. Mortgages, student debt, car loans and credit card debt have become part of many people's day-to-day concerns. The sharp increase in household borrowing in the years leading up to the financial crisis in 2008 has reinvigorated a long-standing debate in the political economy literature about what, if any, relationship exists between debt and the welfare state. Dating back to Kemeny's (Reference Kemeny1981, Reference Kemeny2001) observation that countries with high levels of homeownership tend to have less developed welfare states, a growing body of work suggests a trade-off relationship between credit markets and the welfare state, implying that the former can substitute for the latter. Rising indebtedness has been associated with individuals' desire to maintain their living standards in light of growing levels of socio-economic inequality (Frank Reference Frank2010; Kumhof, Rancière and Winant Reference Kumhof, Rancière and Winant2015), wage stagnation (Rajan Reference Rajan2010; Stiglitz Reference Stiglitz2015) and limited social benefits (Prasad Reference Prasad2012; Trumbull Reference Trumbull2014). Ahlquist and Ansell (Reference Ahlquist and Ansell2017) have identified a partisan link between inequality and demand for credit, where left-wing governments resort to fiscal redistribution while right-wing governments replace social spending with policies that improve credit availability. Growing household debt may therefore be the result of weak welfare states.
Deregulation and the liberalization of financial markets are key drivers behind these dynamics, as easier access to credit offers policy makers convenient ways to manage growing societal demands, democratic overload, and fiscal constraints by circumventing politically contested issues related to taxation and redistribution (for example, Krippner Reference Krippner2011; McCarty, Poole and Rosenthal Reference McCarty, Poole and Rosenthal2013; Quinn Reference Quinn2019). By expanding private instead of public debt, ‘privatized Keynesianism’ has replaced public deficit spending as a political modus operandi (Crouch Reference Crouch2009).
While the political economy literature has identified a trade-off between debt and welfare states, we only have limited empirical evidence on whether growing indebtedness is the consequence of inadequate welfare states, and how it matters politically. This evidence is mostly limited to cross-national research that relies heavily on aggregate measures of social expenditures and overall debt levels. These measures are potentially correlated with other confounding variables and do not capture the logic of compensatory borrowing to address income losses in the presence of weak social policies. By contrast, single-country case studies rarely provide proof of an explicit relationship between household indebtedness and the social policy context; nor do they establish a causal link between welfare state generosity and household indebtedness. Often, evidence of their claims is assumed (for example, Rajan Reference Rajan2010) rather than empirically substantiated. Perhaps more importantly, we lack compelling micro-level evidence that households borrow money as a consequence of varying social policy generosity. Rectifying these shortcomings will help us understand whether rising indebtedness is causally linked to welfare state generosity, which in turn has political implications for welfare state support.
A large body of work has traced the micro-foundations of social policy preferences to income (Meltzer and Richard Reference Meltzer and Richard1981, Romer Reference Romer1975), labor market risk and skill specificity (Cusack, Iversen and Soskice Reference Cusack, Iversen and Soskice2007; Iversen and Soskice Reference Iversen and Soskice2001), economic insecurity (Hacker, Rehm and Schlesinger Reference Hacker, Rehm and Schlesinger2013; Margalit Reference Margalit2013) and wealth (Ansell Reference Ansell2014; Hariri, Jensen and Lassen Reference Hariri, Jensen and Lassen2020). But we know little about how household indebtedness influences social policy preferences, partly due to a lack of micro-level data on policy preferences and balance sheet information. If borrowing and indebtedness are the results of limited social benefits, we would expect higher levels of debt to affect voters' preferences for greater social spending, depending on the welfare state's generosity. One underlying reason is that voters want a stronger social safety net to address economic risk and insecurity when indebtedness is high and welfare states are weak. Debtors demand stronger social protection against downstream income losses that could increase economic distress and jeopardize debt repayments, thus increasing the probability of payments falling into arrears and, at worst, bankruptcy.
This article contributes to these debates by examining the micro-level empirical foundations of the relationship between credit markets and welfare states and by documenting important political consequences of rising indebtedness in weak social policy environments. First, I offer individual-level evidence that credit has become a private alternative to public social policies in the context of the American welfare state. Combining variation in the generosity of unemployment insurance (UI) benefits across states and over time with panel data from the Survey of Income and Program Participation (SIPP), I show that individuals who lose their jobs borrow more in states with less generous UI benefits compared to those who live in states with more generous benefits. In substantive terms, a 10-percentage-point increase in the state-level unemployment replacement rate lowers unsecured debt levels by about 30 per cent, or $5,300.
Secondly, I demonstrate that individuals' greater reliance on credit markets has downstream political consequences. I use two empirical strategies to overcome to lack of panel data on policy preferences and financial balance sheet information. In the first approach, I draw on a set of individual-level socio-economic characteristics from the Survey of Consumer Finances (SCF) to predict and impute unsecured debt levels using the same set of individual-level characteristics in the American National Election Study (ANES) 2000–2004 panel. In the second approach, I merge state-level debt-to-income ratios with the ANES panel. Both empirical strategies show that voters demand greater social spending as their debt burdens increase, conditional on the generosity of their state's social benefits. I then offer suggestive evidence that is consistent with the ‘debt-as-risk’ perspective. I show that the link between social insurance preferences, indebtedness and welfare state generosity is considerably stronger in states with high unemployment rates and among individuals whose financial situation has deteriorated over time. I also find that this relationship is more pronounced among Democratic than Republican voters, indicating greater support for government intervention among Democrats and a stronger belief in economic conservatism and free markets among Republicans.
Household indebtedness has wide-ranging socio-economic consequences, including severe economic downturns (Mian, Rao and Sufi Reference Mian, Rao and Sufi2013; Mian and Sufi Reference Mian and Sufi2014), a higher risk of financial crises (Schularick and Taylor Reference Schularick and Taylor2012), rising wealth and income inequality (Kumhof, Rancière and Winant Reference Kumhof, Rancière and Winant2015) and greater economic insecurity (Porter Reference Porter2012). This article shows that the welfare state's scope and generosity are important drivers of rising debt levels. From a policy perspective, the findings suggest that a more comprehensive social safety net could lessen individuals' need to borrow money, and thus help reduce overall indebtedness. It also highlights that shifting risks and voters' growing reliance on credit markets during periods of unemployment have implications for voters' support for social policies. I conclude by considering the socio-economic consequences of shifting entitlements and accountability from the political to the business realm, the political implications of relying on credit markets on social solidarity, and suggest avenues for further research.
Political Causes and Consequences of Rising Indebtedness: A Welfare State Perspective
The modern debate about the relationship between debt and the welfare state conceptualizes the link between the two domains as a trade-off. Spearheaded by Kemeny's observation that countries with high levels of homeownership tend to provide limited social benefits (Kemeny Reference Kemeny1981; Kemeny Reference Kemeny2001), more recent work has expanded this relationship beyond the housing domain to argue that credit markets more broadly can substitute for welfare states. Even though credit is rarely seen as part of the welfare regime (Esping-Andersen Reference Esping-Andersen1999), it increasingly fulfills social policy functions and has downstream socio-economic and political consequences.
How Credit Markets Substitute for Welfare States
A growing body of political economy research has identified a substitutive relationship between credit markets and welfare states. It originated in the domain of housing, in which scholars observed that countries with high homeownership rates and larger mortgage markets have less comprehensive welfare states. One reason is that homeownership and housing wealth serve as a private insurance and ‘nest egg’ during retirement, which reduces homeowners' reliance on public benefits (Ansell Reference Ansell2014, Conley and Gifford Reference Conley and Gifford2006; Kohl Reference Kohl2018; Schwartz and Seabrooke Reference Schwartz and Seabrooke2008). Another is that mortgage markets provide investment opportunities for capitalized pension funds, favoring private defined-contribution plans over public defined-benefit plans (Hassel, Naczyk and Wiß Reference Hassel, Naczyk and Wiß2019; Schwartz Reference Schwartz2012). More recent work has expanded the focus to compensatory borrowing in response to stagnating wages and attempts to sustain prior living standards (Hyman Reference Hyman2011; Rajan Reference Rajan2010), growing income inequality (Kumhof, Rancière and Winant Reference Kumhof, Rancière and Winant2015; Stiglitz Reference Stiglitz2015), and the use of credit as a broader ‘safety net’ in the absence of strong welfare states (Montgomerie Reference Montgomerie2013; Morduch and Schneider Reference Morduch and Schneider2017). Cross-nationally, Ahlquist and Ansell (Reference Ahlquist and Ansell2017) demonstrate that the degree of fiscal redistribution, which itself is a function of electoral and partisan politics, mediates the effect of income inequality on credit demand.Footnote 1
The deregulation of financial markets and the easing of borrowing constraints paved the way for credit to emerge as a private alternative to the welfare state. As Krippner (Reference Krippner2011) has argued, the expansion of credit markets through deregulation is by and large the unintended consequence of policy makers' attempts to deal with growing societal demands in light of limited fiscal capacity. Resource distribution through credit markets is politically easier and fiscally less costly than redistribution through taxation, in part because it depoliticizes contentious choices over the allocation of public goods (McCarty, Poole and Rosenthal Reference McCarty, Poole and Rosenthal2013; Quinn Reference Quinn2019). The deregulation of financial markets and banking sectors resulted in higher demand for credit in countries with residual welfare states (Prasad Reference Prasad2012). Voters and businesses also have an interest in expanding credit access. Societal groups that were previously excluded from credit markets became politically active and have successfully pushed against credit discrimination and advocated financial inclusion (Thurston Reference Thurston2018; Trumbull Reference Trumbull2014). Businesses have also supported market liberalization and the expansion of credit products to fuel the growing demand for credit (Hyman Reference Hyman2011). The rise of ‘privatized Keynesianism’ reflects deregulatory policy choices and promotes the expansion of consumption through private instead of public debt (Crouch Reference Crouch2009).
While the theoretical intuition behind the relationship between debt and the welfare state has been laid out, its empirical foundations remain thin. This article does not intend to intervene in debates about the precise origins of or the degree of political intentionality behind the trade-off between credit markets and welfare states. Instead, it offers new empirical evidence in support of the argument that borrowing serves as a private safety net when welfare policies are weak. Existing cross-national studies tend to rely on aggregate data, while single-country studies do not explicitly link indebtedness to the social policy context.Footnote 2 In some studies, empirical evidence is lacking altogether. Additionally, we often lack micro-level evidence that households borrow money during times of unemployment or other economic shocks as a consequence of differential social policy generosity. Macro-level relationships between welfare state spending and overall debt levels may suffer from ecological inference problems, as they infer individual-level behavior from aggregate data. And yet, this individual-level behavior is critical to the argument. The notion that credit markets substitute for welfare states is based on the behavioral assumption that households use debt to cope with financial distress when welfare state support is weak. To understand whether limited public benefits lead to greater household indebtedness, thus giving rise to the substitutive relationship discussed in the literature, we have to compare individuals' borrowing responses to income shocks at different levels of welfare state generosity. This is the focus of the first part of the article: I use micro-level data to systematically test whether the substitutive relationship arises because a constrained welfare state leads to higher indebtedness.
The Political Consequences of Indebtedness
Relying on credit to cope with financial shocks in weak welfare states has political implications that have received little attention in the literature. If indebtedness is the consequence of limited social benefits, we would expect higher levels of debt to increase demand for social spending depending on the overall generosity of the welfare state. Most research on the micro-foundations of social policy preferences focuses on income, labor market risks and – more recently – assets. Individuals' support for redistribution depends on their position in the income distribution and the difference between the taxes paid and the benefits received (Meltzer and Richard Reference Meltzer and Richard1981; Romer Reference Romer1975). Social policies not only distribute resources; they also provide insurance against various forms of risk. Preferences for social insurance, therefore, depend on individuals' labor market status and exposure to economic risks (Hacker, Rehm and Schlesinger Reference Hacker, Rehm and Schlesinger2013; Margalit Reference Margalit2019; Rehm Reference Rehm2016) and the specificity of skills (Iversen and Soskice Reference Iversen and Soskice2001). More recent work has drawn attention to individuals' assets as a buffer against income losses. Homeownership, for example, offers a form of private insurance through housing assets as a ‘nest egg’. Rising asset prices increase both the value of the house and homeowners' private wealth buffer, which consequently makes homeowners less likely to support social insurance (Ansell Reference Ansell2014). By contrast, Hariri, Jensen and Lassen (Reference Hariri, Jensen and Lassen2020) show that savings-constrained households with limited liquid wealth are more likely to support social insurance because they lack alternative financial buffers.
While income, exposure to labor market risks and assets are strong predictors of social policy preferences, we know little about how the other side of households' balance sheets – liabilities – influences attitudes toward the welfare state. I argue that the overall generosity of the welfare state mediates the extent to which indebtedness increases support for social policies. One reason that debtors prefer a stronger social safety net is to cope with economic risks and insecurities. If individuals go into debt to privately address income losses because public support is limited, they might become more supportive of social policies and welfare spending because indebtedness can heighten future economic risks. To be sure, indebtedness does not necessarily pose a threat to individuals' economic and financial well-being as long as they can make regular debt repayments. However, a growing debt burden can amplify economic risks because future income losses make debt repayments more difficult and can lead to economic distress, payments falling into arrears and – at worst – bankruptcy (Porter Reference Porter2012). Debtors may therefore demand greater support from the government because they want to reduce future economic risks by receiving financial support in case they become unemployed and unable to service existing debt.
These dynamics are particularly pronounced in the context of a weak welfare state, where indebtedness can much more easily spiral into economic risks because government transfers – for example, during unemployment – are limited. In other words, the generosity of the welfare state mediates and amplifies the relationship between indebtedness and demand for social insurance. A weaker welfare state pushes individuals further into borrowing money to cope with income losses while also exacerbating the effect of future job losses by failing to provide sufficient financial support to individuals to service existing debt. Based on this ‘debt-as-risk’ perspective, I expect higher levels of household indebtedness to strengthen the demand for social spending because weaker welfare states increase debt-induced economic risks.
Individuals incorporate new information through learning processes and update their social policy preferences accordingly (Gerber and Green Reference Gerber and Green1999; Page and Shapiro Reference Page and Shapiro1992). In light of indebtedness and limited welfare state support, individuals reassess their own exposure to downstream risks and their ability to address them while also maintaining their debt repayments. Margalit (Reference Margalit2013), for example, invokes this updating logic to argue that individuals who experienced significant changes in their own economic circumstances during the economic recession of 2008–09 became more supportive of welfare policies. The preferences of individuals who held opposing political views prior to the recession converged once these individuals were hit by economic shocks. This suggests that as individuals go into debt to cope with income losses due to a limited welfare state, they update their assessment of the extent to which a weak social safety net exposes them to additional downstream debt-related economic risks. As a result, they demand a stronger welfare state.
In sum, I argue that credit serves as a private alternative to public social policies. Individuals go into debt and borrow money to cope with income losses when welfare state support is limited. Moreover, growing indebtedness increases individuals' support for social insurance, which is mediated by the generosity of the welfare state. One explanation is that voters demand social protection against downstream economic risks such as income losses that would make debt repayments more difficult and intensify financial insecurity. This leads to the following two main hypotheses that I will test empirically in the following sections:
Hypothesis 1: Individuals who experience financial shocks such as unemployment are more likely to borrow money to cope with resulting income losses when social benefits are weaker.
Hypothesis 2: When debt burdens grow, individuals are more likely to increase support for the welfare state when social benefits are weaker.
Credit, Debt and the Welfare State: Evidence from US States
Credit markets have become an important coping mechanism to help individuals and their families deal with economic and financial shocks such as rising expenditures, volatile incomes or outright income losses. But to empirically understand whether (and how) credit serves as a private alternative to publicly funded social policies, we need to move our unit of analysis to the micro level because individuals and households are the ones that experience financial losses and borrow in response. In this article, I test this argument in the context of the American welfare state. Leveraging variation in debt-to-income ratios and unemployment insurance generosity across US states and over time, I investigate how households use debt to address income losses during unemployment.
The US welfare state puts a strong emphasis on employer-based benefits and private insurance systems, particularly in the domains of pensions and health care (Hacker Reference Hacker2002; Hacker Reference Hacker2004). It relies heavily on ‘hidden’ transfers, most notably through the tax system, for example via the Earned Income Tax Credit (Howard Reference Howard1997; Mettler Reference Mettler2011). It also delegates responsibility for public social policy programs to private non-state actors (Morgan and Campbell Reference Morgan and Louise Campbell2011). States play a critical role in the landscape of US social policies. As part of the welfare reform under President Clinton, the 1996 Personal Responsibility and Work Opportunity Reconciliation Act (PRWORA) further strengthened states' jurisdiction over a wide range of social policy choices and transferred parts of the responsibility for social programs and their fiscal risk from the federal government to states. PRWORA allowed states to create new welfare policies determining who can receive welfare, what types of beneficiaries are exempted from new welfare work requirements, and the value of cash benefits (Fellowes and Rowe Reference Fellowes and Rowe2004).
In this article, I focus on unemployment insurance (UI), one of the most important social programs and financial lifelines during job loss (Gruber Reference Gruber1997). States run the basic unemployment insurance system and have a large degree of freedom to set UI benefit levels and maximum duration periods. In most states, basic unemployment insurance provides beneficiaries with an average replacement rate of around 50 per cent of their prior earnings for up to 26 weeks. The generosity of UI benefits, however, varies significantly across states and over time, resulting in large differences in the financial burden of unemployment that households have to shoulder.Footnote 3 Eligibility criteria are comparatively restrictive, granting benefits only to individuals who have lost their job through no fault of their own, are able to and actively seeking work, and have paid into the unemployment system for a certain period. Individuals who quit their job voluntarily are not eligible for UI. Within federally defined boundaries, states have significant room to set benefit levels and apply their eligibility criteria. US states therefore provide fertile grounds to shed light on the extent to which households across states go into debt to address the financial gaps resulting from variation in UI benefits during unemployment.
Data and Measurement
A common way to measure the generosity of UI benefits is the replacement rate, which captures the average UI payouts relative to prior earnings. Mostly used in a cross-national setting, I leverage the fact that UI replacement rates vary considerably across US states. I collect data on state-level UI replacement rates from the quarterly state-level UI Replacement Rates Report published by the US Department of Labor's (DoL) Employment and Training Administration.Footnote 4 The DoL calculates replacement rates as the ratio of the weighted average of the weekly benefit amount and the claimants' average weekly wage. The weekly wage is based on the hourly wage of the usual job of claimants, normalized to a 40-hour workweek.Footnote 5 This measure includes regular and extended benefits (EB). Figure 1 shows considerably more variation in UI replacement rates across states than suggested by the apparent stability in the aggregate. For example, California's replacement rates grew from 38 per cent in 2000 to 46 per cent in 2017, while states such as Arizona and North Carolina saw a decline from 52 per cent to 40 per cent over the same period.Footnote 6
Average UI replacement rates across US states
Notes: the black dots and the horizontal line show the US average.

Several factors can influence variation in UI replacement rates across states and over time. Political and legislative factors such as partisan dynamics, unionization rates and state policies' liberalism – a measure devised by Caughey and Warshaw (Reference Caughey and Warshaw2016) to capture the overall liberalism of a bundle of state policies – can shape duration periods, benefit amounts and eligibility criteria. Economic conditions such as growth rates, average disposable income levels, and state government revenues and expenditures are equally likely to matter. Appendix Table A1 shows the correlates of UI replacement rates with a set of political and macro-economic variables in a regression model with state and year fixed effects. State economic growth rates, average disposable incomes and state policy liberalism have small effects on UI replacement rates.
I study the link between UI benefit generosity and household indebtedness using panel data from the Survey of Income and Program Participation (SIPP), a household-based survey designed as a continuous series of national panels of multi-year periods. Individuals and their household members are followed for one panel, which lasts 3–6 years, and are interviewed every 4 months for the duration of the panel. Sullivan (Reference Sullivan2008) has used the 1996 and 2001 SIPP panels to estimate how the effect of unemployment on household borrowing varies across households with different asset holdings. My article goes beyond his study by focusing on states' unemployment insurance generosity as a driver of indebtedness during periods of job loss and by using the main surveys of the 1996, 2001, 2004 and 2008 panels in combination with annual topic modules on assets and liabilities. The SIPP records households' total unsecured debt as a single variable, which includes credit card debt, unsecured loans from financial institutions, outstanding bills including medical bills, loans from individuals, and educational loans. I focus on unsecured debt because it is the form of credit that is most accessible by individuals during times of economic distress. I then combine the SIPP panel with data on the generosity of UI benefits in respondents' states.
Borrowing During Unemployment in Different Social Policy Contexts
If credit markets substitute for welfare states, we would expect to see a negative relationship between UI replacement rates and household indebtedness. Individuals who become unemployed should borrow more money when they live in states with less generous welfare benefits compared to those who live in more generous states. The variation in UI replacement rates across states and over time discussed above allows me to estimate the effect of job loss on unsecured debt as a function of state-level UI replacement rates using the following model:
 $$Y_{it} = \beta _1U_{it} + \beta _2Gen_{st} + \beta _3( U_{it}\cdot Gen_{st}) + {\boldsymbol X}_{it}^{\prime} \gamma + {\boldsymbol Z}_{st}^{\prime} \lambda + \alpha _i + \delta _t + \varepsilon _{it}, \;$$
where Y it is the unsecured household debt (log) of individual i at time t.Footnote 7 U it is a dummy variable indicating whether individual i received unemployment benefits in year t. Since not all unemployed individuals receive UI benefits, this approach ensures that we estimate the effect among those who receive benefits. Gen st is the UI replacement rate in state s at time t.  ${\boldsymbol X}_{it}^{\prime} $ is a matrix of individual-level covariates, including highest educational degree, age and age squared, number of children, marital status, homeowner status, race, savings (log) and income quintiles.
One potential concern is that differences in UI replacement rates correlate with unobserved trends across states that also affect household borrowing. I address this concern in several ways. First, I include a set of state-level covariates  $( {\boldsymbol Z}_{st}^{\prime} ) $ that could confound the results. I use per capita gross state products and their annual growth rates, state per capita expenditures and revenues (log), union density and state unemployment rates to capture economic conditions and business cycle effects that could influence wages and people's propensity to borrow. These covariates also account for potential triggers of EB programs, which would increase the duration periods of UI benefits. I control for the median duration of state-level unemployment to address the potential concern that states with a higher share of long-term unemployed people within the UI population could have lower average replacement rates.Footnote 8 I further include state-level average disposable incomes to take into account income effects and changes in contribution levels, as higher UI contributions reduce disposable incomes. Finally, I add a set of political variables, including a dummy variable indicating whether the governor is a Democrat, the share of Democrats in the state House, and the overall state policy liberalism to account for political dynamics that can influence the generosity of UI benefits.Footnote 9 Household fixed effects (α i) capture all time-invariant individual characteristics and identify the effect of UI replacement rates on unsecured debt conditional on any given head of household switching into unemployment, thereby leveraging within-household variation. Year fixed effects (δ t) capture common time shocks, including those that could trigger EB programs. Finally, I provide a general check against the possibility that other state-varying factors, such as credit market regulation, influence household debt levels over time by including state-specific time trends. Robust standard errors are clustered at the household level.
As a robustness check, I also compute a different measure of UI generosity based on legislative information on per-person benefit levels and maximum duration periods in each state following Agrawal and Matsa (Reference Agrawal and Matsa2013) and Hsu, Matsa and Melzer (Reference Hsu, Matsa and Melzer2018). I obtain this data from the DoL's benefit schedules published in ‘Significant Provisions of State UI Laws’. This measure captures deliberate policy choices regarding the maximum amount and duration periods for unemployment benefits. Unlike expenditures, which are driven by both supply and demand, this UI benefit generosity measure is solely a supply-side measure and therefore well suited to measure changes in social policy making. Specifically, I compute the maximum UI benefit generosity by multiplying the maximum weekly benefit amount by the maximum amount of benefit weeks for each state and year. Appendix Figure A2 plots maximum UI benefits by state.
Table 1 shows the results for models using UI replacement rates with individual-level controls (Column 1), state-level controls (Column 2) and state-year time trends (Column 3) as well as for models using UI maximum generosity (Columns 4–6).Footnote 10 Across all specifications, the results show a strong negative effect between UI replacement rates and household debt among the unemployed. Households in which the head becomes unemployed borrow more money when they live in states where UI benefits are less generous compared to those who live in states with more generous benefits. The findings are robust to the alternative measure of using UI maximum generosity. This provides evidence that credit substitutes for UI benefits.Footnote 11
Effects of unemployment on unsecured debt by unemployment insurance benefit generosity

Notes: all models are based on Equation 1 and include individual- and state-level controls and household and year fixed effects. Robust standard errors are clustered at the household level and reported in parentheses. Full results in Table A.3. *p < 0.1; **p < 0.05; ***p < 0.01
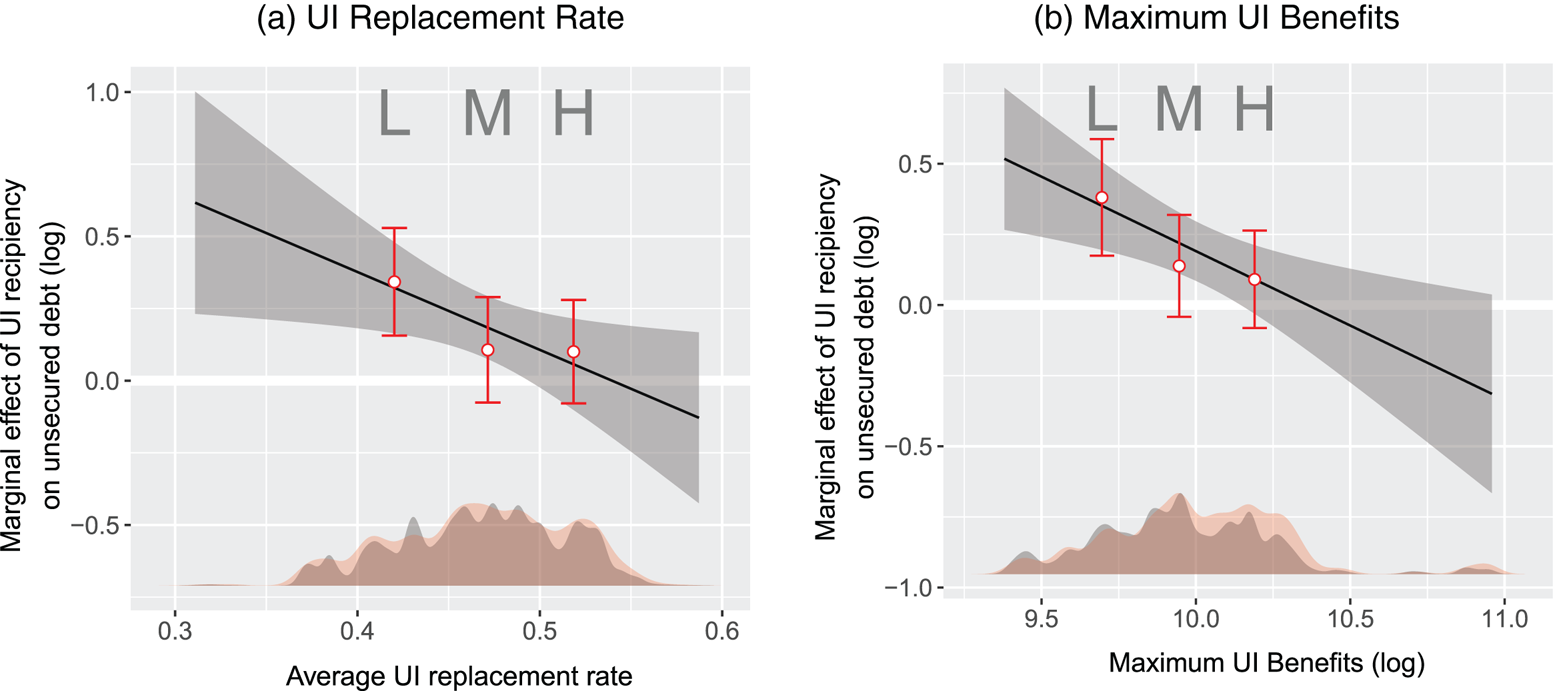
The panels in Figure 2 plot the marginal effects and results from a binning estimator, which splits the moderator into three equally sized bins (Hainmueller, Mummolo and Xu Reference Hainmueller, Mummolo and Xu2019). In substantive terms, a 10-percentage-point increase in the average UI replacement rate is associated with a decline in unsecured debt of nearly 30 per cent (Figure 2a). With average unsecured debt levels of around $18,000, this represents an estimated decrease in unsecured debt of about $5,300. The plots indicate that the linearity assumption underpinning the interaction models is weaker when UI replacement rates are used and stronger when maximum UI benefits are used (Figure 2b). The factorial binning estimator, which allows a more flexible estimation to relax the linearity assumption, shows that the results are driven by states in the bottom third of the UI generosity distributions.Footnote 12
Effects of unemployment benefit recipiency on unsecured debt by UI replacement rates and maximum UI benefits
Notes: marginal effects of receiving UI benefits on unsecured debt as a function of UI replacement rates and maximum UI benefits. 95 per cent confidence intervals based on Columns 3 and 6 in Table 1. The dots show the results from a binning estimator with three equally sized groups.

Job loss can increase indebtedness not only due to ‘active’ borrowing to smooth income losses to, for example, pay for regular expenditures, but also in a more passive fashion, for example when bills remain unpaid. While the data do not allow me to distinguish between these behaviors, I treat them as conceptually equivalent because both have a common root cause: limited welfare state support. A stronger welfare state would provide individuals with more income support that would help avoid both a passive increase in debt – since bills would be paid on time if unemployed individuals received more generous government transfers – and active borrowing because individuals would be less likely to go into debt to smooth income losses.
In sum, the findings demonstrate that households borrow money to fill financial gaps left by weaker UI replacement rates and use credit as a substitute for government transfers. Put differently, this suggests that a more generous social support net can alleviate households' needs to draw on credit to address financial gaps and, therefore, help reduce overall indebtedness.
Political Consequences of Indebtedness
In the previous section, I document that UI benefit generosity mediates the extent to which households go into debt and borrow money to address income losses during periods of unemployment. Indebtedness is associated with negative macro-economic consequences such as recessions (Mian and Sufi Reference Mian and Sufi2014; Schularick and Taylor Reference Schularick and Taylor2012) and socio-economic consequences such as financial insecurity and bankruptcy (Hacker Reference Hacker2019; Porter Reference Porter2012). But we know little about the political consequences of households' reliance on credit markets.
Above, I argue that rising household indebtedness can lead to greater demand for social policies, especially in the context of limited welfare provision where households are more likely to go into debt to cope with income losses that are not addressed by the welfare state. One reason behind these changes in social preferences is that voters seek stronger public protection against (future) economic risks and insecurities. Voters may perceive debt as a new source of risk and demand more social support to protect against future income losses that could jeopardize debt repayments and cause financial distress. A weak welfare state amplifies these debt-related risks by increasing individuals' reliance on debt to cope with income losses. For those already indebted, this increases their risk of payments falling into arrears and bankruptcy in the future event of another income shock due to limited income support and the inability to maintain debt repayments.
Providing empirical evidence for the argument that indebtedness increases demand for social spending conditional on welfare states' generosity poses two major challenges. First, to my knowledge, there is no micro-level panel data in the United States that combines information on individuals' financial liabilities with their attitudes toward social policies. Panels such as the SIPP or the Panel Study of Income Dynamics contain information about households' assets and liabilities but do not ask respondents about their political and social policy preferences. By contrast, surveys such as the ANES contain batteries of political variables but no details on households' balance sheets and liabilities. Secondly, estimating how indebtedness influences social policy preferences in the context of differential welfare state support requires a panel structure in which the same social policy survey item has been asked repeatedly.
I use two empirical strategies to address these challenges. First, I predict unsecured debt levels based on a set of household characteristics in the widely used Survey of Consumer Finances (SCF), the only fully representative data source on the financial circumstances of US households. I use the 2001 and 2004 surveys, which include a total of 8,497 completed interviews, to match the time frame of the 2000–2004 ANES panel. Unsecured debt includes installment loans, credit card balances, other lines of credit, other installment loans, and other debts. Using the predicted values from the SCF, I then impute unsecured debt levels based on the same individual-level characteristics for respondents in the ANES panel. The ANES contains 2,001 completed interviews of 799 unique respondents who were interviewed in 2000, 2002 and 2004.Footnote 13 This setup allows me to empirically test the hypothesis that higher levels of indebtedness are associated with greater support for social policy spending in states with less generous benefits.
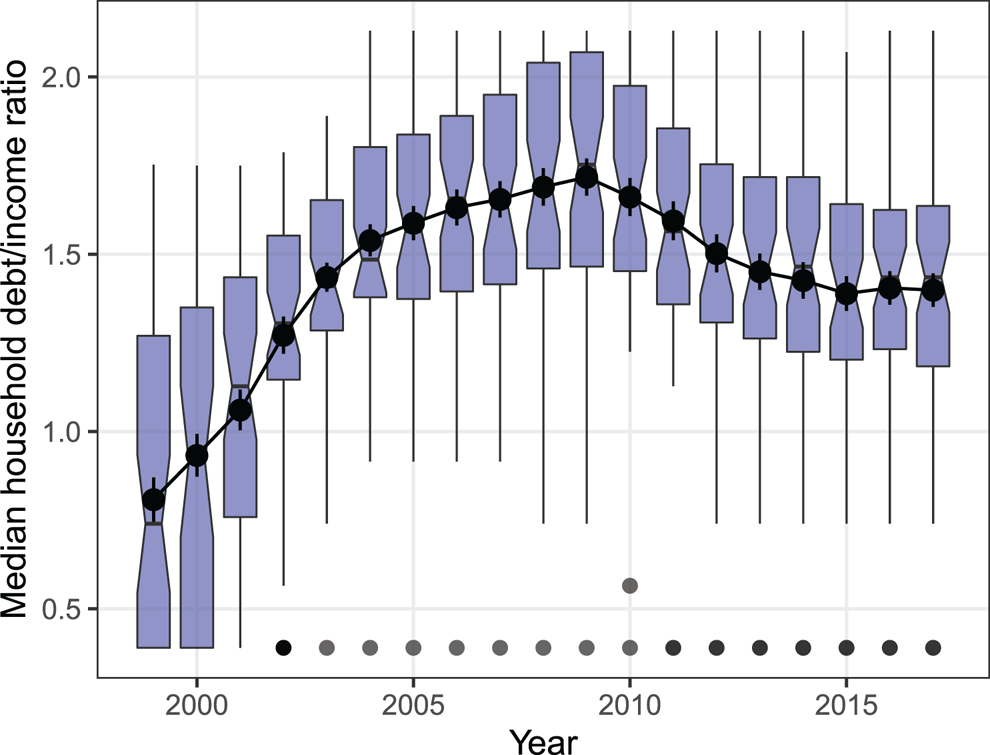
In the second strategy, I measure household indebtedness using state-level median debt-to-income ratios from the Federal Reserve's Enhanced Financial Accounts, which is based on household debt data from the FRBNY/Equifax Consumer Credit Panel and household income data from the Bureau of Labor Statistics. I then merge state-level debt-to-income ratios with the 2000–2004 ANES panel survey. Debt levels as a share of income are adequate measures because they capture individuals' exposure to debt and their capacity to service that debt. Figure 3 shows considerable variation in debt-to-income ratios across states. Between 1999 and 2009 – the decade leading up to the financial crisis – debt leverage has on average more than doubled from 80 per cent to 170 per cent and started to taper off during the 2010s.
Median debt-to-income ratios across US states
Notes: the lines show state-level averages. Data on state-level median household debt-to-income ratios come from the Federal Reserve's Enhanced Financial Accounts. State-level results appear in Appendix Figure A3.

Predicting Unsecured Debt Levels
One of the challenges of estimating the amount of indebtedness is distinguishing between individuals who carry debt and those who do not. Among those who do carry debt, debt levels are strictly positive. I therefore predict the amount of unsecured debt a household carries using a Heckman selection model (Tobit-II).Footnote 14 In the first stage, I estimate respondents' probability of holding any debt using the following probit model:
 $${\rm Prob( }D = 1\vert Z) = \Phi ( Z\gamma ) $$
where D indicates indebtedness (D = 1 if the respondent has debt and D = 0 otherwise), Z is a vector of explanatory variables, γ is a vector of unknown parameters, and Φ is the cumulative distribution function of the standard normal distribution. Z contains the following predictors: age, household income, educational degree (four categories), homeowner status, having children, marital status, race (four categories) and gender. I select these variables because they are predictive of carrying any debt as a well as the amount of debt. They also represent the set of individual-level characteristics available in both the SCF and the ANES. The reason I include only individual-level covariates but not state-level variables such as the generosity of UI benefits is that the latter could introduce post-treatment bias, in part because I use predicted debt levels in the main regression to estimate social policy preferences as a function of debt and UI generosity.Footnote 15
In the second stage, I predict respondents' amount of unsecured debt, measured on a log scale, among those with any debt using the following ordinary least squares (OLS) linear regression:
 $$d^\ast{ = } X\beta + \varepsilon $$
where  $d^\ast$ denotes the amount of unsecured debt (log) conditional on being indebted.
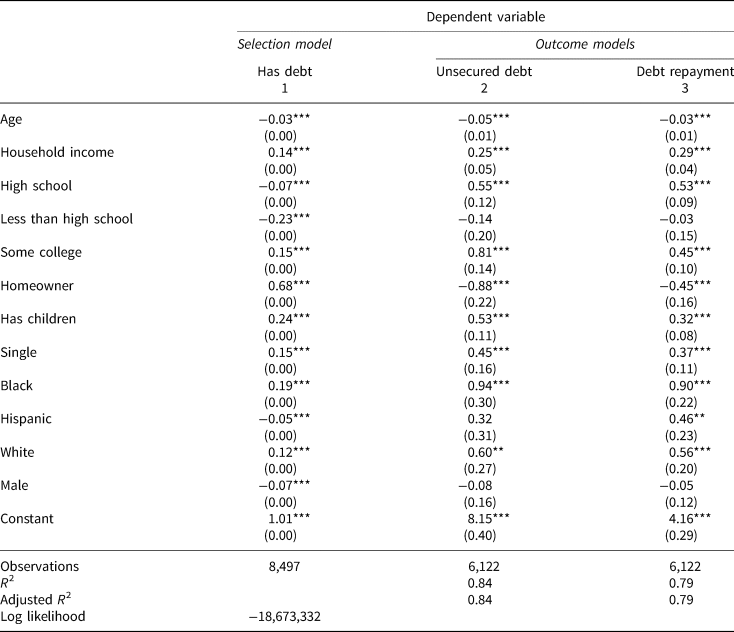
 $d^\ast$ is only observed if the respondent holds any debt. I use the same set of covariates in X as in Equation 2.Footnote 16 As an alternative measurement strategy, I use the same selection model to predict monthly unsecured debt repayment (that is, consumer and revolving debt). Table 2 shows the results from the selection equation (Column 1) and the outcome equations for unsecured debt levels (Column 2) and monthly debt repayments (Column 3).
Results from Heckman selection model

Notes: results from a Heckman selection model. Column 1 shows the results from a probit selection model. Columns 2 and 3 show the results from the OLS outcome regressions for unsecured debt (log) and monthly unsecured debt repayments (log) among individuals who carry debt. College degree holders and race category ‘others’ are omitted baselines. *p < 0.1; **p < 0.05; ***p < 0.01
In the final step, I use the predicted values based on the SCF data to impute indebtedness among ANES respondents. If respondent i's probability of holding any debt based on the selection model (Equation 2) is greater than 0.5, I assign the predicted amounts of unsecured debt and monthly unsecured debt repayments based on the outcome model (Equation 3). Otherwise, I assign respondent i zero unsecured debt and monthly unsecured debt repayments, respectively. This yields the following results: 89.6 per cent of the total 2,001 observations in the ANES 2000–2004 panel carry some form of debt. Among those with debt, the log mean of the imputed unsecured debt amount is 8.08 ($3,229). The log mean of monthly debt repayments is 5.02 ($152). Appendix Tables A5 and A6 show full summary statistics and frequency tables for the SCF and ANES samples.
Estimation Strategy
Since individuals who become unemployed borrow more in states with weaker benefits, I expect welfare state generosity to mediate the link between indebtedness and social policy preferences. In this section, I estimate how indebtedness shapes individuals' support for social policy spending as a function of welfare state generosity using predicted unsecured debt levels and state-level debt-to-income ratios.Footnote 17 I measure respondents' social policy preferences with a survey item that asks whether they would like to see spending on welfare programs decrease, remain about the same or increase. I turn this variable into a 3-point numeric scale, ranging from −1 to 1. This question is one of the few social policy items that has been asked repeatedly and consistently in all years. The measure of state-level UI replacement rates is the same as before. I then estimate how variation in UI replacement rates across states shapes support for spending on welfare programs as a function of households' indebtedness using the following model:
 $$Y_{it} = \beta _1d_t{\!{^\ast}} + \beta _2{\rm Ge}{\rm n}_{st} + \beta _3( d_t{\!{^\ast}} \cdot {\rm Ge}{\rm n}_{st}) + {\boldsymbol X}_{it}^{\prime} \gamma + {\boldsymbol Z}_{st}^{\prime} \tau + \alpha _i + \delta _t + \varepsilon _{ist}$$
where Y it is the support for welfare spending of respondent i at time t.  $d_t{\!{^\ast}}$ is either the imputed individual-level unsecured debt or the state-level debt-to-income ratio, depending on the model. Genst, as before, is the unemployment insurance replacement rate.
 ${\boldsymbol X}_{it}^{\prime} $ is a matrix of individual-level covariates, including the same set of predictors I use during the imputation procedure as well as employment status. I further control for partisanship because it may shape preferences for redistribution and function as a lens through which respondents assess their own or their states' economic well-being (Evans and Andersen Reference Evans and Andersen2006; Zaller Reference Zaller1992). I also include a measure that captures respondents' self-assessment of their personal financial situation. If respondents think their own economic fortunes look brighter, it may influence how they perceive their debt levels and their attitudes toward social policy spending. The ANES repeatedly asked respondents whether they and their family were ‘better off, worse off, or just about the same financially’ as they were a year ago.
 ${\boldsymbol Z}_{st}^{\prime} $ is a matrix of state-level controls. Since overall economic conditions and cyclical changes may jointly influence indebtedness as well as individuals' economic outlook and risk aversion, I control for levels and changes in state GDP. Moreover, since the ANES's social policy question asks about relative spending preferences, I use total state-level expenditures and revenues as well as state and local revenues from federal government transfers as anchors. Finally, I include the same economic variables (state-specific unemployment rate, median duration of state unemployment and average state-level disposable household income) and political variables (share of Democrats in state House, having a Democratic governor and state policy liberalism) as before. α i and δ t are individual- and year-fixed effects, respectively, that capture time-invariant individual characteristics and common time shocks. Standard errors are clustered at the individual level. The panel structure allows me to estimate how indebtedness affects preferences for social policies by using within-respondent variation.
Main Results
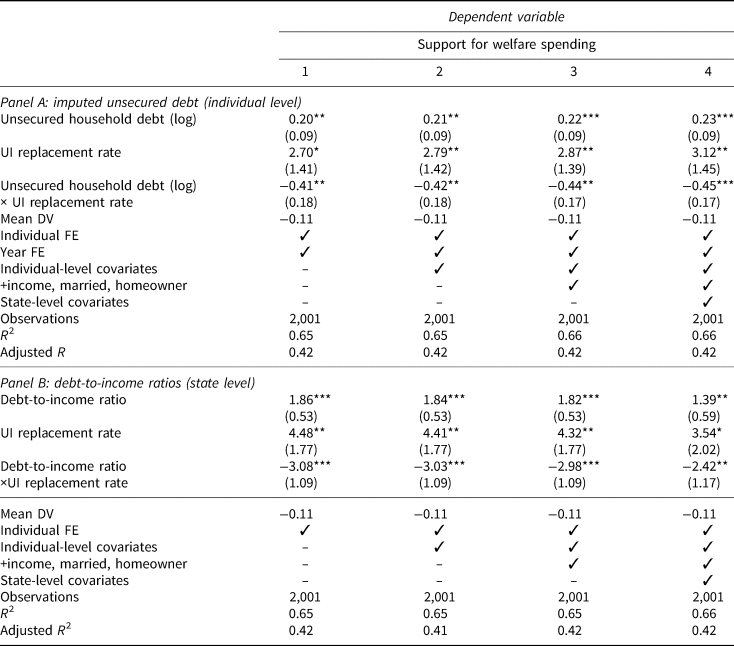
The panels in Table 3 show the main results.Footnote 18 Panel A displays the results from the first strategy using imputed unsecured debt levels. The models in Columns 1–4 subsequently add more individual- and state-level covariates. Across all model specifications, the effect of unsecured debt on demand for welfare spending is stronger when UI replacement rates are low. This finding is robust to the inclusion of employment status, partisanship and self-reported changes in respondents' financial situations (Column 2). I also estimate a model that includes household income, marital status and homeowner status (Column 3). While these three variables may introduce bias because they are the three time-variant covariates already used in the debt prediction model in Equations 2 and 3 (the others are time invariant and absorbed by the individual-level fixed effects), the results barely change compared to the previous model. Column 4 introduces state-level economic and political covariates. The results remain both statistically significant and substantively similar, indicating that a weak welfare state makes respondents more likely to support a stronger social safety net as debt burdens grow.Footnote 19
Effects of imputed unsecured debt levels and debt-to-income ratios on support for welfare spending by UI replacement rates

Notes: in Panel A, unsecured debt is imputed based on data from the SCF. All models are based on Equation 4. Robust standard errors are clustered at the individual level and reported in parentheses. The ANES panel includes 799 unique individuals. *p < 0.1; **p < 0.05; ***p < 0.01
Panel B shows the results for the second strategy using state-level debt-to-income ratios instead of the imputed unsecured debt levels. All model specifications yield similar but more pronounced results as in Panel A. The effect of debt leverage on support for welfare spending is stronger when UI replacement rates are low.
To ease the interpretation of the findings, the panels in Figure 4 plot the marginal effects and results from the binning estimator. The results indicate that the positive relationship between indebtedness, measured either by unsecured debt levels or debt-to-income ratios, and demand for social spending declines as unemployment benefits become more generous. Figure 4a shows that a 10-percentage-point increase in the UI replacement rate is associated with a decline in support for social policy spending by 0.1 on the preference scale.
Effects of unsecured debt and debt/income ratios on support for welfare spending by UI replacement rates
Notes: marginal effects of unsecured debt and debt-to-income ratios on support for welfare spending as a function of UI replacement rates with 95 per cent confidence intervals based on Column 3 in Panels A and B of Table 3, respectively. The dots show the results from a binning estimator with three equally sized groups.

The effects are considerably stronger in the model using debt-to-income ratios displayed in Figure 4b. Increasing the UI replacement rate by 10 percentage points is associated with a decline in support for social policy spending of 0.3, nearly half of the sample's standard deviation. Consistent with the results reported above, the binning estimator suggests that in the case of the imputed unsecured debt levels, the results are driven by states in the bottom third of the replacement rate distribution. To alleviate concerns about potential non-linearity, particularly in Figure 4a, I also show results from a more flexible kernel smoothing estimator in Appendix Figure A4.
Both estimation strategies address data limitations due to the lack of individual-level debt data in the ANES in alternative ways, leveraging different strengths. The imputation strategy provides us with individual debt levels but is limited by the covariates available in the ANES. It is less precise because it incorporates sampling uncertainty from the ANES and prediction uncertainty based on the Heckman selection model. By contrast, state-level debt-to-income ratios are more accurate measures of indebtedness, but using them in conjunction with the ANES data may introduce ecological inference problems because it imposes the same debt-to-income ratio on all respondents in the same state and year. Taken together, however, both sets of findings delineate the boundaries of a coherent picture. Individuals demand more social spending when indebtedness is high and social policy support is weak. In states with more generous unemployment benefits, indebtedness has little to no effect on voters' social spending preferences. It is only in states with less generous unemployment benefits that higher debt burdens are associated with more demand for a stronger social safety net.Footnote 20
Economic Insecurity and Political Ideology
Why do voters demand more social policy support when debt leverage increase and welfare states are weak? Above I argue that one potential explanation for this finding is that voters seek more social protection against debt-induced economic risks and insecurities because future income losses or unexpected expenditures can negatively impact debtors' ability to service their debt. A weaker welfare state amplifies such downstream economic risks because limited government support during job loss further constrains debtors' financial resources, which can increase the risk of payments falling into arrears and even outright default by jeopardizing debt repayments.
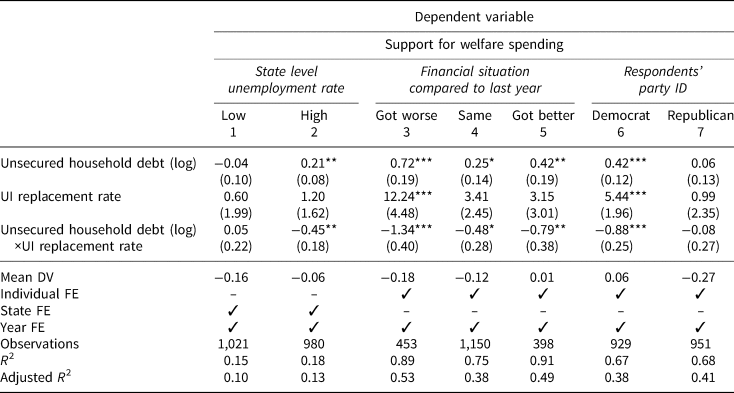
While directly testing this mechanism is beyond the scope of this article, I offer two pieces of evidence that are consistent with the argument that economic risk – realized or perceived – is a driving force behind this relationship. First, we would expect that in states with higher unemployment rates and weaker social policies, individuals are more likely to borrow money as a private alternative to cope with financial shortfalls given their greater exposure to the risks associated with future unemployment. This could increase support for social policies because debtors demand financial support that would allow them to make debt repayments even in the event of unemployment. To test whether there are systematic differences among debtors' preferences for social spending between states with different unemployment rates, I re-estimate the model based on Equation 4 and split the sample into states with unemployment rates below and at/above the sample's mean. I use the lagged unemployment rate to capture the effect of past economic insecurity on respondents' preferences. Columns 1 and 2 in Table 4 show that the effect of increases in unsecured debt on support for welfare spending as a function of UI replacement rates is considerably stronger in states with high unemployment rates compared to those in which rates are low. As documented above, states with high unemployment rates and weak welfare benefits have more unemployed individuals who borrow money in response to income losses. Respondents in those states might demand more support from the welfare state as debt burdens grow to avoid having to borrow money in the first place. Moreover, a high unemployment rate indicates that the local economy is not doing well. In response, individuals update their preferences and want greater social spending to provide income support in the event of future unemployment so they can continue making regular debt repayments.
Effect of economic insecurity and political ideology on support for welfare spending

Notes: all models include individual- and state-level controls. Robust standard errors are clustered at the state level (Columns 1–2) and individual level (Columns 3–7). Full results in Table A14. *p < 0.1; **p < 0.05; ***p < 0.01
Secondly, we would expect that changes in individuals' financial situations influence support for social policy spending, depending on the size of the debt burden and the generosity of welfare benefits. I use a question in the ANES that asks respondents to compare their current financial situation to last year's and split the sample into respondents whose situation got worse, remained the same or got better. One limitation of this question is that changes in financial circumstances can go beyond job loss and economic risk. It also does not capture baseline effects, since respondents without a change in their financial circumstances may still be in financially precarious situations. I estimate the model based on Equation 4 on the split sample. Columns 3–5 in Table 4 show that the effect is strongest among respondents whose financial situation deteriorated compared to the year before. Within this group, growing debt levels are much more strongly associated with a greater demand for welfare spending in the context of a weak welfare state compared to the group of respondents whose financial situation remained the same or got better. Debtors who are worse off financially support more social spending, which could reflect their desire to protect against future income losses.
Finally, we also have reason to believe that individuals' political ideology may influence the strength of this relationship. Democrats tend to be more supportive of government intervention and a stronger social safety net, whereas Republicans are more likely to favor economic freedom and limited government regulation of market activity with lower taxes and fewer regulations and welfare provision (Ellis and Stimson Reference Ellis and Stimson2012; McCarty, Poole and Rosenthal Reference McCarty, Poole and Rosenthal2013, ch. 2). To test for partisan differences, I estimate two separate models for respondents who self-identify as either Democrats or Republicans. Columns 6 and 7 in Table 4 show that, in the context of a limited welfare state, the effect of indebtedness on support for social spending is much stronger among Democrats than Republicans. In other words, when faced with higher levels of debt and weak social support, Democrats are more likely to demand more welfare spending than Republicans.
Conclusion
This article contributes to the long-standing debate regarding the relationship between debt and the welfare state in two ways. I first offer empirical micro-level evidence in the context of the American welfare state that growing household indebtedness is the consequence of differences in social benefits provision. Leveraging variation in the generosity of unemployment insurance across US states and over time, I show that households that experience unemployment borrow more in states where UI replacement rates are less generous. Credit has become a private alternative to publicly provided social policies. From a policy perspective, the results suggest that a more comprehensive social safety net can potentially alleviate households' need to go into debt and thus help reduce overall indebtedness. On average, a 10-percentage-point increase in the UI replacement rate reduces unsecured debt levels by nearly 30 per cent, or about $5,300, based on the sample's average.
Secondly, I examine the political consequences of growing household indebtedness on voters' social policy preferences in the context of differential welfare state generosity. Combining survey data from the ANES 2000–2004 panel with imputed individual-level unsecured debt amounts based on the SCF and state-level debt-to-income ratios, I showed that voters who reside in states with less generous social policies demand more support for welfare spending as indebtedness increases compared to voters in states with more generous benefits.
One explanation for this finding is that voters seek social protection against the economic risks and insecurities caused by indebtedness. Individuals who borrow money to privately cope with income losses that are insufficiently covered by the welfare state demand a more comprehensive public safety net to limit their exposure to future income losses and associated economic risks that would further constrain their financial leeway and jeopardize debt repayments. As welfare state retrenchment increasingly shifts socio-economic risks from society onto individuals (Hacker Reference Hacker2019), people turn to credit as a private alternative to publicly funded social policies. These private coping mechanisms, however, come with new forms of economic insecurity and future risks that trigger push-back from voters who demand a stronger safety net. Whether debtors demand more social spending because of the ‘debt-as-risk’ perspective, in which debtors want protection against future risks, or because of alternative mechanisms is an area for future research.
The relationship between household debt and welfare states documented in this article has important socio-economic consequences and points to new forms of policy feedback effects and growing vested interests that influence accountable social policy making in several other domains. First, relying on credit as a private alternative to social policies shifts entitlements and accountability from the political arena to the realm of business. Social policies are based on politically determined eligibility rules, whereas access to (and the cost of) credit depend on business considerations of private lenders who are not politically accountable. Welfare states ‘de-commodify’ individuals and free them from dependency on market incomes (Esping-Andersen Reference Esping-Andersen1999), whereas credit markets ‘re-commodify’ individuals because their debt repayment depends on stable, long-term future income streams.
These shifts are consequential. Credit has become more important to harness social opportunities and increasingly determines life chances, but credit access and costs are often unequally distributed. Credit markets are still plagued by racial inequalities despite anti-discriminatory regulation (Pager and Shepherd Reference Pager and Shepherd2008). Those with lower incomes and insecure jobs often pay higher interest rates and spend a larger share of their disposable income on debt repayment. Yet for policy makers, credit markets are convenient instruments because they avoid contentious decisions over public goods allocation and rarely add to the budget (Krippner Reference Krippner2011; Quinn Reference Quinn2019), further consolidating ‘hidden’ and ‘submerged’ policy making that transforms the social policy landscape (Howard Reference Howard1997; Mettler Reference Mettler2011). If policy makers are more responsive to voters who favor pro-credit policies at the expense of publicly funded social policies – typically electorally important middle- and higher-income groups (Bartels Reference Bartels2010; Gilens Reference Gilens2012) – welfare states may retreat and exclude individuals who not only depend most on social programs but also have more difficulty accessing credit markets. Even though some debtors demand more social support, policies have yet to change. Partisan ideology and differential responsiveness are two potential reasons why policy makers have not given in to voters' demands. But these preferences may become stronger and more salient in the future, placing greater electoral pressure on politicians to expand the welfare state and limit individuals' reliance on debt.
Finally, credit markets can substitute for welfare state functions beyond the domain of risk and social insurance as well as the geographical boundaries of the United States. Credit has become more important in areas such housing and education. Individuals borrow money to buy a home in a good school district or to go to college in the expectation of higher future earnings. But the degree to which households go into debt to pay for social services varies considerably across countries and domains in ways that are not well explained by current comparative political economy frameworks (Esping-Andersen Reference Esping-Andersen1999; Hall and Soskice Reference Hall and Soskice2001). While Anglo-Saxon economies have seen a significant increase in everyday borrowing, especially through credit cards and student loans, households in European countries such as Denmark and the Netherlands have increased their debt leverage to similar if not higher degrees. In other countries such as Germany or Japan, households have largely stayed away from the borrowing binge. These variations point to important institutional differences across domestic financial markets and welfare regimes that merit further attention.
Acknowledgements
For very helpful comments I would like to thank the editor, the anonymous reviewers, Ben Ansell, Lucy Barnes, Rachel Bernhard, Elissa Berwick, Asli Cansunar, James Dunham, Tim Hicks, Torben Iversen, Ben Lauderdale, Maxime Lepoutre, Jonas Markgraf, Tom O'Grady, Barbara Piotrowska, Soledad Prillaman, Leah Rosenzweig, Nelson Ruiz, Tesalia Rizzo, David Singer, Kathleen Thelen, and seminar participants at MIT, Oxford and UCL.
Data availability statement
Replication data for this article can be found in Harvard Dataverse at: https://doi.org/10.7910/DVN/IGMSA4
Supplementary material
Online appendices are available at https://doi.org/10.1017/S0007123420000708.