Implications
Blood parameters serving as indicators of basal metabolic processes (i.e. indicators of whole body, liver and muscle metabolism) may facilitate the indirect selection for feed-efficient cattle. Here, associations between blood parameters and residual feed intake were found, as well as associations between these parameters and physiological stage. The biological characterization of these parameters over the circadian period and across stages of development are important for advancing our knowledge of ruminant physiology, and may serve as the basis for developing alternatives for indirect selection of feed efficiency, leading to a more economically and environmentally sustainable beef cattle production.
Introduction
Improving feed efficiency in cattle is crucial for reducing feed costs and lessening the environmental impact of beef production, while allowing for industry sustainability and growth. Improvements in feed efficiency can reduce the cost of gain considerably as the price of feed comprises 70% to 80% of the total cost of BW gain (Field and Taylor, Reference Field and Taylor2003). However, the direct assessment of individual feed efficiency is a time-consuming, laborious and expensive measurement (Arthur et al., Reference Arthur, Archer and Herd2004), which is not obtained until late in the life of the cattle, limiting breeding and management decisions. The preferred method of measurement of feed efficiency currently used in beef cattle is residual feed intake (RFI), which is defined as the difference between the actual feed intake of an animal and expected feed intake (Koch et al., Reference Koch, Swiger, Chambers and Gregory1963) based on body size, growth rate and body composition (Montanholi et al., Reference Montanholi, Swanson, Schenkel, McBride, Caldwell and Miller2009) over a specified test period. RFI is often favored as it represents variations in the requirements for basic metabolic processes, rather than variations because of differences in the level of production (Montanholi et al., Reference Montanholi, Swanson, Palme, Schenkel, McBride, Lu and Miller2010), allowing for closer comparison between animals, regardless of the production level. It also aids in investigation of biological processes and mechanisms that contribute to differences observed in feed intake (Arthur and Herd, Reference Arthur and Herd2005), which may represent an avenue for identifying new traits for assessing feed efficiency in beef cattle.
Hematological measures provide a readily accessible means of determining differences in efficiency between animals. Previous work has observed relationships between RFI and blood measures such as urea (Richardson et al., Reference Richardson, Herd, Arthur, Wright, Xu, Dibley and Oddy1996 and Reference Richardson, Herd, Archer and Arthur2004; Kelly et al., Reference Kelly, McGee, Crews, Sweeney, Boland and Kenny2010b); β-hydroxybutyrate (Kelly et al., Reference Kelly, McGee, Crews, Fahey, Wylie and Kenny2010a and Reference Kelly, McGee, Crews, Sweeney, Boland and Kenny2010b; Lawrence et al., Reference Lawrence, Kenny, Earley, Crews and McGee2011); triglycerides (Richardson et al., Reference Richardson, Herd, Archer and Arthur2004); total protein (Richardson et al., Reference Richardson, Herd, Arthur, Wright, Xu, Dibley and Oddy1996); creatinine (Richardson et al., Reference Richardson, Herd, Archer and Arthur2004; Lawrence et al., Reference Lawrence, Kenny, Earley, Crews and McGee2011); IGF-1 (Moore et al., Reference Moore, Johnston, Graser and Herd2005); hormones such as insulin (Richardson et al., Reference Richardson, Herd, Archer and Arthur2004; Kelly et al., Reference Kelly, McGee, Crews, Sweeney, Boland and Kenny2010b and Reference Kelly, McGee, Crews, Lynch, Wylie, Evans and Kenny2011), leptin (Richardson et al., Reference Richardson, Herd, Archer and Arthur2004), and cortisol (Richardson et al., Reference Richardson, Herd, Archer and Arthur2004; Montanholi et al., Reference Montanholi, Swanson, Palme, Schenkel, McBride, Lu and Miller2010); and enzymes such as aspartate aminotransferase (Richardson et al., Reference Richardson, Herd, Archer and Arthur2004). These findings, however, were limited by the sampling routine used (i.e. single sample collected at a particular physiological stage), limiting the inferences on biological patterns over the day, as well as the changes in those patterns as the cattle develops physiologically. In addition, as there are known sources of variation in the levels of blood plasma analytes, including season (Shaffer et al., Reference Shaffer, Roussel and Koonce1981), circadian cycle (Caldeira et al., Reference Caldeira, Almeida, Santos, Vasques and Vaz Portugal1999), age (Shaffer et al., Reference Shaffer, Roussel and Koonce1981) and physiological status (Otto et al., Reference Otto, Baggasse, Bogin, Harun and Vilela2000), it is important to determine how these factors influence these variations. Herein we present our investigation of the effects of the circadian cycle and physiological stage on blood plasma analyte levels in growing and gestating heifers.
As basal metabolic processes are responsible for a large proportion of energy requirements and consequently feed efficiency, blood plasma analytes that reflect variation in their rates and function, measured over the circadian cycle, as well as during growth and over the pregnancy period, may indicate differences in animal feed efficiency. The metabolites measured here included urea and acetate; the enzymes creatine kinase (CK), aspartate aminotransferase (AST) and glutamate dehydrogenase (GLDH); albumin; and carbon dioxide (CO2). The objectives of this study were: to define the circadian variation of blood analytes; and to determine the differences in blood analyte concentrations and activities with physiological status and feed efficiency, the latter assessed through RFI.
Material and methods
Heifers, experimental design and breeding
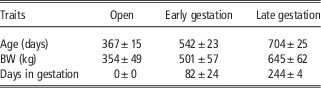
All experimental procedures followed the recommendations as outlined by the Canadian Council of Animal Care guidelines (1993), and were approved by the University of Guelph Animal Care Committee. A total of 36 cross-bred replacement heifers from the Elora Beef Research Centre (University of Guelph, Guelph, ON, Canada) were used for this study. Average breed composition of the heifers was 63.4% Angus, 24.3% Simmental, 2.9% Gelbvieh and 9.4% other Bos taurus breeds. Heifers were blood sampled on an hourly basis around yearling (open), early-gestation and late-gestation stages, as detailed below. Heifers were assessed for productive traits (BW and 28-day ultrasound scans) shortly after weaning until a week before calving. Heifers had their individual feed intake monitored from open stage until a week before calving. Characteristics of the heifers at each of the stages including age, BW and day of gestation are found in Table 1. In addition, heifers were bred via artificial insemination, and estrus detection was carried out using a teaser bull observed by a technician. Animals were checked for pregnancy using blood samples collected 30 days after the cessation of the breeding season (BioPRYN®; BioTracking, Moscow, USA). This study was initiated with 48 weaned calf-heifers. Of these 48 heifers, 36 ended up calving. As a result, feed efficiency (RFI) calculations were based solely on the population of 36 heifers that became cows by the end of the study.
Average animal parameters and standard deviations for each sampling period

Housing, feeding and performance assessments
Animals were housed in pens of six, with each animal having individual feed access through the use of Calan gates (American Calan Inc., Northwood, USA). The Calan gates limit animal access by requiring the recognition of a specific electronic key in close proximity to the head gate, which disengages the locking mechanism. Unique electronic keys attached to a collar around the heifer’s neck allowed entrance to only one feeder within the pen. Heifers were trained and acclimated to the Calan gates within a 2-week period before the start of individual feed intake assessment. The pens had a depth of 10.8 m, a width of 5.4 m and a shelter over 29.2 m2. The sheltered area contained straw bedding that was topped up when necessary, based on perceived moisture.
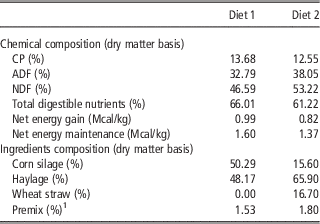
A total mixed ration was offered once daily between 0830 and 0930 h, and feed refusals were removed and measured at least once weekly to maintain fresh bunks and to calculate the actual individual feed intake. Animals were offered feed ad libitum at a rate of 105% to 110% of actual intake to ensure that access to feed was unlimited, with adjustments in offerings calculated from the previous week’s intake levels. Two total mixed rations diets (Diet 1 and 2) were fed over the duration of the experiment. Table 2 shows the chemical and ingredient composition of the diets. Diet 1 was fed from weaning at an average age and BW of 191±17 days and 242±43 kg, respectively, until an average age and BW of 584±17 days and 575±63 kg, respectively. Diet 2, of lower energy density, was fed from this point through to calving. Our study did not aim to compare diet effects. However, we observed that heifers demonstrated a far superior performance than had been anticipated; the inclusion of straw in the diet helped to avoid problems with excessive fatness at calving, while ensuring the required ad libitum intake for assessing feed efficiency. Individual animal weights were recorded biweekly and ultrasound measurements for body composition were taken every 28 days while the animals were restrained within a hydraulic squeeze chute (Silencer® Hydraulic Squeeze Chute; Moly Manufacturing Inc., Lorraine, USA). Ultrasound measurements were taken with the use of an Aloka SSD-500 ultrasound unit, 3.5 MHz long probe (Corometrics Medical Systems, Wallingford, USA) and Auskey program (Animal Ultrasound Services, Ithaca, USA) to measure back fat thickness (mm), rib eye area (cm2), rump fat thickness (mm) and intramuscular fat score.
Ingredient and chemical composition of the experimental diets
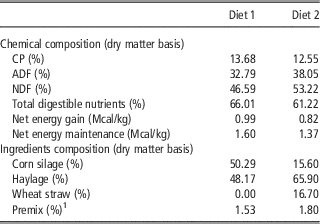
1 Premix included in Diet 1 contains 40% calcium phosphate, 60% trace mineralized salt (96.5% NaCl, 7500 mg/kg Zn, 5000 mg/kg Mn, 2500 mg/kg Cu, 1600 mg/kg Fe, 70 mg/kg I, 40 mg/kg Co). Premix included in Diet 2; contains 43% calcium phosphate, 57% trace mineralized salt (96.5% NaCl, 7500 mg/kg Zn, 5000 mg/kg Mn, 2500 mg/kg Cu, 1600 mg/kg Fe, 70 mg/kg I, 40 mg/kg Co).
RFI determination
The trial started shortly after weaning at an average age of 247±17 days and an average BW of 275±47 kg, and concluded the week before calving for each animal at an average age of 731.19±26.05 days. The trial was subdivided into a pre-feed trial period and a feed trial period. The pre-feed trial period covered the first 178 days and included the collection of biweekly BW, and ultrasound measurements of back fat, intramuscular fat, rib-eye area and rump fat were taken every 28 days, as described in detail by Montanholi et al. (Reference Montanholi, Swanson, Schenkel, McBride, Caldwell and Miller2009). Individual animal feed intakes were not recorded during this period. The feed trial period covered the remaining 314 days of the study and included the assessment of individual feed intake using Calan gates, and also included the collection of biweekly BW and ultrasound measurements every 28 days. BW and ultrasound measurements collected during the pre-feed trial and feed trial, as well individual feed intake measurements collected during the feed trial, were used in the calculation of RFI.
Several models were tested to calculate RFI, similar to the calculations explained by Montanholi et al. (Reference Montanholi, Swanson, Schenkel, McBride, Caldwell and Miller2009). The most appropriate model for explaining variation in feed intake had an R 2 of 0.43 and the lowest Bayesian information criteria and was composed as follows: DMI=−6.102+0.013×AGE+1.354 ×T_ADG+0.002×T_ABW+0.584×T_ABF−60.509×T_BFG+1.600×T_AIF+4.675×T_IFG+0.011×T_ARE+3.430× T_REG − 0.128×T_ARF − 1.856×T_RFG − 0.307×PT_ADG − 1141.999×PT_ABG+14.561× PT_IFG+6.802×PT_REG+139.622×PT_RFG+RFI where AGE is the Julian day of the year that the heifer was born; T_ADG is the test average daily gain; T_ABW is the test average BW; T_ABF is the test average backfat; T_BFG is the test backfat average daily gain; T_AIF is the test average intramuscular fat; T_IFG is the test intramuscular fat average daily gain; T_ARE is the test average rib-eye area; T_REG is the test rib-eye area average daily gain; T_ARF is the test average rump fat; T_RFG is the test rump fat average daily gain; PT_ADG is the pre-feed trial average daily gain; PT_ABG is the pre-feed trial average daily backfat gain; PT_ IFG is the pre-feed trial average daily intramuscular fat gain; PT_REG is the pre-feed trial rib-eye average daily gain; and PT_RFG is the pre-feed trial average daily rump fat gain. In addition, RFI is the residual proportion of the model that represents the deviation of the observed feed intake from the expected feed intake.
Blood sampling and processing
Four stalls, each measuring 2.5 m by 1.1 m and bedded with wood shavings, were used to house the heifers during blood sample collection. Heifers were fitted with halters and tethered to the stall to enable sample collection. Feed and water were provided ad libitum for the duration of the sampling. Lighting in the room during sampling was controlled to mimic the lighting experienced by the animal in its regular pen setting. Stalls were kept clean with the addition of shavings as required.
Groups of four heifers were moved into individual stalls for blood sample collection on three different occasions: open, early- and late-gestation periods. Heifers were adapted to the sampling environment, stall and feed chamber for 2 days before each period of blood sampling. Jugular catheters were inserted and blood samples were taken using a 10 ml blood collection tube (Vacutainer™; BD Inc., Franklin Lakes, USA) containing sodium heparin, as described by Montanholi et al. (2013). Blood samples were stored on ice before centrifugation (3000×g for 20 min) to separate the plasma. Plasma samples were then stored at −80°C and subsequently analyzed. Blood collection started at 0800 h and concluded at 0700 h the following day.
Blood analyte determination
Measurements of blood plasma albumin, AST, CK, CO2, GLDH and urea were taken at the Animal Health Laboratory at the University of Guelph using the Cobas 4000 c311 Biochemistry Analyzer (Roche Diagnostics GmbH, Mannheim, Germany). The reagents used were ALB2: ACN 413 for albumin determination; Urea: ACN 418 for urea determination; CKL: ACN 057 for CK determination; GLDH3: ACN 588 for GLDH; ASTL: ACN 687 for plasma AST determination; and CO2: ACN 006 for CO2 determination. Plasma acetate concentrations were determined by spectrophotometry using a commercial kit (K-ACETRM, Megazyme© International Ireland, Wicklow, Ireland, UK) according to the manufacturer’s protocol. Briefly, undiluted plasma samples were used in duplicate, and the end-point absorbance was read at 340 nm after 50 min using a microplate spectrophotometer (BioTek® Instruments, Vermont, USA). Duplicate absorbance values were within 5% of each other for accuracy.
Statistical analysis
Preliminary regression analysis performed using the general linear model procedure to evaluate effects of breed composition indicated an absence of a significant breed effect (P>0.10) on the traits evaluated (data not shown), justifying the exclusion of this variable from the analyses detailed below. Homogeneities of variance were tested using residual plots as part of the MIXED procedure of SAS (SAS Institute Inc., Cary, USA). Four measures (AST, CK, GLDH and acetate) showed significant skewness and were therefore transformed by taking their natural logarithm. Back-transformed data are presented in the results for clarity. Data were analyzed using the MIXED procedure, fitting the following model, Y ijklm =µ+startage i +stage j +RFIgroup k(j)+group l(j)+β 1(j)×hour+β 2(j)×hour2+β 3(j)×hour3+β 4(j)×hour4+heifer m +e ijklm , where Y ijklm is the variable measured (albumin, urea, CK, GLDH, AST, CO2 and acetate) in the mth heifer, with ith starting age, at jth stage of pregnancy, belonging to the kth RFI group and in the lth group of heifers; µ is the overall mean; startage i is the fixed effect of the ith age at sampling; stage j is the fixed effect of the jth stage of pregnancy (open, early pregnancy and late pregnancy); and RFIgroup k(j) is the fixed effect of the kth RFI group. The RFI groups were defined as group 1 (low RFI, n=18) having RFI<0.10, and group 0 (high RFI, n=18) with RFI>0.10) within the jth stage of pregnancy; group l(j) is the fixed effect of the lth group of measurement (group of heifers corresponded to the group of animals sampled on the same day; there were 14 classes in open stage, 11 classes in early pregnancy stage and 11 classes in late pregnancy stage) within the jth stage of pregnancy; β 1(j)×hour, β 2(j)×hour2, β 3(j)×hour3 and β 4(j)×hour4 are the fixed linear, quadratic, cubic and quartic regressions on the hour of measurement within the jth stage; heifer m is the random effect of the mth heifer; and e ijklm is the random residual effect. The Scheffé multiple comparison test was applied to evaluate all pairwise comparisons between the RFI group means and physiological stage group means. Pearson’s correlations between RFI and mean blood analyte concentrations at each physiological stage and overall were calculated using the correlation procedure of SAS. Differences were considered statistically significant at P⩽0.05 and were considered trending toward significance at P-values>0.05 and ⩽0.10. The means presented in the circadian curves are predicted means based on the model described above.
Results
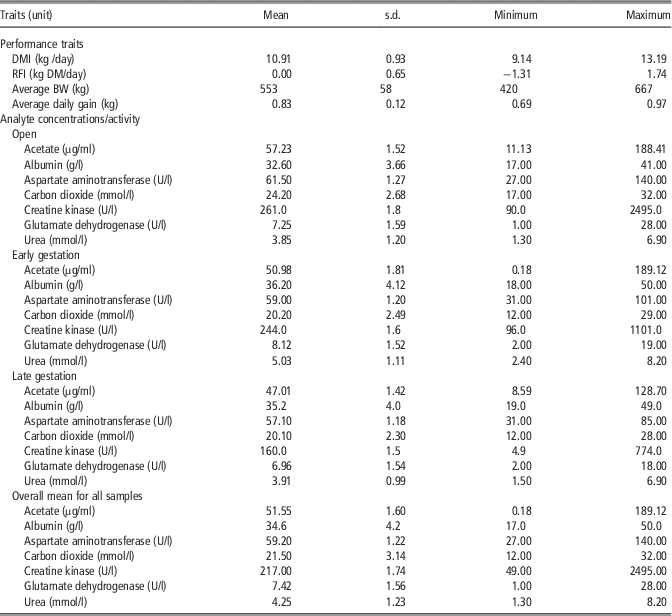
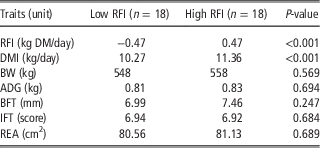
The descriptive statistics of the productive performance traits and analyte concentrations by physiological stage are shown in Table 3. The productive performance measures (Table 4) indicate a higher feed intake in the high-RFI heifers (P<0.05) and no differences for other productive traits. Indeed, the lower feed intake of low-RFI heifers represents about 340 kg less feed intake (DM basis) annually without penalizing productivity.
Descriptive statistics of performance traits and analyte concentrations
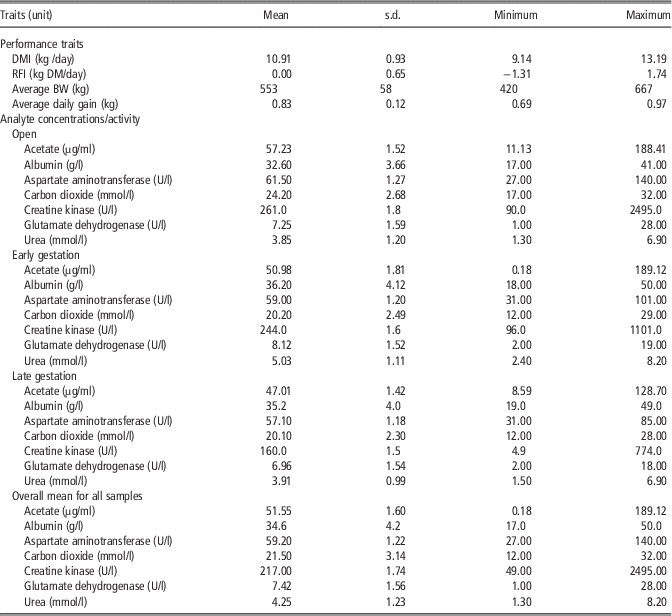
DMI=dry matter intake; RFI=residual feed intake.
Least square means of the productive performance traits by RFI group at the middle of the productive performance evaluation
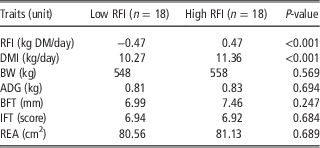
RFI=residual feed intake; DMI=dry matter intake; ADG=average daily gain; BFT=back fat; IFT=intramuscular fat; REA=rib eye area.
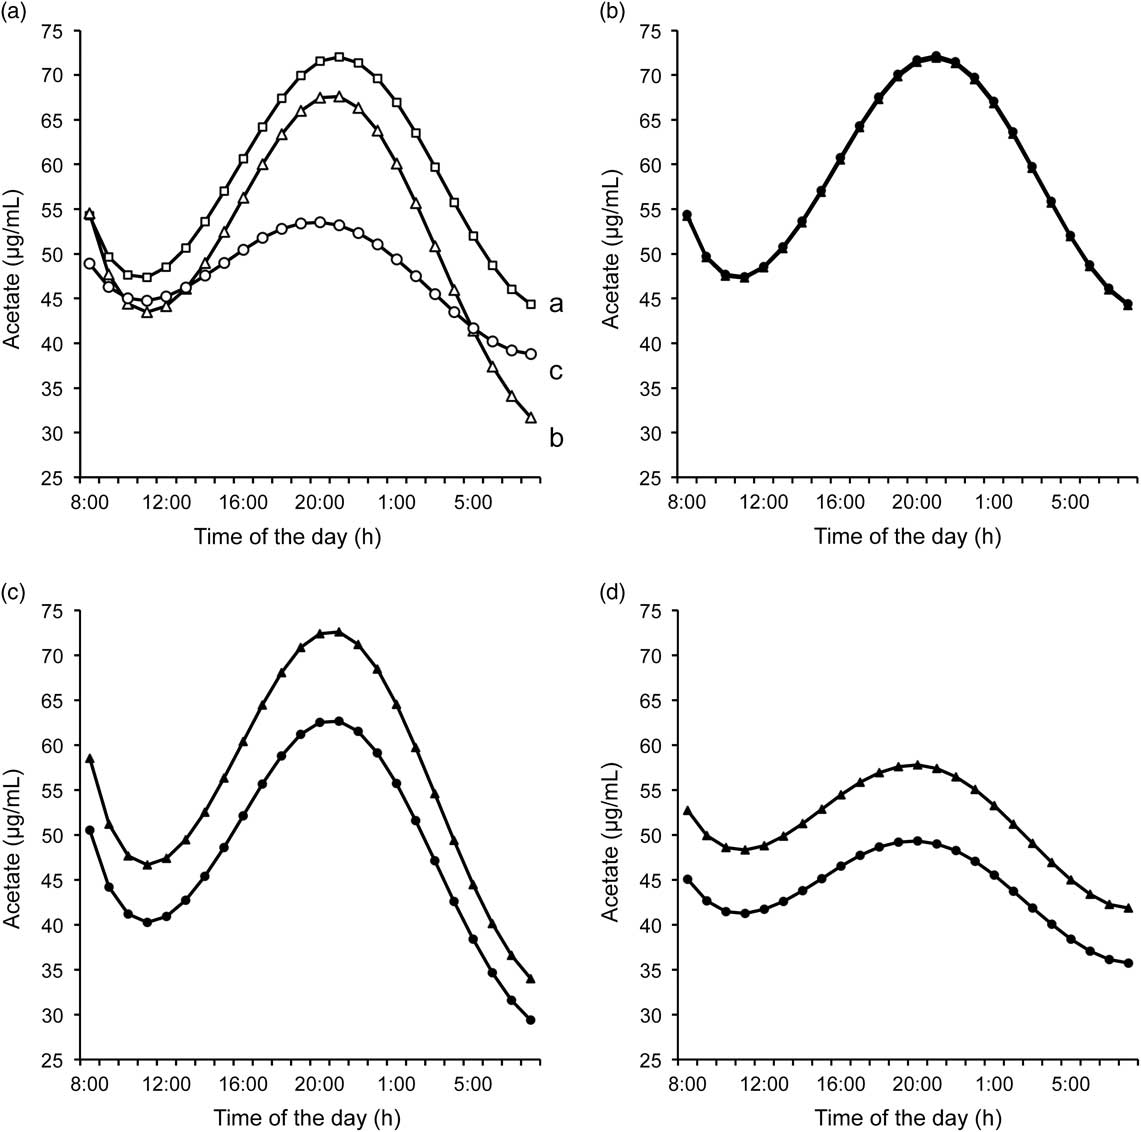
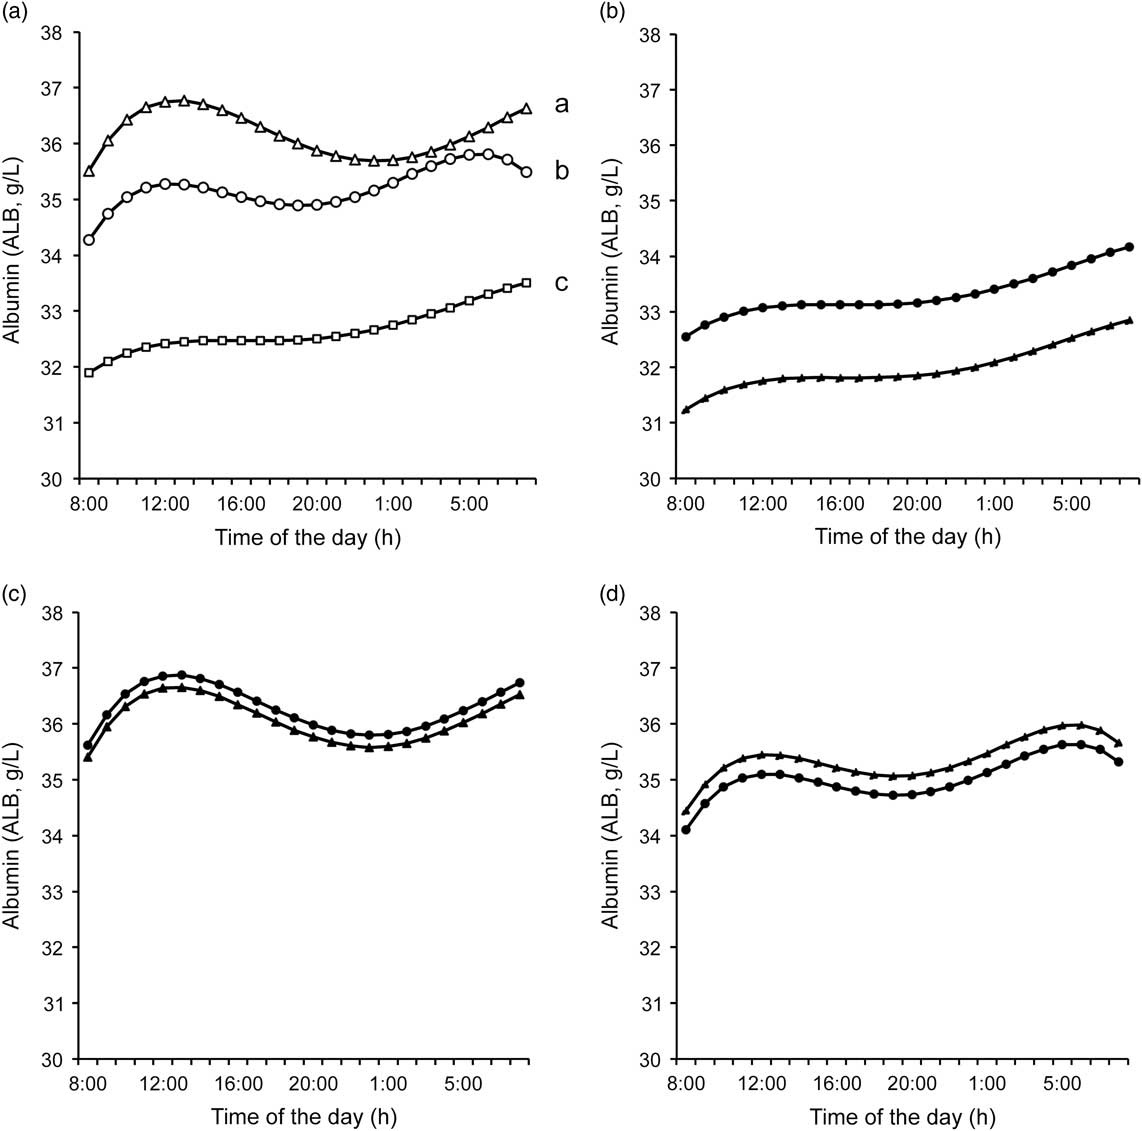
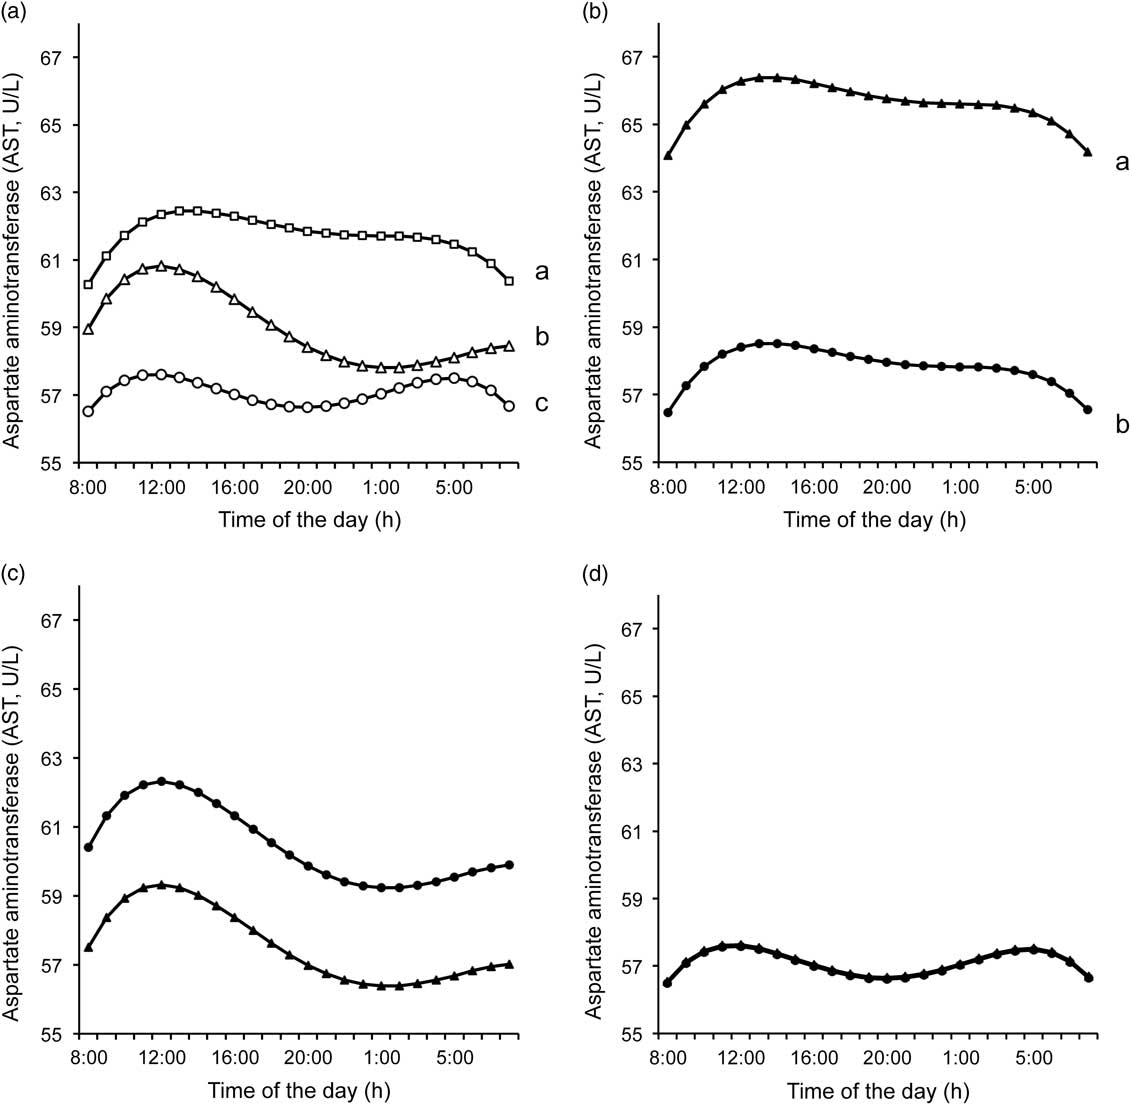
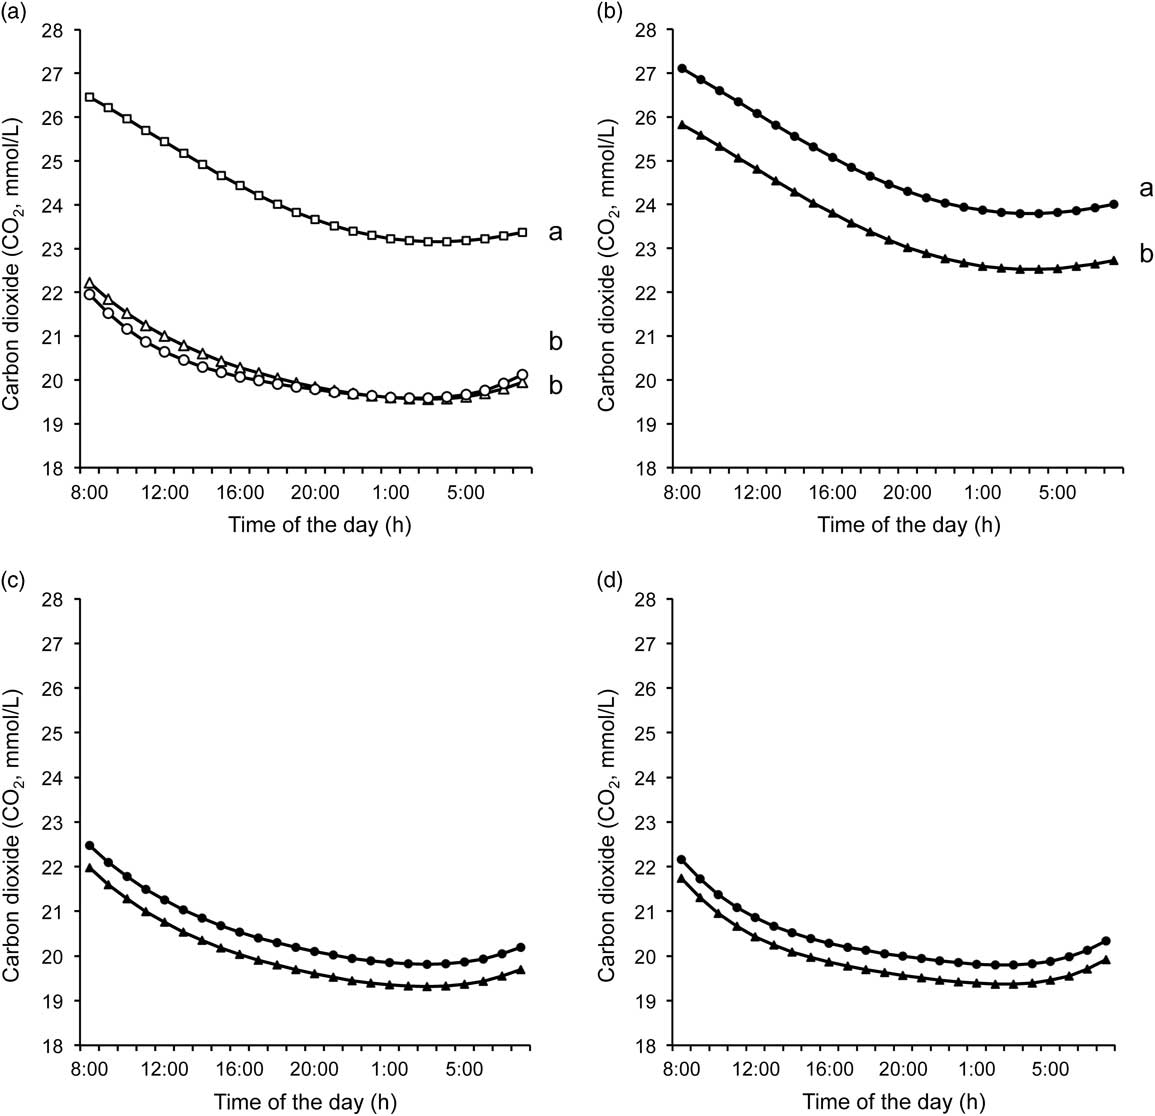
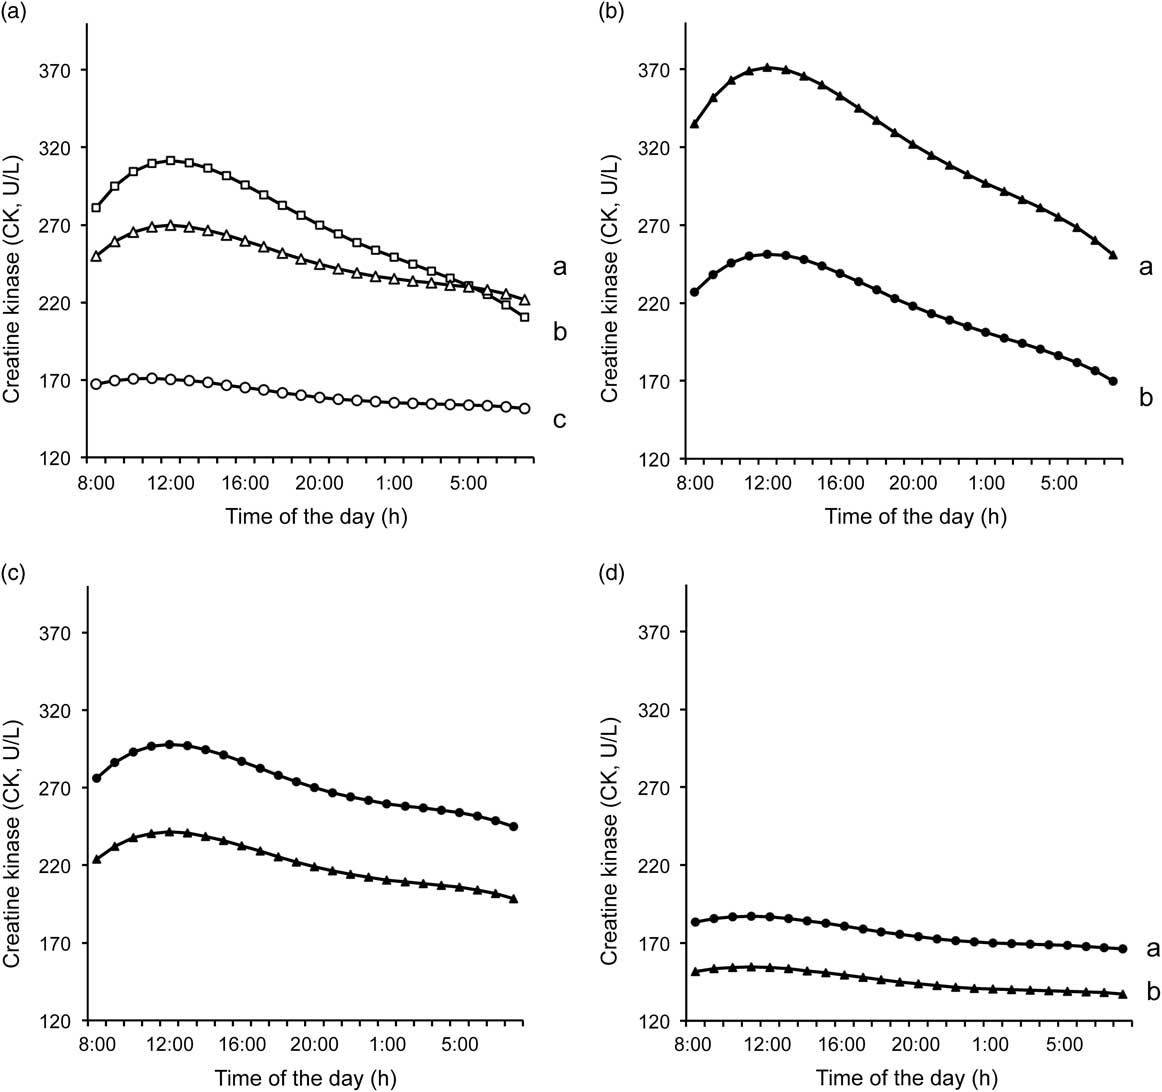
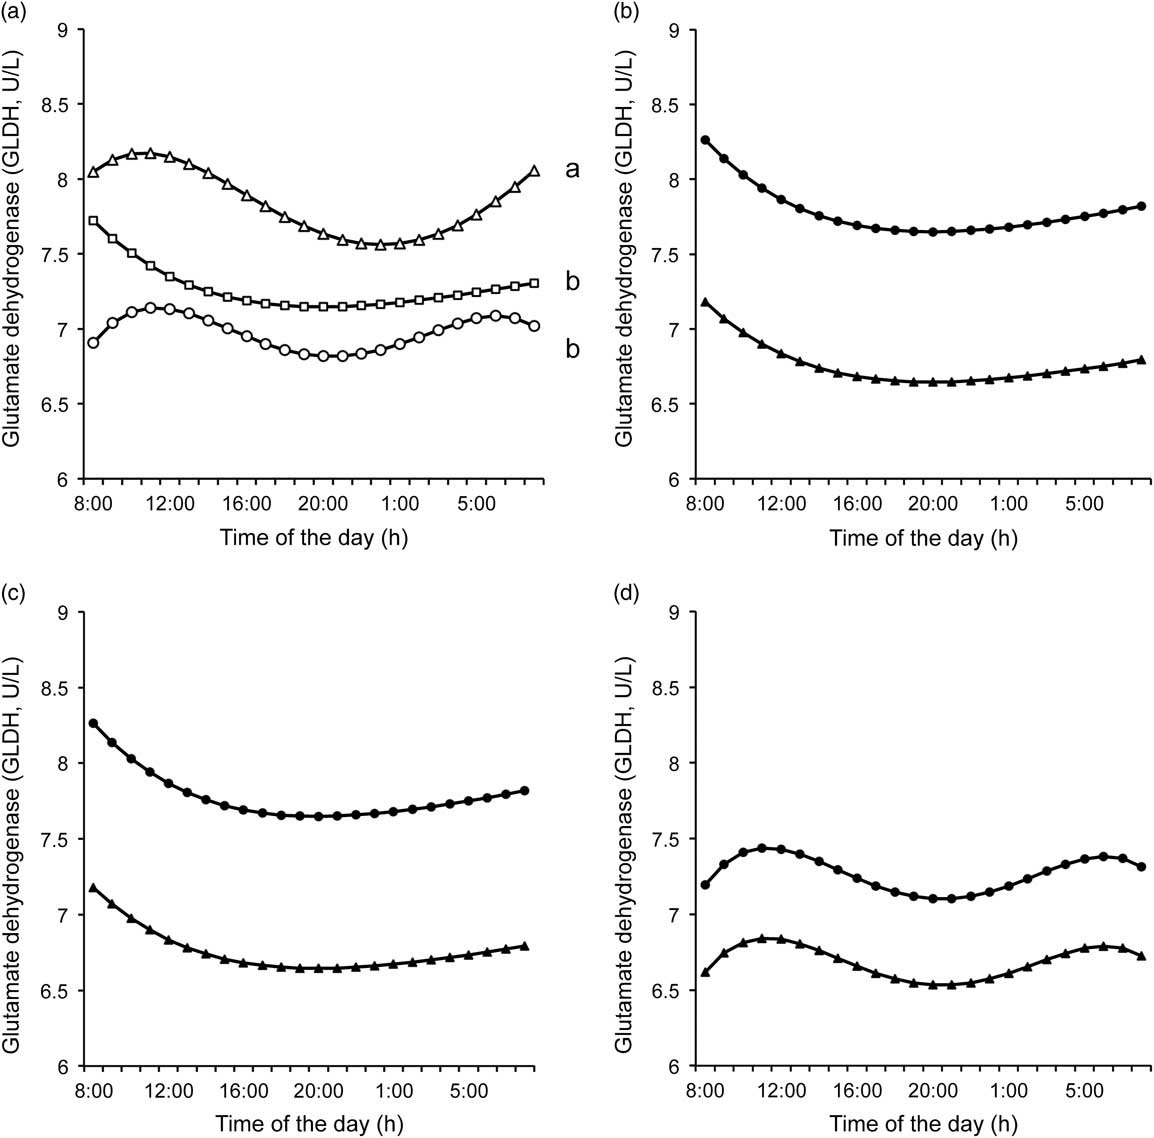
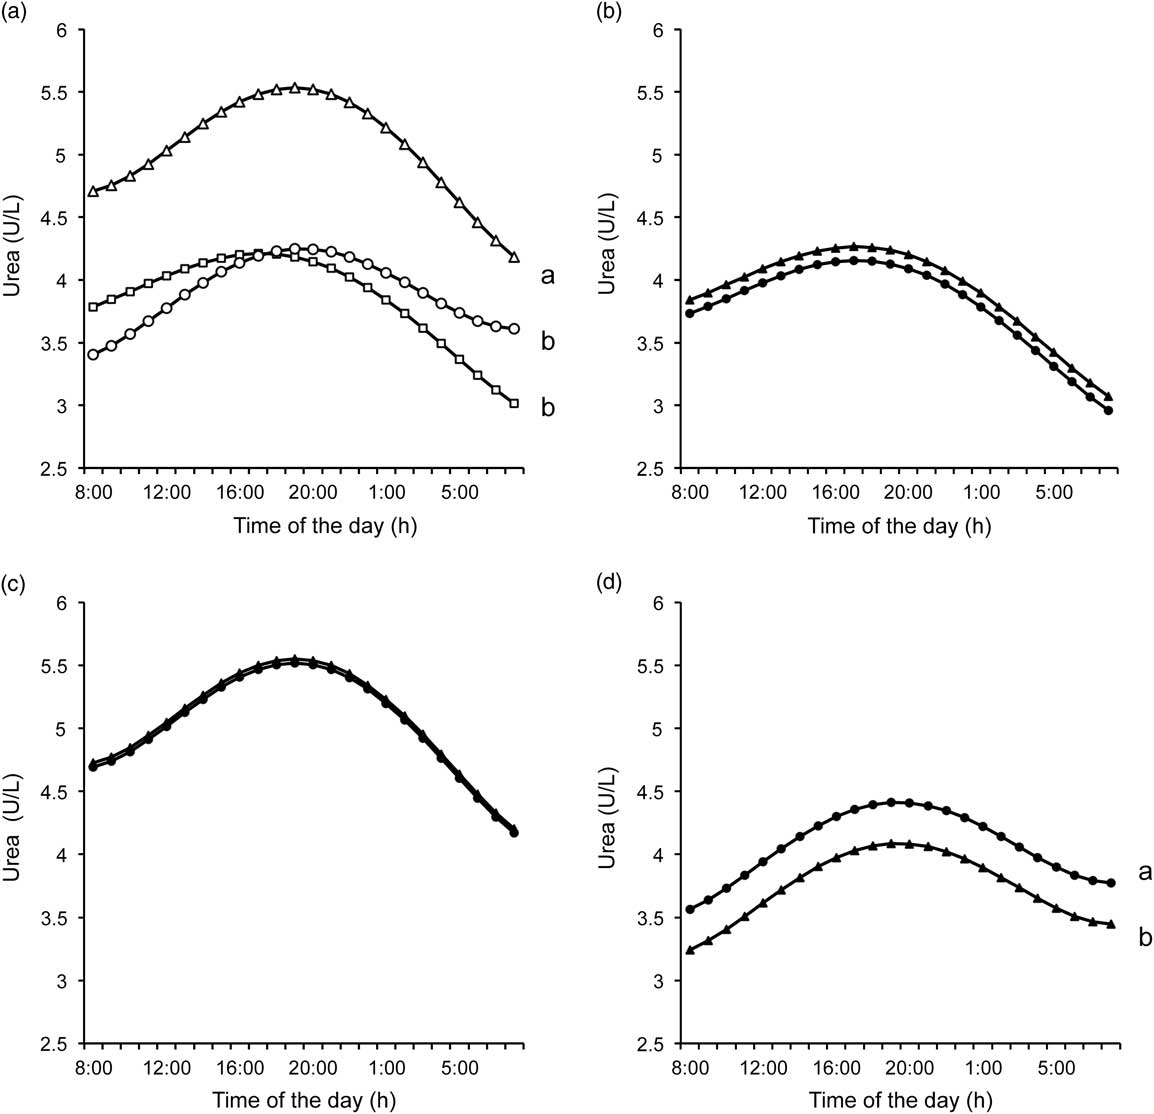
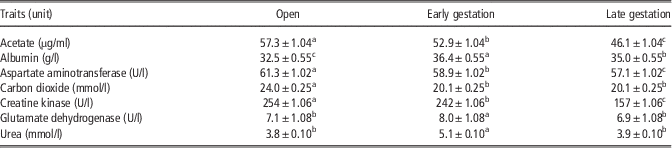
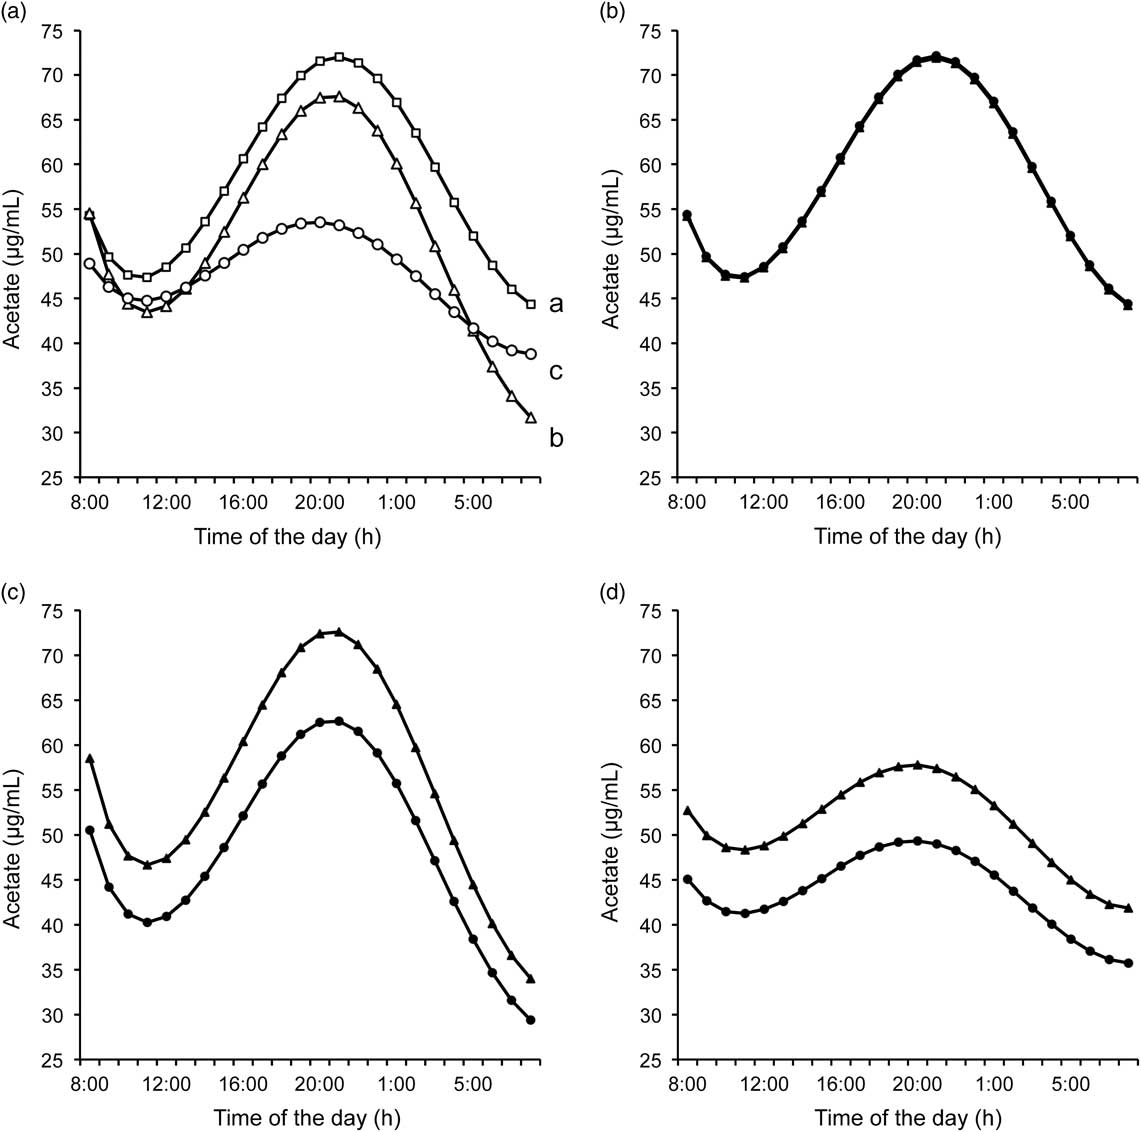
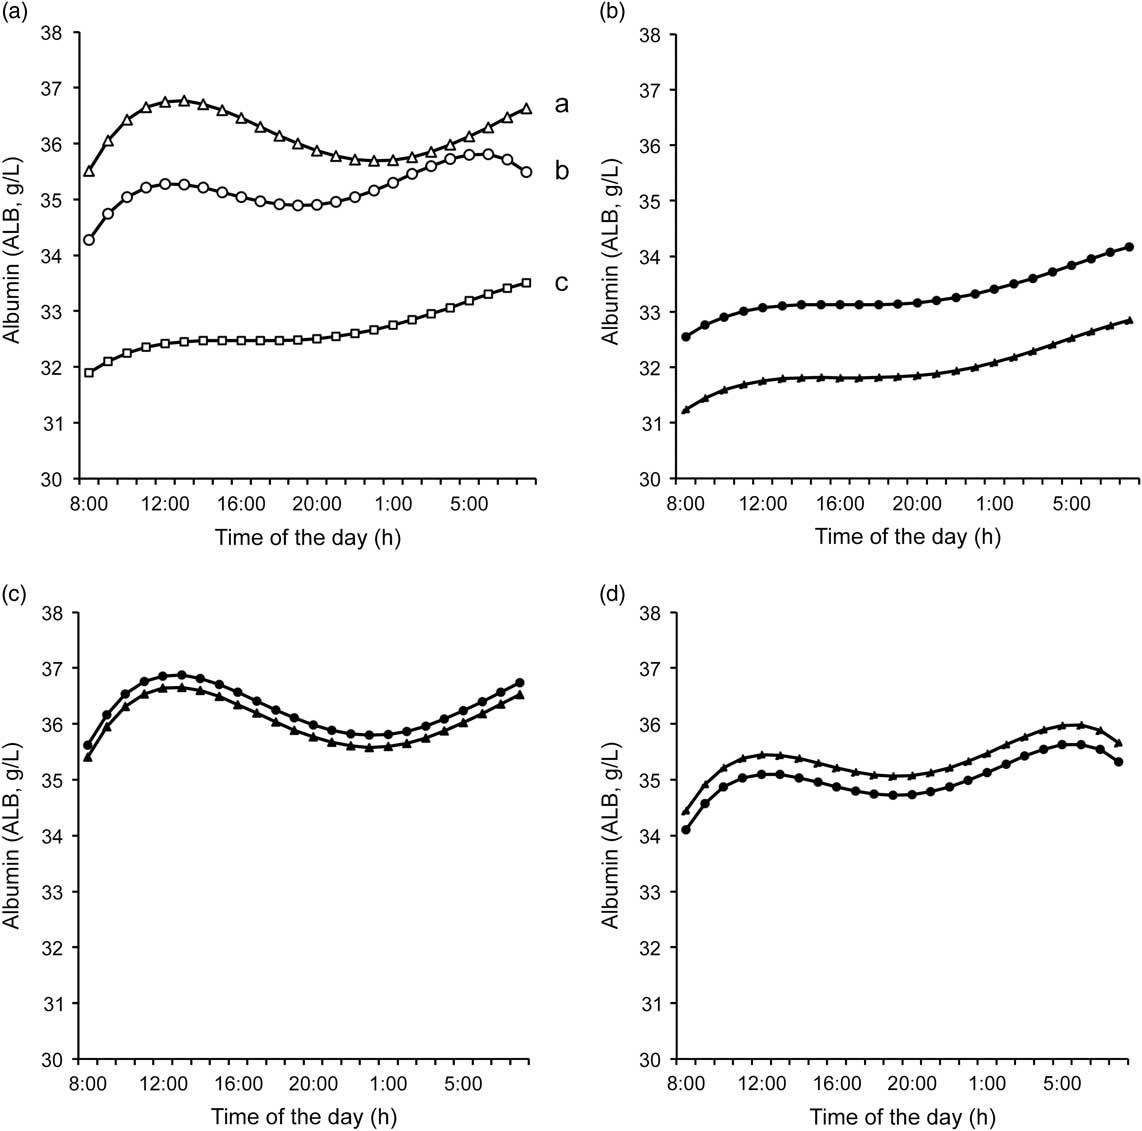
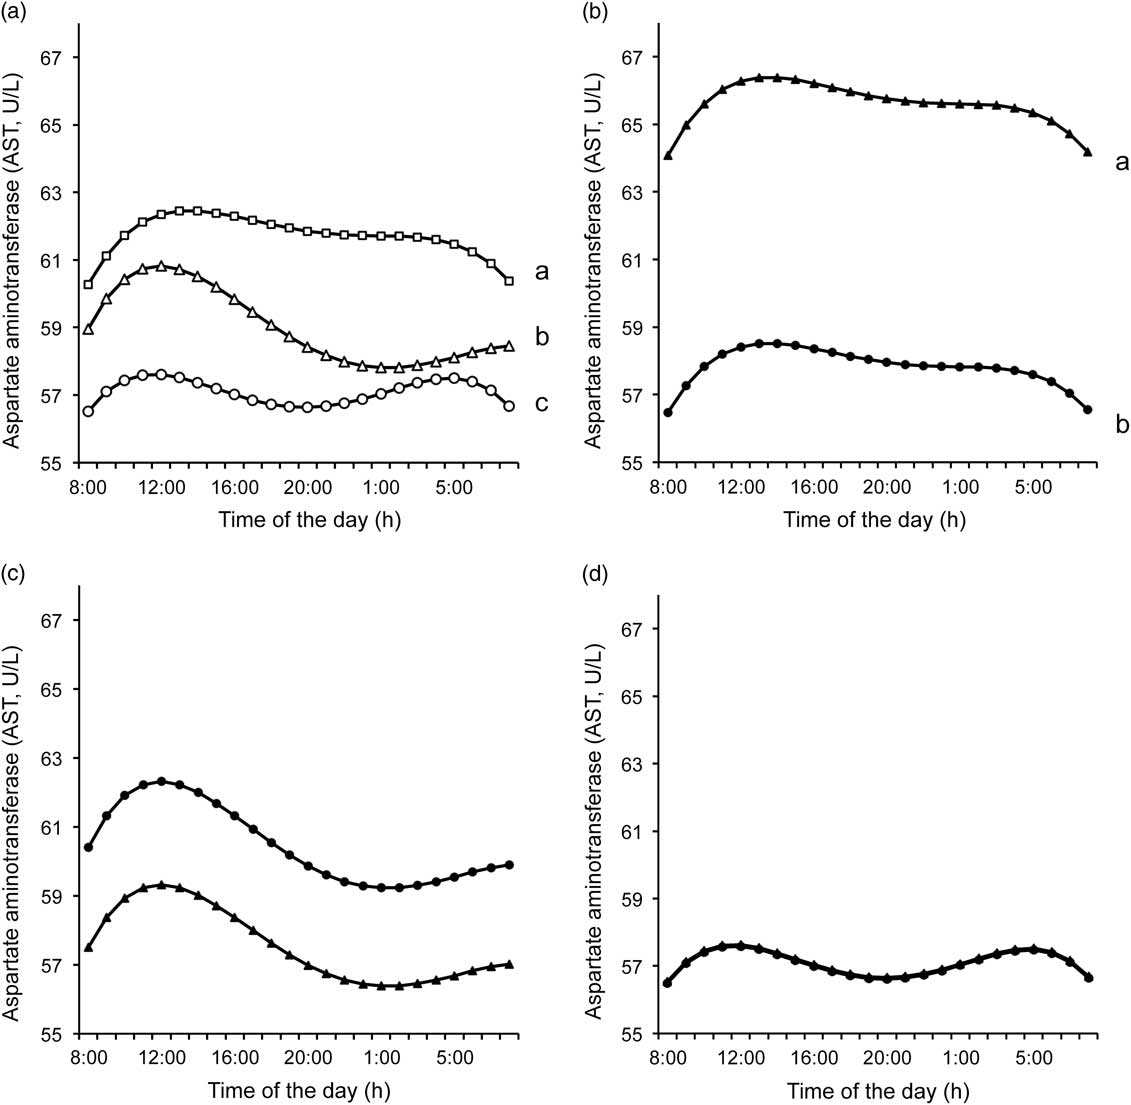
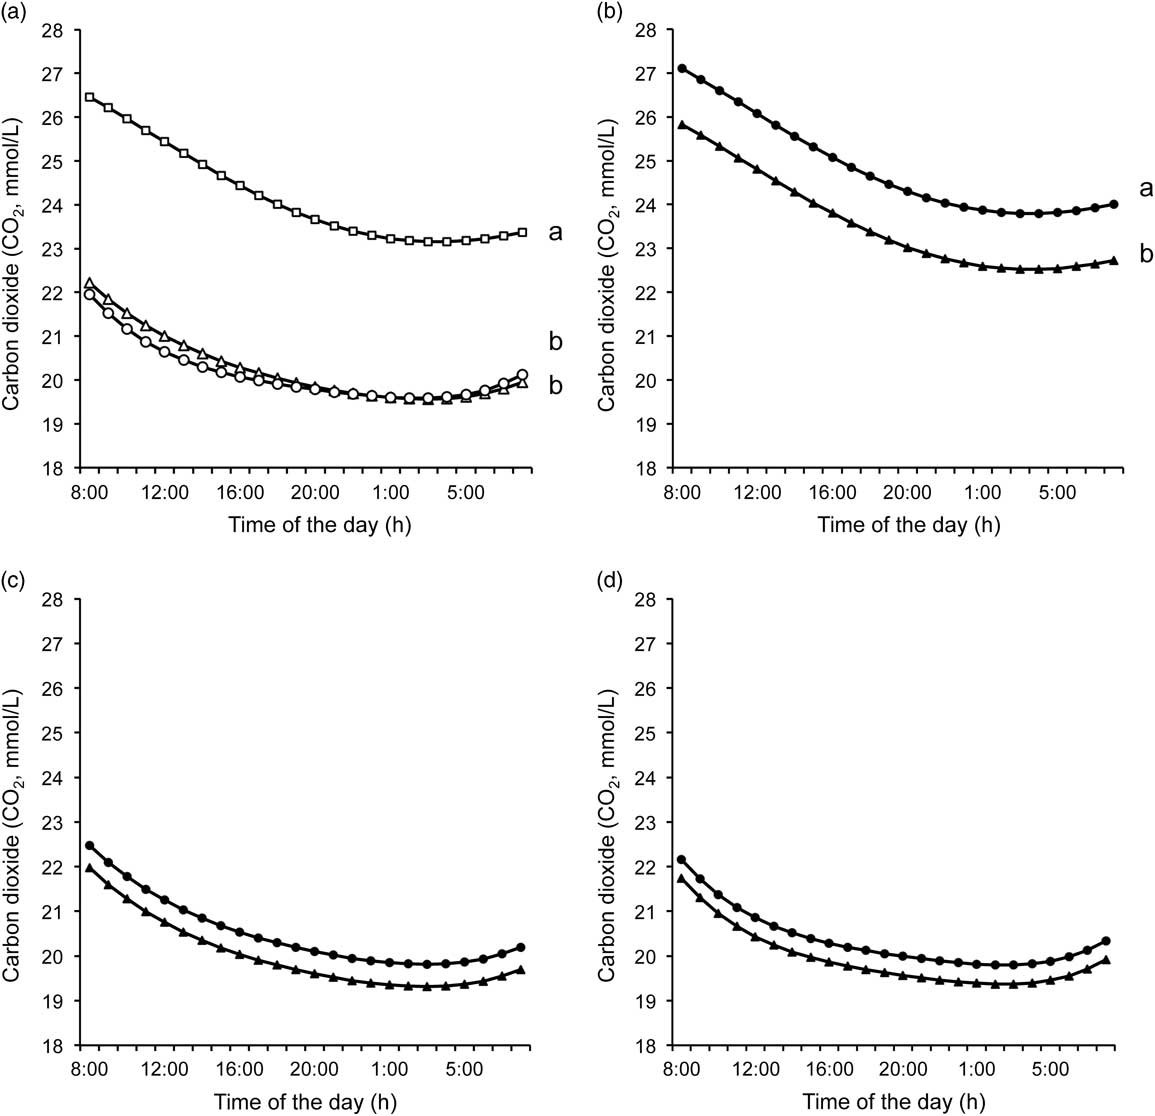
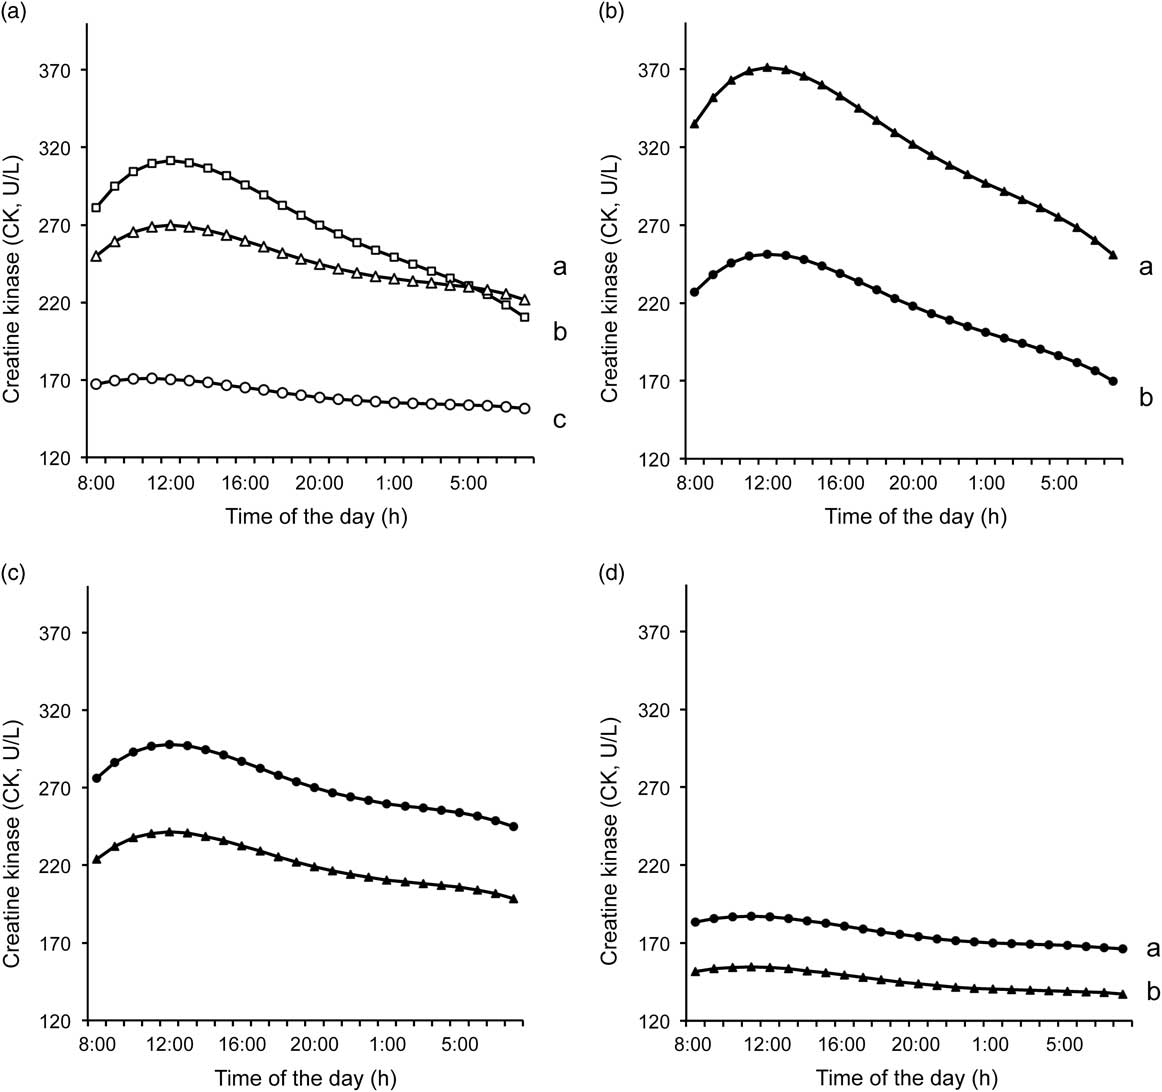
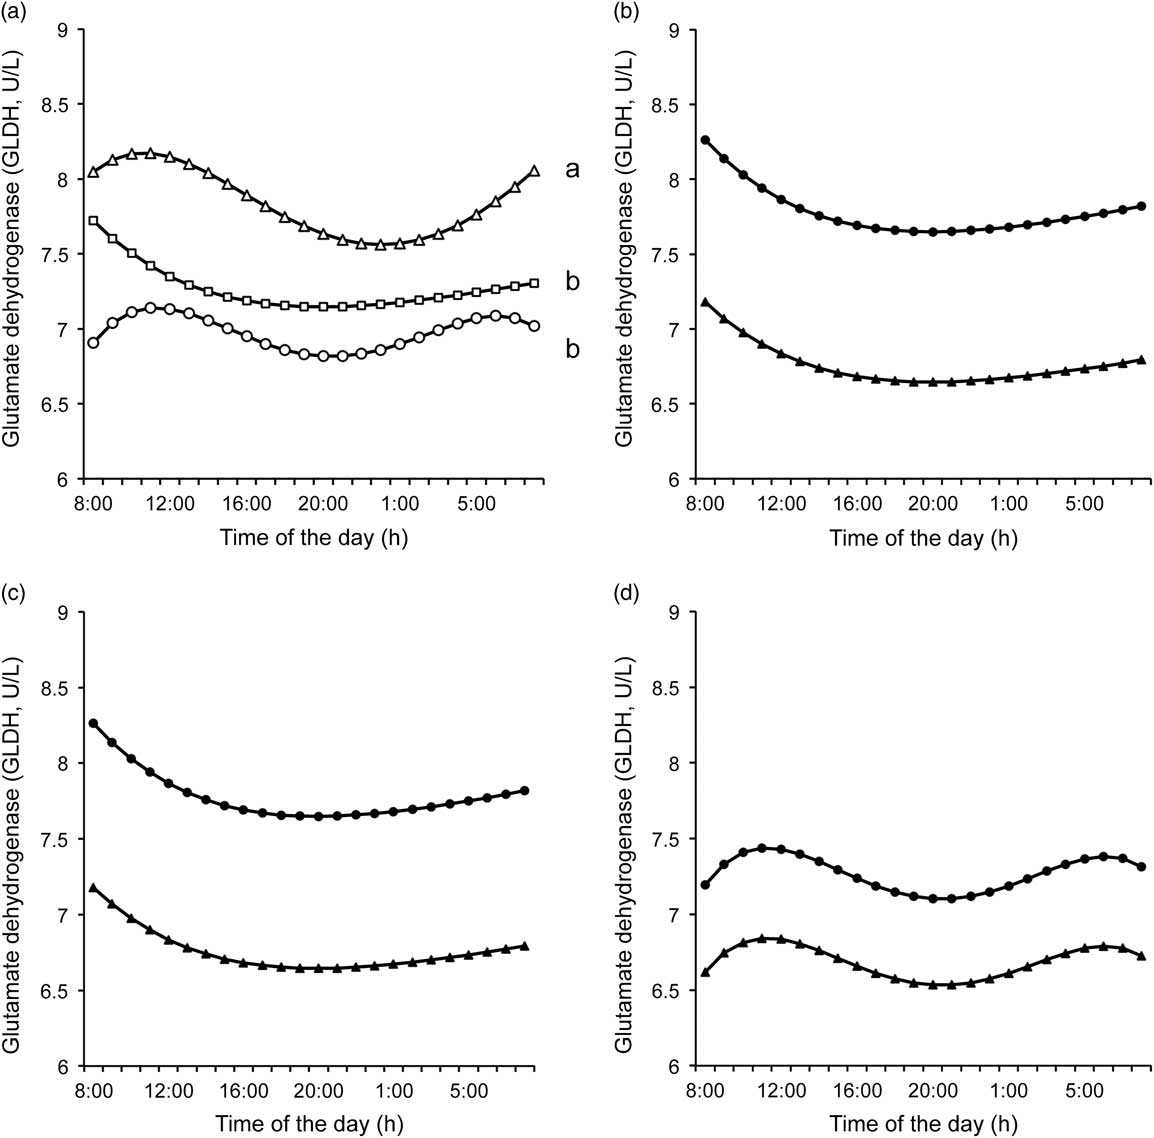
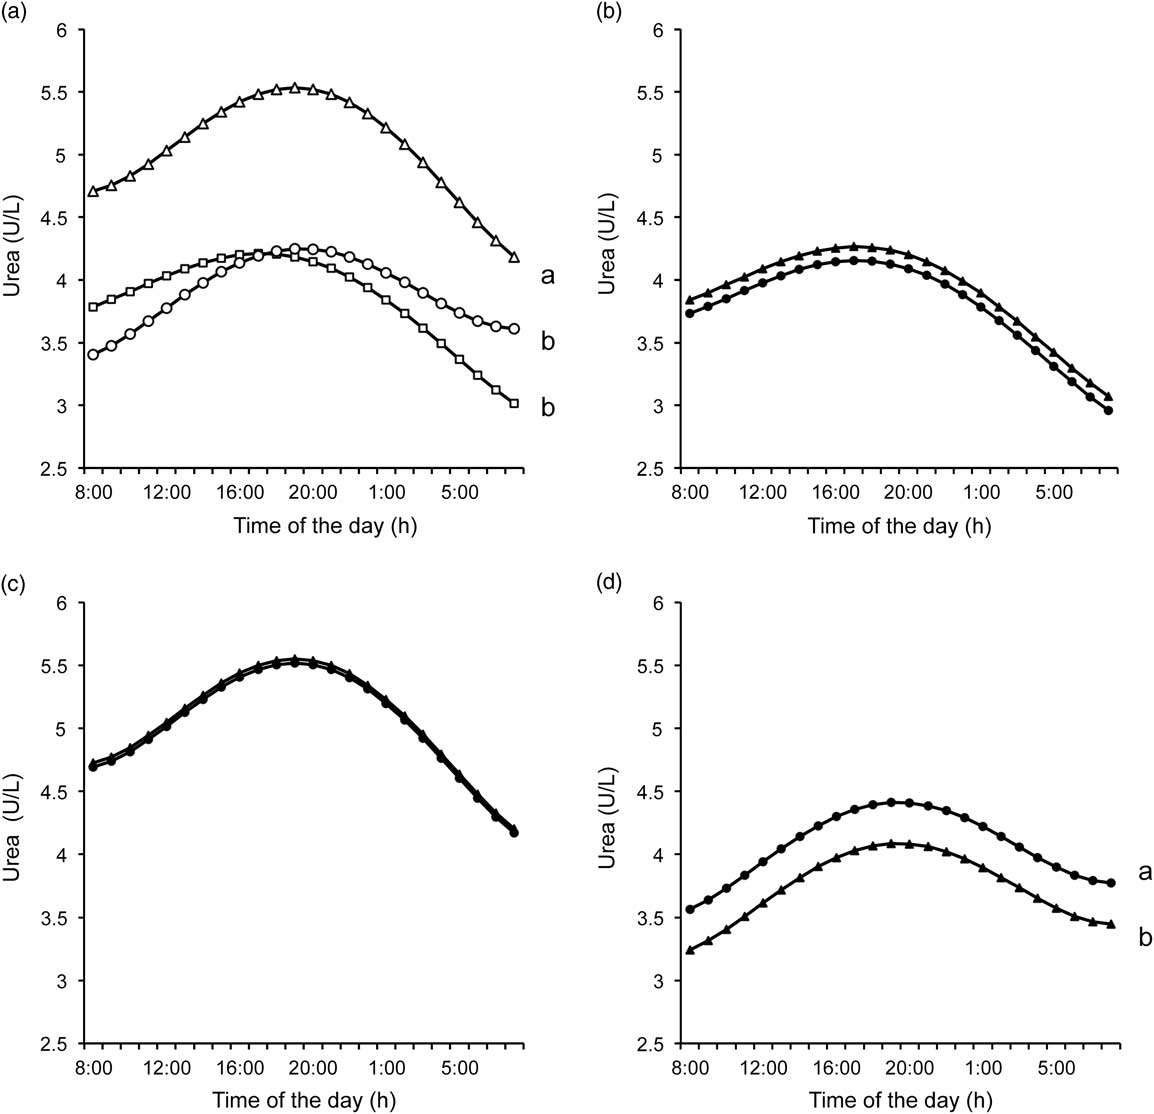
Figures 1 to 7 illustrate the least squares means of analyte concentrations and activities over the circadian period by physiological stage and by feed efficiency group within physiological stage. Table 5 shows the mean analyte concentrations at each physiological stage, corresponding to the Figures 1a to 7a. Albumin concentration was the highest (P<0.05) in early gestation, followed by late gestation and open stage. Urea and GLDH concentrations were the highest (P<0.05) at early pregnancy in comparison with open- or late-gestation stages. CK and acetate concentrations were the highest (P<0.05) in open stage, followed by early- and late-gestation stages. The AST concentration was the highest (P<0.05) at the open stage, followed by late and early gestation. CO2 concentration was higher (P<0.05) at the open stage than the early and late gestation.
(a) Circadian profiles of plasma acetate in: (a) open (□), early-gestation (▵) and late-gestation heifers (○); (b, c and d) low RFI (▴) and high RFI (●) non-pregnant, early-gestation and at late-gestation stages. Differing superscripts denote P<0.05.
(a) Circadian profiles of plasma albumin in: (a) open (□), early-gestation (▵) and late-gestation heifers (○); (b, c and d) low RFI (▴) and high RFI (●) non-pregnant, early-gestation and at late-gestation stages. Differing superscripts denote P<0.05.
(a) Circadian profiles of plasma aspartate aminotransferase (AST) in: (a) open (□), early-gestation (▵) and late-gestation heifers (○); (b, c and d) low RFI (▴) and high RFI (●) non-pregnant, early-gestation and at late-gestation stages. Differing superscripts denote P<0.05.
(a) Circadian profiles of plasma carbon dioxide (CO2) in: (a) open (□), early-gestation (▵) and late-gestation heifers (○); B: low RFI (▴) and high RFI (●) non-pregnant; (b, c and d) low RFI (▴) and high RFI (●) non-pregnant, early-gestation and at late-gestation stages. Differing superscripts denote P<0.05.
(a) Circadian profiles of plasma creatine kinase (CK) in: (a) open (□), early-gestation (▵) and late-gestation heifers (○); (b, c and d) low RFI (▲) and high RFI (●) non-pregnant, early-gestation and at late-gestation stages. Differing superscripts denote P<0.05.
(a) Circadian profiles of plasma glutamate dehydrogenase in: (a) open (□), early-gestation (▵) and late-gestation heifers (○); (b, c and d) low RFI (▲) and high RFI (●) non-pregnant, early-gestation and at late-gestation stages. Differing superscripts denote P<0.05.
(a) Circadian profiles of plasma urea in: (a) open (□), early-gestation (▵) and late-gestation heifers (○); (b, c and d) low RFI (▲) and high RFI (●) non-pregnant, early-gestation and at late-gestation stages. Differing superscripts denote P<0.05.
Least square means and standard error of the mean analyte concentrations and activities by physiological stage
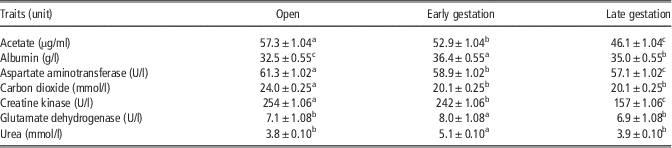
Means in a row with differing superscripts differ (P<0.05), Scheffé multiple comparison test.
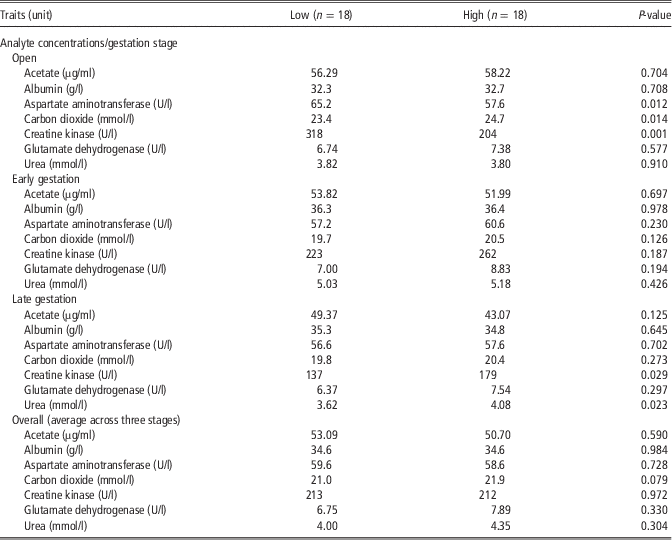
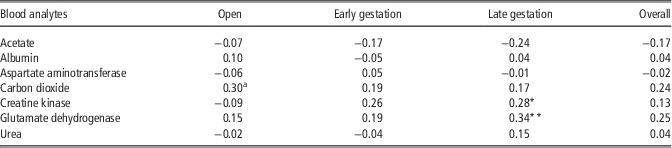
Table 6 shows the mean analyte concentrations at each physiological stage, corresponding to Figures 1b to d to 7b to d. Plasma urea values were lower (P<0.05) in low-RFI heifers in late pregnancy. CK activity in low-RFI open heifers was higher (P<0.05) than high-RFI open heifers, although more feed efficient heifers in late pregnancy showed lower (P<0.05) CK activities. Low-RFI open heifers had a higher (P<0.05) activity of AST. Plasma CO2 values were lower (P<0.05) in low-RFI open heifers. No differences between the RFI groups were observed, at any stage, for acetate and GLDH. When averaging across the three stages, no significant associations between the blood analytes and RFI were seen (Table 6), but a strong numerical evidence (P<0.10) was found for higher CO2 levels in high-RFI heifers. The analysis of correlation (Table 7) did not indicate relevant associations between 24-h average metabolites and RFI.
Mean analyte concentrations by RFI groups and physiological stageFootnote 1
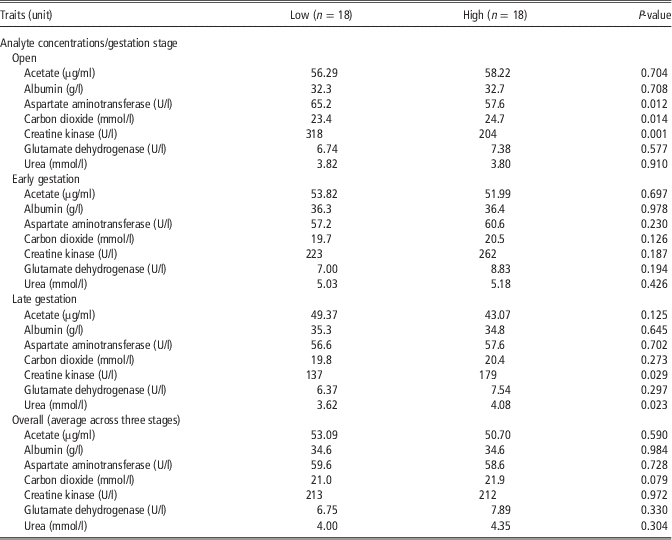
1 s.e.m. ranged 0.085 to 0.088, 0.778 to 0.784, 1.038 to 1.039, 0.360 to 0.365, 1.086 to 1.087, 1.118 to 1.119 and 0.137 to 0.138 for acetate, albumin, aspartate aminotransferase, carbon dioxide, creatine kinase, glutamate dehydrogenase and urea, respectively, across gestation stage and RFI grouping.
Correlations between residual feed intake and blood analyte means by physiological stage (open, early gestation and late gestation) and overall
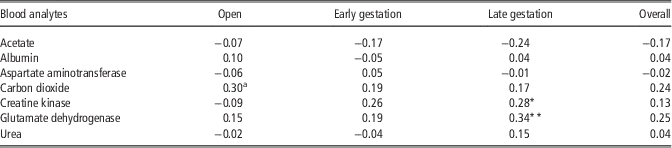
*P<0.10; **P<0.05.
Discussion
The difference in feed intake for achieving the same BW, rate of gain and body composition, as determined through RFI, indicate relevant savings in feed costs and an opportunity for minimizing the environmental food print of the beef industry; the environmental footprint being lessened through reductions in the amount of feed per cattle. The advantages of cattle with improved feed efficiency are numerous and are of particular importance in the cow herd owing to the expected high longevity of beef cows. RFI determinations are subject to population variability, size and type of diet; these factors make RFI an unsuitable trait for direct comparisons with other studies; however, it is important to note other impactful studies that have worked with this trait in beef heifers: Kelly et al. (Reference Kelly, McGee, Crews, Fahey, Wylie and Kenny2010a); Durunna et al. (Reference Durunna, Colazo, Ambrose, McCartney, Baron and Basarab2012); and Hafla et al. (Reference Hafla, Carstens, Forbes, Tedeschi, Bailey, Walter and Johnson2013).
In this study, a series of seven blood plasma analytes associated with metabolic rate variation were chosen, with the objective of characterizing their concentration over the circadian period; this approach served to increase our knowledge of ruminant physiology and identify potential indirect indicators for feed efficiency. Of these analytes, albumin, urea, AST and GLDH are parameters of liver function associated with energy and protein metabolism (González et al., Reference González, Muiño, Pereira, Campos and Benedito2011). Acetate and CO2 are parameters of energy metabolism related to the whole body (Baldwin, Reference Baldwin1995), and CK is an indicator of muscle protein turnover and also associated with energy utilization (Baird et al., Reference Baird, Graham, Baker and Bickerstaff2012). Values of albumin, urea and AST were in the range found by Doornenbal et al. (Reference Doornenbal, Tong and Murray1988) in beef heifers. CK levels were higher than those observed in most studies but still within the range set by Latimer (Reference Latimer2011) in cows. Observed GLDH levels were lower than values found by Latimer (Reference Latimer2011). CO2 levels were within the reference range reported by Latimer (Reference Latimer2011) in cows. The blood plasma concentration was within the range also observed by Preston and Leng (Reference Preston and Leng1987) in cattle.
Circadian variation in analyte concentrations
The greatest changes in plasma analyte concentrations appeared to occur between 0800 and 1600 h (Figures 1 to 7). This observation may be explained by the increase in eating activity during the daylight period (Putnam et al., Reference Putnam, Lehmann and Davis1967), and also from the addition of fresh feed to the bunk (Harvatine Reference Harvatine2012). A previous study by Simon and Bergner (Reference Simon and Bergner1983) observed that liver protein synthesis was substantially increased after feeding, which is similar to our patterns observed for albumin. Plasma urea increased to a maximum at 2000 h before decreasing throughout the remainder of the day. This pattern of increase after a meal is well known in ruminants (Manston et al. Reference Manston, Rowlands, Little and Collis1981). Plasma CK showed an increase until 1200 h and then steadily declined. Rivera-Coll et al. (Reference Rivera-Coll, Fuentes-Arderiu and Diez-Noguera1993) found that, in humans, the CK level peaked in the early afternoon. Plasma GLDH appeared to have similar patterns as observed for albumin, indicating that these two parameters of liver function are associated (Fahein et al., Reference Fahien, MacDonald, Kmiotek, Mertz and Fahien1988) and also influenced by feeding activity. Caldeira et al. (Reference Caldeira, Almeida, Santos, Vasques and Vaz Portugal1999) in their study of circadian rhythms also found an increase in GLDH activity after feeding in sheep. The concentration of AST appeared to increase from 0800 to 1200 h and remained relatively stable thereafter. In the same way, Rivera-Coll et al. (Reference Rivera-Coll, Fuentes-Arderiu and Diez-Noguera1993) found an increase in AST in the morning that was related to increased amino acid metabolism. Plasma CO2 concentration was higher around 0800 h, substantially decreased during the day and approached a steady level overnight. This trend indicates a higher metabolic rate (Baldwin, Reference Baldwin1995) of the heifers during the morning hours. Piccione et al. (Reference Piccione, Caola and Mortola2004) also observed a decrease in plasma CO2 throughout the morning relating to its production in tissues, and metabolic rate has also been shown to increase by 60% during eating in sheep (Christopherson and Webster, Reference Christopherson and Webster1972). The concentrations of plasma acetate followed the patterns observed for plasma urea. Similar to urea, plasma acetate levels are known to be associated with diet composition and time of feeding (Preston and Leng, Reference Preston and Leng1987). In addition, acetate is important for the retention of nitrogen, with a greater effectiveness in roughage diets (Eskeland et al., Reference Eskeland, Pfander and Preston1974), as were used in this study.
Effect of physiological status on analyte concentrations
The lowest level of albumin observed in open heifers (Figure 2a) is likely a result of growth and development stage (Schwartz et al., Reference Schwartz, Angle and Pitcher1986), as well as aging (Salive et al., Reference Salive, Cornoni-Huntley, Phillips, Guralnik, Cohen, Ostfeld and Wallace1992). Urea concentrations increased from open to early pregnancy and then decreased at late pregnancy. Our findings are in agreement with Antunovic et al. (Reference Antunovic, Sencic, Speranda and Liker2002), who found a steady decline in plasma urea nitrogen in dairy cattle before calving, indicating a greater efficiency of amino-acid use for protein synthesis. CK concentrations decreased from open to pregnant and late pregnant heifers. Antunovic et al. (Reference Antunovic, Novoselec, Sauerwein, Speranda, Vegara and Pavic2011) also found a decrease in CK concentrations between non-pregnant and pregnant ewes. The highest CK level observed in open heifers may have less to do with physiological status and more to do with the age of the heifers. Metabolic rate tends to decrease with aging, with adults typically showing lower levels of skeletal muscle protein synthesis, degradation and accretion (Castro Bulle et al., Reference Castro Bulle, Paulino, Sanches and Sainz2007). Higher plasma CK activities were also observed during rapid growth in turkeys (Mills et al., Reference Mills, Mitchell and Mahon1998) and pigs (Mitchell and Heffron, Reference Mitchell and Heffron1975). Circulating concentrations of GLDH were the highest in early pregnancy, and did not differ between open and late pregnancy. GLDH catalyzes the deamination of glutamate as part of ureagenesis (Kravos and Malesic, Reference Kravos and Malesic2008). The pattern of GLDH levels followed those of urea, indicating that amino-acid catabolism decreased throughout pregnancy and enabled partitioning of amino acids for fetal growth. Baumgartner and Pernthaner (Reference Baumgartner and Pernthaner1994) observed similar results for GLDH in Karakul sheep; younger sheep had higher GLDH levels than older sheep, in addition to differences during the reproductive cycle and varying seasons of the year. Plasma concentrations of AST decreased throughout pregnancy. Studies on ewes have shown increases in AST in pregnant ewes (Antunovic et al., Reference Antunovic, Sencic, Speranda and Liker2002). Alternatively, Ramos et al. (Reference Ramos, Verde, Marca and Fernandez1994) and Lebedevaa et al. (Reference Lebedevaa, Leibovab and Ernstc2012) found a drop toward the end of pregnancy, agreeing with our findings. Levels of CO2 were lower in pregnant heifers than in open heifers, but did not differ between early open and late pregnancy. The highest level observed in open heifers may be reflective of an increase in metabolism of the growing heifers (Arthurs and Sudhaker, Reference Arthurs and Sudhakar2005). The higher acetate levels found at open versus the early- and late-gestation stages suggest a higher energetic demand in growing heifers, resulting in higher acetate abundance. The physiological state, by influencing nutrient requirements (i.e. higher demand of glucose at late gestation), also influences the acetate concentration owing to intake depression as calving approaches (Preston and Leng, Reference Preston and Leng1987).
We observed that most of the measured analytes were at levels indicating greater metabolism and organ function not in late gestation but instead in open heifers. Bauman and Currie (Reference Bauman and Currie1980) proposed that maternal adjustments during pregnancy were both homeostatic and homeorhetic. Previous studies have indicated that pregnancy may increase the efficiency of visceral metabolism to act as an energy conservation strategy designed to support pregnancy (Ferrell et al., Reference Ferrell, Garrett, Hinman and Gritching1976; Scheaffer et al., Reference Scheaffer, Caton, Bauer, Redmer and Reynolds2003).
Differences in circulating analyte concentrations by RFI class within physiological stage
In high- and low-RFI open heifers, differences were found for CK, AST and CO2. Plasma CK concentrations were higher in low-RFI heifers. Lawrence et al. (Reference Lawrence, Kenny, Earley, Crews and McGee2011), through single blood sample analysis, did not observe differences for RFI groups in late pregnancy heifers. The higher activity of plasma CK in yearling heifers may be related to a greater energetic demand for growth at this stage of development. CK acts in the modulation of ATP and ADP concentrations by catalyzing the reversible exchange of phosphate bonds between phosphocreatine and ADP produced during muscle contraction (Brancaccio et al., Reference Brancaccio, Maffulli and Limongelli2007), thereby influencing energy utilization by the muscle tissue. Circulating concentrations of AST were higher in low-RFI heifers. Richardson et al. (Reference Richardson, Herd, Archer and Arthur2004) reported a positive correlation between RFI and AST in beef steers. Lawrence et al. (Reference Lawrence, Kenny, Earley, Crews and McGee2011) found the opposite pattern of what we observed with a lower concentration of AST in low-RFI heifers. Higher activity of plasma AST in low-RFI heifers may indicate a greater workload placed on the liver for enzyme synthesis. The functional workload concept defined by Johnson et al. (Reference Johnson, Johnson and Baldwin1990) states that as metabolizable energy intake increases, there is a change in the mass, function and resulting energy consumption of tissues. Therefore, a higher activity of AST may indicate an overall higher metabolic function of the liver of low-RFI yearling heifers. Plasma CO2 was higher in the high-RFI heifers. This intriguing finding provides fundamental evidence to support the increased wastage of metabolic energy in less feed-efficient cattle, wastage not because of factors already accounted for in the RFI calculation (e.g. BW, gain and composition), but because of the demands to supply the background energy requirements. A higher CO2 concentration may be associated with greater oxygen consumption (Johnson et al., Reference Johnson, Johnson and Baldwin1990); this scenario is compelling as increased oxidation may be coupled to higher energy wastage as heat. Montanholi et al. (Reference Montanholi, Odongo, Swanson, Schenkel, McBride and Miller2008) provided evidence that heat production can be assessed with infrared imaging; moreover, study by Montanholi et al. (Reference Montanholi, Swanson, Palme, Schenkel, McBride, Lu and Miller2010) showed high-RFI beef steers having warmer thermographs.
In early pregnancy, no differences were observed in blood analyte levels between RFI groups. When looking at differences between the analytes of high and low RFI in late pregnancy, urea and CK concentrations were found to differ. Urea concentrations were found to be lower in low-RFI heifers. Similar results have been reported elsewhere (Richardson et al., Reference Richardson, Herd, Archer and Arthur2004; Kelly et al., Reference Kelly, McGee, Crews, Fahey, Wylie and Kenny2010a, Reference Kelly, McGee, Crews, Sweeney, Boland and Kenny2010b and Reference Kelly, McGee, Crews, Lynch, Wylie, Evans and Kenny2011). The lower concentration of urea in the plasma of low-RFI heifers indicates that the visceral organs may expend less energy for urea synthesis (McBride and Kelly, Reference McBride and Kelly1990), a major energy-consuming event facilitated by the ruminant liver. It is also probable that greater systemic concentrations of urea in high-RFI animals is a function of differences in several biological processes, such as potentially greater ruminal passage rate, poorer protein digestibility, greater rate of body protein degradation, deviation in supply of amino acids and variation in efficiency of rumen microbial protein production (Kahn et al., Reference Kahn, Leng and Piper2000). Moreover, the lower levels of plasma urea in the more efficient heifers at late gestation indicate a greater transfer efficiency of urea from blood to the rumen, potentially translating to greater synthesis of microbial protein (Harmayer and Martens, Reference Harmayer and Martens1980). In contrast with open heifers, CK concentrations were lower in the low-RFI heifers in late gestation. Lawrence et al. (Reference Lawrence, Kenny, Earley, Crews and McGee2011) working with pregnant heifers during the last third of gestation did not observe differences in CK concentrations within a set of five samples spaced by 21 days. This opposite relationship between the CK and RFI groups observed in our study may be related to different biological functions of CK, particularly in the muscle tissue. Whereas CK is associated with muscle tissue development (Linkhart et al., Reference Linkhart, Clegg and Hauschka1981), which still occurs at a significant rate in young heifers (Owens et al., Reference Owens, Dubeski and Hanson1993), the molecular structure of CK is found modified in older animals, with this modification resulting in decreases in its biological activity (Nuss et al., Reference Nuss, Amaning, Bailey, DeFord, Dimayuga, Rabek and Papaconstantinou2009). The CK level is a marker of the functional status of muscle tissue (Brancaccio et al., Reference Brancaccio, Maffulli and Limongelli2007). In addition, an increase in the activity of CK in the plasma can be caused by muscle turnover, as protein degradation accounts for 7% to 10% of muscle tissue energy use, as well as a further 20% use for protein synthesis (Caton et al., Reference Caton, Bauer and Hidari2000). Therefore, more efficient cattle may have less energy expenditure with protein turnover.
In general, the circadian characterization of seven blood analytes in the context of physiological stages and feed efficiency illustrated tremendous variation, which seems related to periods of more intense feeding activity; differences between open and pregnant heifers; growth stage; and variation in the efficiency of feed utilization. The background factors influencing metabolite levels should be considered while attempting to assess feed efficiency using these blood parameters. The observation of no relevant correlations between RFI and average metabolite concentrations (i.e. 24 h average) indicates that the actual metabolic circadian patterns should be preferred when compared with overall values. Further analyses for determining the optimum time of day and adequate sampling frequency are needed.
Conclusions
Hematological measures may have the potential for the application as indirect indicators of feed efficiency. More efficient yearling (open) heifers appear to have greater metabolic rates in the liver and muscle tissue, whereas more efficient pregnant heifers appear to have lower metabolic rates in the liver and muscle. Physiological status must be factored into analyses as there were differences in analyte levels between different growth and pregnancy stages. In addition, distinct patterns of circadian variation exist; however, further studies are needed to determine the optimal timing for sampling. On the basis of these findings, CO2 shows promise as an indicator of RFI as it held consistency between physiological stages; the same is valid for analytes that distinct high- and low-RFI heifers before breeding, AST and CK, which may have practical application in commercial settings. Moreover, combinations of blood plasma analytes may be the most effective tool for indirect screening of feed efficiency in cattle. Future studies verifying our findings and showing consistent associations across different animal categories and physiological statuses are warranted.
Acknowledgments
The authors would like to thank Tim Caldwell for providing ultrasound technical expertise, the staff of the Elora Beef Research Centre at the University of Guelph, and the Animal Health Laboratory also at the University of Guelph. The substantial support of 44 undergraduate volunteer students in conducting this labor-intensive study is also greatly appreciated. The financial support from OMAFRA (Ontario Ministry of Agriculture, Food, and Rural Affairs), the Beef Cattle Research Council, Agriculture and Agri-Food Canada, and the Ontario Beef Producers are also highly acknowledged.