


Introduction
Glacier-surface displacements produced by geothermal and volcanic activity beneath ice caps are commonly observed in Iceland. The glacier surface subsides locally where ice melts at the base and when the meltwater drains away. Depressions are situated above subglacier geothermal areas and created by volcanic eruptions that may even melt openings and canyons through the ice cover. The surface depressions tend to be gradually reduced by inflow of ice, and meltwater may accumulate in a subglacier lake beneath the depressions, sealed by the surrounding ice overburden pressure. The filling is interrupted during drainage of the lakes in glacier-out-burst floods (jökulhlaups) toward the glacier margin. Following jökulhlaups the subglacier lakes are normally sealed again, and ice flows into the depression, gradually reducing its depth until water drains again in a new jökulhlaups. Subsidence may also be observed above subglacier pathways transporting jökulhlaups. All of these expressions of glacier–volcano interactions were observed on the surface of western Vatnajökull during the period 1996–99 (Fig. 1). This activity, described by synthetic aperture radar (SAR) images from satellites, is the subject of this paper.
A map of western Vatnajökull. The inset map of Iceland shows the area covered by the map and the location of the active volcanic zone. Subglacier lakes are situated beneath surface depressions in the geothermal areas of Grímsvötn and the Skaftá cauldrons. Location of the fissure of the Gjálp eruption site of 30 September–12 November 1996, the subglacier volcano Bárdarbunga, the ice dam east of Grímsvötn, and the Skeiðarárndur. The largest dashed box surrounding the Gjálp–Gríms-vötn–Háabunga area shows the coverage of the SAR image in Figure 5, and the arrow shows the look direction of the SAR. The smaller dashed boxes show the coverage of the digital elevation models in Figure 2.

Observations of the effects of subglacier volcanic and geothermal activity on glaciers in Iceland have mainly been obtained by reconnaissance flights, oblique and vertical aerial photography, Landsat images, ground-based measurements of surface elevation and surface velocity, and airborne radar altimetry profiling (Reference ÁskelssonÁskelsson, 1936; Reference BjörnssonBjörnsson, 1974, Reference Björnsson1988, Reference Björnsson1992; Reference ThórarinssonThorarinsson, 1974; Reference Thórarinsson, Sæmundsson and WilliamsThorarinsson and others, 1974; Reference Gudmundsson and BjörnssonGudmundsson and Bjornsson, 1991; Reference Gudmundsson, Björnsson and PálssonGudmundsson and others, 1995, Reference Gudmundsson, Sigmundsson and Björnsson1997, Reference Gudmundsson, Högnadóttir, Björnsson, Pálsson and Sigmundsson1999, Reference Gudmundsson, Larsen, Björnsson and Sigmundsson2000). Recently, repeat-pass SAR images from the European Remote-sensing Satellite (ERS-1/-2) tandem mission have been used to explore the western Vatnajökull which is underlain by the volcanic zone of Iceland. Both satellites were orbiting in a 35 day repeat cycle, with a time difference of exactly 1 day between overpasses of the same ground point (Reference Dow, Rosengren, Marc, Zandbergen, Piriz and Romay MerinoDow and others, 1996; Reference Duchossois, Kohlhammer and MartinDuchossois and others, 1996). After June 1996, SAR tandem data were acquired occasionally, to exploit the improved geographic coverage provided by new receiving stations and to observe dynamic phenomena of special interest.
Previous work with the tandem pairs of Vatnajökull includes a description of surface deformation related to filling of the depression that was formed during the Gjálp volcanic eruption in October 1996 (Reference Rott and SiegelRott and Siegel, 1998) and studies of the displacement field of the Skaftá cauldrons from March to October 1996 (Reference Jónsson, Adam and BjörnssonJónsson and others, 1998). Reference Alsdorf and SmithAlsdorf and Smith (1999) reported on changes of ice topography and velocity based on tandem pairs of March 1996 and January 1997. Their derived surface velocities in the Gjálp area show differences to our results, probably because they had only a very coarse digital elevation model for subtracting the topographic phase. For the present paper, the ERS tandem dataset of nine image pairs, acquired over a period of 2 years after the eruption, was analyzed, using updated digital elevation maps (DEMs) for topographic correction of the interferograms. We describe the development of the depressions created by the Gjálp eruption, subsidence above tunnels conducting the jökulhlaup following the eruption, and the displacement of the ice cover of the subglacier lakes at Grímsvötn and Skaftá cauldrons.
Western Vatnajökull: Volcanoes, Subglacier Lakes and Jökulhlaups
More than 80 volcanic eruptions have been accounted for from western Vatnajökull (8100 km) during the last 800 years, many producing catastrophic floods (Reference ThórarinssonThorarinsson, 1974; Reference Björnsson and EinarssonBjörnsson and Einarsson, 1991; Reference Larsen, Gudmundsson and BjörnssonLarsen and others, 1998). A few of the volcanoes contain geothermal systems maintaining permanent depressions, underlain by subglacier lakes that drain periodically in jökulhlaups. The best-known depressions at geothermal areas are the Grímsvötn depression and the Skaftá cauldrons (Fig. 1).
Ice drains toward the Grímsvötn depression from an area of 160 km2, where a geothermal system continuously melts ice at a rate of 0.2–0.5 km3 a−1 (Reference BjörnssonBjörnsson, 1988; Reference Björnsson and GudmundssonBjörnsson and Gudmundsson, 1993). The meltwater forms a subglacier lake in the floor of the caldera; normally, the 250 m thick ice cover that floats on the lake rises 10–15 m a−1. The seal is broken when the lake level has risen typically 80–110 m, and the water flows 50 km beneath Skeiðarárjökull down to the Skeiðarárndur outwash plain (Fig. 1). Jökulhlaups from Grímsvötn have occurred at 1–10 year intervals, with a peak discharge of 600–50 000 m3 s−1 at the glacier margin, a duration of 2 days to 4 weeks and a total volume of 0.5–4.7 km3 (Reference Gudmundsson, Björnsson and PálssonGudmundsson and others, 1995; Reference BjörnssonBjörnsson, 1997; Snorrason and others, 1997).
The two Skaftá cauldrons are situated over subglacier geothermal systems, 10–15 km northwest of Grímsvötn. Since 1955, at least 30 jökulhlaups have drained from the cauldrons to the river Skaftá (Fig. 1). The ice cauldrons are approximately circular (Reference BjörnssonBjörnsson, 1976, Reference Björnsson1978, Reference Björnsson1988). The centre of the eastern cauldron subsides by about 100–150 m in a jökulhlaup draining a volume of 0.2–0.4 km3 of water; the other cauldron subsides by 50–100 m and drains a volume of 0.05–0.16 km3 (Reference Zóphóníasson and PálssonZóphóníasson and Pálsson, 1996). The period between these drainage events is about 2–3 years for each cauldron. The ice-drainage areas of the western and eastern cauldrons have been estimated at 33 and 58 km3, respectively (Reference Björnsson, Pálsson and GudmundssonBjörnsson and others, 1992).
Geothermal and Volcanic Activity in Western Vatnajökull, 1996–99
The 1996 eruption and its effects on the glacier surface
During 13 days, from 30 September to 13 October 1996, a volcanic eruption took place on a 6–7 km long fissure under Vatnajökull (Reference Einarsson, Brandsdóttir, Gudmundsson, Björnsson, Grönvold and SigmundssonEinarsson and others, 1997; Reference Gudmundsson, Sigmundsson and BjörnssonGudmundsson and others, 1997). The eruption occurred beneath 500–750 m thick ice, midway between the Bárdarbunga and Grímsvötn volcanoes (Figs 1 and 2). An approximately north–south-trending depression, 2–4 km wide and heavily crevassed, was formed in the glacier surface above the volcanic fissure as 3 km3 of meltwater drained from the eruption site toward the subglacier lake in Grímsvötn. The elongated depression contained almost circular cauldrons at each end. At a third central cauldron, the eruption melted an opening through the ice (initially 500 m thick) feeding the subaerial eruption for 12 days through a 50–100 m high chimney which remained 200–300 m wide; melting of ice was apparently compensated by inflow of ice. From this site, meltwater drained on the glacier surface southwestward along the central axis of the depression and melted an ice canyon, 60–100 m deep and 300 m wide. Reaching the southernmost cauldron, water disappeared down-glacier, but a shallow linear subsidence was visible at the glacier surface marking the subglacier pathway of the warm meltwater (at least 15–20°C) draining into Grímsvötn (Reference Gudmundsson, Sigmundsson and BjörnssonGudmundsson and others, 1997).
Time sequence of contour maps of the Gjálp–Grímsvötn area. For location see Figure 1. (a–f) The Gjálp area and the location of the profile ABC of Figure 7 that is placed in the look direction of the SAR. Coordinates of the points: A, 64°31.42 N, 17°27.89′ W; B, 64° 31.94′ N, 17°22.88′ W; C, 64°32.45′ N, 17° 17.86 W.(g–h) Grímsvötn before and after the events in October–November 1996. The cross shows the location at the centre of Grímsvötn where the elevation of the floating ice cover is monitored.

At the end of the 1996 eruption its effects were limited to a 2–4 km wide depression. The glacier surface remained intact outside this area, and no rapid basal sliding occurred on a regional scale. The sudden removal of mass from the glacier base during the eruption led to an inflow of ice to the depression which widened from 4 to 7 km in the first 3 months after the eruption, reaching a maximum width of 8 km in summer 1997. Since then the effects of the eruption on the glacier surface have not been more widespread. At the same time the depression has become shallower (Fig. 2); the volcano fissure has gradually cooled, and melting of ice diminished.
Topographic data from the eruption site and environments have repeatedly been acquired since October 1996 and used to construct topographic maps of the ice surface (Fig. 2; Reference Gudmundsson, Sigmundsson and BjörnssonGudmundsson and others, 1997, Reference Gudmundsson, Högnadóttir, Björnsson, Pálsson and Sigmundsson1999). Airborne altimeter soundings were made along east–west traverses on 12, 17 and 21 October and 11 November 1996, and 3 January and 5 April 1997. The aircraft was flown at a fixed altitude, positioned with global positioning system, and altimeter readings taken approximately every 200 m. Ground-based measurements, using sub-metre differential global positioning system (DGPS) were obtained in June and August 1997 and 1998 and in June and September 1999. Digital maps with grid spacing of 100 m × 100 m were compiled by interpolation of data from the sounding lines. The accuracy of the maps is considered better than 10–20 m.
Filling and drainage of the Grímsvötn subglacier lake, 1996–99
The meltwater from the eruption site of 1996 accumulated in the Grímsvötn subglacier lake until it drained in a catastrophic jökulhlaup flood of 4–7 November 1996. By 4 November the lake had risen to the highest level ever observed, 1510 m. The ice closing the lake was lifted off the glacier bed late in the evening of 4 November, and 10.5 hours later water emerged from the margin of Skeiðarárjökull as a flood wave inundated Skeiðarársandur, the most rapid jökulhlaup ever reported from Grímsvötn. The jökulhlaup reached a peak in 16 hours and ended on the morning of 7 November. The total volume of water released from the glacier was estimated at 3.2 km3. During the drainage the lake surface subsided by 175 m (Fig. 3), and the floating ice cover was reduced from 40 to <5 km2.
Uplift and subsidence of the centre of the ice cover of Grímsvötn and the Skaftá cauldrons, 1996–99. Rates of uplift and subsidence compared with data from SAR interferograms of the ERS-1/-2 tandem mission.

During the drainage of water out of the lake a 6 km long, 1 km wide and 100 m deep depression was formed in the glacier surface across the ice dam east of the lake (Figs 1 and 2g and h). The subsidence was created above the collapsed ice tunnel that served as a conduit for the jökulhlaup. The volume of the depression was 0.3 km3, so the average temperature of the 3.2 km3 of water released from the lake was about 8°C.
Since the jökulhlaup of November 1996, the drainage conditions of the Grímsvötn subglacier lake have been abnormal. At first, water accumulated in the lake, but due to damage to the ice dam of Grímsvötn the lake level could not rise above 1390 m (i.e. ice surface elevation of 1420 m; see Fig. 3). From late December 1996, water drained continuously out of the lake until the end of April 1997. Subsequently, water accumulated again in the lake until a jökulhlaup drained water from it in mid-February 1998. This flood started at a lake level of about 1400 m, some tens of metres lower than had typically been the case before the jökulhlaup in November 1996, because the ice dam had been damaged during that event. The lake level declined to about 1370 m and did not rise again until late April 1998. The next jökulhlaup took place in early February and early November 1999 (Fig. 3).
Digital maps were constructed of the Grímsvötn area in September 1996 and July 1997 (Fig. 2g and h) on the basis of airborne radar altimetry and a ground-based DGPS. The accuracy of the maps is about 5 m. The maps could be updated throughout 1997 because the lake level was monitored.
Infilling and drainage of the Skaftá cauldrons
The eastern Skaftá cauldron drained during the periods 26–29 July 1995 and 15–19 August 1997, releasing 370 ×106 m3 and 170 × 106 m3 of water, respectively (Reference Zóphóníasson and PálssonZóphóníasson and Pálsson, 1996; personal communication from S. Zóphóníasson, 1999). The depression was gradually reduced after the jökulhlaups, and the average uplift of the lowest point in this cauldron was 10 cm d−1 from June to September 1998 and 6 cm d−1 from September 1998 to June 1999 (Fig. 3b). The western cauldron drained during the periods 9–17 August 1996 (145 × 106 m3), 24–25 August 1997 (35 × 106 m3) and September 1998 (115 × 106 m3). The average uplift of the lowest point in this cauldron was 20 cm d−1 from September 1997 to June 1998 and 8 cm d−1 from June to September 1998 (Fig. 3).
Digital maps of the cauldrons, with an accuracy of 5 m, were constructed based on measurements in summer 1996 and June 1997. They were updated with an accuracy of 15 m until August 1997 when both cauldrons subsided during jökulhlaups. Thereafter the uncertainty in elevation was about 50 m.
SAR Interferometric Studies of Western Vatnajökull, 1996–99
Of the available ERS SAR tandem data, nine pairs were selected to study the surface displacements after the 1996 eruption (Table 1). In order to be able to generate an interferogram from a SAR image pair, the phase contribution of the observed object must remain constant. Surface melt, precipitation and wind erosion may cause rapid decorrelation of snow and ice surfaces (Reference Rott and SiegelRott and Siegel, 1997). For this reason, the tandem mission pairs, separated by 1 day, provide a key benefit to derive interferograms of glaciers under rapidly changing weather conditions. Over the study area, seven tandem pairs were acquired from the ascending pass between 23–24 October 1996 and 17–18 December 1997, and an additional pair on 6–7 January 1999. From the descending pass, one tandem image pair was acquired on 21–22 October 1996. The coherence of the tandem pairs showed significant spatial variability on the glacier surfaces. Good coherence was observed over the complete image for the tandem pairs of 1–2 January 1997 and 6–7 January 1999. The coherence of the tandem pair of 23–24 October 1996 was quite low over large parts of the glacier, so this pair was not used for displacement analysis. In tandem pairs 2–7 the coherence of the eruption site and Grímsvötn region was suitable for interferometric analysis. In the tandem pair of 21–22 October 1996, the signal decorrelated at the eruption site because of the rapid deformation of the surface, but the coherence was comparatively high on the undisturbed glacier surfaces.
Characteristics of the analyzed interferograms

Background of surface-displacement analyses
An across-track SAR interferometer measures the change of the signal phase across the SAR image swath (Reference Massonnet and FeiglMassonnet and Feigl, 1998; Reference RosenRosen and others, 2000). If the phase of the scattering object and the atmospheric phase delay are the same in both images, the range difference, ΔR from the two antenna positions to the object is related to the interferometric phase, Φ, by

where λ is the radar wavelength (5.66 cm for ERS SAR). With a repeat pass, interferometer Φ depends on the height above the reference surface (the topographic phase), and varies with the surface displacement in range between the two orbits. The topographic and the displacement-related phase can be separated by means of differential interferometry using two or more interferograms, if the surface motion is steady (Reference Joughin, Winebrenner, Fahnestock, Kwok and KrabillJoughin and others, 1996; Reference Reeh, Madsen and MohrReeh and others, 1999). However, the assumption of a steady motion is not valid for the areas subject to glacier–volcano interactions in western Vatnajökull. Therefore, we eliminated the topographic contributions by means of synthetic interferograms, calculated from digital elevation data and orbital parameters. Because the ice motion and the topography changed due to filling of the depressions, it was necessary to use digital elevation data from different dates (Fig. 2).
Since the height sensitivity is proportional to the perpendicular baseline B n, interferometric pairs with short baseline are preferable for analysis of surface motion. The height of ambiguity, H a, represents the height that corresponds to a phase change of 2π (one fringe):

where B n is the baseline component perpendicular to the radar beam, θ is the radar look angle and R is the range from the satellite to the glacier surface. The H a of the analyzed interferometric pairs is 42–237 m (Table 1), corresponding to a difference in the sensitivity to elevation, and consequently also to errors in the elevation data used to calculate the synthetic interferogram.
After subtracting the topographic phase, the phase across the image is related to the surface displacement by (Reference Joughin, Kwok and FahnestockJoughin and others, 1998)

where Δy is the component of displacement tangential to the surface of a reference ellipsoid and directed across track, Δz is the displacement directed normal to the ellipsoid, and ς is the incidence angle at a horizontal surface. The ς varies from 20° to 26° across the image swath of ERS SAR. In the centre of the swath (ς = 23°), one fringe corresponds to a horizontal displacement Δy = 7.24 cm or a vertical displacement Δz = 3.07 cm.
From an interferogram we obtain only the displacement rate in the direction of the radar beam. In order to separate the three components of the displacement vector, information from other sources or assumptions on the flow behaviour are required. For steady-state ice masses the assumption is usually made that the surface ice is constrained to flow parallel to the ice surface (Reference Joughin, Kwok and FahnestockJoughin and others, 1998; Reference Reeh, Madsen and MohrReeh and others, 1999). Under this assumption the displacement vector can be obtained from interferograms of crossing orbits if the surface slope is known (Reference Joughin, Kwok and FahnestockJoughin and others, 1998; Reference Mohr, Reeh and MadsenMohr and others, 1998). From interferograms of a single look direction the velocity vector can be determined if the ice-flow direction is obtained from features in aerial photography, optical satellite images or SAR amplitude images (Reference Rott and SiegelRott and others, 1998).
Interferometric time series
Figure 4 shows an interferogram of the Grímsvötn–Gjálp area. It is a subsection of the interferogram derived from the ERS SAR tandem pair of 1–2 January 1997. The phase pattern results from the phase shifts due to topography and to surface displacement. At the sites of glacier–volcano interaction the fringe pattern is dominated by ice motion: (1) at the depression of the 1996 Gjálp fissure eruption and the 1.5 km wide linear trench, above the subglacier pathway of the meltwater from the eruption site toward Grímsvötn, (2) on the ice covers of the lakes at Grímsvötn and the Skaftá cauldrons, and (3) at the depression across the ice dam east of Grímsvötn, created above the collapsed ice tunnel that served as a conduit for the jökulhlaup of 4–7 November. In the other parts of the image the topographic contribution dominates, with one topographic fringe corresponding to an elevation difference of 43 m.
Interferogram of the Grímsvötn–Gjálp area derived from an ERS SAR tandem image pair of 1–2 January 1997, superimposed on an amplitude image (for location see Fig 1). Coordinates of the corner points are: upper left, 64°33.09′ N, 17°46.07′ W; upper right, 64°37.52 N, 17°09.29′ W; lower left, 64°17.37′ N, 17°35.13 W; lower right, 64°21.73 N, 16°58.75′ W One colour cycle (one fringe) corresponds to a phase shift of 2π. The phase contribution of the flat Earth has been removed. The phase is ambiguous within integer multiples of 2 (the wrapped phase). The slope on the east site of the depression at the Gjálp eruption site, which is tilted towards the SAR, appears shortened (foreshortening) because the image has not been corrected for distortions induced by the radar geometry. C–D, the 1996 eruption site of Gjálp; D, an elongated depression; C, a canyon trending in the direction southwest–northeast; P, a trench above the subglacial pathway of the meltwater; G, Grímsvötn; F, the route of the jökulhlaups across the ice dam and towards Skeiðarásandur; S, western and eastern Skaftá cauldrons; H, Háabunga.

Figure 5a–f show six interferograms of the Gjálp–Grímsvötn area that were acquired between 1–2 January 1997 and 6–7 January 1999 (interferograms 2–4 and 6–8 in Table 1). Analysis of the interferograms requires several technical steps. At first, the topographic phase was subtracted by means of a synthetic interferogram, based on the DEM and the appropriate baseline. For the Gjálp and Grímsvötn area (Fig. 1) the DEM of January 1997 or June/July 1997 was used, whichever was closer in date to the particular SAR interferogram. The elevation data outside of this area were acquired in 1990, so the same DEM was always used for this outer part. Then the interferograms were geocoded and topographically corrected to transform the images from slant range to map geometry.
Topographically corrected interferograms (motion-only) from 1–2 January 1997 (a), 12–13 March 1997 (b), 21–22 May 1997 (c), 8–9 October 1997 (d), 17–18 December 1997 (e) and 6–7 January 1999 (f). Coordinates of the corners: upper left, 64°32.42 N, 17°45.40′ W; upper right, 64°36.12′ N, 17° 14.80′ W; lower left, 64° 17.25 N, 17°35.02 W; lower right, 64° 20.91′ N, 17° 05.11′ W

The granular parts in the interferograms represent areas of phase decorrelation. Coherence is high throughout the interferograms of 1–2 January 1997 and 6–7 January 1999. For 21–22 May 1997, it is quite reasonable, except for the low elevations on the glaciers. On the other dates there was significant spatial variability. At the Gjálp depression and at Grímsvötn the coherence was suitable for interferometric analysis at all dates except 30–31 July 1997. On the latter dates the Grímsvötn area decorrelated completely, but fringes are visible in the centre of the Gjálp depression and at the Skaftá cauldrons. In three of the images (12–13 March 1997, 8–9 October 1997, 17–18 December 1997) the Gjálp area is located at a boundary between high and low coherence, probably due to differences in meteorological conditions (snowfall or snowdrift) between the eastern and western parts of the glacier.
Our DEMs in the Gjálp and Grímsvötn area are subject to uncertainty of the order of 5–20 m. If the DEM were completely accurate, the fringes in Figure 5 would correspond only to surface displacement in the direction of the radar beam (2.83 cm per fringe). For example, assuming an elevation error of 20 m, the motion error would be 1.32 cm d−1 for the January 1997 interferogram and only 0.24 cm d−1 for the May interferogram. This suggests that for the Gjálp and Grímsvötn area the uncertainties due to image noise (partial decorrelation) are larger than the errors due to the DEM. However, larger errors can be expected over the surging glaciers, where the DEM had not been updated since 1990.
The quality of the DEM can be checked in those parts of the glacier where the displacement in range is close to zero. This is the case at ice divides or in areas where the motion vector is oriented in the flight direction of the satellite, if there is no significant vertical component of motion. Clear indications of deviations of the DEM from the actual surface topography are features that are baseline-dependent. The most conspicuous feature in this respect is the closed-fringe pattern in the form of an arrowhead at the western slopes of Háabunga (Fig. 1; H in Fig. 4). Two to three closed fringes are revealed in the long-baseline interferograms of 1–2 January, 8–9 October and 17–18 December. If these fringes correspond only to topography, the actual surface would be about 100 m lower than in the DEM at the site of the biggest deviation. The closed fringes correspond to a trench about 5 km long, northwest of Háabunga, running from north-northwest to south-southeast. The southern part of the trench leads to a broad depression. The shape of the fringes shows some temporal variability, which might be an indication of slow motion. This lowering of the surface was caused by a surge of a western outlet glacier of the ice cap in the period 1994–95 (Tungnaárjökull), because the DEM in this part of Vatnajökull describes the pre-surge surface (i.e. 1990).
The motion field at the 1996 eruption site
The dominant feature in Figure 5 in terms of temporal change is the elongated depression at the Gjálp eruption site. The northernmost part of the depression formed a cauldron, but the southern part was an open canyon on the ice surface trending southwest–northeast. From January to December 1997, the magnitude of surface displacement decreased significantly as the depression filled in. The observed changes were fastest between January and March, and slowed down later (Fig. 6a). The maximum negative displacement (27 cm d−1 in January decreasing to 4 cm d−1 in December 1997) is observed about halfway between the bottom of the depression and the ice plateau on the western side. In January 1999, about the same area as in 1997 was still affected by the ice inflow, but the magnitude of the maximum displacement rate was only about 2 cm d−1. This is in good agreement with measured surface displacement of stakes in the area (Reference Gudmundsson, Högnadóttir, Björnsson, Pálsson and SigmundssonGudmundsson and others, 1999). The displacement in range can be described by superposition of a horizontal and vertical motion component, as discussed in the next section and shown later in Figure 8. The direction of horizontal motion is opposite at the eastern and western slopes, whereas subsidence occurs at an outer ring, and uplift in the centre. Because the subsidence dominates the phase shift in this ring, the sign of the phase changes on the eastern slope along the line where the phase shifts due to horizontal and vertical motion are of the same magnitude and of opposite sign.
Profiles of slant-range shifts across the centre of the northern cauldron of Gjálp in the look direction of the satellite (A–C; see Fig 2c). (a) Observations from unwrapped SAR interferograms on 1–2 January, 12–13 March, 21–22 May and 8–9 October 1997. Dashed lines represent low coherence. The modulo 2π ambiguity was removed by applying least-squares unwrapping with iterative error corrections (Reference SiegelSiegel, 1999). (b) Simulated ice flow on 13 March, 22 May and 9 October 1997.

Simulation of the motion field at the 1996 eruption site
The displacement fields at the eruption site derived from the interferometric analysis have been compared with model calculations of ice flow. Surface-parallel motion could not be assumed, because the surface topography changed due to filling of the ice depression. Model simulations were used to describe the horizontal and vertical motion components. For direct intercomparison with the interferometric displacements the model results were displayed in ground-range geometry, corrected for topographic distortion.
The ice flow on the central flowline AC (see Fig. 2c) across the circular northern cauldron of the elongated depression of Gjálp was simulated by an axisymmetrical ice-cap model, based on the steady-state mass-balance equation ∇ · q − a = 0, where ∇ is the two-dimensional plan-view divergence operator, q is the ice-transport vector due to internal ice deformation, and a is a spatially uniform net mass balance on the glacier surface. The ice-cap bed was assumed to be at a uniform horizontal elevation z = 0. Assuming the ice flux due to deformation is a function of local slope and ice thickness and ignoring horizontal-stress gradients the ice-transport vector can be written (following Reference MacAyealMacAyeal, 1997) as

where ρ = 910 km m−3 is the density of ice, g = 9.81 m s−2 is the gravitational acceleration, z s is the ice thickness and A 0 is the flow-law constant. By defining the non-dimensional parameters as z s → Zs and r → Lr, where L is the radius of the symmetrical cauldron and Z is chosen to satisfy

the non-dimensional cylindrical form of the mass-continuity equation can be written

The non-dimensional time-dependent form of the mass-continuity equation in cylindrical form can be written as

where the non-dimensional variable t is defined as t → Tt with T = 5L4[2A 0(ρg)3 Z 7]−1 = Za − 1.
A finite-difference method was used to calculate changes in the glacier surface with time. By using a staggered-grid numerical scheme and defining effective diffusivity as

the finite-difference expression of Equation (7) can be written as

with

where the surface elevation s is defined at N gridpoints i = 0, …, N–1 and at the discrete time nΔt. Δt is the time-step and Δr is the non-dimensional grid spacing. The boundary conditions are q = 0 at r = 0 and
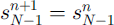 at r = 1, i.e. no ice transport at the ice-divide boundary and constant elevation at the outer border of the cauldron.
The surface profiles across the centre of the northern ice cauldron (ABC, Figs 2 and 7a) were surveyed by airborne radar altimetry on 3 January and surface DGPS on 10 June 1997. The glacier surface elevation was 1723–1585 m a.s.l. in January and 1723–1606 m in June. The depression is slightly asymmetrical because volcanic material melting ice was spread more westward than eastward from the subglacial eruption fissure (Reference Gudmundsson, Högnadóttir, Björnsson, Pálsson and SigmundssonGudmundsson and others, 1999), and because crevasses caused small-scale irregularities in the glacier surface in January. For the purpose of modelling ice flow toward such a depression, section AB (Fig. 7a) of the surface profile of 3 January 1997 was used to construct a symmetrical circular cauldron above a horizontal bed (Fig. 7b). The radius L = 4.1 km reached from the centre of the depression out to a distance where no change was observed in the surface elevation during the period January–June 1997. The elevation of the bed was estimated at 1030 m a.s.l. (Reference BjörnssonBjörnsson, 1988; Reference Björnsson, Pálsson and GudmundssonBjörnsson and others, 1992; unpublished data collected by the Science Institute, University of Iceland, 1999) and the annual net mass balance was taken as 1.5 m a−1 of ice (a realistic value for this elevation on Vatnajökull; Reference Björnsson, Pálsson, Gudmundsson and HaraldssonBjörnsson and others, 1998). This approximation of the depression was used as the initial condition in all model runs. We consider the assumption of a horizontal bed to be reasonable since the mountain that was piled up during the eruption rises only by 200 m over the 2 km closest to the centre.
Surface profiles across the northern cauldron of Gjálp (ABC in Fig 2c). (a) Radar altimetry survey on 3 January 1997 and DGPS survey on 10 June 1997. (b) Simulated June profile from a symmetrical depression of January where both parts were equal to AB, with A 0 = 2 × 10⁻¹⁷ Pa−3 a−1. The vertical scale is exaggerated 20 times with respect to the horizontal scale, and the vertical scale is broken.

The flow model could not satisfactorily simulate the deformation rates of 1–2 January 1997, and during the first 2 weeks of the runs the predicted deformation rates were rather unstable due to the irregularities of the initial surface profile. The model was used to predict the ice-surface profiles on 13 March, 22 May, 10 June and 9 October 1997, i.e. after runs for 69, 139, 158 and 278 days from 3 January, respectively. The best general fit between the observed and simulated data during the reduction of the depression was achieved with the ice-flow parameter A 0 = 2 × 10⁻¹⁷ Pa−3 a−1. This applies to the profiles across the depression (Fig. 7b), and the shape and amplitude of the deformation pattern (Fig. 6). Both vertical and horizontal deformation rates were simulated by the flow model (Fig. 8). Slant-range shift rates across the depression were predicted by the flow model and derived from interferograms of the tandem pairs of 12–13 March, 21–22 May and 8–9 October. The difference of about 500 m between the locations of the centre of the simulated and of the observed displacement field (Fig. 6) is due to the assumption of a symmetric cauldron in the model, whereas in reality the eastern slope was steeper and consequently shorter than the western slope (Fig. 7a).
Simulation of horizontal-, vertical- and slant-range shift of the depression in the cauldron of Figure 7b; 13 March (a), 22 May (b) and 9 October 1997 (c).

Finally, SAR interferograms were compared with simulated interferograms from the axisymmetrical model (Fig. 9). The model presents the two sets of enclosed loops in the fringes, where one set is tighter than the other, as observed in the SAR interferograms. The total numbers of fringes across the depression on both types of interferograms are nearly the same on 12–13 March (9–10), 21–22 May (6–7), and 8–9 October (3–4). The axisymmetric aspect of the model could be the simplification that makes some of the linear trend of the loops in the observations fail to show up in the model. The higher density of fringes observed in the centre of the depression is presumably due to high basal melting and cannot be described in this model.
Comparison of observed and simulated slant-range shift at the northern cauldron of Gjálp. SAR interferograms recorded 1213 March (a), 21–22 May (b) and 8–9 October 1997 (c). Simulated interferograms at 13 March (d) 22 May (e) and 9 October 1997 (f). The location of the profile ABC is the same as in Figure 2.

The value A 0 = 2 × 10⁻¹⁷ Pa−3 a−1, that gave the best correspondence between the surveyed and predicted profiles and the average flow velocity across the cauldron, is an order of magnitude lower than recommended for ice at the melting point (Reference PatersonPaterson, 1994), i.e. A 0 = 2.1 × 10⁻¹⁶ Pa−3 a−1. Our value for the flow parameter, however, is the same as the one that gave the best fit in modelling flow towards the eastern Skaftá cauldron in 1996 (Reference Jónsson, Adam and BjörnssonJónsson and others, 1998). A somewhat higher value of A 0 = 7 × 10⁻¹⁷ Pa−3 a−1 was recommended in a numerical modelling of flow towards the linear subsidence that was created at the dam of the Grímsvötn lake during the jökulhlaup of 1996 (Reference Aðalgeirsdóttir, Gudmundsson and BjörnssonAðalgeirsdóttir and others, 2000). They suggested that the lower value for the flow parameter might be due to the failure to include horizontal-stress gradients in the time evaluation of the depression. Simulation of a less stiff ice by our present model would better describe the lowering of the outer parts of the depression but predict a much faster infilling rate than observed at the inner part of the depression. Applying that value, A 0 = 7 × 10⁻¹⁷ Pa−3 a−1, the computed uplift across the profile from January to June 1997 would have been on average 9 m above the surveyed June profile, and 13 m for A 0 = 7 × 10⁻¹⁶ Pa−3 a−1. The slow infilling rate at the centre of the depression may, however, be due to continuous basal melting at the cooling volcano rather than stiffer ice. Our best fit for a stiff ice may therefore be an artifact of our simplified model, which includes neither gradients in horizontal stresses nor basal melting.
An average flux density of thermal energy of 190 W m−2, required to melt 9 m of ice from January to June 1997, might have been transmitted from the volcanic material piled up during the November 1996 eruption. The heat flow from the volcano was monitored by measuring the volume change of the depressions and the accumulation of melt-water in Grímsvötn. The thermal power declined from 70 GW just after the eruption to 10 GW after 4 months and 2–4 GW after a yea (Reference Gudmundsson, Högnadóttir, Björnsson, Pálsson and SigmundssonGudmundsson and others, 1999).
Surface displacement of the floating ice cover of Grímsvötn
The displacement of the ice cover of Grímsvötn can be studied in detail by using the six pairs of interferograms (Fig. 5). In addition to the wrapped interferograms in Figure 5, the interferograms were unwrapped by means of a least-squares method with iterative error correction (Reference SiegelSiegel, 1999). The horizontal components of the motion field are negligible and the vertical component was estimated at the centre of the ice cover from the unwrapped interferograms. The correspondence between the results obtained from the six pairs of interferograms and the observed changes in the lake level is good (Fig. 3). The shape of the moving ice cover for a given lake level is also as expected from our knowledge of the basal topography and the ice thickness (Reference BjörnssonBjörnsson, 1988). On 21–22 October 1996, the ice cover was rising by 30–50 cm d−1. On 1–2 January 1997, the ice cover subsided, and the depression was of elliptical shape, with a main axis 5 km long. In the centre of the ice cover the surface dropped 48 cm d−1. On 1213 March, the vertical displacement was very small, and the surface showed a complex deformation pattern of small depressions and uplifts. On 21–22 May, the shape of the deformation pattern was again approximately elliptical, the main axis was about 4.5 km, and an uplift of 22 cm d−1 was observed in the centre. In October and December 1997, the deformation pattern was more complex and the area affected was larger than in May. In some parts the fringes were smeared out due to decorrelation. On 8–9 October, there was a general uplift, with a maximum of 16 cm d−1 at the inner margin of the zone of maximum deformation, whereas the closed elliptical fringe represents an area of subsidence of up to 7 cm d−1 within the upward-moving ice cover (probably due to compressive forces at the grounding zone). On 17–18 December 1997, the ice cover showed a weak upward motion of about 8 cm d in the outer part, with downward bending of the central part up to 5 cm d−1, resulting in a total uplift of about 3 cm at the centre of the ice cover. This was 2 months before drainage of the lake (Fig. 3). In January 1999, about 4 weeks before a small jökulhlaup, the ice cover was rising by 6 cm d−1.
Spots of high heat flow and subglacier pathways of water flow
An area that was subject to significant temporal changes is a section about 5 km wide extending from the north to the east and south of Grímsvötn. Good coherence prevailed in this area in the image pairs of 1–2 January 1997, 8–9 October 1997 and 6–7 January 1999. The region revealed a complex pattern of fringes, mainly in the form of small spots, indicating uplift or subsidence of small depressions, possibly related to high geothermal-heat flow. The main feature to the east and southeast of Grímsvötn was the ice canyon of the water outbreak of November 1996 (Fig. 2h). In its southern part this canyon turned towards the west, leading to an area which showed a very complex small-scale fringe pattern, located to the south of Grímsvötn some distance down-glacier of the visible surface depression created by basal melting across the ice dam. This pattern suggests that the subglacial water outbreak followed a loop towards the west before turning south. The fringe pattern extends some kilometres further south than the visible trench in the glacier surface, and there it presumably reflects increased basal sliding due to lubrication by water.
Infilling of the Skaftá cauldrons
The Skaftá cauldrons and their surroundings are another area that was subject to significant surface deformation (Fig. 5). In the interferograms the topographic phase was eliminated based on the digital elevation data of June 1997. This may result in some errors of the calculated displacement rates, because the surface topography changes in time due to inflow and outbreaks of water. Taking into account the possible errors of surface height and the altitude of ambiguity, the maximum error would be one to two fringes depending on the baseline (Table 1).
The sequence in Figure 5 shows the filling of both Skaftá cauldrons. According to the shape of the fringes it can be assumed for the western Skaftá cauldron that vertical motion clearly dominated over horizontal motion. The interferometric analysis shows that the uplift in the centre of the western Skaftá cauldron decreased from 20 cm d−1 to 10 cm d from January to May but had increased to 25 cm d−1 in October, 6 weeks after a jökulhlaup on 24–25 August. In January 1999, the diameter of the rising surface was smaller than in 1997. The eastern Skaftá cauldron showed a more complex behaviour than the western cauldron. In the interferograms from January to July 1997 and from January 1999, the displacement rates were small, but in October and December 1997 the fringes revealed a dipole-like pattern. In the western centre of the dipole the displacement was directed away from the radar, whereas the eastern part was displaced towards the radar. This indicates closure of the cauldron similar to that of the Gjálp depression but at a smaller scale. Taking into account, however, that the horizontal motion should be zero in the centre of the depression, the analyses reveal an uplift of the eastern Skaftá cauldron decreasing from about 5 cm d to 2 cm d−1 from 1–2 January to 21–22 May 1997, and increasing to 25 cm d−1 on 8–9 October, 7 weeks after a jökulhlaup on 15–19 August 1997. The correspondence with available estimates of the rising of the centres of the cauldrons supports the estimates derived from the interferometric analysis (Fig. 3).
There were also some temporary features in the region of the Skaftá cauldrons. On 30–31 July 1997, a circular fringe pattern with a diameter of 3 km appeared 4 km to the southwest of the western Skaftá cauldron. In the centre the surface displacement in range was 22 cm d−1 towards the radar. This was 3 weeks before the drainage of the cauldron, suggesting that water had penetrated under the ice dam and affected the ice flow. About 4 km north of the western Skaftá cauldron, a dumbell-shaped fringe pattern is visible in the interferograms from 8–9 October (Fig. 5d), showing weak displacement away from the radar, probably due to lowering of the surface. This may reflect geothermal activity melting ice at the glacier base.
Conclusions
SAR interferometric analysis, combined with elevation data that separate changes in surface topography, is shown to be a powerful tool for locating and quantifying glacier-surface displacements caused by geothermal and volcanic activity beneath Vatnajökull during the period 1996–99.
Ice-flow rates were described during the infilling of the surface depressions created by the 1996 eruption site of western Vatnajökull. A simple flow model served well to confirm the basic interpretation of the interferograms, i.e. the infilling of the surface depressions and the spatial and temporal pattern of the displacement field. The maximum displacement rate away from the radar decreased from 27 cm d−1 to 2 cm d−1 over the period January 1997–January 1999. The best overall agreement between the observations and the flow model was obtained for stiffer ice than generally recommended for temperate glaciers, i.e. ice-flow parameter A 0 = 2 × 10⁻¹⁷ Pa−3 a−1. Calculations with a softer ice (A 0 = 2 × 10⁻¹⁷ Pa−3 a−1) gave a faster filling rate of the inner part of the depression than observed. The slow uplift at the centre of the depression may, however, be due to removal of ice by basal melting at the cooling volcano rather than slow inflow of ice. Improved flow models could include horizontal-stress gradients in the time evolution of the depression and basal melting.
Information was obtained about the size of the floating ice cover on subglacier lakes, and the rates of vertical displacements. The vertical displacements derived from the interferometric data are confirmed by field observations; an uplift rate of 50 cm d−1 to sinking of 48 cm d for Grímsvötn and an uplift rate of 2–25 cm d−1 for the two Skaftá cauldrons. A negligible uplift rate was observed immediately prior to the onset of jökulhlaups. At high lake levels a complex deformation pattern of the ice shelf was observed due to bending. The interferograms indicate that vertical motion dominated over horizontal motion in the western Skaftá cauldron, but a dipole-like pattern of the eastern Skaftá cauldron is similar to that of the northernmost cauldron of the 1996 Gjálp eruption site.
Temporal changes seen in the time series of interferograms reveal spots of uplift and subsidence that may be related to localized increase in geothermal activity due to altering volcanic activity (east of the Grímsvötn caldera and north of western Skaftá cauldron).
The glacier surface subsided above the main conduits that drained meltwater from the 1996 Gjálp eruption site toward Grímsvötn, and the November jökulhlaup from Grímsvötn. Therefore, the subglacier pathways of the melt-water were displayed on the SAR interferograms. In other areas the SAR interferometric analysis detected increased basal sliding due to lubrication by water.
Acknowledgements
ERS-1/-2 SAR data were made available by the European Space Agency for project AO2-D116 (principal investigator U. Munzer). The work was supported by the Icelandic Science Fund (grant 990470099), the Public Roads Administration of Iceland, the National Power Company of Iceland, and the Austrian Academy of Sciences (International Decade for Natural Disaster Reduction programmes). Part of the fieldwork on Vatnajökull was done by volunteers of the Iceland Glaciological Society. We are indebted to F. Pálsson for assistance with finding information from our database of Vatnajökull and to Þ. Högnadóttir for work on the DEMs.



