Introduction
In this study, I explain disposable (net) income inequality by examining its two components: wage distribution and the extent of redistribution.Footnote 1 The power resources theory and the median voter (Meltzer–Richard) hypothesis are incorporated under a single framework with the focus on the dynamics of party competition. While both are significant theories in the literature, they are seldom tested alongside each other. I argue that the two theories overlap and are causally related. Tests on the Meltzer–Richard model have focused on the direct effect on redistribution, but it is seldom noted that the position of the median voter can also affect leftist electoral performance, which in turn affects redistribution. The direct and indirect effect of the median voter cannot be accurately estimated without simultaneously taking power resources into consideration, and vice versa.
There is nothing new about studying the various stages of inequality formation (wage inequality, redistribution) using the Meltzer–Richard model or the power resources theory. The superiority of one theory over the other has been often debated (e.g. Huber and Stephens, Reference Huber and Stephens2012: 35–37). What I demonstrate is that the two theories can be accommodated under a single causal framework while keeping their respective arguments intact.Footnote 2 The resulting model will be able to compare theoretical predictions with empirical patterns, and establish that both theories are equally significant in explaining inequality formation. Another notable contribution of this study is the use of data on the distance between median and mean income derived from the Luxembourg Income Study (LIS). This contrasts with most of the literature, where conventional measures of inequality are used (e.g. the 90–10 ratio, detailed in the Discussion section) as proxies for the mean–median ratio (MMR) to test the median voter hypothesis. This study provides a more direct test of the model with a measure that reflects its core concept.
This study also contributes to the debate on the democratic effects on income inequality. Despite the belief that democracy should reduce inequality, recent studies tend to find no supporting evidence (e.g. Timmons, Reference Timmons2010). In a popular conception, democracy can be characterized in terms of contestation and inclusiveness (Dahl, Reference Dahl1971), or political rights and civil liberties (e.g. the Freedom House). The political right to elect leaders, with a degree of contestation, provides the background to the median voter hypothesis, while the freedom of association that democracy provides enables workers to accumulate power resources (Schumpeter, Reference Schumpeter1942), and the inclusiveness of a regime further grants the disadvantaged political representation. The median voter hypothesis and the power resources theory have been identified as key pathways through which democracy reduces inequality (Timmons, Reference Timmons2010). Although the current research focuses exclusively on advanced democracies, an incorporation of both theories helps us better understand the process of democratic redistribution, and sheds light on the wider relationship between democracy and inequality.
The remainder of the paper is organized as follows. In the next section, I review the literature, including previous attempts to connect the theories. I then introduce the suggested framework and hypotheses, followed by a discussion of the research design. After presenting empirical results to support the model, the research is concluded by a discussion on the findings and their implications, and how my results contribute to the literature.
Median voter hypothesis (Meltzer–Richard model)
Following the tradition of Downsian spatial models, Meltzer and Richard (Reference Meltzer and Richard1981, Reference Meltzer and Richard1983; see also Romer, Reference Romer1975) developed what has become one of the most influential public choice models of redistribution. They argue that as the median income is always less than the mean income of the population, the median voter votes for a tax rate that redistributes wealth from the rich to the poor. The degree of redistribution is then a function of the difference between the two income levels. According to Kelly and Enns (Reference Kelly and Enns2010), the core of the model is how inequality influences public preferences for redistribution.
Despite its simplicity and elegance, evidence for this model is not consistent (for a review see Borck, Reference Borck2007). The first direct test of the theory using previously unavailable (pre-fisc/pre-tax and transfers) data by Milanovic (Reference Milanovic2000) found that the individual with median income is rarely a net beneficiary in tax and transfers systems in Organisation for Economic Cooperation and Development (OECD) countries, although the relationship between pre-government inequality and size of redistribution is confirmed (see also Kenworthy and Pontusson, Reference Kenworthy and Pontusson2005; Mahler, Reference Mahler2008). However, even this latter interpretation of the theory is contested: studies often find less redistribution in more unequal countries, resulting in the ‘Robin-Hood paradox’ (Moene and Wallerstein, Reference Moene and Wallerstein2001; Lindert, 2004). Kelly and Enns (Reference Kelly and Enns2010) provide evidence suggesting that support for redistribution does decrease with inequality, contrary to what the Meltzer–Richard model predicts. Similarly, Barnes (Reference Barnes2013) also finds no relation between inequality or the characteristics of the median voter and redistribution among states in the United States.
To explain the anomaly, some underlying assumptions of the model are revisited. A problem of the hypothesis and of spatial models in general is their applicability in multiparty systems. The direct translation of voter preference into policy is also assumed, or that parties converge on the preferences of the median voter. In reality, policy is heavily mediated by political institutions, such as electoral systems and party representation (Iversen and Soskice, Reference Iversen and Soskice2006). The model also holds the critical premise of a level playing field in politics. Mueller (Reference Mueller2003: 515) challenges the assumption that all redistribution is from the rich to the poor, which is not supported by his data; in some cases the rich actually receive more. Ross (Reference Ross2006: 870) sees this as an attempt by governments to ‘channel benefits to the constituents they wish to favor.’ The unrealistic assumption in the Meltzer–Richard model that all citizens have equal amounts of power is abandoned in the power resources perspective, as the following section discusses.
Power resources theory
Unlike pluralist accounts of democracy, power resources theory begins with the assumption that political power is unevenly distributed in favor of capital and wealth (Stephens, Reference Stephens1979; Korpi, Reference Korpi1983; Huber and Stephens, Reference Huber and Stephens2001; Brady, Reference Brady2009).Footnote 3 Based on a class-analytical perspective, the strength of the working class is recognized as a crucial factor in this theoretical tradition, as reflected by unions and left-wing parties, (Przeworski, Reference Przeworski1985; Hicks, Reference Hicks1999). For the purpose of this study, there are two channels through which power resources could achieve a more egalitarian distributive outcome. On the one hand, the distribution of wages in the market may be affected by market regulations and labor protections, leading to a narrower wage gap; on the other hand, the extent of redistribution could be increased, determining the level of disposable income inequality (Bradley et al., Reference Bradley, Huber, Moller, Nielsen and Stephens2003).
For practical reasons, most empirical studies focus on union strength and partisanship, such as those of Cameron (Reference Cameron1978) and Stephens (Reference Stephens1979), who reported the effect of left party strength on welfare spending. Despite the challenge by Pierson (Reference Pierson1996) and others, who dismiss the importance of partisan ideology in the era of welfare state retrenchment, power resources theory proves to be resilient (except, partially, Huber and Stephens, Reference Huber and Stephens2001). Hicks (Reference Hicks1999), Brady (Reference Brady2009), and Pontusson and Rueda (Reference Pontusson, Rueda and Way2010), among others, show that partisan politics remains a significant factor during welfare retrenchment and is still relevant today.
Power resources have an intimate relationship with corporatism, which is the pattern of tripartite bargaining at a peak level among labor, state, and business (e.g. Korpi, Reference Korpi1983). The effect of corporatism on income distribution has been thought to be similar to that of power resources: with a high level of coordination between capital and labor, wage levels across the economy are compressed, leading to a lower level of inequality. Power resources and corporatism have been viewed as complementary (e.g. Garrett, Reference Garrett1998). Beramendi and Cusack (Reference Beramendi and Cusack2009) go as far as to argue that in the absence of wage bargaining coordination, left parties are not associated with a more equal income distribution. This is contested by Rueda (Reference Rueda2008), who finds a high level of corporatism to be an effective wage compressing mechanism in its own right, thus constraining the corresponding effect of leftist policy and partisanship (see also Hicks, Reference Hicks1999; Pontusson et al., Reference Pontusson and Rueda2002). To properly account for the various dimensions of the theory, in the analysis below, left parties, unions, and the level of corporatism are considered as indicators of power resources.Footnote 4 My results also contribute to the debate regarding the relationship between corporatism and left parties.
Bridging the two theories
From the review above, it is evident that the two theories were developed independently, and can even be regarded as diametrically opposed (Kwon and Pontusson, Reference Kwon and Pontusson2010). Huber and Stephens (Reference Huber and Stephens2012) conclude by making opposite predictions regarding inequality and redistribution. In the Meltzer–Richard framework, a greater ‘inequality,’ that is, the distance between the median and mean income, leads the median voter to favor a greater degree of redistribution. Power resources theory, however, predicts a very different outcome: strong unions and left parties simultaneously result in lower ‘inequality’ and more redistribution (Huber and Stephens, Reference Huber and Stephens2012: 35).
This contrast stems from the conception of inequality, which once broken down into market distribution, redistribution, and net inequality, enables the two theories to be reconciled. Theoretically, they are not necessarily mutually exclusive: parties can be both office- and policy-seeking (Wittman, Reference Wittman1983; Kwon and Pontusson, Reference Kwon and Pontusson2010). Parties are capable of winning elections by embracing the position of the median voter, while also protecting the interest of their core constituencies. Both theories originate from the simple left-right conception of politics. As Brady (Reference Brady2009: 98) points out, ‘underlying power resources theory is a materialist interest-based rational choice explanation’ (Korpi, Reference Korpi1985). Workers and the poor act in accordance with their rational economic interests, not unlike the assumption about voters made in the median voter hypothesis.
My suggested model emphasizes the element of electoral competition. Despite the support for the power resources theory, some argue that the strength of the working class per se does not explain much of welfare development, and the more critical issue might actually be whether the middle class is willing to form a political coalition with the working class (Esping-Andersen, Reference Esping-Andersen1990). For example, redistribution depends on whether the middle class joins forces with the rich or the poor, and the choice is influenced by the electoral system (Iversen and Soskice, Reference Iversen and Soskice2006). Thus, whether the middle class (and the voter with median income) votes for a left party, or not, carries important implications for welfare, which provides another rationale for bringing the median voter together with the power resources theory.
There are previous attempts to use voter turnout to bridge the two theories, as it better translates the distribution of income of the entire population into that of voters. Kenworthy and Pontusson (Reference Kenworthy and Pontusson2005) use voter turnout as an issue on which the two theories converge (see also Mahler, Reference Mahler2008), but otherwise do not take partisanship into account. Korpi (Reference Korpi1983) argues that turnout captures the capacity of unions and parties to mobilize, while Pontusson and Rueda (Reference Pontusson, Rueda and Way2010) argue that parties of the left respond to higher inequality under high voter turnout. Taking voter turnout into account is also found to restore the explanatory power of Downsian models of redistribution (Larcinese, Reference Larcinese2007). However, accounting for voter turnout is quite far from addressing the core arguments of the respective theories, let alone incorporating them into a coherent framework.
Theoretical arguments
One of the critical assumptions of the median voter model is a majoritarian two party system. Applying a simple spatial model may not be appropriate in multiparty systems, and empirical evidence for simple spatial models is inconclusive (e.g. Borck, Reference Borck2007). To enhance the underlying model, Adams et al. (Reference Adams, Merrill and Grofman2005) posited a ‘unified model of political competition’ incorporating behavioral voting factors (i.e. non-policy motivations) and spatial party competition. Party identification is considered as a factor. In a sense, power resources theory also implies that party identification and issue valence matter for voters and supporters. By focusing on this extension, I argue that power resources and the median voter are both important factors in accounting for the policy-making process, thus affecting redistribution and income inequality. One reason to focus on left parties, apart from following the power resources tradition, is that they are less responsive to public opinion than their center and right counterparts (e.g. Adams et al., Reference Adams, Haupt and Stoll2009).
Extending policy-only probabilistic voting models (Enelow and Hinich, Reference Enelow and Hinich1984; Lin et al., Reference Lin, Enelow and Dorussen1999) and models of voting behavior (e.g. Markus and Converse, Reference Markus and Converse1979), Adams et al. (Reference Adams, Merrill and Grofman2005) suggest that voting is partly based on policy preferences and partly on party identification or loyalty, which is a source of uncertainty for parties. Assuming that voters’ partisanship correlate with policy preferences (an assumption supported by the authors, see Adams et al., 2005: 46ff), in equilibrium, vote-maximizing parties are motivated to appeal on policy grounds to voters who are attracted to them for non-policy reasons (e.g. party identification, loyalty; Weissberg, Reference Weissberg1978; Dalton, Reference Dalton1985). The intuition is that if, for example, a left party converges too closely toward the center (and the median), its platform becomes too similar to the center party and voters are then influenced by partisanship, not policy preferences. Thus, the left party would not actually gain votes from the center party by shifting to the right. Adapting this to a three-party (left, center, right) competition model, parties are expected to diverge from the overall median toward their core support, in particular the median member of their group of identifiers. As a result, the left party is expected to move leftwards, and vice versa for the right party. This intuition is supported by simulated game equilibria (Adams et al., Reference Adams, Merrill and Grofman2005: 40–44).
Empirically, Ezrow et al. (Reference Ezrow, De Vries, Steenbergen and Edwards2010) find that political parties respond to shifts in the mean voter position, perhaps more so than their core constituency (with the exception of niche parties). While this is not incompatible with Adams et al. (Reference Adams, Merrill and Grofman2005),Footnote 5 by combining the two perspectives, it is suggested that policies are affected by two important indicators: the position of the median voter and the level of power resources. Here, the median voter position captures the general shift in public opinion (the tendencies of parties to move toward the center; Kitschelt, Reference Kitschelt1997) and the center of political gravity (thus the position from which parties diverge). Power resources not only capture the organizational power of the working class and the strength of left parties, but also the strength of party identification among its supporters (e.g. union membership is a strong predictor of party support; Andersen et al., Reference Andersen, Tilley and Heath2005). In our model, this measures the position of the median supporter of the left party, and critically, the extent to which left parties are willing to diverge from the preference of the median voter and pursue policies with a higher redistributive effect (Adams et al., Reference Adams, Merrill and Grofman2005).
From the literature review above, one of the key assumptions of the median voter model – inequality increasing the support for redistribution – does not appear to be supported by recent empirical studies (Kelly and Enns, Reference Kelly and Enns2010). My model potentially offers an explanation as to why the median voter model might still be useful in spite of this. An increasingly biased wage distribution changes political dynamics, increasing left support (power resources) and shifting the center of gravity (median voter) even though their redistributive preferences do not change in the hypothesized direction. The median voter perspective can thus be viewed as being strengthened by bringing in elements from the power resources theory.
Empirically, when the size of the group identifying with the left party is larger (captured by power resources), the party is more likely to respond to inequality once in office, as the policy preference of its median supporter must be to the left of the overall median. More importantly, it gains more support by appealing to them. If the size of the left supporter group is smaller, the influence of the median is relatively stronger, resulting in the party in office being less active in pursuing redistribution (although the median voter still prefers some redistribution).
The framework suggested here is based on a three-party competition model. Although this type of model is commonplace in the literature (e.g. Iversen and Soskice, Reference Iversen and Soskice2006), it can again be argued that the validity of models with a spatial dimension may be conditional on the electoral/party system. As a precautionary measure, the effective number of parliamentary parties (ENPP) is included in the analysis below as a control.
Toward a composite model of inequality
This section formulates several hypotheses for testing. The crux of my theoretical argument is that redistribution is jointly affected by two factors: the position of the median voter and the strength of the left party. Party competition results in greater redistribution than that demanded by the median voter, to the extent that the left party is strong. In addition, the left party can also affect the distribution of market wages by the coordination of wage bargaining and by the regulation of labor markets (such as a minimum wage legislation). Following the same logic, this effect is also conditional on the position of the median voter.
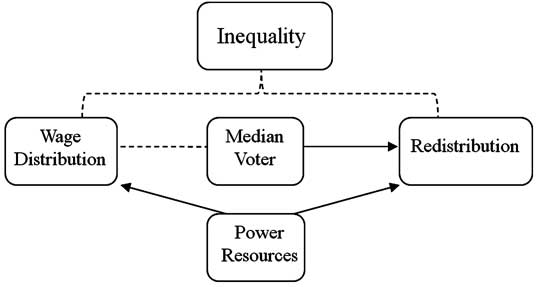
To highlight the difficulty in creating such a model, a basic attempt to bridge the two theories is shown in Figure 1. It attempts to straightforwardly incorporate their core arguments: power resources affect wage distribution and redistribution and distribution inequality determines the position of the median voter, which in turn affects the size of redistribution. However, a major flaw in this combination of the theories is that leftist political parties come to power precisely through elections, the results of which are supposed to be determined, or at least heavily influenced, by the median voter. Intuitive though it seems, the literature does not provide a clear answer to whether a leftward movement by the median voter (or a greater wage disparity) leads to more votes for left parties. An exception is Rodriguez (Reference Rodriguez1999), who finds no such evidence in the United States.
A problematic attempt to link the two theories. Solid lines represent causal effects. Dotted ones represent deterministic relationships.

The simple model in Figure 1 is not sufficient to bridge this gap. The argument is circular, as (i) the median voter is determined by initial market distribution, and affects redistribution either directly or through leftist representation; and at the same time, (ii) leftist parties also push for distribution equality, potentially changing the position of the median voter (i.e. D→MV→PR→D in Figure 1). Hence, a temporal dimension is required to accommodate these restrictions.
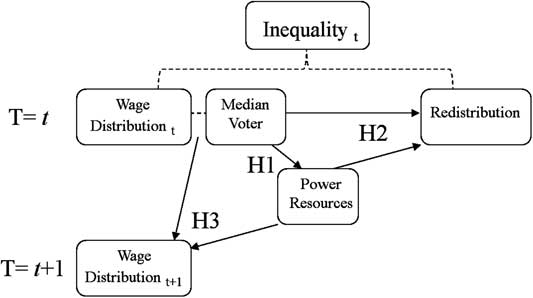
My proposed model is shown in Figure 2. It explains inequality by breaking the process down into stages of redistribution with a dynamic component. At the start of the cycle, the labor market (controlling for policies from the previous government and other factors; see Hypothesis 3 below) generates a given income distribution, which determines the position of the median voter. She then determines the proportion of votes left parties get (Hypothesis 1) and/or directly affects the level of redistribution (Hypothesis 2). Power resources (left parties, unions, etc.) in turn also affect redistribution (Hypothesis 2). The initial wage distribution and level of redistribution combine to generate the final (disposable) inequality level for that period. Turning to the temporal dimension of the model, by implementing labor market policies in the current period, governments (left-leaning or otherwise) have the potential to influence the distribution of wages (i.e. market inequality) at the start of the next period, completing the cycle by determining the position of the future median voter (Hypothesis 3). Incidentally, following the theoretical arguments above, this is equivalent to the testing of power resources variables with the inclusion of a lagged dependent variable (position of the median voter of the current period). To provide empirical support for the model, the following hypotheses are tested:Footnote 6
Hypothesis 1 The distance between the mean and median income increases the vote share obtained by left parties.
Hypothesis 2 The distance between the mean and median income and greater power resources increase the extent of redistribution.
Hypothesis 3 An increase in power resources in period t decreases the distance between the mean and median income at t+1, controlling for the distance between the mean and median income at t.
A composite model of inequality. Solid lines represent causal effects. Dotted ones represent deterministic relationships.

Research design
A time-series cross-sectional design is used with country-year as the unit of analysis. I include 18 OECD countries commonly seen in welfare state studies (the list of countries is given in the Supplementary Appendix). Subject to data availability, I include observations from 1970 to 2009. All models are run with the Prais–Winsten AR(1) estimation with panel-corrected standard errors.Footnote 7 Country dummies are included to remove any unit heterogeneity, the effects of unobserved background factors, and relatively static political institutions. Time (year) dummies can control for transnational influences such as international economic cycles. Both sets of fixed effects are included in all regressions below, and can robustly test any hypothesis. However, the results identified are thus primarily based on within-country variations (with unit fixed effects). Next, the variables used in the analysis are introduced below, but due to space limitations, descriptive statistics and a range of robustness tests are given in the Supplementary Appendix. Unless otherwise stated, all data used are taken from the electronic dataset provided by the OECD (2014).
Power resources
As noted, the political strength of the left is a major power resource. The left party votes and parliamentary seat shares from Swank (Reference Swank2013) are used.Footnote 8 The vote share obtained by left parties as a percentage of total votes cast is the dependent variable in Hypothesis 1, and the left party share of legislature seats is used to capture left party strength in Hypotheses 2 and 3. This is intended to bypass the potential problem of a disproportionate vote-seat ratio introduced by electoral systems. Following the original coding, the values are assumed to be unchanged until the next election (except in the case of by-elections that lead to a change in seat share).
The use of left seat share instead of cabinet share, which is the usual practice, requires some justification. I argue that seat share is a more accurate indicator of the strength of left parties, particularly its variation. For example, while Britain’s left cabinet share remained unchanged at 100 from 1998–2009, the seat share of the Labour Party gradually fell below 60. In cases such as this, even if left parties are still in power, I argue that the drop in their political capacity and public support is better reflected by the seat share. After all, the power resources theory (at least narrowly in some interpretations) pertains to the strength of leftist parties, and we are able to distinguish between comfortably formed majority and minority governments. Second, as I attempt to incorporate the two theories, the causal link between the median voter and the seat share (in addition to vote share) is more direct than cabinet composition, which may be less sensitive to a change in the median voter position.
Union density is another key indicator of the power resources approach and signifies the strength of worker organization and its effectiveness in determining wage and redistributive levels. It is measured as net union membership, as a proportion of wage earners in employment (Visser, Reference Visser2011). As a power resource, it is expected to have a positive effect on redistribution.
Following Beramendi and Cusack (Reference Beramendi and Cusack2009), the level of wage coordination is used as the measure of corporatism in this study. Based on Kenworthy (Reference Kenworthy2001), it is captured using a five-point index of wage bargaining coordination, ranging from fragmented, company-level (1), to economy-wide bargaining (5). Here I use the updated series from Visser (Reference Visser2011). While Wallerstein (Reference Wallerstein1999) regards corporatism as the most important determinant of wage dispersion, it also strongly conditions the effect of left parties (Rueda, Reference Rueda2008; Beramendi and Cusack, Reference Beramendi and Cusack2009). To test the conditional effect, an interaction term between left party seat share and corporatism is also included.
Median voter: MMR of income
The commonly used Kim and Fording (Reference Kim and Fording1998, Reference Kim and Fording2003) measure derived from electoral results and manifesto coding is not suitable for capturing the position of the median voter in this study, as electoral result is also one of the dependent variables to be explained. I instead directly measure the MMR of income with micro-data from the Luxembourg Income Study (LIS) (2015). This is the MMR of household factor income adjusted for the household size with an equivalence scale. Gaps between LIS surveys are linearly interpolated, which is justifiable as individual earnings, and thus the MMR, should be a slow-changing series.Footnote 9 MMR is used as an independent variable in Hypotheses 1 and 2, and the dependent variable in Hypothesis 3 with a three-year lead, to allow time for political factors to exert an effect on the structure of wages.Footnote 10
Redistribution
Most indicators of redistribution capture the amount of welfare input, such as the size of social spending. However, they are limited by how the resources are spent and the progressiveness of the system. This is problematic, as it fails to account for changes in societal welfare needs (Clayton and Pontusson, Reference Clayton and Pontusson1998). In this research, I measure redistribution by its direct outcome. Using LIS data, Mahler and Jesuit (Reference Mahler and Jesuit2008) provide the degree of relative (proportional) redistribution by comparing the level of inequality reduction (in terms of the Gini coefficient) before and after tax and transfers. A higher figure represents a greater reduction of inequality, that is, more redistribution. The interpolated series is used here as the dependent variable in Hypothesis 2.
Common controls for Hypotheses 1, 2, and 3
Government expenditure: I use data on government expenditure as a share of gross domestic product (GDP) from the World Development Indicators (World Bank, 2014). This variable reflects the size of the public sector and may affect the support of left parties. The amount of government spending is an obvious, albeit rough, determinant of redistribution.
Economic development: GDP per capita is used to capture the level of development in a country. According to the logic of industrialization (e.g. Wilensky, Reference Wilensky1975), a wealthier country tends to redistribute more, and, as a number of variables are operationalized with reference to GDP, this can account for fluctuations in those series due to changes in the broader economic environment.
Unemployment: Standardized unemployment rate is another important factor of wage and redistribution in the form of unemployment benefits. Welfare generosity may increase due to a greater need (higher unemployment). It also captures the efficacy of labor, the main power resource (Korpi, Reference Korpi1985), which may influence the electoral fortunes of left parties.
ENPP: As discussed in the theoretical section, the validity of spatial models can depend on the underlying party system. The effective number of parties at the parliamentary level (ENPP) (Laakso and Taagepera, Reference Laakso and Taagepera1979; data from Gallagher, Reference Gallagher2010 is used), is included as a control in the testing all of the hypotheses. The measure is lagged by 1 year in tests for Hypothesis 1 as ENPP is supposedly determined after the election.
Other controls
Economic growth (Hypotheses 2 and 3): Wage distribution and the level of redistribution are expected to be affected by economic growth (in GDP). As GDP per capita is included in the models, so this variable should capture short-term economic fluctuations. Government policies may also change due to economic shocks (e.g. an increase in the unemployed population) rather than an actual change in policy (Rueda, Reference Rueda2008; Lupu and Pontusson, Reference Lupu and Pontusson2011). Although it may plausibly affect the electoral performances of left parties (Hypothesis 1), its inclusion does not change the results and is thus dropped from the estimations.
Voter turnout (Hypotheses 1 and 2): The role of voter turnout in linking the two main theories is reviewed and as poorer citizens are disproportionally less likely to vote (Lijphart, Reference Lijphart1997), the income distribution of voters should be more skewed than that of the population. Taking turnout into consideration can more realistically translate the income distribution of the population into that of the voters’ (Mahler, Reference Mahler2008). Data on legislative elections from the International Institute for Democracy and Electoral Assistance (2011) are used and it is assumed that the values remain the same until the next election.
Manufacturing employment (Hypotheses 1 and 3): Manufacturing employment as a share of total employment measures the size of the working class, the core supporters of left parties. It is included in tests of Hypothesis 1 to control for any change in the underlying economic structure independent of political dynamics (e.g. union strength). In tests of Hypothesis 3, it can help in explaining the formation of the wage pattern in the market, and the effects of deindustrialization as workers lose their jobs in this sector and resort to a low-wage service sector (Esping-Andersen, Reference Esping-Andersen1990).
Debt (Hypothesis 2): Total central government debt as a percentage of GDP reflects the capacity of the government to intervene in the market as indebted governments are more constrained in their redistributive efforts and have fewer resources at their disposal (Rueda, Reference Rueda2008).
Old-age population (Hypothesis 2): The proportion of the old-age population (over 65) is expected to increase the extent of redistribution, as it captures the demand side in the form of old-age benefits and pensions.
Female labor participation (Hypothesis 3): Female labor participation rate as a percentage of total employment is inserted in Hypothesis 3. A higher rate of female participation usually means higher income disparity, due to wage discrimination and an increase in the supply of less-skilled labor, but countervailing forces may be present here (Pontusson et al., Reference Pontusson and Rueda2002; Huber and Stephens, Reference Huber and Stephens2012).
Results
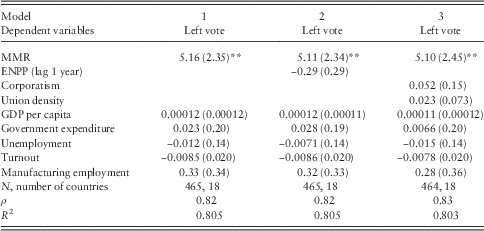
The results largely support the hypotheses outlined above. Table 1 shows the positive association between the median voter and leftist election success. A larger MMR of income, that is, a greater distance between the mean and median income, leads to a greater vote share for left parties. MMR is positive and significant at the 5% level. The result is robust to the inclusion of the ENPP in model 2, and after controlling for other indicators of power resources (union density and corporatism) in model 3. The magnitude and level of significance of MMR persist in all models. This provides a strong confirmation of Hypothesis 1. While the insignificance of every variable except MMR in all specifications could be a source of concern, it can be attributed to changes in the effects of explanatory variables over time. A detailed discussion is given in the Supplementary Appendix.
Effect of median voter on left vote shares (Hypothesis 1)

Dependent variable is vote share obtained by left parties. Parameters are estimated by the Prais–Winsten estimator with panel-corrected standard error in parentheses. The common AR(1) parameter is denoted by ρ. Country fixed effects, year fixed effects (1970–2009) and constant terms are included in all models.
MMR=mean–median ratio; ENPP=effective number of parliamentary parties; GDP=gross domestic product.
***P<0.01, **P<0.05, *P<0.1.
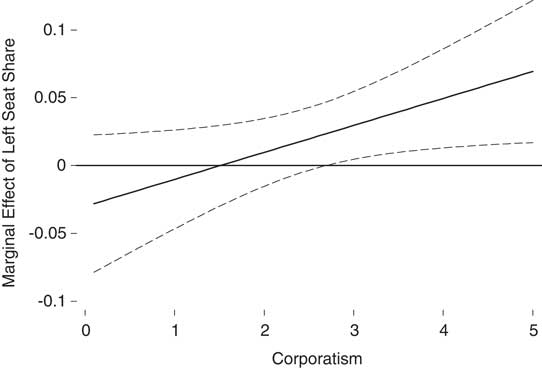
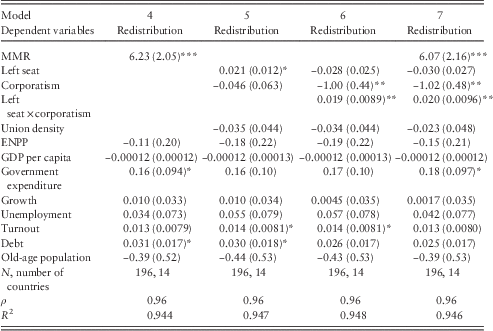
The results for Hypothesis 2 are given in Table 2.Footnote 11 The predictions of the median voter model are confirmed. Following Meltzer and Richard (Reference Meltzer and Richard1981), greater income disparity leads to more redistribution. MMR is positive and highly significant at the 1% level in model 4, and remains so when tested alongside power resources variables in model 7. The power resources side of the argument is less clear-cut in this regard. In model 5, out of the three power resources measures, only the share of left party seats is positive and marginally significant. As discussed above, corporatism may either constrain or facilitate the effect of left partisanship (Rueda, Reference Rueda2008; Beramendi and Cusack, Reference Beramendi and Cusack2009). An interaction term between share of left seats and corporatism is thus inserted in model 6, and corporatism then becomes significant alongside the interaction term. Brambor et al. (Reference Brambor, Clark and Golder2006) advise that levels of significance should not be the primary concern in the interpretation of interaction models. A graph of the marginal effect of left seats on redistribution is presented in Figure 3 based on the estimates from model 6. The solid line represents the marginal effect while the broken lines show the 95% confidence intervals. An effect is statistically significant at the 5% level when the boundaries do not touch the horizontal axis. An increase in left party seat share significantly increases redistribution when corporatism is high (>3). The redistributive efforts of left parties are thus most effective only when there is a high level of coordination within the economy. Last, variables for power resources and MMR are tested together in model 7. The magnitude and significance of all variables remain largely unchanged, and the joint significance of the two major theories in determining redistribution is demonstrated. Hypothesis 2 can then be confirmed with the condition that the effect of left partisanship depends on corporatism.Footnote 12
Marginal effect of left seat share on redistribution. Graph of marginal effect of share of left party seats on redistribution as corporatism changes. The broken lines represent the 95% confidence interval for two-tailed tests. Plotted with the coefficient matrix and the variance–covariance matrix of model 6. See Brambor et al. (Reference Brambor, Clark and Golder2006) for a description of the methods and the computer code used to generate the graph.

Effects of median voter and power resources on redistribution (Hypothesis 2)

Dependent variable is redistribution. Parameters are estimated by the Prais–Winsten estimator with panel-corrected standard error in parentheses. The common AR(1) parameter is denoted by ρ. Country fixed effects, year fixed effects (1980–2004) and constant terms are included in all models. MMR=mean–median ratio; ENPP=effective number of parliamentary parties; GDP=gross domestic product.
***P<0.01, **P<0.05, *P<0.1.
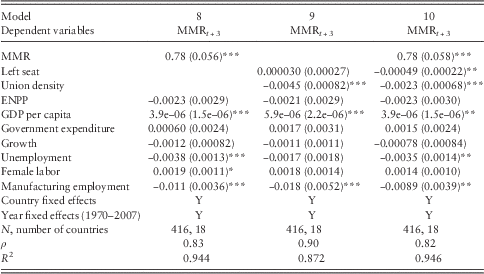
Finally, the redistribution cycle is completed with Hypothesis 3, which shows how the median voter (current MMR) and power resources can both affect future wage disparity (MMR lead by 3 years). Model 8 in Table 3 shows that MMR is positive and significant (at 1%) in explaining future MMR. This should be expected, as the setup is similar to a lagged dependent variable. In model 9, when MMR is omitted, left partisanship is not significant in affecting the MMR of income, but union density, another power resource, has a significant (at the 1% level) negative effect. Finally, in model 10, all three variables are included. Left seat share becomes significant (at 5%) in the expected direction and the effect of union density remains. Thus, Hypothesis 3 is confirmed.
Effect of power resources on income distribution (Hypothesis 3)

Dependent variable is mean–median ratio lead by 3 years. Parameters are estimated by the Prais–Winsten estimator with panel-corrected standard error in parentheses. The common AR(1) parameter is denoted by ρ. Constant terms are included in all models.
MMR=mean–median ratio; ENPP=effective number of parliamentary parties; GDP=gross domestic product.
***P<0.01, **P<0.05, *P<0.1.
Comparing the results from models 9 and 10 shows that the effect of left party strength is only visible when MMR is also accounted for. Although somewhat weaker, this dynamic is also visible in the results of Hypothesis 2 in Table 2, which could be considered in support of my theoretical argument on party competition. Parties are affected by both the median voter and power resources in the policy-making process, which can only be captured when both variables are included in the estimation.Footnote 13
Discussion and conclusion
In this section, I will discuss the results, in particular those different from other studies. Relatively little research has focused on the link between income disparity and electoral outcome. This relationship cannot be taken for granted as studies, including Rodriguez (Reference Rodriguez1999), find no such evidence in the United States. My results confirm that the greater MMR, or the further the position of the median voter to the left, the more votes left parties gain.
The results from the second hypothesis warrant further discussion. In the first part of Hypothesis 2, I find that greater redistribution is associated with a more biased initial income distribution, confirming the predictions of the Meltzer and Richard (Reference Meltzer and Richard1981) model. This contradicts the results of other studies, although it is theoretically grounded (Kristov et al., Reference Kristov, Lindert and McClelland1992; Gouveia and Masia, Reference Gouveia and Masia1998; Moene and Wallerstein, Reference Moene and Wallerstein2001), which can be partially attributed to the different ways of operationalizing the variables. Wage distribution inequality, the ratio of wage levels, or the log of five times the middle quintile share of GDP have all been previously used (e.g. Kristov et al., Reference Kristov, Lindert and McClelland1992; Moene and Wallerstein, Reference Moene and Wallerstein2001; Iversen and Soskice, Reference Iversen and Soskice2006; Lupu and Pontusson, Reference Lupu and Pontusson2011), but I measure the mean–median income distance/ratio suggested in the original model using the high-quality LIS database. The fixed effects design of this study is another source of difference, as it removes cross-sectional variations in favor of within-case changes over time. The measurement of redistribution is also central to the results as I discuss next.
The second component of Hypothesis 2 examines how power resources explain redistribution. The role of corporatism vis-à-vis left partisanship is a subject of debate (Pontusson et al., Reference Pontusson and Rueda2002; Rueda, Reference Rueda2008; Beramendi and Cusack, Reference Beramendi and Cusack2009). My results support the view that corporatism is a necessary condition for left parties to increase redistribution, but the two views do not directly contradict each other. The difference lies in the measurement of redistribution as an input or an outcome. With ‘welfare generosity,’ measured as the ratio of social transfers to GDP adjusted for the proportion of the working population as the variable of interest, Rueda (Reference Rueda2008) finds that the effect of partisanship is muted by corporatism.Footnote 14 Beramendi and Cusack (Reference Beramendi and Cusack2009) focus on the effects on wage inequality and disposable inequality (welfare outcome instead of input) and arrive at the opposite conclusion. Similarly, I look at wage disparity (MMR) and redistribution as the reduction of inequality. It is likely that while left governments are constrained by corporatism in increasing the amount of welfare input, the progressiveness of the welfare state as a whole (other than welfare input) can only be achieved by left partisanship under corporatism, which reconciles the two perspectives. This possibility is an interesting avenue for future research.Footnote 15
The last hypothesis investigates the utility of power resources in explaining future wage dispersion. Union density has a strong effect, while that of left parties is only observable when the position of the median voter is also accounted for. This resonates well with Wallerstein (Reference Wallerstein1999), who argues that the density and centralization of unions have a strong effect on wage distribution. The finding that left partisanship has no significant effect on the lower half of wage distribution may, to an extent, explain this (e.g. Pontusson et al., Reference Pontusson and Rueda2002; Rueda, Reference Rueda2008).
One interesting finding complements those of Lupu and Pontusson (Reference Lupu and Pontusson2011), who suggest that income skew (90–50 ratio to 50–10 ratio) is a strong determinant of redistribution and left participation in government, and its redistributive effect persists even after government partisanship is controlled for. The effect of partisanship on spending and redistribution is, however, inconsistent. The policy preferences of the middle-income voters, which are affected by their proximity to the rich and the poor, are suggested to be the key factors behind the results (Lupu and Pontusson, Reference Lupu and Pontusson2011). My suggested framework, however, is captured by two indicators: the gap between the median and mean income and the strength of left political forces, including left partisanship. Both are found to be significant determinants of redistribution and inequality. While Lupu and Pontusson’s (Reference Lupu and Pontusson2011) model is arguably more simplified, I place political parties at the heart of the model (party competition and partisanship) and explore the extent to which governing parties pursue redistributive policies. I argue that a combination of both perspectives best explains redistribution by looking at the preferences of the voters in the middle of the income spectrum and the policy choices of parties in response. This, again, highlights the importance of combining the median voter theory and the power resources theory.
This study has its limitations, as it selectively focuses on certain aspects and cannot fully incorporate other significant contributions. For example, Rueda’s (Reference Rueda2005) focus on insiders vs. outsiders in the economic system, Moene and Wallerstein’s (Reference Moene and Wallerstein2001) suggestion that social insurance has to be separated from redistribution, and the dynamics of the electoral system and redistribution offered by Iversen and Soskice (Reference Iversen and Soskice2006) are all omitted. I did not account for the dynamics of electoral systems, which are obviously crucial for political representation, coalition formation, and policy outcome (Iversen and Soskice, Reference Iversen and Soskice2006; they are simply removed by the fixed effects design here). The development of the current model in accordance with these contributions must be left for future research.
Second, while I provide empirical results supporting the Meltzer–Richard model, there are still many unresolved questions. Numerous assumptions are made in the model, not all of which are empirically established, such as the hypothesized increase in support for redistribution with inequality (Kelly and Enns, Reference Kelly and Enns2010). While I offer theoretical arguments about why these may not be relevant (as the variables now mainly capture the dynamics of party competition), I have done little in responding to the challenges and to strengthen the model. It is also unclear whether any measures of inequality, such as the MMR used here, are good proxies of median preferences. Rather than a defense of the median voter model, this study can more appropriately be regarded as presenting an alternative perspective toward underlying theories.
While the statistical significance of the results is established above, their substantive significance is admittedly less impressive. Fixed effects design focuses on within-country variations, so the standard deviation of MMR change from 1 year to the next (0.033) is considered here.Footnote 16 Over a 3-year period (the typical length of a legislative cycle), with the estimates of model 1, this translates into a 0.51% (0.033×3×5.16) increase in left vote shares. MMR can affect redistribution directly and indirectly through boosting left political strength (Hypothesis 2). The same increase in MMR directly increases redistribution by 0.60 (model 7). If, for example, the increase in the vote could translate into a 2% increase in seat shares for left parties, it will boost redistribution by around 0.1 at high levels of corporatism (Figure 3). To put this into context, redistribution has a mean of 36.24. A 0.7 increase (0.6+0.1) in redistribution resulting from a 1 std. dev. change in the level of MMR over a 3-year period is relatively modest. Finally, it may not be desirable for the indirect effect (through a left party) to be much smaller than the direct, but the indirect channel is still theoretically significant, given the confirmation of Hypotheses 1 and 2.
To conclude, this study combines the median voter (Meltzer–Richard) hypothesis and the power resources theory into a single framework under party competition. Despite the debates over their incompatibility and contrasting predictions, I argue that they are causally linked as a greater income disparity leads to stronger electoral performance by the left. I provide statistical evidence that they are jointly significant to redistribution and thus inequality formation. This study carries profound implications, as it proves that the two major approaches in the field are not necessarily mutually exclusive; on the contrary, the explanatory power of one approach can be greatly enhanced by adequately accounting for the other.
Acknowledgments
The author would like to thank Alejandro Quiroz, David Stadelmann, John Stephens, Hugh Ward, and three anonymous reviewers for comments and suggestions on previous drafts of this paper.
Supplementary material
To view supplementary material for this article, please visit http://dx.doi.org/10.1017/S175577391600014X