I. INTRODUCTION
For half a century thermoluminescence (TL or TSL) dosimetry has been crucial for both individual and environmental radiation monitoring. Many successful materials have been discovered that include aspects of high sensitivity, reliability, chemical and thermal stability, as well as ease of production and economic commercial availability. Examples of TL dosimetry materials include Mg2SiO4:Tb, Al2O3:C, CaSO4:Tm, CaSO4:Dy, Li2B4O7:Mn, and LiF TLD-100.Reference Mckeever1 Of particular potential interest, because of its high sensitivity, magnesium orthosilicate is doped with terbium (Mg2SiO4:Tb). This phosphor was first considered for radiation dosimetry in 1971.Reference Hashizume, Kato, Nakajima, Sakamoto, Kotera and Eguchi2,Reference Toryu, Sakamoto, Kotera and Yumada3 One key benefit is its high gamma sensitivity, which is 40–100 times that of LiF:Mg,Ti. Once manufactured, it only requires a simple annealing treatment (500° for half 1 h) for reactivation and it has excellent signal stability. Since it is mostly formed of relatively light elements its effective atomic number is approximately 11, and so is also useful in environmental and personnel monitoring.Reference Kato, Antoku, Sawada and Russell4 An equally relevant feature is that the emission is in the blue end of the spectrum where the photomultiplier detectors are particularly responsive.
Several investigations have already been carried out on phosphor: i.e., optical and thermal effects on the TL response,Reference Nakajima5,Reference Mittani, Prokic and Yukihara6 sensitization, and photo-transferReference Lakshmanan and Vohra7 and some phenomenological parameters such as activation energy (E), frequency factor (s), and kinetic order.Reference Bacci and Furetta8 An even more interesting bonus for dosimetry with Mg2SiO4:Tb is that it has the highest known intrinsic TL sensitivity to UV radiation (wavelength 253.7 nm). Consequently this makes it a promising TL phosphor for UV dosimetry.Reference Lakshmanan, Shinde and Bhatt9 In addition, it was reported that Mg2SiO4:Tb can be used in fiber optic dosimetry to assess the in vivo, real time dose.Reference Molina, Prokic, Marcazzo and Santiago10
As mentioned in earlier studies,Reference Prokic and Yukihara11 the characteristics of this phosphor vary considerably with the production techniques. Mg2SiO4:Tb is a relatively complex TL material whose glow curve shapes and TL intensities are strongly influenced by the preparation method. Problems arise as there are a range of phases of the MgO–SiO2 system and the performance depends on the activator concentration. Both types of features are potentially controllable and the terbium concentration can be optimized. Therefore, a comprehensive study has already been carried out by our group to study how the synthesis conditions influence and control the TL response of Mg2SiO4:Tb.Reference Wang, Jiang, Chu, Xu and Townsend12
In this paper, the TL spectra are presented as isometric plots (intensity versus temperature and wavelength), together with contour views of the data. Experimentally, data below and above room temperature are obtained separately. The low temperature data are the first examples of such TL spectral data for Mg2SiO4:Tb phosphors at the lower temperatures. For the dosimeter applications spectral details are not essential, but the detailed TL spectra are necessary for modeling the underlying science.Reference Townsend and Kirsh13 A sensitive spectrometer equipment is needed to record the spectra, and the apparatus used here is unique. It was designed specifically for TL studies.Reference Luff and Townsend14 It uses a pair of spectrometers, one with a UV/blue blazed grating and a blue sensitive photon imaging photomultiplier (PM) tube, and a second red blazed grating with detection by a red sensitive imaging PM tube (and a red transmitting filter to reject higher order blue signals). This design has proved to be very effective in terms of sensitivity, resolution, and dynamic range. It has allowed detection, not only of the temperature dependent spectra seen during TL, but also it has revealed a wide range of phase transitions by changes in the luminescence signals,Reference Townsend, Yang and Wang15 plus lattice distortions and impurity phase inclusions.
Whilst the initial aim was to monitor the spectra of the Tb doped dosimeter material, further insights into the defect sites are opened by contrasting the Tb response with Eu doped orthosilicate. The larger Eu ions distort greater volumes of the host lattice, and this influences the stability of the electron and hole trapping sites, even if they are part of one large complex within the host. Such effects are immediately obvious and indeed the data will show that the behavior is linked to the longer range interactions of higher excited RE states, and so the TL peaks are sensitive to both the RE size and the excited states of the emission wavelengths.
II. EXPERIMENTAL
Mg2SiO4:Tb used here for the study of TL has been synthesized by a sintering technique under the reaction between high purity Mg(OH)2·4MgCO3·6H2O and SiO2 with the addition of Tb4O7 as the activator. The mixtures were heated at 1500 °C for 6 h. The concentration of terbium is around 5 wt%. All the sintered materials were then ground and sieved through a 200-mesh sieve into a fine powder form for the TL experiments. The details of the production process are in our previous paper.Reference Wang, Jiang, Chu, Xu and Townsend12 Data of the Eu doped material are contrasted with that of the Tb samples and a similar preparation route was taken.
TL spectra were collected by a high sensitivity luminescence system at the University of St Andrews. The optics of this spectrometer had been previously described from its original construction at Sussex,Reference Luff and Townsend14 but significant modernization improvements in detectors and time resolution are now available in the upgraded St Andrews system. After data collection the signals were processed to correct for the wavelength sensitivity of the spectrometer and detector system. Only corrected spectra are presented here.
Two different temperature stages were used during the study. The low temperature stage operates from 25 to 300 K and a high temperature stage was used from room temperature to 400 °C, providing a total temperature range from 25 to 673 K. During the experiments, a heating rate of 15 K/min was used for the high temperature stage, but a lower rate of 6 K/min for the low temperature stage (since the thermal conductivity is poor within this range). These modest heating rates ensured that the temperature monitored matched the surface temperature of the sample. The rates are in contrast with the commonly used higher rates used in many dosimetry measurements. High rates are acceptable for dosimetry where only the total signal is of interest, but rapid heating results in major temperature gradients (e.g., Ref. Reference Ege, Wang and Townsend16) and so are inappropriate for the more fundamental investigations of the current work. The benefits of the low heating rate are of particular value for the Eu doped samples where differences in the TL exist for different emission lines. The irradiation doses excited by x-rays for the high and low temperature runs were 100 and 5 Gy, respectively. Radioluminescence (RL) signals excited by x-rays were also collected within the same temperature ranges.
III. RESULTS
A. High temperature measurements with Tb dopants
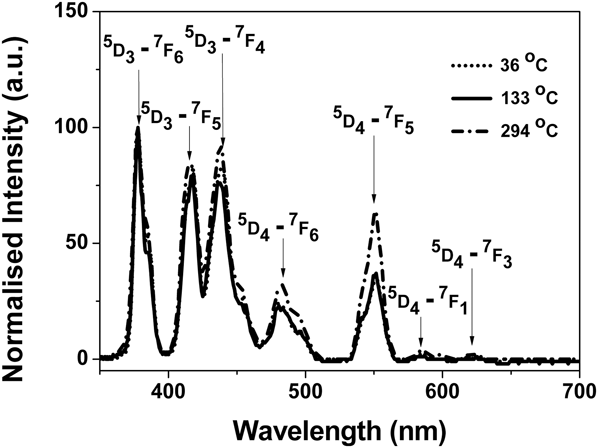
The results of high temperature TL spectra of terbium doped Mg2SiO4 are shown in Fig. 1. Isometric TL spectra are displayed together with contour plots. The samples exhibit only line luminescence signals characteristic of the rare earth dopant (Terbium). Note that the signals shown in the upper right hand corner of the contour plot are the blackbody signal. There is negligible evidence for any broad band emission, as would be characteristic of the pure host lattice. The details of the emission spectra are shown in Fig. 2 for data taken in the three peak temperature regions. Above room temperature, the main emission lines are at 377, 417, 440, 481, 585, and 622 nm. These are characteristic emission lines due to Tb3+ transitions and they are, respectively, assigned to the shifts between 5D3,4 and 7FJ (J = 1, …, 6) states as indicated in Fig. 2.Reference Ayvacikli, Canimoglu, Karabulut, Kotan, Herval, de Godoy, Galvao Gabato, Henini and Can17,Reference Kotan, Ayvacikli, Karabulut, Garcia-Guinea, Tormo, Canimoglu, Karali and Can18
TL spectra of Mg2SiO4:Tb at high temperature. (a) is for the isometric plot and (b) is for the contour plot.

TL spectral slices of Mg2SiO4:Tb at the peak temperatures.
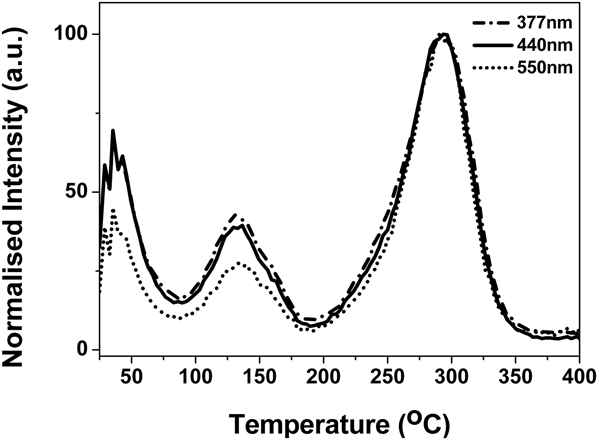
The number of components of the high temperature glow curves is nominally the same, as shown in Fig. 3 for three integrated emission bands. Note, however, that they differ in relative intensity, as the transition probabilities are a function of temperature. For radiation dosimetry, the emission lines all fall within the transmission plateau region of modern heat absorbing filters, so the full spectrum reaches the dosimetry PM detector. Further, the more intense blue lines match the optimum quantum efficiency of the PM tubes, so overall, for a standard dosimeter system this is a highly desirable phosphor.
Glow curve of Mg2SiO4:Tb for three integrated emission bands.
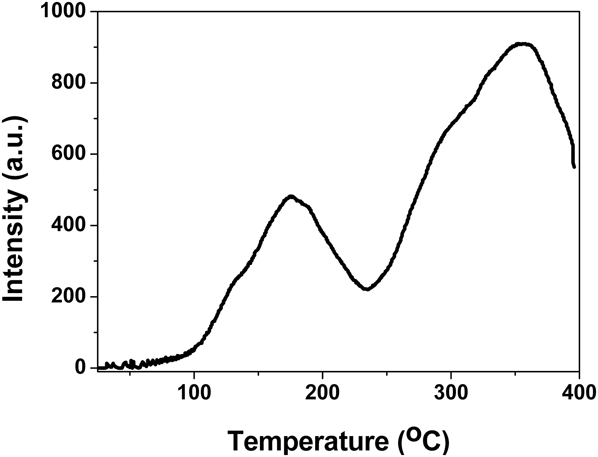
Figure 3 indicates that in addition to glow peaks centered near 130 and 300 °C there is a low temperature signal evident near 36 °C. Any trapping site with TL so close to room temperature will rapidly fade at room temperature, so this peak is irrelevant for dosimetry applications, and indeed it does not appear in TL signals collected on commercial dosimetry systems. Dosimetry applications use much higher heating rates and, as shown in Fig. 4, the 130 and 300 °C peaks are both displaced and distorted to appear nearer 175 and 300 °C. In part this is because high heating rates move the peaks to higher temperatures, but more critically it is due to the fact that the powder is neither at the temperature of the heater strip, nor at a uniform temperature. The integrated area successfully monitors the radiation exposure, but the curve shape is quite misleading and unsuitable for detailed analysis.
Glow curve of Mg2SiO4:Tb obtained with commercial dosimetry equipment at a high heating rate of 15 °C/s.
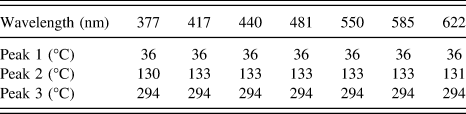
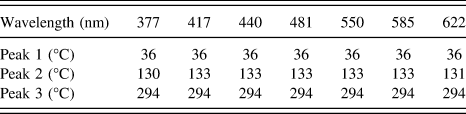
Isometric RL spectra, acquired during heating, are displayed in Fig. 5. As expected the RL signal has the sharp characteristic lines of the rare earth dopant (terbium) and this is consistent with similar processes observed in other radiation induced phenomena in this compound.Reference Mittani, Prokic and Yukihara6,Reference Molina, Prokic, Marcazzo and Santiago10,Reference Bos, Prokic and Brouwer19 The low heating rate glow peaks are summarized in Table I which shows that they appear at the same temperatures, independent of wavelength.
RL spectra of Mg2SiO4:Tb at high temperature.
High temperature glow peaks of Mg2SiO4:Tb for a low heating rate.
B. Low temperature measurements with Tb
For commercial dosimetry, TL must be above room temperature. Consequently there is a very limited literature for most TL dosimeter materials at low temperature TL, although low temperature TL normally gives more intensity and additional features. An isometric view of low temperature TL spectra of MgSiO4:Tb is shown in Fig. 6. TL spectra once again exhibit sharp line luminescence, characteristic of the rare earth dopant, as shown in the contour plot. There is one main peak near 213 K. A very tiny peak at a very low temperature part is assumed to be from fluorescence decay after irradiation.
TL spectra of Mg2SiO4:Tb at low temperature. (a) is for the isometric plot and (b) is for the contour plot.
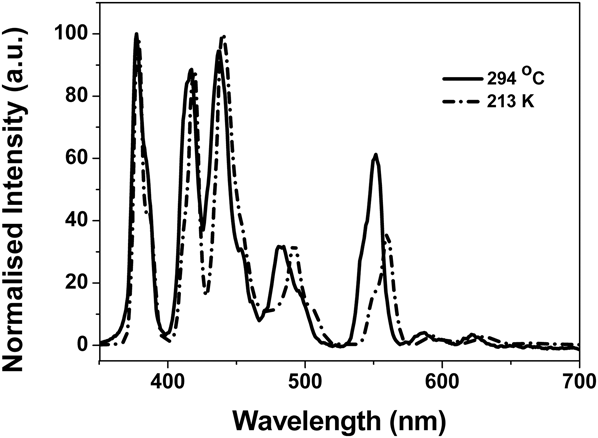
A comparison of emission spectra of MgSiO4:Tb recorded at low and high temperatures emphasizes that there are some temperature dependent spectral movements. An example is shown in Fig. 7. In this figure the spectral intensities obtained at two temperatures were normalized for the ease of a visual comparison (i.e., because the 294 °C signal is much weaker than the low temperature emission). There is a noticeable wavelength shift of the spectral lines at the red end of the spectrum.
TL emission spectra of Mg2SiO4:Tb at low and high temperatures.
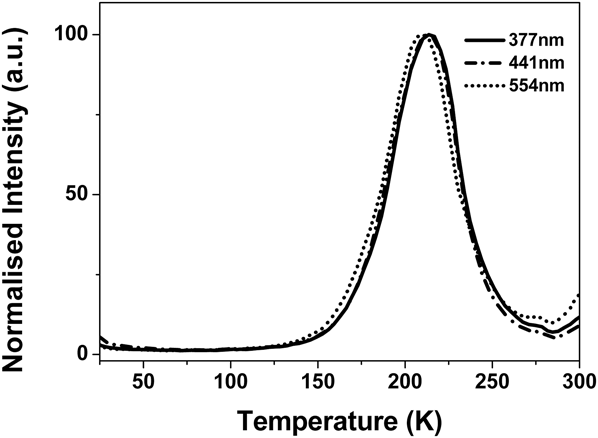
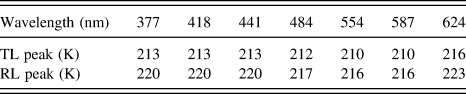
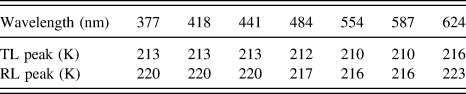
At low temperature, the peaks at 377, 554, and 587 nm display nominally the same shape of their glow curves with the same peak temperatures. However the TL is displaced slightly from signals taken at longer wavelengths (as shown in Fig. 8) where the data were normalized at 213 K. This will be discussed in conjunction with the Eu data. Peak positions are listed in Table II.
Glow curve of Mg2SiO4:Tb for three integrated emission bands.
Low temperature glow peaks of Mg2SiO4:Tb for a low heating rate. The values of the “peaks” in the scanned RL measurements are offered for comparison.
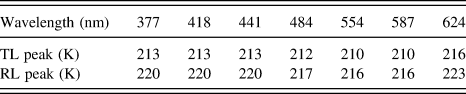
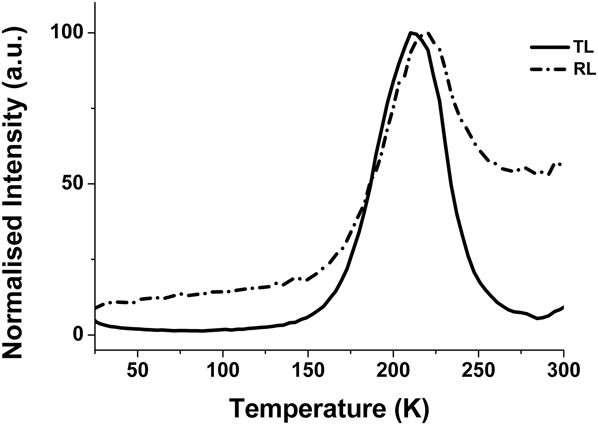
Peak features are also apparent in the RL obtained during heating and an isometric view of RL spectra is shown in Fig. 9. The pattern is very similar to the TL data, but the RL gives more intense signals above 200 K. The comparison of the curves for heating during RL, and TL, is shown in Fig. 10. Inevitably during the temperature ramped RL heating there is a TL component in addition to the RL (hence there is a peak in the data at a similar temperature).
Temperature ramped RL of Mg2SiO4:Tb in the low temperature range.
Comparison of RL and TL at low temperature for the same heating rate.
C. High temperature measurements with Eu dopants
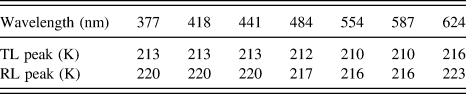
For the europium doped samples the higher temperature TL has peaks at totally different temperatures from the Tb doped material and, as shown in the isometric and contour map of Fig. 11, the signals are defined by the line spectra of the Eu dopants. In applications for dosimetry the Eu emission is in an unfavorable part of the spectrum when using photomultiplier detectors, but comparing different rare earth dopants provides insights into the mechanisms of the TL process. Further, the different emission lines neither have the same number of components, nor do they peak at identical temperatures. The divergence between the signals is shown in Fig. 12. The results are summarized in Table III.
High temperature TL for Mg2SiO4:Eu. (a) is for isometric plot and (b) is for contour plot.
TL curves for different Eu emission lines.
High temperature TL peak data of Eu doped Mg2SiO4.
D. Low temperature measurements with Eu dopants
Figure 13 displays the low temperature TL for Eu doped material. This is interesting as at the lower temperatures there are both line emissions from Eu and, in the region from ∼400 to 500 nm, broad band emissions characteristic of the host lattice. The glow curves are therefore strongly wavelength dependent, as shown in Fig. 14.
The low temperature TL of Mg2SiO4:Eu. (a) is for the isometric plot and (b) is for the contour plot.
Normalized intensity curves of the TL from Mg2SiO4:Eu as a function of wavelength.
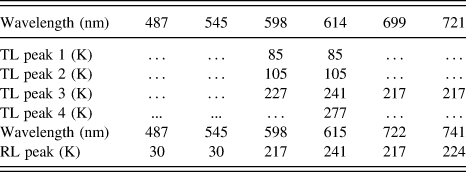
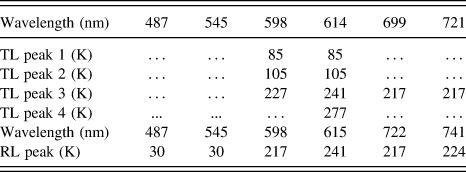
The low temperature intrinsic broad band features are more clearly apparent in the RL obtained whilst heating the sample (Fig. 15). However, these figures are surprising in that, instead of there being intensity peaks that match the TL response, the Eu line signals display quite different temperature patterns with the supposed TL type contributions peaking at different values as a function of wavelength. The following Table IV therefore lists the wavelength dependence of the TL peaks and additionally has data for the peaks caused by TL additions to the ramping of temperature during RL.
The low temperature RL recorded during heating of Mg2SiO4:Eu. (a) is for the isometric plot, (b) is for the contour plot.
Low temperature glow peaks of Mg2SiO4:Eu for a low heating rate. The values of the “peaks” in the scanned RL measurements are offered for comparison.
IV. DISCUSSION
High and low temperature TL and RL confirm that both TL and RL emission spectra of MgSiO4:Tb are dominated by characteristic emission lines of Tb3+ through the whole temperature range (25 K to 400 °C). This is not unusual for rare earth doped TL dosimeters, but there can also be variations in spectra with temperature [e.g., CaF2:NaCl, or MgB4O7:Mn (Ref. Reference McKeever, Moscovitch and Townsend20)], so a measurement for the MgSiO4:Tb is justified. There are many examples of variations in spectra for different TL peaks (e.g., from intrinsic and impurity sites) but normally ignored during the dosimetry. However, they are valuable in understanding the models of the sites and TL mechanisms.
There are three glow peaks above room temperature which were observed after x-ray irradiation. They are centered near 36, 130, and 300 °C. The 36 °C peak has not normally been cited because it is too close to room temperature, and so fades away very quickly, but here we made the measurement directly after the irradiation. The other two peaks (130 and 300 °C) have been reported.Reference Tadaki, Takanobu, Taketsugu, Koji and Teruhisa21 As observed by the comparison of Figs. 3 and 4 one cannot discuss results in terms of the peak temperature without citing the heating rate, and at high dosimetry rates there is often a 200 °C peak.Reference Prokic and Yukihara11,Reference Tawara, Masukawa, Nagamatsu, Kitajo, Kumagai and Yasuda22 A possible process of three dosimetry TL peaks (130, 200, and 300 °C) in Mg2SiO4:Tb phosphors have been proposed by Tadaki et al.Reference Tadaki, Takanobu, Taketsugu, Koji and Teruhisa21 They believe that two glow peaks, at 130 and 310 °C, are caused by the ionization of excited impurities since they observed them after light and laser irradiation with x-rays. Experimentally our observations are inconsistent with this as all the present peaks in RL and TL data were generated by x-ray irradiation. Their model for the TL mechanism may therefore be inappropriate for the current data.
Thus, we prefer a more general modelReference McKeever, Moscovitch and Townsend20,Reference Townsend and White23–Reference Townsend, Jazmati, Karali, Maghrabi, Raymond and Yang27 in which there is a close association of the trap and emission center. Such packages are not unexpected as the rare earth ions differ in valence from the host ions and also differ in size. Therefore both for local charge equilibrium and minimization of lattice strain energy the associations of defect packages are extremely effective. There are many examples where the RE ions not only act directly as the recombination center, but also play an important role on the trap depth. This fact immediately underlines that the RE ions are in close contact with the charge traps, and transfer is localized and direct, rather than a long range process via the conduction or valence bands. This factor is also a reason why the efficiency of such phosphors is high. In hosts such as LaF3,Reference Yang, Townsend and Rowlands24 CaSO4 (Ref. Reference Karali, Rowlands, Townsend, Prokic and Olivares25), or Bi4Ge3O12 (Refs. Reference Raymond and Townsend26 and Reference Townsend, Jazmati, Karali, Maghrabi, Raymond and Yang27) the temperature of the TL peaks shift smoothly with the rare earth dopant size, and differ from the intrinsic host peak temperatures. In each case there is an unequivocal intimate link between trapping and luminescence, and the local lattice distortion. Note also that a similar model of a complex of defect components is well established for TLD100.Reference McKeever, Moscovitch and Townsend20 In TLD100, charges are trapped and/or move within a package containing three Mg ions, three Li vacancies, Ti, and possibly oxygen impurities. Overall, together with local lattice distortions this dosimetry site involves a large volume in the LiF host.
For the orthosilicate a similar energy transfer between the recombination parts of a complex that includes a rare earth ion and a trapping site will also minimize lattice strain energies, compared with that of separated defects. The close coupling similarly offers a very efficient decay pathway for TL. The complex invariably needs impurities, or other charge compensating defects. An exception to the need for a compensator can occur in rare earth doping of LaF3, but even for RE ions replacing La there are further changes ensuing from increases in dopant concentration and consequent pairing or precipitation of impurities to minimize lattice distortions.Reference Yang, Townsend and Rowlands24,Reference Yang and Townsend28
As noted, the current low heating rate of TL patterns differs from those taken on fast heating commercial dosimeter systems. However, the cited temperatures for the dosimetry equipment are merely guide lines for discussion, and the peak shapes are unsuitable for detailed analysis as the sample temperature lags significantly behind the temperature that is being recorded from the heater. This is frequently overlooked but the problem has been discussed in a number of publications.Reference Ege, Wang and Townsend16,Reference Betts, Couturier, Khayrat, Luff and Townsend29–Reference Wang and Townsend32 The fast heating rate data are unsuitable for kinetic analysis.
A second problem is that emission bands normally broaden with increasing temperature and may vary in terms of their luminescence efficiency. So for systems that use a simple detector that has wavelength dependence (e.g., a PM tube and filter to limit the spectral range) the absolute number of detected photons is slightly distorted with temperature. This is an obvious, but a minor error, and in dosimetry it is overlooked as it will also have occurred during dosimetry calibration. However, from a more precise view it is an error if one is considering the science of the TL process, and is more relevant for broad band emission features.
Lattice distortions involving a RE dopant and a local compensator/trapping site will be very sensitive to the size of the rare earth ion. This means that equivalent packages have the TL peaks at different temperatures. For RE dopants in LaF3, the displacement of a low temperature peak that is seen as exciton type broad band emission in the host lattice is progressively displaced through the RE series by about 13° (from 128 to 141 K). Parallel examples exist in Bi4Ge3O12 for both smaller and larger ions that are replaced on the Bi site. Dosimeter examples such as CaSO4 doped with RE ions also show a peak shift in the high temperature range of ∼8° when switching between Dy and Tm. These examples are overshadowed by the progression caused by doping zircon with a sequence of rare earth ions, as the low temperature signals smoothly move from ∼100 to 325 K with ion sizes from Yb to Pr. In terms of ionic radii the span is ∼0.87–0.99 nm (i.e., a increase of say 14%). However the more sensible view for a distortion is to consider the change in ionic volume, and this is an increase of ∼50%. Zircon is known to damage easily and can become amorphous (metamict in the geological description) so in this material the impurities may be causing lattice collapse and precipitating into inclusions, or new compounds, rather than being simply embedded and distorting the host lattice.
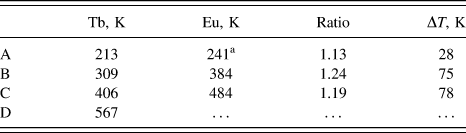
For the Mg2SiO4, replacing the Mg ions with large rare earth ones will cause a major distortion since the ionic radius of the Mg2+ varies between 0.057 and 0.089 nm as a function of the co-ordination number. Further, the change from Tb to Eu represents an ionic radius increase from ∼0.178 to 0.204 nm (an ionic volume increase of nearly 50%). This induces a large lattice distortion and is apparent in the displacement of the TL peaks. Table V lists the TL peaks that are solely with RE emission and there a clear pattern emerges as the peak temperatures differ by ∼20%. The larger Eu ions stabilize a larger volume for trapped charges. We have no recorded equivalent to the peak D for Eu. The pattern predicts a value near 678 K (400 °C) and this was beyond the range of measurement, and it is experimentally difficult because of black body emission in this red region.
A comparison of Tb and Eu glow peaks in Mg2SiO4.
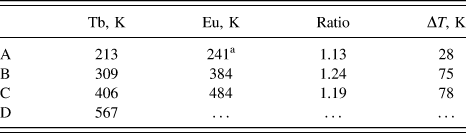
a There are various Eu peaks but at this wavelength, near 600 nm, there are significant signals also at higher temperatures, so comparisons with the Tb data are feasible. This part of the spectrum is also the most intense during RL.
The dopant ion sizes are not constant, but are a function of the excited state orbitals. Thus if the measured line transitions originate from higher states, (e.g., Refs. Reference Ayvacıklı, Ege, Ekdal, Popovici and Can33 and Reference Canimoglu, Garcia-Guinea, Karabulut, Ayvacikli, Jorge and Can34) it is equivalent to starting from slightly larger ions and longer range lattice interactions. This effect is clearly demonstrated here since the emission spectra of both Tb and Eu involve a range of upper states. There is therefore the potential to have different long range couplings from the rare earth site to nearby, or more distant trapping sites. The inherent distortions of the host lattice therefore mean the escape of charge from such traps will be modified. If the electron escapes and returns to the RE site then the apparent TL peak temperature will reflect this variation in stability and so the TL peaks will be wavelength dependent. The data shown in Fig. 8 indicate that this can occur with Tb doped material and here there is a clear pattern that the short wavelength features appear at a slightly higher TL peak temperature. Figure 16 confirms this possibility as these three lines originate from higher energy states of the Tb. This suggests that the dopant distortions associate most easily with nearby electron traps and, in so doing, lower the energy required for electron escape (i.e., lower TL peak temperatures). Such directional escape further means the emission intensity is high.
Tb and Eu energy levels and their emission wavelengths in magnesium orthosilicate.
Europium dopants are therefore likely to demonstrate this same feature more clearly since the Eu ion is much larger than the Tb, and as shown in Table V, there is a 20% lowering in the escape energy from the trap to the RE site. Further, Eu has a more complex set of excited states. Assignments of the transitions to the energy level pattern of the free ion differ between authors and also with different host materials. In this host the Eu causes major distortions, so the normal transition probabilities may well be perturbed. Therefore in Fig. 16, the various Eu lines are associated with energy spacings that offer the observed emission wavelengths. One reason for this display is that it identifies a possible origin for the temperatures of the wavelength dependence for the Eu. Figure 13 shows that the red signals at longer wavelengths are not identical, and they are at least 40% lower in temperature than the green emission lines. The pattern of Fig. 16 is consistent with such changes if one assumes that the temperature is controlled by the energy level of the upper electron state for each emission line. This comparison defines a smooth pattern from the signals at 669 to 598 and 614 nm up to the values for the 545 and 485 nm emissions.
In terms of the model, where the Eu has distorted the lattice, it implies that the same basic trap is involved. Close proximity allows lower temperature electron release, whereas the more distant variants are less distorted, deeper, but are still able to couple to the higher energy orbitals of the Eu ions. Extrapolating the pattern of the temperature shift versus the upper energy state to the point where the trap would be independent of the Eu complex distortions implies that such a “perfect host” trap would have risen from ∼213 to ∼350 K.
The pattern for both Tb and Eu line emissions is that TL signals arising from higher states appear at higher temperatures. This is precisely the same pattern as driven by changes in the ion size seen here, and all the other RE doped TL examples cited in the literature.
Precisely the same separation of emission lines, in terms of their initial higher states, is clearly demonstrated in Fig. 15 for the RL spectra recorded whilst heating the sample. Historically, one assumed the peaks were simply additions of a TL component to the RL, but in hindsight it is now apparent that the temperature ramped RL data provide a novel route to discriminate between different transition levels. The Eu data are visibly obvious in this respect, whereas for Tb, more detailed numerical inspection of the data is required.
V. CONCLUSION
High and low temperature TL, together with RL, from MgSiO4:Tb and MgSiO4:Eu are reported. The dominant signals arise from the transitions within the RE dopants, with limited intensity from intrinsic or host defect sites. The peak TL temperatures from Tb and Eu are correlated, and the scale, with the ion size. The larger Eu ions stabilize the TL emission by ∼20% more than that of the Tb. More subtle size effects are also seen that link to the upper state orbitals of the transitions and more extensive orbits result in higher temperature TL. The same data are encoded in RL during heating.
ACKNOWLEDGMENTS
We would like to thank the support of the Fundamental Research Funds for the Central Universities of China, the National Science Foundation of China (No. 11205134) and Beijing Higher Education Young Elite Teacher Project (YETP0640). The refurbishment of the RLTL system at St. Andrews was funded by NERC grant NE/H002715/1.