Introduction
Emulsions are thermodynamically unstable colloidal systems composed of immiscible liquids, typically oil and water, in which one phase is dispersed into the other in the form of droplets (Ngai and Bon, Reference Ngai and Bon2014). Traditionally, emulsions are stabilized using surfactants or polymeric emulsifiers that reduce interfacial tension and prevent droplet coalescence (Assunção Dorigon et al., Reference Assunção Dorigon, Araújo Pessoa, Queiroz Neto, Andrade Silva, Soares Filho and Silva Curbelo2025). However, growing environmental concerns, regulatory pressures, and consumer demand for cleaner formulations have intensified research into alternative, more sustainable stabilization strategies (Chevalier and Bolzinger, Reference Chevalier and Bolzinger2013; Machado et al., Reference Machado, de Freitas and Wypych2019). Among these, Pickering emulsions stabilized by solid particles irreversibly adsorbed at the oil–water interface have emerged as a compelling approach, offering high stability and the potential to eliminate synthetic surfactants from formulations (Lisuzzo et al., Reference Lisuzzo, Cavallaro, Milioto and Lazzara2022; Wang and Alvarado, Reference Wang and Alvarado2011).
The stabilization of emulsions using solid particles was first reported in the early 20th century (Ramsden, Reference Ramsden1904; Wang and Alvarado, Reference Wang and Alvarado2011); however, it has only recently become a focus of materials and colloid science due to advances in nanotechnology and particle engineering (Lisuzzo et al., Reference Lisuzzo, Cavallaro, Milioto and Lazzara2022). In Pickering systems, the particle’s wettability, size, morphology, and surface charge dictate its ability to adsorb at the interface and create a mechanical barrier that inhibits coalescence (Binks et al., Reference Binks, Clint and Whitby2005; Venkataramani et al., Reference Venkataramani, Tsulaia and Amin2020). Compared with molecular surfactants, these particles form more robust interfacial layers and yield emulsions with enhanced kinetic stability (Chevalier and Bolzinger, Reference Chevalier and Bolzinger2013; Lisuzzo et al., Reference Lisuzzo, Cavallaro, Milioto and Lazzara2022).
Naturally occurring clay-rich deposits such as bentonite and kaolin offer a unique combination of properties that make them attractive as Pickering stabilizers (Lisuzzo et al., Reference Lisuzzo, Cavallaro, Milioto and Lazzara2022; de Souza Machado et al., Reference de Souza Machado, Hazt, Sotiles, de Freitas and Wypych2025). Bentonite is a commercial designation for smectite-rich clay rocks whose dominant mineral is most commonly montmorillonite, although other dioctahedral smectites may also be present (Adamis and Williams, Reference Adamis and Williams2005). Similarly, kaolin refers to a fine-grained clay whose main mineral phase is either kaolinite or halloysite, depending on its geological origin (de Souza Machado et al., Reference de Souza Machado, Hazt, Sotiles, de Freitas and Wypych2025). These minerals are widely available, inexpensive, and exhibit layered or tubular morphologies that enable strong interfacial packing (Cavallaro et al., Reference Cavallaro, Danilushkina, Evtugyn, Lazzara, Milioto, Parisi, Rozhina and Fakhrullin2017; de Souza Machado et al., Reference de Souza Machado, Hazt, Sotiles, de Freitas and Wypych2025). Their amphiphilic nature allows them to anchor at oil–water interfaces, and their surface charge can be modulated through pH or ionic-strength adjustments (Assunção Dorigon et al., Reference Assunção Dorigon, Araújo Pessoa, Queiroz Neto, Andrade Silva, Soares Filho and Silva Curbelo2025). Additionally, their biocompatibility and low-toxicity profile render them suitable for applications in food, cosmetics, pharmaceutical, and agricultural formulations (Venkataramani et al., Reference Venkataramani, Tsulaia and Amin2020; Guin et al., Reference Guin, Singh and De2025).
Despite their potential, the application of natural aluminosilicate clays in Pickering emulsions is not yet fully understood or optimized. Some studies have focused on synthetic or modified particles, whereas natural clays often used in their raw or minimally treated form are under-explored. The complexity of their structure, polydispersity, and surface chemistry presents both challenges and opportunities for developing stable emulsions with tailored properties (Chakrabarty et al., Reference Chakrabarty, Ponnupandian, Naskar and Singha2016; Cherian et al., Reference Cherian, Tharayil, Varghese, Antony, Kargarzadeh, Chirayil and Thomas2022).
Emulsions are prepared by high-shear homogenization, and three key variables are studied: clay concentration, oil-phase volume fraction, and pH of the aqueous phase. Each of these factors influences emulsion properties in different ways. The concentration of clay affects the surface coverage of droplets, as too little leads to incomplete coverage and coalescence, while excess particles may form aggregates (Binks et al., Reference Binks, Clint and Whitby2005; Binks and Horozov, Reference Binks and Horozov2006). The oil-phase fraction determines the number of droplets and the system’s droplet packing density (Assunção Dorigon et al., Reference Assunção Dorigon, Araújo Pessoa, Queiroz Neto, Andrade Silva, Soares Filho and Silva Curbelo2025). Similarly, pH affects the surface charge of the clays, altering their dispersion in the aqueous phase and their affinity for the oil–water interface (Ikem et al., Reference Ikem, Menner, Bismarck and Norman2014; Lisuzzo et al., Reference Lisuzzo, Cavallaro, Milioto and Lazzara2022).
To optimize these conditions, a central composite design was implemented, and the experimental results were fitted using response surface methodology (RSM). This statistical approach allowed for the exploration of interaction effects and the prediction of optimal conditions with a reduced number of experiments (Sadeghian et al., Reference Sadeghian, Sadeghi, Hesampour and Moheb2015; Yu et al., Reference Yu, Li, Stubbs and Lau2021; Tan et al., Reference Tan, Cui, Jiang, Jiang, Huang, Li, Tang and Feng2025). The primary response variables such as droplet-size distribution and emulsion stability (measured via creaming index and visual inspection) were used to evaluate formulation performance (Ikem et al., Reference Ikem, Menner, Bismarck and Norman2014; Lisuzzo et al., Reference Lisuzzo, Cavallaro, Milioto and Lazzara2022). Furthermore, the tunability of the system through physical parameters (such as pH and concentration) and statistical modeling underscored the potential for customization in industrial formulations (Chevalier and Bolzinger, Reference Chevalier and Bolzinger2013; Sadeghian et al., Reference Sadeghian, Sadeghi, Hesampour and Moheb2015).
The novelty of this work lay in three key aspects: (1) the systematic optimization of natural, unmodified aluminosilicate clays (bentonite and kaolin) as Pickering stabilizers without chemical surface modification, relying solely on mechanical processing and ionic strength adjustment; (2) the comprehensive characterization linking mineralogical properties (hardness, plasticity, crystallinity) to both milling efficiency and emulsion performance; and (3) the application of RSM to establish a predictive framework for tailoring clay-stabilized emulsions. Unlike previous studies that predominantly employ synthetic clays such as Laponite, surface-modified particles, or surfactant co-stabilization, this approach demonstrated that natural clays could achieve comparable stability through physical optimization alone, offering a more sustainable and economically viable alternative for industrial applications.
Although natural aluminosilicate matrices are sustainable alternatives for stabilizing multiphase systems, their complex mineralogical variability in hardness and plasticity causes processing unpredictability and leaves their surfactant free stabilization mechanisms unresolved. To address this fundamental limitation, this study investigated the hypothesis that the interfacial assembly and steric barrier efficiency of raw clay minerals can be governed precisely through physical processing parameters alone. Specifically, tailoring high-energy comminution intervals to match the specific mineralogical profiles of bentonite (montmorillonite-rich) and kaolin (kaolinite-rich) deposits, combined with systematic ionic strength adjustments, would yield optimized crystalline fractions capable of assembling a rigid, three-dimensional colloidal armature at the oil–water boundary. Consequently, the objective of the present research was to establish a predictive multi-variable framework using RSM to isolate the coupled effects of raw clay concentration, oil-phase volume fraction, and processing dynamics on creaming kinetics, while fundamentally elucidating the underlying stabilization mechanisms through a comprehensive analysis of the localized interfacial microstructure and bulk viscoelastic networks of the optimized clay armor.
Materials and methods
Materials
Bentonite and kaolin powders were obtained from commercial Costa Rican suppliers, Sun Products International and Química Macías S.A., respectively. Mineral oil was also acquired from Química Macías S.A. (San José, Costa Rica). In addition, sodium chloride was purchased from Merck (Darmstadt, Germany), while fluorescein 5(6)-isothiocyanate (FITC), Nile Red, ethanol, and distilled water were obtained from Sigma-Aldrich (St Louis, MO, USA). Both clays were used as received, without additional purification, salt removal, or fractionation. The presence of non-clay mineral phases and potential residual salts from the geological deposit were accounted for during spectroscopic and diffraction characterization, as detailed in the Results and Discussion section below.
Clay processing and characterization
Ball milling and particle-size experiments
Clays (bentonite and kaolin) were pulverized using a high-energy planetary micro mill (PULVERISETTE 7, Fritsch GmBH, Germany) as reported elsewhere (Hernández-Varela et al., Reference Hernández-Varela, Chanona-Pérez, Calderón Benavides, Cervantes Sodi and Vicente-Flores2021; Arredondo-Tamayo et al., Reference Arredondo-Tamayo, Méndez-Méndez, Chanona-Pérez, Hernández-Varela, González-Victoriano, Gallegos-Cerda and Martínez-Mercado2022). A dry milling process was performed with agate balls (<5 mm) at different times (0, 30, 60, 90, and 120 min) with a ratio of 1:72 (g material/no. balls), a grinding velocity of 800 rpm, and 5 min milling with 5 min pauses. Furthermore, clays were kept in sealed bags before analysis. Meanwhile, the clay-particle size distribution was evaluated through a laser diffraction particle-size analyzer (Mastersizer 3000, Malvern Panalytical Ltd, UK) in wet dispersion mode at 2000 rpm and 60% sonication amplitude. Thus, Skempton’s activity (A c) is defined in Eqn 1:

where PI is the plasticity index (%) and CF is the clay fraction (%, particles <2 μm). Also, the initial moisture content of each clay was determined gravimetrically by drying samples at 105°C to constant weight. This parameter was used to evaluate the appropriate milling duration for each material. Finally, for image analysis, light microscopy images of clay powders at each milling time were acquired using a reflected light microscope (Motic, PSM-1000, China) coupled with a digital camera (Moticam 1080, China) and optical objective of 5×. Images were recorded in .tif format and analyzed using ImageJ software version 1.47 (National Institutes of Health, USA).
Spectroscopy studies in clays
The structural and mineralogical properties of the clays before and after ball milling were characterized by Fourier transform infrared spectroscopy (FTIR) and X-ray diffraction (XRD), toevaluate modifications in functional group bonding arrangements and crystallographic phase composition, respectively. For FTIR spectra, samples were processed using a spectrometer (Varian 640, ALT LLC, USA). Samples were mixed with a KBr disk and recorded over the range 450–4000 cm–1, at a 32 scans rate, and a 4 cm–1 spectral resolution. For XRD patterns, a diffractometer (D8 Advance, Bruker, USA) with Cu-Kα radiation (λ = 0.15406 nm) from 10 to 50°2θ, using a step size of 0.02°2θ, and a counting time of 0.5 s per step, with a silicon strip detector (LynxEye, Bruker, USA) was used to acquire crystallographic information. Minerals were identified by XRD using the peaks listed below, with data presented as follows:
-
- Montmorillonite in the bentonite for air-dried, room-temperature treatments were identified at 11.0°2θ (d = 8.01 Å, 002 peak), 19.9°2θ (d = 4.46 Å, peak 020, 110) and 35.0°2θ (d = 2.56 Å, peak 130, 200) (Brindley, Reference Brindley1977; Bayliss, Reference Bayliss1989).
-
- Cristobalite was identified at 21.9°2θ (d = 4.06 Å, peak 101), and 36.3°2θ (d = 2.47 Å, peak 112) (Downs and Palmer, Reference Downs and Palmer1994).
Moreover, the primary peaks are presented below:
-
- Kaolinite peaks and data were identified at 21.4°2θ (d = 4.15 Å, peak 111) and 24.9°2θ (d = 3.57 Å, peak 002) (Zvyagin, Reference Zvyagin1960), while a non-resolved contribution for peak 020 occurs near 19.9°2θ (d = 4.46 Å).
-
- Mullite at 16.4°2θ (d = 5.40 Å, peak 110), 25.9°2θ (d = 3.44 Å, peak 120), 26.2°2θ (d = 3.40 Å, peak 210), 30.9°2θ (d = 2.89 Å, peak 001), 33.1°2θ (d = 2.70 Å, peak 220), 35.2°2θ (d = 2.55 Å, peak 111), 37.0°2θ (d = 2.43 Å, peak 130), 39.2°2θ (d = 2.30 Å, peak 201) and 40.8°2θ (d = 2.21 Å, peak 121) (Li et al., Reference Li, Li and Stott2004).
-
- Quartz at 20.9°2θ (d = 4.26 Å, peak 100), 26.6°2θ (d = 3.35 Å, peak 101), 36.5°2θ (d = 2.46 Å, peak 110), 39.4°2θ (d = 2.29 Å, peak 102), 40.3°2θ (d = 2.24 Å, peak 111), 42.4°2θ (d = 2.13 Å, peak 200), and 45.8°2θ (d = 1.98 Å, peak 201).
-
- Corundum at 25.6°2θ (d = 3.48 Å, peak 012), 35.1°2θ (d = 2.55 Å, peak 104) and 43.4°2θ (d = 2.08 Å, peak 113) (Adamis and Williams, Reference Adamis and Williams2005).
The crystallinity index (CI, %) was calculated by the deconvolution method reported by Kathirselvam et al. (Reference Kathirselvam, Kumaravel, Arthanarieswaran and Saravanakumar2019) using the contribution of amorphous (a) and crystalline (cr) contributions separated from the XRD spectrum by a Gaussian curve-fitting method. The CI calculation was performed using Eqn 2:

where S a is the amorphous integrated area and S cr is the sum of integrated areas of the selected crystalline peaks. In addition, the crystallite size (D hkl, nm) was calculated using Scherrer’s equation:

where K is Scherrer’s constant (0.89), λ is the wavelength of radiation (0.15406 nm) and β is the FWHM in radians of the deconvoluted crystalline peak at the crystallographic planes with θ in radians; corresponding d spacings were calculated via Bragg’s law (d = λ/2sinθ) (Bragg and Bragg, Reference Bragg and Bragg1913; Hernández-Varela et al., Reference Hernández-Varela, Chanona-Pérez, Calderón Benavides, Cervantes Sodi and Vicente-Flores2021).
Microscopy studies for clays
Microstructural changes in bentonite and kaolin samples were observed using scanning electron microscopy (SEM) including scanning transmission electron microscopy (STEM), and by transmission electron microscopy (TEM). First, SEM images were acquired (Sigma 300, Bruker, USA) and then water-dispersed samples were prepared. A drop was deposited on double-carbon tape and mounted in aluminum holders for air-drying. Samples were then coated with gold using an ionizer (EMS-150RS, Quorum, USA) and were observed at 15 kV accelerating voltage, with 8.8 mm as the working distance and magnifications of 600×, 3700× and 1071× with a secondary electron detector. Second, the as-milled samples were dispersed in water (1 mg L–1) and the same microscope was used to observe the STEM images. Each sample was deposited on a lacey carbon grid (200 mesh) and dried for 4 days in a desiccator. Finally, TEM images were acquired using the same grids under the field emission electron microscope (HT 7700, Hitachi, Japan) at a working distance of 4.3 mm, magnification of 42,000×, and accelerating voltage of 15 kV. The resulting images for STEM were analyzed using ImageJ software version 1.47 (http://imagej.nih.gov; National Institute of Health, USA) and SigmaPlot software version 16.0 (Systat Software Inc., USA) for a non-linear least-squares regression analysis. The goodness-of-fit of the models was evaluated by their coefficient of determination (R 2). The TEM images were analyzed using the GMS 3 software package (Gatan Microscopy, USA) and ImageJ for image analysis.
Emulsion preparation and stability studies
Clay and mineral-oil emulsions were prepared via the emulsion cross-linking technique using the methodology proposed by Wang and Alvarado (Reference Wang and Alvarado2011) with some modifications. The selected as-milled bentonite (30 min) and kaolin (120 min) were dispersed in water to separate only the nanometric fraction (i.e. particle size of 10–100 nm). For that, samples were centrifuged at 3000 rpm for 3 min, and the supernatant was re-dispersed and centrifuged at 9000 rpm for 5 min. The samples were dried until a fine powder was obtained.
To prepare the oil-in-water (O/W) Pickering emulsions, the nanometric fraction of bentonite and kaolin was dispersed in a 51 mM NaCl solution at 3000 rpm for 1 min using a high-speed homogenizer (T18 Ultra-turrax, IKA Works Inc., USA). Mineral oil was then added drop by drop, and mixed for 2 min at 10,000 rpm for bentonite and 15,000 rpm for kaolin. O/W emulsions were prepared at different concentrations in order to perform an optimization by using clays at 1–4% w/v for bentonite, 4–9% w/v for kaolin, and mineral oil at 10, 20, 30, 40 and 50% v/v for both with a final volume of 10 mL. The O/W composition was chosen based on preliminary experiments in which the emulsion was formed.
The optimization procedure was based on the experiment proposed by Yu et al. (Reference Yu, Li, Stubbs and Lau2021) with some modifications. O/W emulsions were transferred to test tubes and left at room temperature for 48 h. Then, the height of creamed emulsion phase in the test tube (he) and the height of the total fluid, which is the creamed emulsion phase + resolved water phase (ht), were measured. A stability factor (Rh) was used to characterize the emulsion stability against creaming. Rh was calculated from he/ht. A greater Rh means a better emulsion stability against creaming.
Finally, the Rh results from the different O/W emulsions prepared were plotted using the ‘Curve Fitting Toolbox’ plug-in from MATLAB software (R2024b, The MathWorks Inc., USA). This plug-in facilitates the evaluation of the different times of emulsification and the behavior tendency to achieve the best and most stable emulsion for characterization.
Characterization of selected emulsions
Microscopy analysis
Microstructural phases in emulsion formation were observed using an epifluorescence microscope (Eclipse Ti2, Nikon, Japan). The ‘dying’ of the clay and oil phases was based on the methodology published by Garcia and Whitby (Reference Garcia and Whitby2012). For the oil phase, a solution of Red Nile at 0.2 mg mL–1 was used and the oil was rested for 10 min in preparation for dying. The clays were dyed using FITC at 0.1% for 10 min and then washed until no residue was observed. Next, the emulsion was prepared, choosing the more stable one by controlling the variables for formation as presented in the section ‘Microscopy studies for clays’ above. A drop of emulsion was set in a slide and was closed using a coverslip before drying. The observation was made using 465 and 525 nm filters for green and red, respectively. Furthermore, the same selected emulsion for bentonite and kaolin was observed using a SEM (JS-IT500, JEOL, Japan) in low-vacuum mode along with a cryogenic temperature. The images of the emulsion were acquired using backscattered electrons at 10.5 mm working distance and 15 kV. In cryo-SEM, the samples were cooled using a Peltier module to achieve –20°C at 60 Pa with autonomous refrigeration and a temperature precision of ±1.5°C or 2%. In both techniques, images were saved in .tif format and analyzed using ImageJ software.
Spectroscopy analysis (EDX)
Energy-dispersive X-ray spectroscopy (EDX) measurements of clays and emulsions were performed using SEM equipment (JSM-IT500, JEOL, Japan) equipped with an EX-14500U4L2Q DrySD JEOL device along with SDD (Silicon Drift Detector) technology, a nominal detector area of ~60 mm2, as well as energy resolution of ≤129 eV with a Schottky-field emitter. The software InTouchScope (JEOL, Japan) was used for measurements and data analysis. Each sample was analyzed in three different areas and the mean values for the elements were determined.
Rheology studies for selected emulsions
Rheological measurements were conducted on each stable emulsion. A fresh sample of each emulsion and its rheological behavior was studied using a stress-controlled rheometer (ARES- G2, TA Instruments, USA) equipped with 25 mm geometrical parallel plates and a 1 mm gap, using the TRIOS software for the operation. All measurements were conducted at a constant temperature of 25.0±0.1°C using a Peltier system (Wang and Alvarado, Reference Wang and Alvarado2011).
The shear stress curve was obtained during both the ascending and descending phases using shear rate ranges of 1–500 s–1 in order to determine the flow behavior and fluid type. The coefficient of variation (CV) between both curves was calculated to assess time dependency or independence. The experimental data were fitted to various rheological models using Origin Pro 8 software. The samples were analyzed in triplicate.
Results and Discussion
Ball milling, particle size, and mechanical strength properties
The results of grinding studies for the preparation of ball-milled clays from bentonite and kaolin, and their light microscopy images, provide data on particle size and texture for various milling times (0, 30, 60, 90, 120 min) (Figs 1 and 2). A reduction in nanometric size was recorded as grinding time increased from 30 to 120 min, attributed to the high rate of energy input generated by ball velocity during milling (Klinkov et al., Reference Klinkov, Kosarev, Chesnokov, Smirnov and Vidyuk2021). For bentonite, the largest submicron (nanometric) fraction (68.6%) occurred when ground for 30 min (Fig. 1c), while for kaolin, the largest nanometric fraction (16.1%) was achieved at 120 min milling time. After this time, an agglomeration of the particles caused by rolling-type granulation was observed for bentonite (Fig. 1i) (Hernández-Varela et al., Reference Hernández-Varela, Chanona-Pérez, Calderón Benavides, Cervantes Sodi and Vicente-Flores2021; Klinkov et al., Reference Klinkov, Kosarev, Chesnokov, Smirnov and Vidyuk2021). However, the nanometric fraction increased between 30 and 120 min of milling time for kaolin (Fig. 2c–i).
Histograms of particle-size distribution (a, c, e, g, i) and light microscopy images (b, d, f, h, j) of bentonite for control (zero grinding) and various milling times (0, 30, 60, 90, 120 min).

Figure 1. Long description
The figure consists of five rows, each representing a milling time: 0, 30, 60, 90, and 120 minutes.
Row 1 (0 min - Control): Panel a is a line graph with Y-axis Volume % from 0 to 6 and X-axis Size in micrometers on a logarithmic scale from 0.01 to 1000. A single large peak is centered around 10 micrometers. Nanometric fraction (10-100 nm) is 0.0%. Panel b is a micrograph showing a few large, dark, irregular particles against a white background with a 50 micrometer scale bar.
Row 2 (30 min): Panel c shows a dominant peak at 0.05 micrometers and smaller peaks between 0.5 and 5 micrometers. Nanometric fraction is 68.6%. Panel d shows many fine, barely visible specks and a few small dark dots.
Row 3 (60 min): Panel e shows the primary peak at 0.05 micrometers slightly lower than before, with a broader secondary peak around 3 micrometers. Nanometric fraction is 54.2%. Panel f shows a high density of small black dots distributed across the field.
Row 4 (90 min): Panel g shows the first peak decreasing further and the second peak around 5 micrometers becoming more prominent. Nanometric fraction is 11.8%. Panel h shows particles beginning to cluster or aggregate.
Row 5 (120 min): Panel i shows the nanometric peak almost disappeared, with two major peaks now at 0.6 and 4 micrometers. Nanometric fraction is 0.7%. Panel j shows large, dark, rounded aggregates of particles, indicating significant re-agglomeration.
Histograms of particle-size distribution (a, c, e, g, i) and light microscopy images (b, d, f, h, j) of kaolin for control (zero grinding) and various milling times (0, 30, 60, 90, 120 min).
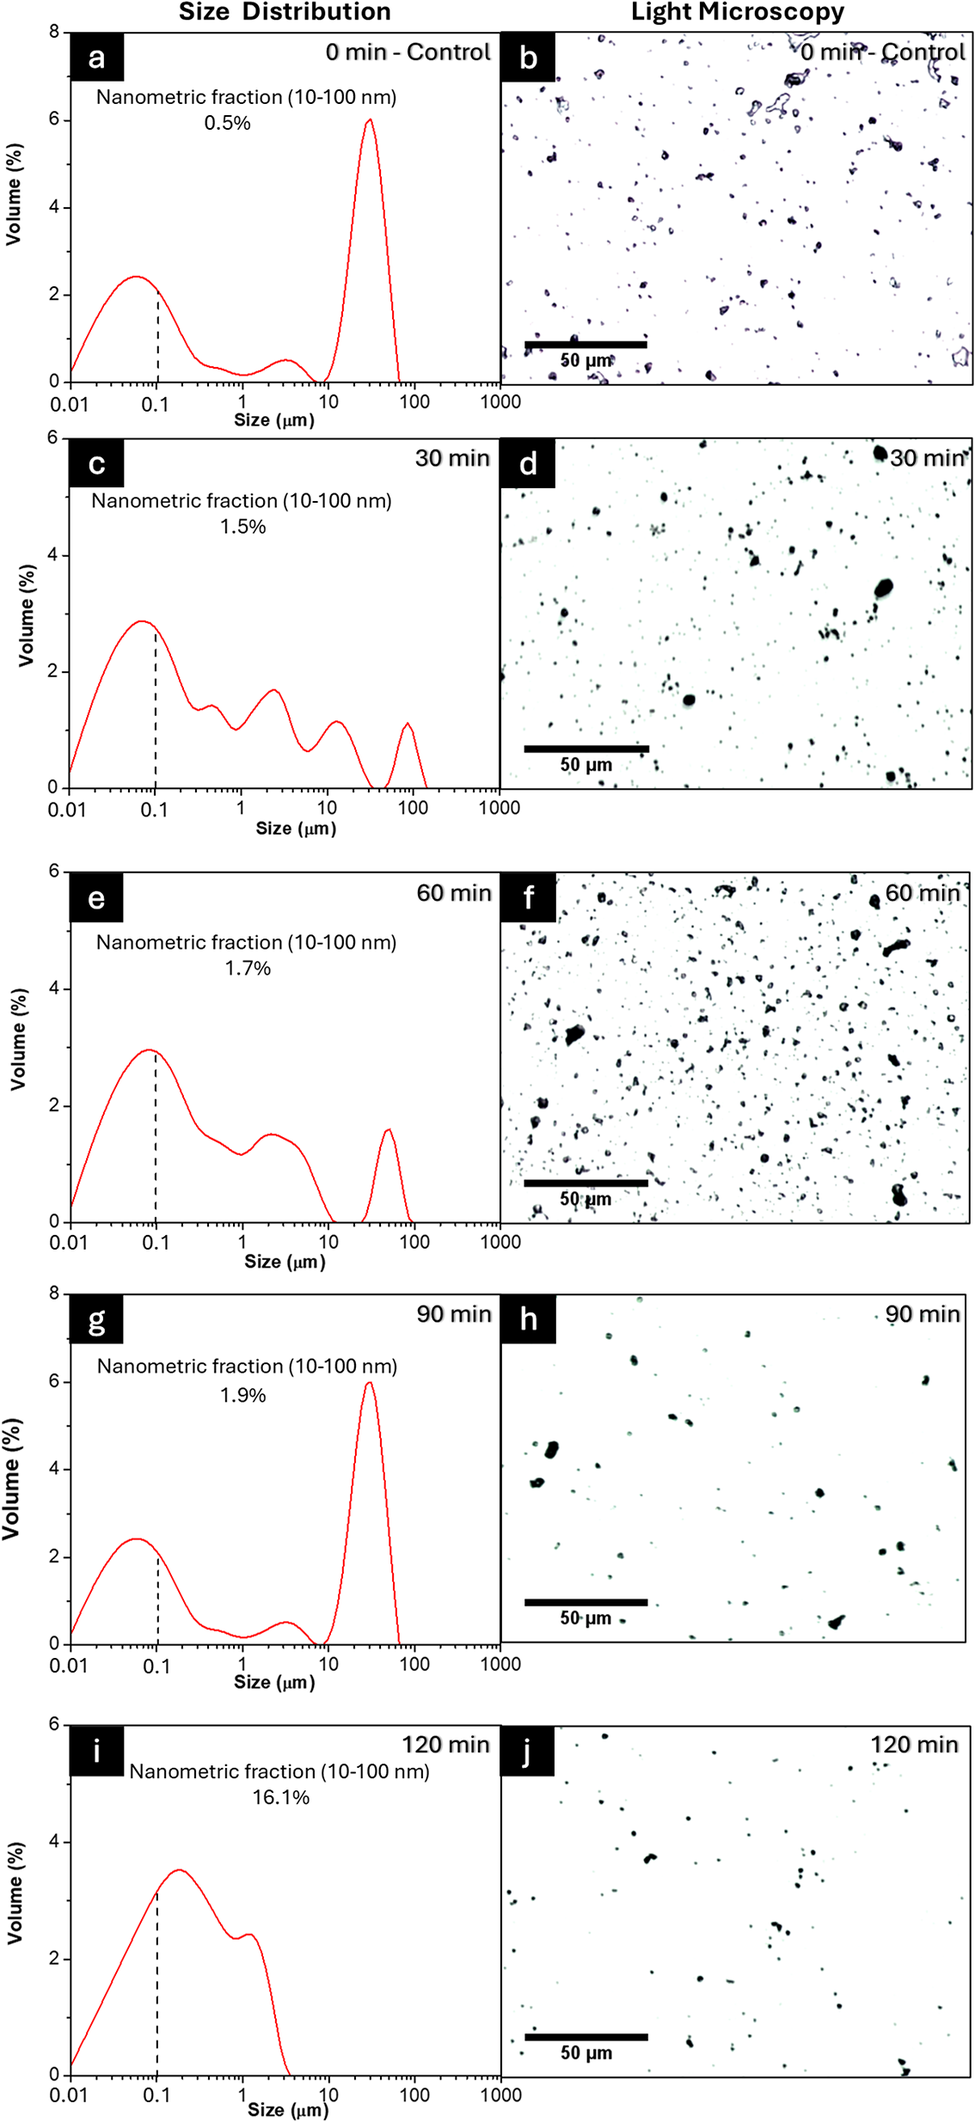
Figure 2. Long description
The figure consists of five rows. Each row contains a line graph on the left and a micrograph on the right. All graphs plot Volume percentage on the Y-axis (0 to 8) against Size in micrometers on a logarithmic X-axis (0.01 to 1000). A vertical dashed line marks 0.1 micrometers.
* Row 1 (0 min - Control): Panel a shows a bimodal distribution with peaks at 0.05 and 30 micrometers. Nanometric fraction is 0.5%. Panel b shows sparse, large irregular particles.
* Row 2 (30 min): Panel c shows a broader distribution with multiple small peaks between 0.1 and 100 micrometers. Nanometric fraction is 1.5%. Panel d shows a higher density of smaller dark spots.
* Row 3 (60 min): Panel e shows a dominant peak at 0.1 micrometers and a smaller peak at 50 micrometers. Nanometric fraction is 1.7%. Panel f shows a very high density of fine particles.
* Row 4 (90 min): Panel g shows a return to a bimodal state with a high peak at 30 micrometers. Nanometric fraction is 1.9%. Panel h shows fewer, larger clusters compared to 60 minutes.
* Row 5 (120 min): Panel i shows a single broad peak centered near 0.2 micrometers, with the distribution ending before 10 micrometers. Nanometric fraction increases significantly to 16.1%. Panel j shows a uniform distribution of very fine particles.
All micrographs include a 50 micrometer scale bar.
Several clay properties such as particle size and shape, surface chemistry, surface area, surface charge, viscosity, plasticity, strength, absorption, and adsorption (Murray, Reference Murray1999) can be analyzed for specific applications. The particle size of bentonite changed drastically after 120 min, and nearly the entire nanometric fraction had agglomerated to bentonite, whereas for kaolin, this change remained negligible. This agglomeration was attributed to the plasticity of the material as the plastic limit (PL) of bentonite is ~50–100, while for kaolin it is between 25 and 40 (Wagner, Reference Wagner2013). Thus, when a material has greater plasticity, the drastic increase in temperature during the rapid grinding of balls increases the local plastic deformation of the treated powder particles (Wagner, Reference Wagner2013; Klinkov et al., Reference Klinkov, Kosarev, Chesnokov, Smirnov and Vidyuk2021).
The swelling potential of the clays was assessed using Skempton’s activity (A c) as shown in Eqn 1. Bentonite showed an A c value of 5.4, classifying it as an active clay, while kaolin showed a value of 0.5, classifying it as inactive (Wagner, Reference Wagner2013). This value is related to water absorption as the activity tended to increase when more moisture from the medium was absorbed to the clays. For this reason, the initial moisture of the material needed to be considered when evaluating the proper milling time of the samples.
Thus, bentonite had a moisture percentage of 16.08±0.02% and kaolin had an equivalent value of 8.25±0.58%. Finally, the relative mechanical resistance of each clay was referenced using Mohs hardness values reported in the literature (Murray, Reference Murray1999). While the Mohs scale formally measures scratch resistance on mineral surfaces and is not directly applicable to powdered materials, it serves in comminution science as a widely accepted proxy for the lattice fracture resistance of a mineral under impact loading and was used here as a comparative index to rationalize differences in milling response between the two clays.
Regarding hardness measurements, bentonite shows half the hardness (1–2) of kaolin (2–2.5) on the Mohs scale. These values are useful for tuning the milling time and expected yield of nanometric fraction. Similarly, hardness results correlate to the amount of deformation that occurs during ball grinding, e.g. grain boundaries, dislocations, and chemical group exposures. In terms of strength, not only are these values related to the difference between the times selected for milling, but also to the yields of nanometric fraction obtained. In addition, the deformation that occurs during ball grinding causes imperfections in the network, such as grain boundaries, dislocations, and chemical group exposures (Rizzo and Peterson, Reference Rizzo and Peterson2024). The presence of imperfections in the samples causes changes in the FTIR peaks and XRD patterns of clays. First, changes in functional group intensity observed by FTIR analysis reflected the compositional and structural modifications induced by milling (Razavi-Tousi and Szpunar, Reference Razavi-Tousi and Szpunar2015). Secondly, a greater number of crystalline imperfections in the lattice causes wider peaks in the XRD patterns which lead to noticeable changes in the samples (Fil et al., Reference Fil, Özmetin and Korkmaz2014; Razavi-Tousi and Szpunar, Reference Razavi-Tousi and Szpunar2015). The mechanical strength properties of the clays governed the magnitude of these structural changes directly. Bentonite, with a Mohs hardness of 1–2 and a high Skempton activity of 5.4, is a mechanically soft and highly plastic material. Its low resistance to deformation means that even short milling times (30 min) are sufficient to induce substantial crystallite size reduction (from 10.4 to 9.0 nm).
However, this same plasticity promotes agglomeration at extended milling times, explaining the recovery of CI and D hkl values observed beyond 60 min. In contrast, kaolin is harder (2–2.5 Mohs) and has low Skempton activity (0.5), reflecting a rigid, non-swelling structure with greater mechanical resistance. Consequently, kaolin requires prolonged milling (up to 120 min) to achieve progressive but continuous structural degradation. These contrasting mechanical responses are also reflected in the FTIR spectra explained below, where bentonite shows more intense band modifications at shorter milling times, while kaolin band changes accumulate gradually with increasing milling duration.
Structural and crystallographic characterization
The FTIR spectra of bentonite and kaolin for control (i.e. before milling) and after various milling times (30, 60, 90, 120 min) are shown in Figs 3a and 3b, respectively; in particular, the bands in the region 950–1100 cm–1 correspond to a stretching vibration of the Si-O group split into a sharp band at 1033 cm–1 with a shoulder of ~1088 cm–1 which is attributed to perpendicular Si–O stretching. These signals are common for clays as their structure is based on aluminosilicates formed by polyatomic anions consisting of silicon and oxygen (Khang et al., Reference Khang, Korovkin and Ananyeva2016). Furthermore, a symmetric OH stretching at ~3450 cm–1 and the H-O-H bending at 1637 cm–1 are related to the different signal found in the chemical structure of the clays (Khang et al., Reference Khang, Korovkin and Ananyeva2016; Jozanikohan and Abarghooei, Reference Jozanikohan and Abarghooei2022).
(a,b) FTIR spectra and (c,d) XRD patterns of bentonite and kaolin at control and after various milling times (30, 60, 90, 120 min). Dashed vertical lines indicate the positions of the chemical groups (a and b) and main crystalline reflections (c and d). Annotated peaks (red arrows) correspond to priority reflections selected for crystallite size analysis (D hkl) showing the peak and d spacing.

Figure 3. Long description
Panels a and b show F T I R spectra for Bentonite and Kaolin respectively. The x-axis is Wavenumber in cm super minus 1 from 4000 to 500. The y-axis is Transmittance in arbitrary units. In both panels, five curves are stacked vertically: Control (dark blue), 30 min (black), 60 min (red), 90 min (green), and 120 min (light blue). Major absorption bands are marked by dashed vertical lines at approximately 3600, 3400, 1650, 1050, 800, and 500 cm super minus 1. As milling time increases, the intensity of the bands generally decreases and peaks become broader.
Panels c and d show X R D patterns for Bentonite and Kaolin. The x-axis is degrees 2 theta from 10 to 50. The y-axis is Intensity in arbitrary units. The same five-color milling time sequence is used.
In Panel c (Bentonite), red arrows point to three priority reflections:
1. (0 0 2) at 8.01 Angstroms.
2. (0 2 0, 1 1 0) at 4.46 Angstroms.
3. (1 3 0, 2 0 0) at 2.56 Angstroms.
In Panel d (Kaolin), red arrows point to two priority reflections:
1. (1 1 1) at 4.15 Angstroms.
2. (0 0 2) at 3.57 Angstroms.
In both X R D panels, the sharp crystalline peaks observed in the Control samples gradually diminish in height and increase in width as milling time progresses from 30 to 120 minutes, indicating a reduction in crystallite size and loss of crystallinity.
These signals increased from the control to the 120 min ball milling due to exposure of functional groups based on the grinding mechanism. In addition, Figs 3c and 3d show the XRD patterns for both clays and their respective crystalline peaks. For bentonite (Fig. 3c), the material exhibited a laminar structure with a greater degree of swelling as a result of the Skempton activity. Montmorillonite-type clay minerals are composed of small particles which appear as aggregates of irregular or hexagonal layers with interlayer spaces where water and exchangeable cations (Na+, Ca2+, Mg2+) are housed (Adamis and Williams, Reference Adamis and Williams2005).
In the XRD analysis (Fig. 3c), the main peaks and d spacings related to this montmorillonite-rich structure are associated with peak values shown in the figure (Cuevas et al., Reference Cuevas, Cabrera, Fernández, Mota-Heredia, Fernández, Torres, Turrero and Ruiz2022). These peaks are present and annotated with a red arrow in Fig. 3c. In addition to the montmorillonite reflections, peaks attributable to cristobalite were identified at d = 4.06 Å (21.9°2θ, peak 101) and d = 2.47 Å (36.3°2θ, peak 112) (Downs and Palmer, Reference Downs and Palmer1994) consistent with the presence of this accessory silica phase in the commercial bentonite. These non-clay reflections were excluded from the CI and D hkl calculations, which were based solely on the montmorillonite-assigned peaks (Supplementary material, Table S1). Also, the (002) reflection at d = 8.01 Å implies a basal spacing d 001 ≈ 16 Å, consistent with an air-dried, divalent-cation (Ca/Mg) hydrated montmorillonite; the (001) reflection itself lies below the 10°2θ lower limit of the scanned range.
Moreover, in kaolin (Fig. 3d), the pattern is dominated by the kaolinite reflections, most notably the (
$ \overline{1}11 $
 ) peak at 21.4°2θ (d = 4.15 Å) and the (002) peak at 24.9°2θ (d = 3.57 Å), used for the CI calculation, with the (002) reflection employed for the D
hkl calculations (see the Materials and Methods section for the full peak assignments), consistent with the tetrahedral silica and octahedral alumina sheets of this mineral. The reflection at 26.6°2θ (d = 3.35 Å) is attributed to the (101) peak of quartz, a common impurity in commercial kaolin deposits (Adamis and Williams, Reference Adamis and Williams2005). Additional reflections consistent with mullite and corundum were also identified (Table S1). These accessory-phase contributions were considered and excluded from the CI and D
hkl calculations, which were based exclusively on the kaolinite-assigned reflections. Thus, the hydroxyl groups of the octahedral sheet bond with the oxygens of the tetrahedral sheet of the consecutive layer on the kaolinite crystal (de Souza Machado et al., Reference de Souza Machado, Hazt, Sotiles, de Freitas and Wypych2025). The structural load of the crystal is non-existent, and there are no molecules or cations present in the interlayer space. Several peaks in the kaolin XRD pattern correspond to accessory non-clay mineral phases (quartz, mullite, and corundum).
Therefore, the surface area of kaolinite is reduced to the outer surface area and the edge surface area (Adamis and Williams, Reference Adamis and Williams2005). This particular formation reveals greater stability, durability, high thermal resistance, and mechanical resistance to thermal shock (Moreno and Scian, Reference Moreno and Scian2015; Romero et al., Reference Romero, Padilla, Contreras and Lopez-Delgado2021). These mechanical-strength properties make the changes in XRD peaks minimal compared with montmorillonite. In addition, the resistance to thermal shock also favors low plasticity and agglomeration of the particles. In addition, no major changes were detected in the XRD peak positions; however, subtle changes directly affected the material’s crystallinity index and crystallite size, providing further reason to calculate and discuss these variables.
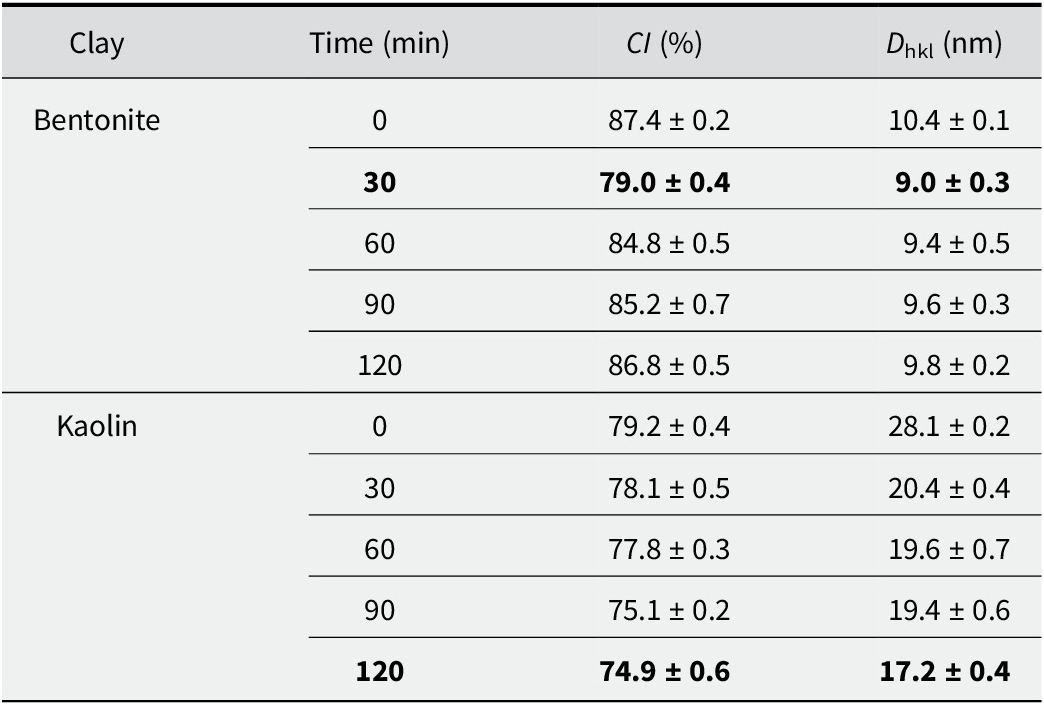
The effect of ball-milling time on the crystallinity index (CI) and crystallite size (D hkl) of bentonite and kaolin clays is summarized in Table 1. The two clays exhibited distinct behaviors under mechanical stress. For bentonite, a non-monotonic trend in the values was observed. Initially, a milling time of 30 min caused a sharp decrease in CI from 87.4% (control) to 79.0% accompanied by a reduction in D hkl from 10.4 to 9.0 nm. However, extending the milling time from 60 to 120 min resulted in a gradual recovery in both parameters.
Crystallinity index (CI, %) and crystallite size (D hkl, nm) for air-dried bentonite and kaolin for control and after various milling times

Table 1. Long description
The table consists of four columns: Clay, Time in minutes, C I (percent), and D sub h k l in nanometers. Data is presented as means plus or minus standard deviation.
Bentonite data:
* 0 minutes: C I 87.4 plus or minus 0.2; D sub h k l 10.4 plus or minus 0.1.
* 30 minutes: C I 79.0 plus or minus 0.4; D sub h k l 9.0 plus or minus 0.3.
* 60 minutes: C I 84.8 plus or minus 0.5; D sub h k l 9.4 plus or minus 0.5.
* 90 minutes: C I 85.2 plus or minus 0.7; D sub h k l 9.6 plus or minus 0.3.
* 120 minutes: C I 86.8 plus or minus 0.5; D sub h k l 9.8 plus or minus 0.2.
Kaolin data:
* 0 minutes: C I 79.2 plus or minus 0.4; D sub h k l 28.1 plus or minus 0.2.
* 30 minutes: C I 78.1 plus or minus 0.5; D sub h k l 20.4 plus or minus 0.4.
* 60 minutes: C I 77.8 plus or minus 0.3; D sub h k l 19.6 plus or minus 0.7.
* 90 minutes: C I 75.1 plus or minus 0.2; D sub h k l 19.4 plus or minus 0.6.
* 120 minutes: C I 74.9 plus or minus 0.6; D sub h k l 17.2 plus or minus 0.4.
Results are expressed as means ± standard deviation. The signal used for D hkl was the montmorillonite (020,110) reflection at ~19.9°2θ (d ≈ 4.46 Å) for bentonite, and the kaolinite (002) reflection at ~24.9°2θ (d ≈ 3.57 Å) for kaolin.
After 120 min, the CI rebounded to 86.8%, a value statistically comparable to the unmilled control, while the crystallite size increased to 9.8 nm. In contrast, kaolin showed a progressive trend of structural degradation. The CI decreased continuously from 79.2% at 0 min to 74.9% after 120 min. Similarly, the D hkl exhibited a steady reduction, dropping from 28.1 to 17.2 nm over the same period. Notably, the most significant reduction in kaolin crystallite size occurred between 0 and 60 min, after which the rate of size reduction appeared to plateau. Mechanical milling induces continuous fragmentation in the initially larger kaolin crystallites, whereas the significantly smaller bentonite domains exhibit a trend reversal attributed to the agglomeration of nanoparticles (Banik et al., Reference Banik, Jahan, Mostofa, Kabir, Sharmin, Rahman and Ahmed2015; Klinkov et al., Reference Klinkov, Kosarev, Chesnokov, Smirnov and Vidyuk2021).
This means that surface-energy effects promote the re-association of crystallites rather than further size reduction (Khier et al., Reference Khier, Abdelghani, Okba, Maouche and Said2021). These values suggest that composition, morphology, and particle sizes are key parameters for evaluating the final material to be used. For this, microstructural morphology was examined by SEM (Fig. 4), while chemical composition was assessed by EDX point analysis (Table S2, Supplementary material). The data corroborated the ranges of aluminosilicates present in each sample in such a way that the kaolin sample had an Al:Si ratio of 1:1 and bentonite a 1:4 ratio. In addition, elemental EDX analysis confirmed the presence of characteristic clay cations (Na, Mg, Ca, K), which exist as interlayer and structural constituents within the silicate framework rather than as separate oxide phases. This corroborates the suggestion that such clays are largely heterogeneous materials, the exact compositions of which vary based on their geographic origin (Kgabi and Ambushe, Reference Kgabi and Ambushe2023).
SEM images of bentonite (a–c) and kaolin (d–f) clay samples. (a) Untreated bentonite control (0 min); (b) magnified region (indicated by the red box); (c) high-magnification view of bentonite after 30 min of milling; (d) untreated kaolin control (0 min); (e) magnified region (red box); (f) high-magnification view of kaolin after 120 min of milling.

Figure 4. Long description
The figure consists of six panels arranged in two rows.
Top row (Bentonite):
* Panel a: A wide-field S E M micrograph of untreated bentonite control at 0 minutes. It shows scattered, irregularly shaped particles on a smooth background. A red box on the left highlights a single particle. Scale bar is 20 micrometers.
* Panel b: A magnified view of the particle from the red box in panel a. The particle appears as a dense, textured cluster with a rough surface. Labelled 30 minutes with a 2 micrometer scale bar.
* Panel c: A high-magnification view of bentonite after 30 minutes of milling. The surface is covered in fine, cracked textures and small granular debris. Labelled 30 minutes with a 1 micrometer scale bar.
Bottom row (Kaolin):
* Panel d: A wide-field S E M micrograph of untreated kaolin control at 0 minutes. It shows a large, fractured cluster of particles. A red box highlights a specific area of the cluster. Scale bar is 20 micrometers.
* Panel e: A magnified view of the region in the red box from panel d. It reveals a highly porous, flaky, and layered structure. Labelled 120 minutes with a 2 micrometer scale bar.
* Panel f: A high-magnification view of kaolin after 120 minutes of milling. The surface is relatively smooth with several distinct, blocky, and rounded micro-particles scattered across it. Labelled 120 minutes with a 1 micrometer scale bar.
Microstructural analysis
To corroborate the structural and crystallographic characterization found in previous analysis (FTIR and XRD; Fig. 3), a microscopy analysis was applied for both bentonite and kaolin. The SEM images of bentonite and kaolin clays for control (0 min) and selected milling times (30 and 120 min, respectively) are shown in Fig. 4.
Before grinding some laminar shapes of bentonite (Fig. 4b), characteristic of clay platelets, were observed, while after grinding the particle size was reduced to <1 μm. These particles showed irregular and wider particle-size distribution based on the interlayer spaces in the clay that allows the mechanical breakage and exfoliation processes to be carried out easily. Spherical shapes were identified in the kaolin particles (Fig. 4d,e), with additional crystals exhibiting ordered morphologies and defined geometries (Fig. 4f). However, Fig. 4c shows spherical shapes and a narrower distribution, as well as a more controlled reduction process caused by the strong interactions between the silica and alumina sheets as evaluated in the previous discussion in Fig. 1.
For a detailed comparison at the nanometric scale, Fig. 5 shows the STEM images, particle-size distribution histograms, and TEM images of bentonite (30 min milling) and kaolin (120 min milling). The low-magnification STEM image of bentonite (Fig. 5a) reveals a heterogeneous field of very dense, irregularly shaped particle regions with no preferential orientation, indicating that mechanical fragmentation produced randomly distributed aggregates rather than discrete primary particles.
(a, d) Low-magnification STEM images; (b, e) particle-size distribution histograms; and (c, f) high-magnification TEM images of ball-milled bentonite (30 min) and kaolin (120 min), respectively.

Figure 5. Long description
The figure is organized into two rows. The top row (panels a, b, c) represents Bentonite milled for 30 min. The bottom row (panels d, e, f) represents Kaolin milled for 120 min.
Panels a and d: S T E M micrographs. Panel a shows sparse, dark, irregular particles on a white background with a 300 nm scale bar. Panel d shows similar dark particles with a 300 nm scale bar.
Panels b and e: Histograms showing Frequency (%) on the y-axis from 0 to 40 and Size (nm) on the x-axis from 0 to 400.
- Panel b (Bentonite) shows a broad distribution with a peak frequency around 25% at 78.6 nm. A black trend line shows a primary peak and a smaller secondary peak near 250 nm.
- Panel e (Kaolin) shows a narrower distribution shifted to the left. The peak frequency is approximately 35% at 41.5 nm. The black trend line shows a sharp primary peak and a very small secondary peak near 150 nm.
Panels c and f: High-magnification T E M micrographs with 50 nm scale bars.
- Panel c shows clusters of spherical particles with red measurement lines indicating diameters of 34.8 nm and 46.2 nm.
- Panel f shows denser clusters of particles with red measurement lines indicating diameters of 38.7 nm and 46.4 nm.
This disordered assembly is consistent with the high plasticity of montmorillonite, which promotes inter-particle adhesion upon impact during milling. The particle-size distribution histogram (Fig. 5b) derived from STEM image analysis confirms this, showing a broad log-normal distribution with a mean particle size of 78.6 nm and a wide spread, reflecting the polydisperse nature of the bentonite aggregates. The high-magnification TEM image (Fig. 5c) provides direct structural evidence that bentonite exists as soft, loosely bound clusters rather than well-dispersed individual crystallites, with diffuse aggregate boundaries suggesting weak inter-particle interactions. Regarding the kaolin sample, the low-magnification STEM image (Fig. 5d) reveals a comparably dense distribution of dark particle regions but with a notably more uniform spatial arrangement, reflecting the greater structural rigidity of the kaolinite–mullite matrix.
The particle-size distribution histogram of the kaolin (Fig. 5e) shows a significantly sharper and narrower distribution with a mean particle size of 41.5 nm, indicating a more controlled and homogeneous fragmentation process during prolonged milling. The high-magnification TEM image (Fig. 5f) confirms the clustered morphology of the kaolin particles, which, while morphologically similar to bentonite, is composed of smaller and more compact fundamental units.
This size difference is significant, as smaller particles provide a greater surface area per unit mass, enhancing interfacial coverage and packing efficiency at the oil–water interface (Zhang et al., Reference Zhang, Zhu and Wang2008). Taken together, the STEM (Fig. 5a,d) and TEM (Fig. 5c,f) images reveal that both clay materials share a common aggregated assembly mode, forming soft clusters rather than well-dispersed primary particles. However, the fundamental difference in mean particle size of 78.6 nm for bentonite versus 41.5 nm for kaolin, has direct implications for their behavior as Pickering stabilizers, even when TEM images show similar sizes for bentonite and kaolin.
Thus, the smaller kaolin units are capable of forming a denser and more rigid interfacial armor around oil droplets, as later confirmed by rheological analysis. Figure S1 (Supplementary material) reveals a more fragmented and irregular aggregate morphology for bentonite, consistent with the disordered laminar structure of montmorillonite after mechanical stress. In contrast, Fig. S2 (Supplementary material) displays more laminar, ordered, and pseudo-hexagonal particle shapes in the kaolin sample. This ordered morphology corresponds to the kaolinite or metakaolinite fraction, as the structural rigidity of the kaolinite layers resists complete amorphization even after milling for 120 min, resulting in a mixed material containing both residual crystalline phases and amorphous domains. The presence of a metakaolinite-like amorphous phase is supported by the FTIR spectra (Fig. 3b), where progressive broadening and attenuation of the characteristic kaolinite OH-stretching bands (~3620 and ~3695 cm-1) and Al-OH deformation band (~910 cm-1) are observed with increasing milling time, consistent with partial dehydroxylation and structural collapse induced by mechanochemical energy input. Correspondingly, the XRD patterns (Fig. 3d) show a steady decrease in crystallinity index and broadening of reflections, corroborating the transition toward an amorphous, metakaolinite-like phase (Al-Ani and Sarapää, Reference Al-Ani and Sarapää2008; Muñoz-Gimena et al., Reference Muñoz-Gimena, Oliver-Cuenca, Peponi and López2023).
Emulsion preparation and stability optimization (RSM)
The finest fraction of the selected milled samples was separated for the preparation of the emulsions, yielding a nanometric fraction close to 70% for both clays (Fig. 6a,b). The formation of O/W emulsions, as well as the emulsifying ability of the clay particles, was controlled by the surface charge of clay particles. Due to the adsorption of hydroxyl ions in water, the oil–water interface also possessed a negative charge. Fine particles could accumulate at the interface to reduce the interfacial energy. For clay particles, a decreased surface charge was beneficial for adsorption on the oil–water interface (Yu et al., Reference Yu, Li, Stubbs and Lau2021; Tan et al., Reference Tan, Cui, Jiang, Jiang, Huang, Li, Tang and Feng2025). Bentonite exhibited a zeta potential of –37.8±4.9 mV, whereas kaolin showed a value of 1.83±9.09 mV. Because the kaolin value is so close to zero, the particles possessed minimal electrostatic repulsion. Consequently, they tended to aggregate before reaching the oil–water interface, which hindered their ability to stabilize an emulsion. To address this, 51 mM NaCl was added to improve dispersion without inducing flocculation. This concentration is notably lower than those reported by other authors (Yu et al., Reference Yu, Li, Stubbs and Lau2021; Tan et al., Reference Tan, Cui, Jiang, Jiang, Huang, Li, Tang and Feng2025), a difference attributed to the lower zeta potential in this system, which necessitates reduced salinity levels to avoid flocculation.
(a, b) Histogram of the selected nanometric fractions (dashed line) of bentonite and kaolin of the selected ball milling samples to prepare the Pickering emulsion; (c–h) response surfaces of emulsion stability as a function of clay:oil ratio at various times (5, 24, 48 h).

Figure 6. Long description
The figure contains eight panels labeled a through h.
Top row: Two line graphs showing Size Distribution.
Panel a: Bentonite at 30 min. The x-axis is Size in micrometers on a logarithmic scale from 0.01 to 1000. The y-axis is Volume %. A blue curve peaks at approximately 0.08 micrometers. A dashed vertical line marks 0.1 micrometers. Text indicates Nanometric Fraction 10-100 nanometers is 72.7%.
Panel b: Kaolin at 120 min. Similar axes to panel a. A red curve peaks near 0.09 micrometers. Text indicates Nanometric Fraction 10-100 nanometers is 74.4%.
Rows 2-4: Six 3D response surface plots showing Stability % on the vertical z-axis (0 to 100), Oil % on the right x-axis (10 to 50), and Clay % on the left y-axis. A color scale from blue (0) to dark red (100) represents stability.
Row 2 (5 h):
Panel c: Bentonite (1-4%). Stability is highest (red) at high bentonite and low oil concentrations, dropping sharply as oil increases.
Panel d: Kaolin (4-9%). Stability shows a broad high plateau (red) across most kaolin concentrations at low oil levels.
Row 3 (24 h):
Panel e: Bentonite. The high-stability region (red) shrinks slightly compared to 5 h.
Panel f: Kaolin. The stability surface remains relatively consistent with the 5 h state.
Row 4 (48 h):
Panel g: Bentonite. Further reduction in the high-stability area, with more yellow and green regions appearing at higher oil percentages.
Panel h: Kaolin. Maintains a large high-stability plateau, showing greater long-term stability than bentonite.
The RSM plots for each formulation screening across three different time intervals of 5, 24, and 48 h are shown in Fig. 6c–h. For bentonite, a 4% clay concentration was required for stabilization, with differences in stability relative to the oil fraction becoming apparent only after 48 h (Fig. 6g). Therefore, a prolonged stability study was conducted over 30 days (see Fig. S3, Supplementary material), which indicated that the 50:50 O/W ratio exhibited the greatest stability. In contrast, the kaolin samples required significantly greater clay percentages, as concentrations of <4% failed to stabilize the emulsion. This pattern favored a 50:50 O/W ratio with greater clay concentrations of 6% and 9% at 24 and 48 h (Figs 6f and 6h, respectively). The stability of these samples over a 21-day period is illustrated in Fig. S4 (Supplementary material), confirming that the emulsion with 9% kaolin was the most stable. These emulsions were stabilized solely by natural clays and the adjustment of the isoelectric point via medium salinity. This distinguishes the present work from the majority of existing studies, which rely on surface modifications (Binks et al., Reference Binks, Clint and Whitby2005; Huang et al., Reference Huang, Gao and Wang2012; Tan et al., Reference Tan, Cui, Jiang, Jiang, Huang, Li, Tang and Feng2025), co-polymers (Chakrabarty et al., Reference Chakrabarty, Ponnupandian, Naskar and Singha2016), synthetic clays such as Laponite (Garcia and Whitby, Reference Garcia and Whitby2012) or combinations of Laponite with surfactants, co-polymers, or surface modifications (Teixeira et al., Reference Teixeira, McKenzie, Boyd and Bon2011; Zheng et al., Reference Zheng, Zheng, Carr, Yu, McClements and Bhatia2020; Ni et al., Reference Ni, Shi, Zhang, Liu, Wang and Cheng2023).
Rheological behavior of selected emulsions
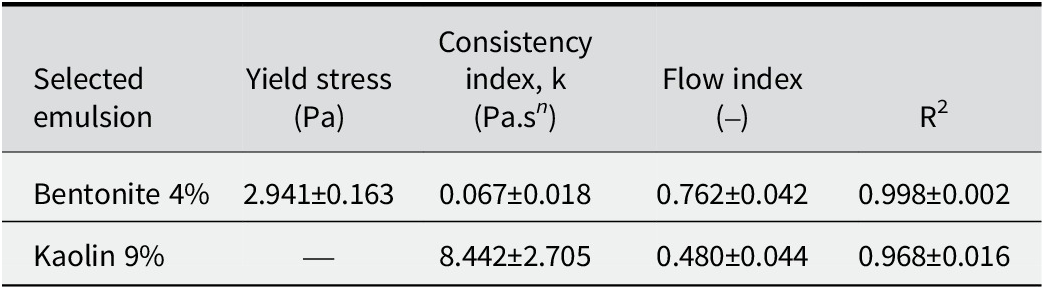
The rheology study results for emulsions containing bentonite are shown in Fig. 7a,c and for kaolin in Fig. 7b,d, selected from the RSM analysis. These emulsions were formulated as 50:50 O/W systems with bentonite at 4% and kaolin at 9% concentrations, respectively. Also, Table 2 shows the mathematical model fitting parameters and flow indices for the emulsions. Both emulsions exhibited viscoelastic fluid behavior (see the shear rate graphs in Fig. 7). Moreover, the bentonite emulsion was time-independent, whereas the kaolin emulsion was time-dependent, exhibiting a corresponding behavior. This difference in behavior may be attributed to the stable organization of the bentonite network. In contrast, shear forces in the kaolin system favored particle alignment, leading to an increase in viscosity (Fig. 7c,d).
Rheology studies for emulsion of clay and oil using values of 50:50 O/W 4% for bentonite and 50:50 O/W 9% for kaolin.

Figure 7. Long description
The figure consists of four panels arranged in a two-by-two grid.
Panel a, top-left, labeled Bentonite. The x-axis is Shear rate (1/s) from 0 to 500. The y-axis is Stress (dyne/cm super 2) from 0 to 180. Two overlapping curves, ascent (blue circles) and descent (orange squares), show a non-linear increase. The stress starts at approximately 30 and rises to 110 at a shear rate of 500.
Panel b, bottom-left, labeled Kaolin. The x-axis is Shear rate (1/s) from 0 to 500. The y-axis is Stress (dyne/cm super 2) from 0 to 180. The ascent and descent curves show a steeper non-linear increase compared to bentonite, starting near 15 and reaching approximately 175 at a shear rate of 500.
Panel c, top-right, corresponds to the bentonite sample. The x-axis is Shear rate (1/s) from 0 to 500. The y-axis is Viscosity (Pa dot s) from 0.0 to 2.0. A red line with diamond markers shows a sharp asymptotic decay, starting near 2.0 and dropping rapidly to near 0.0 as the shear rate increases beyond 100.
Panel d, bottom-right, corresponds to the kaolin sample. The x-axis is Shear rate (1/s) from 0 to 500. The y-axis is Viscosity (Pa dot s) from 0.0 to 2.0. The red line shows a similar asymptotic decay but starts at a much lower initial viscosity of approximately 0.7, leveling off toward 0.0.
Mathematical-model fitting parameters and flow indices for the emulsions
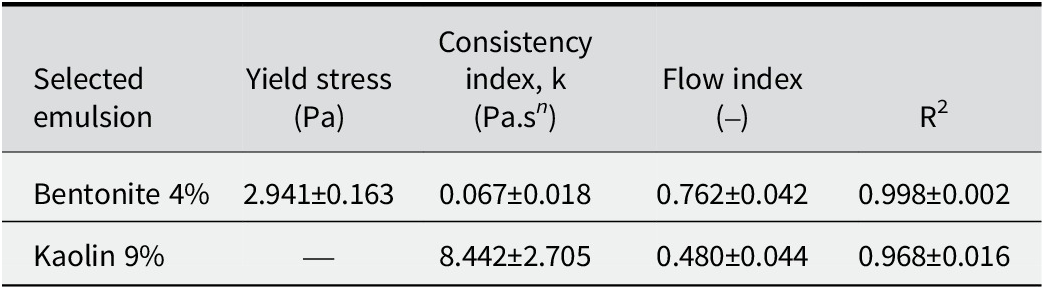
Table 2. Long description
The table consists of five columns and three rows including the header.
Column headers from left to right are:
1. Selected emulsion.
2. Yield stress in P a.
3. Consistency index, k in P a dot s super n.
4. Flow index.
5. R super 2.
Row 1 data for Bentonite 4 percent:
- Yield stress: 2.941 plus or minus 0.163.
- Consistency index: 0.067 plus or minus 0.018.
- Flow index: 0.762 plus or minus 0.042.
- R super 2: 0.998 plus or minus 0.002.
Row 2 data for Kaolin 9 percent:
- Yield stress: Not applicable (indicated by a dash).
- Consistency index: 8.442 plus or minus 2.705.
- Flow index: 0.480 plus or minus 0.044.
- R super 2: 0.968 plus or minus 0.016.
Another factor contributing to this disparity is particle concentration, as the lower concentration of bentonite favors fluidity. However, with the significantly higher clay-particle concentrations in the kaolin emulsion (9% w/v) compared with the bentonite emulsion (4% w/v), representing a more than twofold increase, the probability of inter-particle collisions increases, thereby enhancing the potential for structural rearrangement (Abend et al., Reference Abend, Bonnke, Gutschner and Lagaly1998; Binks and Horozov, Reference Binks and Horozov2006). The kaolin emulsion showed greater apparent viscosity than the bentonite emulsion, as reflected by the consistency index values in Table 2 (k = 8.44±2.71 vs 0.07±0.02 Pa·sⁿ, respectively). This is attributed to the smaller droplet sizes and, consequently, a lower R d, defined as the ratio of the oil droplet core radius (r) to the total droplet radius including the clay interfacial shell (R) (Pal, Reference Pal2018). A smaller R d value indicates a proportionally thicker interfacial clay layer. R d was estimated from cryo-SEM images by measuring both radii using ImageJ image analysis, as presented in the next section.
Given that the nanoparticles employed are of similar size, this results in a greater particle density at the interface and increased rigidity, which is reflected in the greater viscosity. Furthermore, the solid coverage of the interfacial layer prevents stress transmission from the continuous phase to the droplet interior. Therefore, the system exhibits solid sphere rheological behavior, indicating the formation of a three-dimensional network or a rigid interface. The emulsions displayed shear-thickening behavior at intermediate shear rates. This phenomenon is frequently observed in suspensions of rigid particles that tend to form particle networks, but not in traditional emulsions (Pal, Reference Pal2018). This increase in viscosity also reduces droplet mobility, thereby retarding coalescence and gravitational separation (Jeon and Hong, Reference Jeon and Hong2014).
For the bentonite emulsion (Table 2), fitting to the Herschel–Bulkley is widely recognized as the most suitable approach for describing the rheology of natural clays (Jeong et al., Reference Jeong, Locat and Leroueil2012; Jeon and Hong, Reference Jeon and Hong2014). The model provided an excellent fit, yielding a low, positive yield stress (
$ {\tau}_0 $
 ≈ 2.94±0.16 Pa), a reduced consistency index (k ≈ 0.067±0.018 Pa.s
n), and a flow index (n = 0.762±0.042) indicating moderate pseudoplasticity. These values describe a weak yet present network, as particles adsorbed at the interface and inter-droplet bridges generate a microstructure capable of resisting flow at very low rates, which gradually breaks down under shear. This is consistent with soft flocculation or bridging and partial interfacial coverage of the droplets by exfoliated particles.
Regarding the kaolin emulsion, data were fitted to the Power Law model, as the Herschel–Bulkley analysis revealed no significant yield stress (
$ {\tau}_0 $
 ≈ 0), indicating the absence of a detectable yield point within the evaluated shear rate range. The relatively high consistency index (k ≈ 8.442±2.705 Pa.s
n) suggests a well-developed microstructure driven by strong interactions between droplets and interfacial nanoparticles. The observed variability between replicates reflects slight differences in dispersion or continuous phase fraction, a phenomenon expected in heterogeneous systems stabilized by solid particles. The flow index of n = 0.480±0.044 indicates pseudoplastic behavior associated with a dense network, high effective solid fraction, and large specific surface area. This structure creates significant flow resistance at low shear rates but collapses rapidly under shear, resulting in reduced apparent viscosity. The slightly lower fit quality observed is attributed to the high solid content, where shearing induces the rearrangement not only of the interfacial clay armor but also of particles suspended in the continuous phase, potentially generating aggregates and increasing sample heterogeneity.
Microstructural validation of selected emulsions
To provide a better understanding of these results and corroborate the rheological findings, a microstructural analysis of the emulsions was performed using fluorescence microscopy, as shown in Fig. 8. For bentonite and kaolin, Nile Red was used to stain the oil phase (Fig. 8b,f), demonstrating that in both cases, the oil corresponded to the dispersed internal phase, confirming the formation of O/W emulsions. Simultaneously, the clays were stained with FITC (green; Fig. 8c,g). The visualization of the droplets indicated that they were effectively coated by the clay particles as reported elsewhere for other emulsions (Wang and Alvarado, Reference Wang and Alvarado2011; Zheng et al., Reference Zheng, Zheng, Carr, Yu, McClements and Bhatia2020; Tan et al., Reference Tan, Cui, Jiang, Jiang, Huang, Li, Tang and Feng2025). In the merged images (Fig. 8d,h), the phase containing the oil and clay interaction was clearly denoted in yellow, while a distinct green external border was visible, corresponding to the clay shell. These phase assignments are grounded in the selective dye chemistry: Nile Red exclusively partitions into hydrophobic environments (oil droplets), while FITC binds covalently to surface hydroxyl groups on the clay particles, ensuring that the red, green, and yellow domains in the merged images correspond unambiguously to oil, clay, and the clay-coated droplet interface, respectively.
Fluorescence micrographs of emulsions based on oil, bentonite (a–d), and kaolin (e–h) clays. Fluorescence in red is related to Nile Red dyeing oil in the core, while green fluorescence is associated with FITC dyeing clays in the surface.

Figure 8. Long description
A grid of eight micrographs organized into two rows and four columns. Each panel includes a 100 micrometer scale bar in the bottom right.
Top Row: Bentonite clay emulsions.
* Panel a: Control brightfield view showing a dense distribution of spherical droplets of varying sizes.
* Panel b: Nile Red channel showing the oil cores of the droplets fluorescing in red.
* Panel c: F I T C channel showing the clay particles fluorescing in green.
* Panel d: Merged view. Arrows point to a single droplet, identifying the yellow-red center as the Core and the bright green outer ring as the Surface.
Bottom Row: Kaolin clay emulsions.
* Panel e: Control brightfield view showing smaller, more tightly packed droplets compared to bentonite.
* Panel f: Nile Red channel with red fluorescence concentrated in the droplet centers, labeled Oil in the bottom left.
* Panel g: F I T C channel with green fluorescence on the droplet perimeters, labeled Clay in the bottom left.
* Panel h: Merged view labeled Oil plus Clay. Arrows indicate the Core and Surface, showing a distinct separation between the red oil center and the green clay shell.
This morphological evidence supports directly the rheological data as the dense clay armature provided the structural rigidity responsible for the solid sphere behavior described earlier. This droplet conformation was further corroborated by the Cryo-SEM analysis (Fig. 9). These micrographs revealed droplets coated by clay particles while some droplets exhibited complete surface coverage (Fig. 9a,c); others appeared partially coated (Fig. 9b,d). Furthermore, energy dispersive X-ray spectroscopy (EDS) mapping was employed to track the distribution of silicon, the primary constituent of the clays used. The elemental maps demonstrated clearly that silicon is localized at the interface, confirming that the physical barrier observed is indeed composed of clay particles.
Cryo-SEM images of Pickering emulsion of clay and oil. Single drop of the Pickering emulsion based on bentonite 4% (a–b) and kaolin 9% (c–d). (a) Bentonite at low magnification, (b) bentonite at high magnification with EDS Si map alongside, (c) kaolin at low magnification, (d) kaolin at high magnification with EDX Si map alongside.

Figure 9. Long description
A multi-panel display of Cryo-S E M micrographs and E D S maps.
* Top row (Bentonite 4 percent):
* Panel a: Low magnification view of a single bentonite-stabilized oil droplet, appearing as a textured, roughly circular mass against a dark background. A 10 micrometer scale bar is in the bottom right.
* Panel b: High magnification view of the droplet showing a porous, granular surface. To the right are two small square maps labeled E D S. The top map is grayscale, and the bottom map is an orange-tinted silicon (S i) map showing high concentration across the droplet area.
* Bottom row (Kaolin 9 percent):
* Panel c: Low magnification view of a kaolin-stabilized droplet, showing a more diffuse and less defined boundary compared to bentonite. A 10 micrometer scale bar is in the bottom right.
* Panel d: High magnification view of the kaolin droplet with a visible central void or depression. To the right are two small square maps. The top is grayscale, and the bottom is an orange-tinted E D X silicon (S i) map, indicating the distribution of kaolin particles on the droplet surface.
Each high-magnification panel includes a vertical intensity scale bar between the micrograph and the elemental maps.
The present findings distinguish themselves from recent clay-based Pickering emulsion studies in several key aspects. While Assunção Dorigon et al. (Reference Assunção Dorigon, Araújo Pessoa, Queiroz Neto, Andrade Silva, Soares Filho and Silva Curbelo2025) achieved stabilization using polycationic modification of montmorillonite, and Tan et al. (Reference Tan, Cui, Jiang, Jiang, Huang, Li, Tang and Feng2025) employed organosilane-modified palygorskite, the current work demonstrates that comparable stability can be achieved using unmodified natural clays through optimized mechanical processing and ionic strength adjustment alone. This approach not only reduces chemical waste and processing steps but also maintains the inherent biocompatibility and regulatory acceptance of natural minerals, critical advantages for food, and pharmaceutical applications.
Conclusions
This study has demonstrated successfully the feasibility of producing functional clays from natural bentonite and kaolin via high-energy ball milling and their subsequent application as stabilizers for Pickering emulsions. The efficiency of the comminution process was governed strictly by the intrinsic mineralogical properties of the clays. Bentonite achieved its optimal nanometric fraction (68.6%) after short milling times (30 min), limited by plasticity-induced agglomeration after extended durations. In contrast, kaolin, characterized by greater hardness and thermal resistance, required prolonged processing (120 min) but yielded a significantly sharper particle-size distribution (mean ~41.5 nm) with smaller fundamental units.
Physicochemical characterization (XRD, FTIR) confirmed that mechanical stress induced structural amorphization and crystallite-size reduction, particularly in kaolin, without destroying the essential aluminosilicate framework. These structural modifications facilitated the formation of stable O/W emulsions without the need for chemical surface modification. A significant finding was the need to adjust ionic strength (51 mM NaCl) to overcome the near-zero zeta potential of kaolin, thereby preventing premature flocculation and ensuring proper interfacial adsorption.
Rheological analysis fitted to the Herschel–Bulkley or Power Law models revealed distinct stabilization mechanisms. Bentonite emulsions formed weak, time-independent networks characterized by soft bridging. Conversely, kaolin emulsions exhibited time-dependent thixotropy, high-consistency indices, and solid sphere behavior, attributed to the formation of a rigid, dense interparticle network at the interface. This mechanism was validated conclusively by microscopy, which visualized a distinct clay armature encapsulating the oil droplets.
This study has highlighted the potential of converting natural clays into high-value nanomaterials via mechanical processing. By tuning the formulation to the specific rheological and electrostatic properties of the mineral, highly stable emulsions were engineered using eco-friendly, unmodified particles, offering a sustainable alternative to synthetic surfactants in industrial applications.
Supplementary material
The supplementary material for this article can be found at http://doi.org/10.1017/cmn.2026.10054.
Data availability statement
All data generated or analyzed during this study are included in this published article and its supplementary information files.
Acknowledgments
The authors acknowledge that part of this work was conducted at the Laboratorio de Micro y Nanobiotecnología under the supervision of Dr José Jorge Chanona Pérez during a research stay.
Author contributions
K.R.-M.: Investigation, Formal analysis, Data curation, Writing - original draft; M.L.M: Writing - review and editing, Supervision, Project administration; J.D.H.-V.: Formal analysis, Validation, Writing - original draft, Writing - review and editing, Supervision; J.J.C.-P.: Resources, Writing - review and editing; M.E.R.-O.: Data acquisition, Writing - review and editing.
Financial support
The authors gratefully acknowledge the financial support provided by the vice-rectory of research at the University of Costa Rica (project number C0529), as well as the Secretaría de Investigación y Posgrado (SIP) of the Instituto Politécnico Nacional (IPN) through grant 20251011.
Competing interests
The authors declare that they have no competing interests.
Generative AI statement
During the preparation of this work the authors used Gemini (Google) to assist with language editing and ensure manuscript compliance. After using this tool/service, the authors reviewed and edited the content as needed and take full responsibility for the resulting report.