INTRODUCTION
Northeast China (NEC) is a major maize production region and accounts for 0·30 of the total production of maize in China. The total area sown to maize in NEC exceeds 6 million ha (Ma et al. Reference Ma, Wang, Wang and Hou2008; NBSC 2001–2008). With the background of global climate change, the climate across NEC over the past 50 years has shown steady increases in mean air temperature but decreases in mean annual precipitation (Liu et al. Reference Liu, Yang, Hubbard and Lin2012). This region has suffered from frequent droughts in recent years due to the mid to high latitude location, while maize yields have clearly decreased (Ma et al. Reference Ma, Wang, Wang and Hou2008). So, the challenge to ensure stable maize yields in NEC is to assess the effects of drought risk under conditions of local climate change, as well as quantifying yield loss due to climate change.
Many indices have been used to assess agricultural drought risk in previous studies (Li et al. Reference Li, Willardson, Deng, Li and Liu2005; Sheffield et al. Reference Sheffield, Wood and Roderick2012; Dai Reference Dai2013; Van Der Schrier et al. Reference Van Der Schrier, Barichivich, Briffa and Jones2013; Beguería et al. Reference Beguería, Vicente-Serrano, Reig and Latorre2014). The standardized precipitation index (SPI) (McKenney & Rosenberg Reference McKenney and Rosenberg1993) was proposed by the World Meteorological Organization as a universal drought index (Hayes et al. Reference Hayes, Svoboda, Wall and Widhalm2011; Svoboda et al. Reference Svoboda, Hayes and Wood2012). Hulme et al. (Reference Hulme, Marsh and Jones1992) proposed a surface humid index to detect drought by considering precipitation and reference evapotranspiration (ET 0), irrespective of the crop. Crop Water Deficit Index (CWDI) in a growing season is a modified index to monitor agricultural drought risk as a percentage, based on accumulated CWDI for 10 days with different weighting factors. It can reveal the status of crop water deficiency and drought events in different agricultural areas (Zhang et al. Reference Zhang, Lv and Li2008). Some indices have proved too complex to estimate crop water requirements or to separate the sensitive climatic factor from others under global warming conditions (Trenberth et al. Reference Trenberth, Dai, Van Der Schrier, Jones, Barichivich, Briffa and Sheffield2014). Crop water deficit (CWD) is calculated based on precipitation and crop reference evapotranspiration (ET C) data in the crop growth season, and offers a good proxy to reliably and conveniently determine the risk of drought in a variety of environmental systems (Vicente-Serrano et al. Reference Vicente-Serrano, Begueria, Lorenzo-Lacruz, Camarero, López-Moreno, Azorin-Molina, Revuelto, Morán-Tejeda and Sanchez-Lorenzo2012; De la Casa & Ovando Reference De La Casa and Ovando2014). Crop water deficit is easily applied and a great aid in evaluating water supply and availability, and also offers a clear measure of drought severity (Espadafor et al. Reference Espadafor, Lorite, Gavilián and Berengena2011). Li et al. (Reference Li, Willardson, Deng, Li and Liu2005) analysed temporal and spatial distribution of CWD in NEC to investigate changes in maize water requirements.
Sensitivity analyses are very important to determine expected changes in crop water requirements in response to a known change in one climatic variable. The results of these analyses make it possible to determine the accuracy required when measuring climatic variables used to estimate CWD. Many scientists have analysed sensitivity of climatic variables in order to quantify climate change effects in different regions of the world (Irmak et al. Reference Irmak, Payero, Martin, Irmak and Howell2006; Allen & Pereira Reference Allen and Pereira2009; Tabari et al. Reference Tabari, Talaee, Some'e and Willems2014). Goyal (Reference Goyal2004) studied the sensitivity of ET 0 in arid regions of Rajasthan, and Gong et al. (Reference Gong, Xu, Chen, Halldin and Chen2006) studied the sensitivity of key meteorological variables (air temperature, wind speed, relative humidity (RH) and shortwave radiation) in the Yangtze River basin and derived the spatial variation of sensitivity coefficients by interpolation. Liang et al. (Reference Liang, Li and Liu2010) and Zhang et al. (Reference Zhang, Kang, Zhang and Liu2010) proposed RH as the most sensitive climatic variable to ET 0, and even to ET C, in NEC. Irmak et al. (Reference Irmak, Payero, Martin, Irmak and Howell2006) divided the increase and decrease in ET 0 by each daily climate variable and used the result as a basis for further sensitivity analysis (Tabari & Talaee Reference Tabari and Talaee2014).
Most previous studies used the fixed duration of one crop at a regional level to analyse water availability, without accounting for differences in crop variety, growth period or climate at different sites. Also, few studies investigated the sensitivity of each climatic variable when assessing drought risk during the potential crop growth period. Therefore, the present study aims to: (1) investigate the calculated potential maize growth periods at 68 weather stations in each year, based on daily weather data for 1961–2010; (2) assess the spatial and temporal behaviour of the relatively simple and accurate CWD index; and (3) explore the sensitivity of climatic variables related to the changes in CWD over the five decades of 1961–2010. The analysis will help in developing regional strategies to deal with drought and in making appropriate adaptations to cope with the adverse effects of future climate change.
MATERIALS AND METHODS
Description of the study region
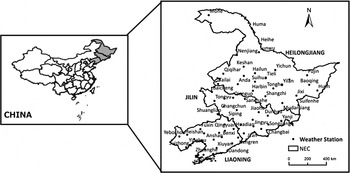
Northeast China comprises Heilongjiang, Jilin and Liaoning Provinces (Fig. 1), and has played a vital role in China's crop production and economic development because the land is fertile. The northern part of this region typically follows a one crop per year farming system, e.g. maize or rice (Yang et al. Reference Yang, Lin, Ma, Ju, Guo, Xiong, Li and Xu2007a ). The mean annual air temperature increases from north to south across NEC, ranging from −4·2 to 10·9 °C, while annual accumulated temperature above 10 °C was 2000–3200 °Cd. Annual precipitation ranges from 1070 mm in the south-east to 450 mm in the north-west, confined mostly to summer and autumn, coinciding with the maize growing season of May–September. The annual total sunshine hours has decreased over the past 50 years and was in the range of 2220–2930 h. More detailed information on the climate is provided in Table 1. To ensure better quality data, weather stations built after 1961 and stations with significant missing data were excluded. A total of 68 weather stations were selected for the study (Fig. 1).
Locations of the 68 weather stations in Northeast China.

The averages and temporal trends of mean air temperature, total precipitation and sunshine hours during the entire year across Northeast China (Liu et al. Reference Liu, Yang, Wang, Li and Zhang2009 )

Source of data
To make spatial interpolation more accurate, 68 weather stations were chosen in NEC, all of which had good-quality daily weather data for 1961–2010. Seven meteorological variables were recorded: maximum temperature (T max, °C), minimum temperature (T min, °C), precipitation (P, mm), sunshine hours (SH, h), air pressure (AP, kPa), mean wind speed (WS, m/s) and RH (%). The data were provided by the China Meteorological Administration.
Methods
Calculating the potential growth period of maize
Based on a large number of field trials, the critical minimum growth temperature for maize was defined as 8 °C across NEC (Bonhomme et al. Reference Bonhomme, Derieux and Edmeades1994; Ma Reference Ma1996; Chen et al. Reference Chen, Lei, Deng, Qian, Hoogmoed and Zhang2011). Thus, as long as mean air temperature always remained above 8 °C, the crop could grow normally (excluding effects of factors such as irrigation and fertilizer management practices).
The first day of the maize potential growth period
In the current study, the mean temperature (T avg) was obtained from the average of T max and T min. Then the 5-day moving mean temperature (T avg-5day) was used to calculate the first day of the maize potential growth period for each location and each year (Qu Reference Qu1991). The equations are as follows:
 $$\eqalign{ T_{{\rm avg} - 5{\rm day},i} &= (T_{{\rm avg},i} + T_{{\rm avg},i + 1} + T_{{\rm avg},i + 2} \cr & \quad+ T_{{\rm avg},i + 3} + T_{{\rm avg},i + 4})/5 \cr & \hskip-40pt T_{{\rm avg}} = (T_{\max } + T_{\min })/2\quad (i = 1,2,...,365 \; {\rm or } \; 366)} $$
When all moving-average temperatures, T avg-5day, were consistently above 8 °C, it was identified that maize could germinate and grow normally. The first date (D first) of T avg-5day exceeding 8 °C was regarded as the beginning of the maize potential growth season.
The end of the maize potential growth period
Maize generally ceases to grow as soon as frost appears. The first frost date was the day that T min dropped below 0 °C after maize sowing in that year and is defined as the last day of the maize potential growth period (D′end).
In NEC, the annual accumulated temperature above 10 °C (AAT10) is an important thermal index of maize growth and development (Bai et al. Reference Bai, Huo, Li, Du, He and Jiang2008; Yan et al. Reference Yan, Liu, Zhang, Li and Liu2011), which can influence maize phenology. It was calculated as the sum of the daily average air temperature above the baseline temperature 10 °C for the period with temperature difference ΔT always above 10 °C (Fischer et al. Reference Fischer, van Velthuizen, Shah and Nachtergaele2002), using the following equations:
 $$\Delta T = \left\{ {\matrix{ {T_{{\rm avg}} - 10} & {T_{{\rm avg}} {\rm \,\ges\,} 10{\rm ^\circ} {\rm C}} \cr 0 & {T_{{\rm avg}} {\rm \,\lt\,} 10{\rm ^\circ} {\rm C}} \cr}} \right.$$
 $$AAT10 = \sum\limits_{D_{{\rm first}}} ^{D^{\prime}_{{\rm ending}}} {\Delta T} $$
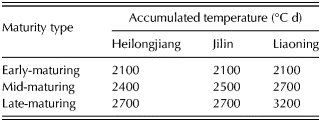
However, different maize varieties in NEC mature at different AAT10 values before frost occurs (McMaster & Wilhelm Reference McMaster and Wilhelm1997). According to division of the cooked-type maize varieties across NEC, the different AAT10 indicators were referenced according to Yang et al. (Reference Yang, Cai, Jing and Zhang2007b ), shown in Table 2. The day when maturity is reached for cooked-type maize varieties, calculated by cumulative temperature, would be earlier than the first day of frost (D′end). It defined a new index as D end – the last day of the maize potential growth period calculated by AAT10.
The annual accumulated temperature (AAT10, °C d) required for early-, mid- and late-maturing types of maize varieties in three provinces of Northeast China

Duration of the maize potential growth period
Two measurements of maize growth duration, D frost and D AAT10, are defined as the difference in maize potential growth duration between the first and last days of maize potential growth, calculated using the following equations:
 $$D_{{\rm frost}} = D^{\prime}_{{\rm end}} - D_{{\rm first}} + 1$$
 $$D_{{\rm AAT}10} = D_{{\rm end}} - D_{{\rm first}} + 1$$
The maize potential growth period was a very important and basic index in the current study, used to analyse the changes in ET 0, ET C and CWD during the maize potential period.
Cumulative frequency
Cumulative frequency is performed to obtain insight into how often a certain phenomenon (feature) occurs below a certain value. This may help to describe or explain a situation in which the phenomenon is involved, or in planning interventions. It is usually the analysis of how often, or how frequently, some situation occurs within a particular range. In the current study, the calculated first and last dates of maize potential growth duration (the ET 0 or ET C), as well as CWD during the maize potential duration, over the period 1961–2010 was affected by climate fluctuation and in some years, extreme weather conditions led to abnormal values. Therefore, to remove extreme weather events from the analysis of changes in maize potential growth period, 80% probability was defined as a threshold (Qu Reference Qu1991), i.e. when the value for any variable from a cumulative frequency curve was exceeded at 80% probability it was seen as an extreme case and not considered in the analysis. This is generally accepted as a reliable and reasonable level of probability for cumulative frequency, while levels of <50% or > 90% probability are not helpful in analysing potential cases, due to higher or lower probability (Qu Reference Qu1991).
Crop evapotranspiration and crop coefficient
The FAO Penman–Monteith method was used to calculate the daily ET 0 for all weather stations, as follows (Allen et al. Reference Allen, Pereira, Raes and Smith1998):
 $$ET_0 = \displaystyle{{0{\cdot}408\Delta (R_n - G) + \gamma \displaystyle{{900} \over {T + 273}}U_2 (e_{\rm s} - e_a )} \over {\Delta + \gamma (1 + 0{\cdot}34U_2 )}}$$
where R n was net radiation on the surface (MJ/m/d); G was soil heat flux (MJ/m/d), which was ignored due to its small magnitude; T was average air temperature (°C); U 2 was wind speed (m/s) at 2 m from the ground; e s was saturation vapour pressure (kPa); e a was actual vapour pressure (kPa); (e s–e a) was saturation vapour pressure deficit (kPa); Δ was the slope of the saturated water vapour pressure curve (kPa/°C); and γ was the psychometric constant (kPa/°C).
The effect of both crop transpiration and soil evaporation were integrated into a single crop coefficient (K C), which incorporated crop characteristics and averaged effects of evaporation from the soil (Allen et al. Reference Allen, Pereira, Raes and Smith1998). Monthly K C were obtained from Zhang & Wang (Reference Zhang and Wang1993). Default K C values for the maize potential growth period at 68 sites were calculated by spatially interpolating the observed values from the chosen or nearby sites across NEC (Ma Reference Ma1996), while the missing K C values were replaced by their nearest monthly values. The daily ET C was calculated by the daily ET 0 and K C at each station, using the following equation:
 $$ET_{\rm C} = K_{\rm C} {\cdot} ET_0 $$
Monthly or annual ET C was accumulated by daily ET C.
Crop water deficit
The impact from soil water changes was not considered in the current paper, due to limited regional soil data. In general, drought was mainly determined by two major surface hydrological processes: precipitation and crop evapotranspiration. Crop water deficit was used to express the degree of water scarcity during the maize growth period, without considering soil water condition or other hydrology factors. The equation was as follows:
 $$CWD = \displaystyle{{\sum\limits_{D_{{\rm AAT}10}} P - \sum\limits_{D_{{\rm AAT}10}} {ET_{\rm c}}} \over {\sum\limits_{D_{{\rm AAT}10}} {ET_{\rm c}}}} $$
where P and ET C were daily precipitation and crop reference evapotranspiration (mm), respectively. In the current study, due to limitations in soil data collection, potential CWD or drought risk was only analysed by CWD during the maize potential growth period across NEC. Positive values of CWD indicated wet conditions resulting from excess water (precipitation), while negative values represented dry conditions dominated by water stress.
Sensitivity of climatic variables to crop water deficit
McKenney & Rosenberg (Reference McKenney and Rosenberg1993) and Goyal (Reference Goyal2004) conducted sensitivity analyses on different variables, in which the relative changes of a climatic variable input within the relative changes of the variable output were plotted as a sensitivity coefficient (SC) curve (Zhang et al. Reference Zhang, Kang, Zhang and Liu2010). To obtain a non-dimensional SC, a normalized SC was produced using the following equation:
 $$SC = \displaystyle{{\Delta CWD/CWD} \over {\Delta CV/CV}}$$
where CWD and CV represent the base values before change of reference evapotranspiration, for CWD and climatic variable during the study period, respectively; ΔCWD is the extent of change in CWD with respect to one single element change in a climatic variable; ΔCV is the unit change of each climatic variable. An SC value of –0·1 suggests that a 10% increase in CV would decrease CWD by 1%.
RESULTS
Characteristics of the maize potential growth period
Spatial changes in the maize potential growth period
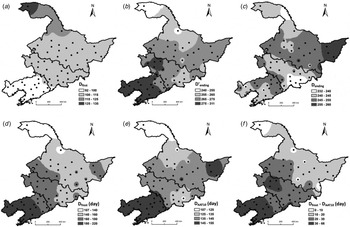
The spatial distribution of the maize calculated growth period (D frost and D AAT10) over the past 50 years is shown in Fig. 2. The spatial changes for the first and last day of the maize potential growth period across NEC are shown, at the 80% probability level. The first date of the maize potential growth period ranged from 92 to 134 Julian days over the past 50 years, going from south to north across NEC (Fig. 2(a)). The geo-spatial trend across NEC was similar to the distribution of average air temperature. The latest sowing date was around 14 May at Mohe in northern Heilongjiang, whereas the earliest sowing date was around 2 April at Dalian in southern Liaoning. The end date obtained before occurrence of the first frost day (D′end), shifted from 240 days (28 August) to 311 days (7 November) from south-west to north-east across NEC (Fig. 2(b)). Although the patterns were similar across the study provinces, there were several minor differences (Fig. 2(c)). The end date determined on the basis of different maize maturity-types (D end), ranged from 232 days (20 August) to 259 days (16 September), from south-west to north-east, respectively (Fig. 2(c)). This distribution was more like the actual situation than the results calculated using the first frost date. The maize potential growth period (D AAT10) was 141 days on average, ranging from 107 days in south-eastern Heilongjiang to 155 days in south-western Liaoning (Fig. 2(e)). The average growth duration was less than the days calculated using the first frost day (168 days) (Fig. 2(d)). The end date in Heilongjiang province, except for a region in the east of the province, was usually earlier than that in Liaoning province in any 1 year (Fig. 2(e)). Jilin Province presented a negative gradient of D AAT10 from west to east in all study years, especially in its central and eastern parts (Fig. 2(e)). The difference in days between D frost and D AAT10 increased from north to south, with a range of 0–66 days (Fig. 2(f)). It was possible that management practices (e.g. irrigation regime, fertilizer regime or sowing date) could be used to take advantage of this difference so as to enhance maize yield across NEC. Also, in the current study all data analysis was based on D AAT10, regarded as the maize potential growth period in the current study.
Distributions of the first date (a), the end date as determined by the first frost day (b) and by AAT10 (c), potential growth period by the first frost day (d) and by AAT10 (e), and difference days (f) between the potential growth periods at the 80% probability level for maize across Northeast China, 1961–2010.

Temporal changes in difference days between D frost and D AAT10
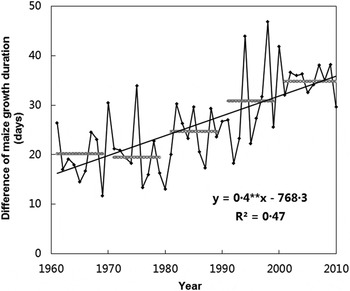
The maize growth period obtained from AAT10 differed from the calculated duration based on the first frost day (Fig. 2(f)). The differences in growth period between D frost and D AAT10 averaged over NEC is shown in Fig. 3 for the period 1961–2010. Generally, this difference between different methods of estimating maize growth periods had a significant increasing trend of 4 days/decade (P < 0·01). As the climate became warmer during 1961–2010 (Liu et al. Reference Liu, Yang, Chen and Wang2013), the average day difference was about 26 days, ranging from 11·7 (1969) to 46·9 days (1998). Before 1980, the difference increased slightly, with an average of about 20 days; however, after 1980 along with increasing temperatures in China, the day difference increased to 35 days on average in the 2000s; while the increase slowed after the 2000s. This increase in rainfall, heat and radiation available during the days of potential maize growth duration that lie between the end of D frost and that of D AAT10 could be utilized for crop growth instead of wasted in winter fallow.
The difference in potential maize growth between D′end and D end at station level across Northeast China during 1961–2010. The black line represents the trend and the grey lines represent the decadal average.

Precipitation gap during the different maize growth periods
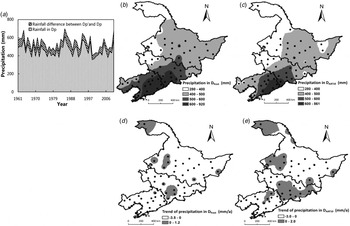
The accumulated precipitation in D frost and D AAT10 during the past 50 years, at the 80% probability level, are shown in Fig. 4(a). The diagonal hatching indicates the difference in accumulated precipitation between the two maize growth periods, in the range of 17·4 (in 2002) to 101·0 mm (in 1971); however the trend was not significant. The precipitation gap during the two calculated growth periods gradually decreased after 2000 at 4 mm per decade, due to local climatic change.
Distribution of changes in precipitation (P) during the different maize potential growth periods for Northeast China during 1961–2010. Light grey represents the average of 68 stations during the potential growth period of maize, whereas the dark grey area represents average precipitation received outside that period (a); spatial distribution of precipitation during the D frost and D AAT10 periods, 1961–2010 (b and c); and changes in precipitation received during the two growth periods (d and e).

The spatial distributions of precipitation during the D frost and D AAT10 periods are shown in Figs 4(b) and (c). Precipitation during D frost was 513·1 mm on average, in the range of 280·9 (at Mohe) to 920·4 mm (at Xiuyan) (Fig. 4(b)). However, precipitation during the D AAT10 period was 462·9 mm on average, ranging from 280·9 (at Mohe) to 861·5 mm (at Kuandian) (Fig. 4(c)). There were differences in the spatial distribution of precipitation during the two calculated growth periods, especially in the west of Heilongjiang Province and east of Liaoning Province. During the past 50 years, the spatial distribution of precipitation has changed during the D frost period, declining in western Heilongjiang and eastern Jilin, but increasing in the rest of NEC (Fig. 4(d)). The amount of precipitation (mm) showed increasing trends during the D AAT10 period for a few sites only, while decreasing amounts of precipitation (mm) was seen at most stations across NEC (Fig. 4(e)).
Changes in ET 0 and ET C
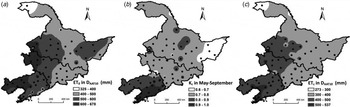
The spatial distribution of ET 0 during the D AAT10 over NEC for 1961–2010 is shown in Fig. 5(a). The ET 0 over the entire region was 530·6 mm on average, ranging from 325·1 (at Mohe in Heilongjiang) to 677·2 mm (at Chaoyang in Liaoning). The higher ET 0 values of >600 mm occurred in the central and eastern parts of NEC.
Distributions of ET 0 (a), average K C (b) and ET C (c) during the maize potential growth period (D AAT10) at the 80% probability level across Northeast China, 1961–2010.

Maize water requirements were assessed using K C, related crop characteristics and average effects of evaporation from soil in combination with ET 0 at each growth stage. Phenological K C values were revised through field trials by the Chinese Cooperative Group on Crop Water Requirement Contours and are widely used across NEC (Zhang & Wang Reference Zhang and Wang1993; Zhang et al. Reference Zhang, Zhang, Sun, Ji, Cai, Wu and Li2013). The mean K C values of maize in NEC during 1961–2010 are shown in Fig. 5(b). The estimated K C values during the maize season were in the range of 0·6–1·0, with the highest value in eastern Liaoning and the lowest in eastern Heilongjiang. This distribution followed a similar trend to the maize potential growth period. Crop reference evapotranspiration during the maize potential growth period, calculated based on K C and ET 0 from Eqn (7), decreased from the south-west to the north-east for the mean of 50 years (Fig. 5(c)). The lowest value was <300 mm at Mohe and the highest value was >500 mm at Liaoning.
Spatial distributions of crop water deficit
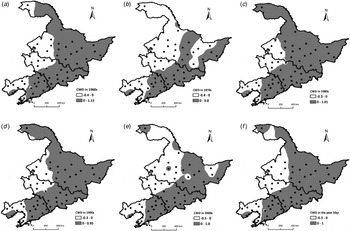
Crop water deficit, calculated based on precipitation and evapotranspiration during the same period using Eqn (8), is shown in Fig. 6. Negative CWD indicates water scarcity in the maize potential growth period. The water deficit decreased from east to west, following a similar trend to rainfall (Fig. 6(a)–(f)). The region with CWD below –30% was clearly the most drought-affected region, especially in the eastern part of NEC Fig. 6(f). The drought risk was higher in the 1970s and 2000s (Figs 6(b) and (e)), mainly in the northern and western parts of NEC. Crop water deficit in eastern Heilongjiang decreased more significantly in the 2000s than in other decades. The north-east NEC has tended to experience increasing CWD values throughout the past 50 years, and the risk of drought in the NEC Plain has become increasingly severe (Fig. 6(e)).
Distribution of average crop water deficit during the D AAT10 period at the 80% probability level during 1961–1970 (a), 1971–1980 (b), 1981–1990 (c), 1991–2000 (d), 2001–2010 (e) and averaged in 1961–2010 across Northeast China.

Sensitivity of climatic variables of crop water deficit
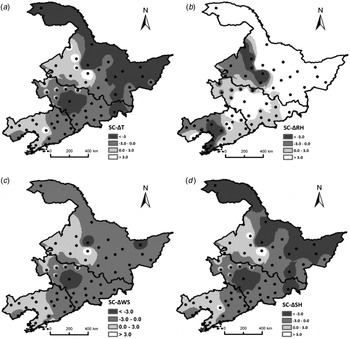
In the current study, sensitivity analysis focused mainly on the four climatic variables influencing CWD (ET 0 or ET C)–T avg, RH, WS and SH – which could evaluate the most important climatic variable for drought risk across NEC. Crop water deficit changed when any one climatic variable changed by one unit, while the other variables retained their original values. Due to changes in these variables with location, the spatial distribution of sensitivity analysis to CWD for the above four climatic variables as 50-year averages were plotted (Fig. 7). The average SCs of T avg, RH, WS and SH in NEC were −2·0, 3·6, −0·7 and −1·9, respectively. The regional SC value was most sensitive to changes of RH, followed by changes to T avg, SH and WS. The SC value was positively related to RH, in contrast to the other three sensitivity analysis results from changes of T avg, WS and SH. Apart from a few exceptional sites, the spatial distributions of SC from T avg were more negative with CWD: the regions with negative sensitivity to changes in temperature were in the south-east and the centre of NEC (Fig. 7(a)), especially in north of Heilongjiang and the middle of Jilin Province. The south-west of Heilongjiang and Liaoning Provinces were the regions with most negative sensitivity to changes in RH (Fig. 7(b)). The SC spatial distribution from change of WS also showed a decreasing trend as longitude decreased, and the highest sensitivity value was found in the NEC Plain (Fig. 7(c)). The SC spatial distribution for SH to CWD was similar to that shown in Fig. 7(a); the lowest value was in the north of Heilongjiang (Fig. 7(d)). The most sensitive regions to the four climatic variables were located at Suihua and Changchun in the middle of Heilongjiang and Jilin, respectively (Fig. 7). The north of NEC was the region most sensitive to changes in temperature and sunshine hours.
Average sensitivity coefficients values with changes to crop water deficit (CWD) in temperature (a), relative humidity (b), wind speed (c) and sunshine hours (d) in maize potential growth period in Northeast China.

DISCUSSION
In recent years, climate warming in NEC and its impact on agricultural production had caused widespread concern among scientists (Liu et al. Reference Liu, Yang, Chen and Wang2013). In the present study, based on daily weather data for 1961–2010 at 68 weather stations across NEC, the start and end dates of the maize potential growth periods for different maturity-type varieties were estimated and the spatial distribution obtained. The method for determining potential growth duration described in the current study has been widely used for estimating the growth period of different crops in China (Bonhomme et al. Reference Bonhomme, Derieux and Edmeades1994; Ma Reference Ma1996; Chen et al. Reference Chen, Lei, Deng, Qian, Hoogmoed and Zhang2011), especially when actual growth period data were not collected from one station for a long period, or from any stations for a whole region. Without considering changes of specific maize varieties at a given site, the maize potential growth period obtained by the first frost date (D frost) was in the range of 107–220 days, while the maize potential growth period D AAT10, obtained by the accumulated temperature >10 °C was 107–155 days. There was an average difference of about 26 days between these two methods across the region, ranging from 0 to 66 days. Given this difference in potential maize growth period, late-maturing maize varieties could be used to take advantage of increased precipitation or heat in order to cope with climate change, especially in the middle of Jilin Province and most of Liaoning Province. Theoretically, maize potential yield could be increased by changing to late-maturing maize varieties: local farmers could then delay harvesting of maize by several days to increase maize yield and biomass, due to the greater thermal time and precipitation available. However, they also should beware of or take precautions against agro-meteorological disasters (e.g. due to low temperature and drought) to ensure maize yields are as high as possible. Meanwhile, appropriate management practices, irrigation, fertilizer or maize variety-type could also be revised to take advantage of this period.
Reference evapotranspiration was calculated easily from long-term daily meteorological data using the FAO-56 dual crop coefficient method. Crop reference evapotranspiration has previously proved a useful and convenient method to assess water availability and drought risk (Jensen Reference Jensen and Kozlowski1968; Allen et al. Reference Allen, Pereira, Raes and Smith1998; Kang et al. Reference Kang, Gu, Du and Zhang2003), especially in regions where water is limited (Blum Reference Blum2009). It is influenced by such fundamental properties of terrestrial ecosystems as plant growth and soil moisture and is the key factor in estimating crop water requirements and in scheduling irrigation (Allen et al. Reference Allen, Pereira, Raes and Smith1998). Daily ET 0 was affected only by the daily climatic variables of a specific location (Easterling et al. Reference Easterling, Wallis, Lawrimore and Heim2007), and was not related to the specific crop (Allen et al. Reference Allen, Pereira, Raes and Smith1998). However, ET C was difficult to interpret for different locations, crops or other conditions to assess the variation of water balance without considering precipitation (Roderick & Farquhar Reference Roderick and Farquhar2002). The FAO-56 method can also be used to estimate ET C from ET 0 and K C : ET 0 depends only on climatic parameters (weather parameters measured at each station), without precipitation, while K C is generally specific to maize growth and soil condition, derived on the basis of field experiments (Allen Reference Allen2000; Kite & Droogers Reference Kite and Droogers2000; Rana & Katerji Reference Rana and Katerji2000; Ji et al. Reference Ji, Ban and Zhang2004; Vicente-Serrano et al. Reference Vicente-Serrano, Begueria, Lorenzo-Lacruz, Camarero, López-Moreno, Azorin-Molina, Revuelto, Morán-Tejeda and Sanchez-Lorenzo2012). The current results showed that these parameters had spatial distributions and enabled the reliable identification of drought-prone areas. The results shown in Fig. 5 allowed easy calculation of CWD and determination of the key climatic variables in CWD during the maize potential growth period. In contrast to other scalars used to evaluate water requirement of crops (e.g. SPI and Palmer) (Ruiz-Alvarez et al. Reference Ruiz-Alvarez, Arteaga-Ramirez, Vazquez-Pena, Ontiveros-Capurata and López-López2012), CWD was easy to obtain from equations during D AAT10. The results proved to be closely related to crop water balance and management (Li et al. Reference Li, Willardson, Deng, Li and Liu2005; Espadafor et al. Reference Espadafor, Lorite, Gavilián and Berengena2011). Crop water deficit had also previously proved to be a good predictor of the extent of yield loss in maize due to drought in Liaoning Province (Shan Reference Shan2010). Distribution of CWD did not change significantly in the east part of NEC. Crop water deficit values in the NEC Plain remained negative during 1961–2010, while drought was a major challenge to maize production in this region (Ma et al. Reference Ma, Wang, Wang and Hou2008). Precipitation was the main climatic factor affecting drought risk, therefore it is important to enhance water availability for higher maize yields. The results in Fig. 6 show that drought-tolerant and late-maturing varieties will be a better choice in the NEC Plain, while the south-eastern region could receive much more rainfall for maize growth.
Evapotranspiration was an important factor in both climate and hydrological cycles. The current investigation showed that in NEC, evapotranspiration decreased from south-west to north-east. This was a good example of the ‘evapotranspiration paradox’ proposed by Roderick & Farquhar (Reference Roderick and Farquhar2002), in which evapotranspiration decreases as temperatures increase. Although most previous studies have focused on temperature, it is not the only variable that influences evapotranspiration (McVicar et al. Reference McVicar, Roderick, Donohue, Li, Van Niel, Thomas, Grieser, Jhajharia, Himri, Mahowald, Mescherskaya, Kruger, Rehman and Dinpashoh2012); however, it was difficult to assess the integrated effects of other climatic variables. The SCs of the four weather parameters showed that RH was the most important factor affecting CWD in NEC, followed by T avg, SH and WS in that order. The most sensitive regions to climatic change, especially concerning the above four weather parameters, were in the middle of Heilongjiang and Jilin, respectively. However, the north of NEC was the region most sensitive to changes in temperature and sunshine hours. These changes should be considered carefully in this region, especially low temperature effects on early-type maize varieties. Northeast China is a semi-arid region, and the current results agree with results of experiments in Shiyang River basin, another semi-arid region (Zhang et al. Reference Zhang, Kang, Zhang and Liu2010); but differ slightly from those for Haihe River basin in a semi-humid region (Xing et al. Reference Xing, Wang, Shao, Peng, Yu, Yong and Taylor2014). It would be worthwhile to evaluate the sensitivity of each parameter of evapotranspiration in an arid region using this method to gain a better understanding of yield fluctuations with different climatic conditions.
CONCLUSIONS
The present study, based on daily weather data from 68 meteorological stations in NEC for 1961–2010, indicated that the maize potential growth period was 26 days less than that calculated using the first frost day, most likely due to differences in accumulated temperatures for different maize maturity types. Meteorological CWD for maize decreased from east to west, while NEC faced severe risks of drought over the years, especially in the 1970s and the 2000s. Relative humidity was the most sensitive weather parameter and was positively related to CWD in NEC, followed by T avg, SH and WS in that order. The regions of the middle of Heilongjiang and Jilin should take precautions concerning climatic change related to meteorological crop water deficit, while the north part of NEC should take precautions concerning changes in temperature and sunshine hours.
In the future, to adapt well to climate change, suitable crop cultivars should be chosen and the efficiency of water application increased. It is essential to adopt different water management practices and drought mitigation measures in different drought-prone areas. Better use of unexploited precipitation during the days between D end and D′end of the potential maize growth period is an important measure to deal with drought. Additionally, drought-tolerant and late-maturing crops offer a better option for the NEC Plain because the potential period of maize growth is now longer than it was in the past.
This research is part of a programme focusing on water allocation and agricultural production management in NEC supported by the National Natural Science Foundation of China (NSFC-41171410) and by the Seasonal Drought Program of the Special Fund for Agro-scientific Research in Public Interest (Grant Number: 201203031). Thanks are also due to Groundwork Special Projects for Science and Technology Research (Grant Number: 2007FY120100) and the program ‘Digital Atlas Compilation of China Agricultural Climate Resources’ for supporting this research.