


Introduction
Interactions among community members are important in creating the selective pressures that drive the evolution of natural and human-modified ecosystems (Tscharntke & Hawkins, Reference Tscharntke and Hawkins2002). Comparative studies using crops and their wild relatives have revealed that trophic interactions among plants, herbivores and their natural enemies can be altered by selection of plant attributes during the domestication process (Macfadyen & Bohan, Reference Macfadyen and Bohan2010). Anthropogenic range expansion and cultural practices have modified the distribution, abundance and genetic diversity of domesticated organisms (Doebley et al., Reference Doebley, Gaut and Smith2006), thereby altering multitrophic assemblages through space and time (Macfadyen & Bohan, Reference Macfadyen and Bohan2010). Microorganisms associated with members of a biological system represent additional layers of interactions and are strongly linked to the evolutionary outcome of multitrophic assemblages (Colwell et al., Reference Colwell, Simidu and Ohwada1996).
Strategies for conservation and plant breeding sometimes consider the use of the genetic diversity of wild-weedy-domesticated complexes to improve plant productivity by maintaining the genetic diversity of natural enemies. The study of the genetic structure of pests and their natural enemies can infer recent and ancient events that have shaped the evolution of multitrophic assemblages and the evolutionary consequences of plant domestication on an ecosystem.
The putative Mesoamerican domestication centre of the common bean, Phaseolus vulgaris L., is in a region of Mexico between the Transverse Neovolcanic Axis to the south and the southern edges of the Sierra Madre Occidental and Altiplano to the north (Kwak et al., Reference Kwak, Kami and Gepts2009). It provides an ideal system to investigate the effects of plant domestication on the genetic structure of members of a multitrophic system. Human-mediated migration has been identified as an important evolutionary factor influencing the genetic structure of the bean plants and their associated beetle populations (Gonzalez-Rodriguez et al., Reference Gonzalez-Rodriguez, Benrey, Callejas and Oyama2002; Papa & Gepts, Reference Papa and Gepts2003; Alvarez et al., Reference Alvarez, Hossaert-Mckey, Restoux, Delgado-Salinas and Benrey2007; Kwak & Gepts, Reference Kwak and Gepts2009; Restoux et al., Reference Restoux, Hossaert-Mckey, Benrey and Alvarez2010). In the present study, we examined the evolutionary history of a higher trophic level, the parasitoids. We compared these results to those from the plant and herbivorous hosts to determine if population genetic structures are congruent across trophic levels. We predicted that because parasitoids complete their development within the beetle host, the genetic structure of the host and the parasitoid would be similar or equally influenced by human-mediated migration. The intracellular endosymbiont alpha-proteobacteria Wolbachia is commonly found in numerous arthropod species (Hilgenboecker et al., Reference Hilgenboecker, Hammerstein, Schlattmann, Telschow and Werren2008). Thus, as a secondary hypothesis, we predicted a bias in the genetic structure of parasitoid populations when infected by Wolbachia due to both the hitchhiking effect of maternally inherited mtDNA haplotypes and the reproductive manipulation strategies used by the bacteria to enhance and spread infection in host populations.
The multitrophic system
Beans (Leguminosae: Phaseolus spp.) are the most important grain legumes for direct human consumption in the world (Broughton et al., Reference Broughton, Hernández, Blair, Beebe, Gepts and Vanderleyden2003). Common beans, Phaseolus vulgaris L., are the primary source of protein in Mexico, with 67% of the crop being produced on small farms (<5 ha) (Broughton et al., Reference Broughton, Hernández, Blair, Beebe, Gepts and Vanderleyden2003). Common beans are predominantly autogamous (self-fertilizing), unlike their close relative, the scarlet runner beans, Phaseolus coccineus L., which are allogamous (cross-fertilizing). Present-day domesticated bean populations from the Mesoamerican gene pool are highly differentiated (Zizumbo-Villarreal et al., Reference Zizumbo-Villarreal, Colunga-Garciamarin, Payro De La Cruz, Delgado-Valerio and Gepts2005; Kwak & Gepts, Reference Kwak and Gepts2009).
Bruchid beetles (Coleoptera: Bruchidae) are among the most important pests of bean seeds in Mexico. Bruchids develop inside the bean from the first instar to the adult stage. Two Acanthoscelides species feed on both P. vulgaris and P. coccineus bean seeds in Mexico. Acanthoscelides obvelatus Bridwell is univoltine (Alvarez et al., Reference Alvarez, Hossaert-Mckey, Rasplus, Mckey, Mercier, Soldati, Aebi, Shani and Benrey2005a) and mostly found on wild beans and at higher altitudes than its sibling species A. obtectus Say (Alvarez et al., Reference Alvarez, Mckey, Hossaert-Mckey, Born, Mercier and Benrey2005b). The multivoltine trait of A. obtectus and its ability to exploit the year-round fruiting of wild beans is likely to have favored its adaptation to granaries (Alvarez et al., Reference Alvarez, Mckey, Hossaert-Mckey, Born, Mercier and Benrey2005b). Two Zabrotes species, Z. subfasciatus Boheman and Z. sylverstris, also feed on P. vulgaris in Mexico (Romero & Johnson, Reference Romero and Johnson1999), with Z. sylverstris being predominant between altitudes of 1200 m to 2000 m (Aebi et al., Reference Aebi, Shani, Hansson, Contreras-Garduno, Mansion and Benrey2008).
Members of the genus Horismenus Walker (Hymenoptera: Chalcidoidea: Eulophidae: Entedoninae) are the most abundant parasitoids associated with wild and domesticated beans in Mexico (Hansson et al., Reference Hansson, Aebi and Benrey2004). This genus includes parasitoids and hyperparasitoids known to attack larvae of Lepidoptera, Coleoptera and Hymenoptera. Four Horismenus species (H. butcheri Hansson; Aebi & Benrey, H. depressus Gahan; H. missouriensis Ashmead; and H. productus Ashmead) have been identified from beans infested by A. obvelatus, A. obtectus, Z. subfasciatus and Z. sylverstris in Mexico (Bonet, Reference Bonet2009). A fourth rare species is currently being described using both morphological and genetic characters (Hansson, Kenyon and Benrey, unpublished data).
Wolbachia endosymbionts are known to express different lifestyles, from mutualism to parasitism (Werren et al., Reference Werren, Baldo and Clark2008). They can affect the reproductive success of their host through male-killing (Hurst et al., Reference Hurst, Jiggins, Von Der Schulenburg, Bertrand, West, Goriacheva, Zakharov, Werren, Stouthamer and Majerus1999), male feminization (Rigaud et al., Reference Rigaud, Soutygrosset, Raimond, Mocquard and Juchault1991), cytoplasmic incompatibility (Yen & Barr, Reference Yen and Barr1973) and induction of thelytokous parthenogenesis (Stouthamer & Luck, Reference Stouthamer and Luck1993). Because endosymbiotic bacteria are transmitted maternally (much like mitochondria), the hitchhiking effect associated with Wolbachia tends to alter the frequency distribution of mtDNA haplotypes in infected host populations (e.g. Charlat et al., Reference Charlat, Duplouy, Hornett, Dyson, Davies, Roderick, Wedell and Hurst2009; Yu et al., Reference Yu, Zhang, Xue and Hong2011).
Methods
Sampling
With the goal of identifying historical and contemporary factors structuring the genetic diversity of Horismenus spp. at the population scale, three regions were targeted for sampling (A, B and C; fig. 1). Small fields of local bean varieties (P. vulgaris and P. coccineus) were sampled to maximize the probability of finding beans infested with beetles since the use of pesticides is common in larger commercial fields.
Sampling sites in the southern altiplano of Mexico. Circles represent sites that were used in this study. Three regions are identified with letters A, B, and C.

Sixty sites were sampled during the dry season from January to March 2008, ranging from latitude 18°33′38.4″ to 20°03′47.8″N and from longitude 97°28′11.3″ to 101°49′43.8″W, in the southern altiplano of Mexico characterized by high altitudes (see table S1). Farmers typically harvest their crops from August to February. Beans were either sampled in the field, collected from plants left behind following harvest or purchased directly from farmers or at local markets. GPS coordinates and altitude of each sampling site were either recorded in the field or deduced from information provided by farmers. One to two kilograms of dry beans per site were brought back to the laboratory, placed into 1-l plastic containers with holes for ventilation, and stored at room temperature (18–25 °C). Emerged parasitoids and beetles were removed every two to three days and observations continued for 14 days after the last emergence. Parasitoids were individually preserved in vials with 100% ethanol for DNA extraction and beetles were identified to genus. Only samples from sites that produced six or more individuals from a single Horismenus species were retained for population level analyses.
Sixteen of the 60 sample sites had enough Horismenus specimens for analysis (table S1). Field collections from previous and ongoing studies (Benrey & Kenyon, unpublished data), indicate that beans collected in the southern altiplano of Mexico are infested primarily by Acanthoscelides beetles (Alvarez et al., Reference Alvarez, Hossaert-Mckey, Rasplus, Mckey, Mercier, Soldati, Aebi, Shani and Benrey2005a).
Community structure
Individuals from the Horismenus complex, the most abundant parasitoids emerging from beetle-infested beans, were identified using a taxonomic key based on morphological traits (Hansson et al., Reference Hansson, Aebi and Benrey2004). Prior to the population genetics analyses, we ensure that DNA sequences of COI clustered in monophyletic groups, validating the morphological identification of Horismenus species we previously made. Principal components analysis (PCA) was used to examine differences in Horismenus species abundances among sampling sites. Hellinger transformations (Legendre & Gallagher, Reference Legendre and Gallagher2001) were first applied to the matrix of species abundance before PCA analysis using the R language ‘Vegan’ package (Oksanen et al., Reference Oksanen, Kindt, Legendre, O'hara, Simpson, Henry, Stevens and Wagner2008).
Genetic analyses
Genomic DNA was extracted from the individual Horismenus abdomens using standard proteinase K digestion, phenol-chloroform extraction and precipitation with ethanol (Sambrook & Russell, Reference Sambrook, Russell, Sambrook and Russell2001). Extractions were screened for mitochondrial DNA variation using single strand conformation polymorphism (SSCP) (Orita et al., Reference Orita, Iwahana, Kanazawa, Hayashi and Sekiya1989; Sheffield et al., Reference Sheffield, Beck, Kwitek, Sandstrom and Stone1993), of a 278 bp segment of cytochrome c oxidase subunit I (COI). SSCP is known to be 99% accurate for differentiating sequence fragments between 100 and 300 bp (Smith & Wayne, Reference Smith and Wayne1996). Primers 130F (5′ CGGGGGTTAGITCIATTATAGG 3′) and 430R (5′ TTCATAGACTCATTACAAATTATATGAG 3′), were designed from sequences obtained from GenBank to amplify the COI segment nested in the standard ‘COI barcoding’ fragment and to avoid the amplification of Wolbachia endosymbionts. Amplification reactions were carried out in 12.5 μl volumes, including 1.25 μl of 10 × reaction buffers (GenScript USA Inc., Piscataway, NJ, USA), 1.25 μl of 10% trehalose (Fisher Scientific, Ottawa, Canada) solution, 1.5 mM MgCl2 (Genscript USA Inc.), 0.2 mM of each dNTP (Genscript USA Inc.), 0.4 μM of each primer, 0.5 U of Taq DNA polymerase (Genscript USA Inc.) and 2 μl of DNA template. Conditions used with a Bio-Rad thermocycler were as follows: 92 °C for 30 s, 35 cycles of 48 °C for 15 s, 68 °C for 30 s and one final cycle of 68 °C for 1 min. Amplified products were electrophoresed on a nondenaturing polyacrylamide gel (6%) (Angers & Bernatchez, Reference Angers and Bernatchez1998) and visualized using silver nitrate staining (Bassam et al., Reference Bassam, Caetano-Anollés and Gresshoff1991). Conformers were first scored within a population on a gel and then different conformers from different populations were compared on a new gel.
DNA sequencing
Each different conformer detected on SSCP was reamplified for sequencing in 50 μl volumes, and PCR products were purified using the QIAquick purification kit (Qiagen Inc., Mississauga, Canada). PCR sequencing was performed with the Big Dye terminator cycle sequencing kit version 1.1 (Applied Biosystems, Inc., Foster City, CA, USA). Sequencing was performed with an Applied Biosystem ABI 3730 DNA analyzer. Chromatograms of all sequences were checked with FinchTV 1.4.0 (Geospiza Inc., Seattle, WA, USA). Sequences were then checked with BioEdit (Hall, Reference Hall1999) and aligned using Clustal X version 1.83 (Thompson et al., Reference Thompson, Gibson, Plewniak, Jeanmougin and Higgins1997). Nucleotide sequence data were deposited in GenBank database under the accession numbers (JX068543-JX068599).
Screening of Wolbachia endosymbionts
The presence of Wolbachia bacteria in samples was detected using a PCR assay. A maximum of 30 individuals was tested for each population. Specific primers, wbcF (5′ GCACTTCATGTTGCTGGTATGTCATCAATT 3′) and wbcR (5′ CTTGGATGACCAAAAAATCAAAACAGGTG 3′), were designed to amplify a 280 bp fragment of COI. We ensured specificity of primers by designing them from conserved regions of aligned Wolbachia COI sequences taken from GenBank (Drosophila melanogaster; Decevania sp.; Culex quinquefasciatus: (AE017196.1; AY800177.1; AM999887.1)) and the one obtained in this study (GenBank: JX068600) with the 2154-bee and 2492-bee primers (Simon et al., Reference Simon, Frati, Beckenbach, Crespi, Liu and Flook1994).This guarantees that the primers are not specific to a Wolbachia strain. The same conditions as described above were used for the amplification, with the exception of an adjusted annealing temperature of 51 °C. Wolbachia occurrence was inferred from the amplification product as revealed by electrophoresis on a 1.5% agarose gel.
Genetic analyses
Phylogenetic relationships and molecular identification
Phylogenetic analyses were used to test morphological parasitoid identification by ensuring that different taxa fall into the appropriate clade. Phylogenetic relationships among Horismenus species were inferred using Bayesian (BI) and maximum likelihood (ML) methods as implemented in the Phylobayes 3 (Lartillot et al., Reference Lartillot, Lepage and Blanquart2009) and Phylml (Guindon & Gascuel, Reference Guindon and Gascuel2003) programs, respectively. The best-fit substitution model (GTR+ Γ) was determined using MODELTEST 3.7 (Posada & Crandall, Reference Posada and Crandall1998). Sequences from Entedon sp. (GenBank: DQ149194), Torymus benefices (GenBank: AB070504.1) and Megastigmus transvaalensis (GenBank: AF420405) were used as outgroups. Each BI analysis was initiated with a random starting tree, included two parallel Markov chain Monte Carlo runs and with 400,000 iterations sampled every 1000 iterations, until convergence (maximum discrepancy across all bipartions <0.1). A 50% majority rule consensus tree was constructed from the remaining trees after discarding the first 40,000 iterations (burn-in) of sampled trees. ML analysis was conducted with five ML tree searches with 100 bootstrapping replicates. The ML tree with the highest likelihood value was used to plot bootstrap values.
Genetic diversity, structure and differentiation
We first characterized the molecular diversity of parasitoid populations to investigate population genetic structure and differentiation under different geographic models or Wolbachia infection status. Measures of population genetic diversity, including the number of haplotypes (n), the number of sequenced haplotypes (s), haplotype diversity (hd) (Nei & Tajima, Reference Nei and Tajima1981), nucleotide diversity (π) (Nei, Reference Nei1987) and the number of substitutions (ns) were estimated from mitochondrial DNA polymorphism using the computer program Arlequin 3.0 (Excoffier et al., Reference Excoffier, Laval and Schneider2005). A matrix of mutational differences among haplotypes was calculated to produce a minimum length spanning network of haplotypes using the same software. Nodes of the network represent the haplotypes, while branch length is proportional to the number of mutations between them.
Genetic diversity found within versus among populations was estimated by computing global and pairwise F ST (Weir & Cockerham, Reference Weir and Cockerham1984) using Arlequin 3.0 (Excoffier et al., Reference Excoffier, Laval and Schneider2005). This was also quantified by using global and pairwise ΦST (Excoffier et al., Reference Excoffier, Laval and Schneider2005) to take into account the mutational differences among haplotypes. In order to determine if the mutations contributed significantly to genetic differentiation, the difference between global F ST and ΦST values was tested using a randomization procedure implemented in SPAGeDi 1.1 (Hardy & Vekemans, Reference Hardy and Vekemans2002). Hierarchical analyses of the genetic diversity (Excoffier et al., Reference Excoffier, Smouse and Quattro1992) were also performed using Arlequin 3.0 (Excoffier et al., Reference Excoffier, Laval and Schneider2005). A priori criteria for grouping were tested according to the three different geographical regions sampled (A, B and C; fig. 1). Grouping by Wolbachia infection status was used to test differentiation by estimating global F ST among infected vs. non-infected individual.
Spatial structure was also investigated by autocorrelation analysis based on the Moran's II coefficient calculated using the AIDA software (Bertorelle & Barbujani, Reference Bertorelle and Barbujani1995). For H. depressus and H. missouriensis, the Moran's II coefficient was calculated for four and three distance classes (table S2), respectively, as implemented in AIDA software (Bertorelle & Barbujani, Reference Bertorelle and Barbujani1995). The shape of the correlogram (Moran's II coefficient plotted against geographic distance) represents the pattern of genetic similarity over space.
Results
Community structure
Horismenus depressus and H. missouriensis were the most abundant species parasitizing beetles on seeds of P. vulgaris, while H. butcheri and H. sp. were the predominant species on P. coccineus (table 1). Horismenus species represent 87% of all emerging parasitoids. The two most abundant Horismenus species tended to segregate among sample sites, clustering, respectively, in the first and second quadrant of the PCA projection (fig. S1), except for three sites (B3, B10 and A2) where the two species were collected together.
Abundances of parasitoids, bruchid beetles (Acanthoscelides and Zabrotes), and the bean species from which studied insects emerged.

v: Phaseolus vulgaris; c: Phaseolus coccineus.
Genetic diversity
Within species diversity
We were unable to amplify any DNA fragment from 17 individuals. The 600 remaining extractions revealed, by SSCP screening, 80 distinct COI haplotypes for over the four Horismenus species. Fifty-eight haplotypes were detected in H. depressus (N = 332), nine in H. missouriensis (N = 194), 11 in H. butcheri (N = 59) and two in Horismenus sp. (N = 15). Fifty-seven of these were sequenced: 42/58 for H. depressus, 7/9 for H. missouriensis, 6/11 for H. butcheri and 2/2 for H. sp (table 2). These sequences clustered into four monophyletic clades where H. depressus, H. missouriensis and H. butcheri were well-supported by BI and ML analyses (fig. 2). The H. sp. clade was poorly supported. Each cluster was found to correspond to a given morphological species. Intraspecific divergence was high for H. depressus (6.5%), H. butcheri (6.0%) and H. sp. (3.2%), but low for H. missouriensis (0.4%).
Monophyletic group differentiation by Bayesian and maximum likelihood analysis of the observed COI sequences of the SSCP survey. Bayesian posterior probabilities (PP) and ML bootstrap support values (BS) are shown in this order for each clade on the tree obtained by BI analysis.

Genetic diversity of mtDNA fragments. Sample sites are indicated in the top row and the number of haplotypes (n), number of sequenced haplotypes (s), haplotype diversity (hd), nucleotide diversity (π), and number of substitutions (ns) are indicated for each species.

Population diversity
The SSCP survey identified between two and 12 haplotypes per population of H. depressus. For H. missouriensis, one to four haplotypes were found, with two populations (B4 and B5) having a unique fixed haplotype. For H. butcheri, one to seven haplotypes were identified, with one population (B2) having a fixed unique haplotype. The two H. sp. populations (B10 and B12) each had distinct fixed haplotypes.
Haplotype networks revealed contrasting patterns between H. depressus and H. missouriensis (fig. 3A–B). Horismenus depressus displayed a large number of private haplotypes (detected in a single population), with only haplotype h03 detected in more than one population. In addition, the nucleotide diversity was generally very high within most populations (π = 3.0; table 2) due to the coexistence of highly divergent haplotypes. For instance, haplotypes h05 and h06 detected in the C1 population differed by ten mutations (fig. 3A). In contrast, one unique haplotype was detected in five of six H. missouriensis populations, and the additional haplotype differed by only a single mutation (fig. 3B). As a result, nucleotide diversity was very low for populations of H. missouriensis.
Minimum spanning network of mtDNA haplotypes for the (A) ten populations of H. depressus (291 individuals) and (B) six populations of H. missouriensis (175 individuals). Colors correspond to the three sampling regions: grey for A, white for B and black for C (fig. 1). For each circle representing an observed haplotype, there is a sample site and haplotype identifier. The size of each circle is scaled to its relative haplotype frequency according to the SSCP survey. Small black circles indicate unsampled intermediate haplotypes. The haplotype (A2:B1:B7:B10.h03) contained in a box have been detected in four populations. (C) Representation of the distribution of the 42 haplotypes among the ten H. depressus populations studied within the minimum spanning network.

Genetic structure
The estimated values of F ST and ΦST for H. depressus were 0.3872 and 0.4376, respectively (P = 0.0349; N ST = 0.6069). Both estimators were calculated using only the 42 haplotypes for which sequencing was performed, corresponding to 87% of sampled individuals. However, the difference between F ST and ΦST, is driven by only two populations (B10 and B11) that are characterized by very low diversity. When these sites are removed from the analyses, F ST (0.3403) and ΦST (0.3191) become similar and statistically not different (P = 0.9674), which assess the absence of molecular information.
Geographical grouping by region A, B, and C (fig. 1), does not result in a significant F CT estimate (table 3) for H. depressus. Another way to test the genetic structure is by computing Moran's II autocorrelation coefficient values for different distance classes. For H. depressus, all Moran's II coefficients were significant (P < 0.005) and ranged from low positive values transitioning to increasingly negative values with added distance (fig. S2). Except for the first distance class (within populations) where low autocorrelation was detected, the set of coefficients shown in the correlogram can be attributed to the random spatial distribution of haplotypes since they are close to zero. For H. missouriensis, no significant Moran's II values were detected. This also indicates the absence of spatial patterns of DNA diversity (Bertorelle & Barbujani, Reference Bertorelle and Barbujani1995).
Hierarchical analyses of the genetic diversity of H. depressus and H. missouriensis populations. Groups were defined by geographic region (A, B, and C; fig. 1) for H. depressus without the B10 and B11 sites (see Results: Population diversity section). Two groups were defined by infection statue of H. missouriensis by Wolbachia.

¢ Group 1: A1, A2; Group 2: B1, B2, B7, B8, B9; Group 3: C1.
The estimations of F ST (0.9317) and ΦST (0.9317) for H. missouriensis were higher than for H. depressus. However, most of the inter-population diversity is driven by a single population (B4), which was not infected by Wolbachia and was fixed for a distinct haplotype. Removing this population decreased F ST to 0.0604 and ΦST to 0.0604, reflecting an insignificant level of population differentiation.
Wolbachia
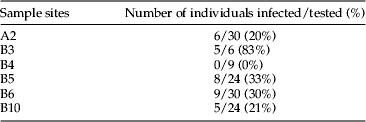
Screening for the presence of Wolbachia revealed that most of the H. missouriensis populations were infected (5/6; table 1). The bacteria were not detected in the other Horismenus species. Up to 83% of tested individuals within a population were infected by Wolbachia (table 4). Infection status was restricted to only one mtDNA haplotype (A2:B3:B5:B6:B10.h59; fig. 3B). Grouping individuals from H. missiouriensis populations by Wolbachia infection status leads to a significant differentiation (F ST = 0.10914; table 3).
Number of H. missouriensis individuals infected with Wolbachia.
Discussion
The aim of this study was to compare the evolutionary history of parasitoids to those of their bruchid beetle hosts and their domesticated host plant in Mexico. Consistent structure among members of different trophic levels is expected in the presence of strong ecological interactions. Consequently, we predicted that the genetic structure of host and parasitoid populations would be congruent because they have been similarly influenced by human-mediated migration since the beginning of the domestication process. On the other hand, parasitoid structure could be biased by the presence of Wolbachia endosymbionts.
We found four Horismenus species that emerged from Acanthoscelides spp. that had infested domesticated beans, while a previous study found only one species, H. missouriensis (Aebi et al., Reference Aebi, Shani, Hansson, Contreras-Garduno, Mansion and Benrey2008). The two most abundant species, H. depressus and H. missouriensis, tended to segregate among sampled sites and emerged predominantly from infested P. vulgaris seeds. Although uncommon, H. butcheri and H. sp. were the most abundant species on P. coccineus seeds. However, populations of these two species were too few to be meaningfully analyzed.
A blurred evolutionary history
Populations of H. depressus and H. missouriensis exhibited different patterns of mitochondrial diversity. Horismenus missouriensis showed very low within-species diversity, with one haplotype shared by nearly all populations. This low diversity appears to be linked to the presence of Wolbachia, which was detected exclusively in this species. Both Wolbachia and mtDNA are transmitted maternally, and the reproductive manipulation by the bacteria (e.g. cytoplasmic incompatibility) tends to alter the frequency distribution of mtDNA haplotypes within host populations (Charlat et al., Reference Charlat, Duplouy, Hornett, Dyson, Davies, Roderick, Wedell and Hurst2009; Yu et al., Reference Yu, Zhang, Xue and Hong2011). This also may explain the marked difference between infected and uninfected individuals of H. missouriensis (table 4), and this would be the first report that we are aware of suggesting that Wolbachia infection lowers mtDNA diversity of parasitoid populations. The genetic diversity of spider mite (Tetranychus urticae) populations was also reported to be lowered by Wolbachia infection in China (Yu et al., Reference Yu, Zhang, Xue and Hong2011). Another explanation for the low genetic diversity of H. missouriensis and its infection by Wolbachia would be that a bottleneck before the dispersal of this haplotype coincided with the presence of Wolbachia by chance.
Therefore, it is not possible to determine on the basis of the mitochondrial data, whether H. missouriensis has evolved in parallel with other Horismenus species, since its historical signal has likely been blurred by the effects of Wolbachia infection. Interestingly, the broad geographic range of a single infected haplotype may indicate at least one relatively recent historical dispersal event (table 5). Future studies should include more data on the genetic diversity of Wolbachia that could enhance the understanding of the evolutionary history of its hosts (Lozier et al., Reference Lozier, Roderick and Mills2007).
Comparison within and among trophic levels, information on the third trophic level were obtained in this study and information on the first and second trophic levels came from previously published studies.

SAM: southern altiplano of Mexico.
HMM: human-mediated migration.
RMS: reproductive manipulation strategies.
E&GS: environmental and grower selection.
Inconsistent genetic structure among trophic levels
Populations of H. depressus, were found to be strongly differentiated even over short geographic distances. Unlike H. missouriensis, high levels of sequence divergence were detected within H. depressus. However, relatively low F ST and ΦST estimates were observed due to the very high intra-population diversity, with a large number of distinct haplotypes and abundant mutations among haplotypes. The polyphyly characterizing lineages within H. depressus populations (fig. 3C) suggest that the actual population structure is recent (i.e. Karlin & Nevo, Reference Karlin and Nevo1986). The analyses also suggest that the absence of historical structure in the system results from the random dispersal of haplotypes among regions and populations as illustrated in fig. 3C. The level of genetic differentiation found for H. depressus is similar to that reported for one of its bruchid hosts, Zabrotes subfasciatus (Shani & Benrey, unpublished data; Gonzalez-Rodriguez et al., Reference Gonzalez-Rodriguez, Benrey, Callejas and Oyama2002: see table 5). However, human-mediated migration cannot be considered as a relevant contemporary factor for H. depressus parasitoids, as it has been assumed to be the case for its two Acanthoscelides beetle hosts (Alvarez et al., Reference Alvarez, Hossaert-Mckey, Restoux, Delgado-Salinas and Benrey2007; Restoux et al., Reference Restoux, Hossaert-Mckey, Benrey and Alvarez2010: table 5). The two Acanthoscelides species, the most abundant bruchids, have low levels of differentiation even over long distances (Alvarez et al., Reference Alvarez, Hossaert-Mckey, Restoux, Delgado-Salinas and Benrey2007; Restoux et al., Reference Restoux, Hossaert-Mckey, Benrey and Alvarez2010). Negligible genetic differentiation among Acanthoscelides populations suggests at least one recent historical dispersal event, which was presumed to be a consequence of human seed trade (Alvarez et al., Reference Alvarez, Hossaert-Mckey, Restoux, Delgado-Salinas and Benrey2007; Restoux et al., Reference Restoux, Hossaert-Mckey, Benrey and Alvarez2010). It also suggests that there has been insufficient time since dispersal to allow for differentiation among populations. Interestingly, Z. subfasciatus populations were found to be well differentiated and organized by dispersal (Shani & Benrey, unpublished data; Gonzalez-Rodriguez et al., Reference Gonzalez-Rodriguez, Benrey, Callejas and Oyama2002). The spatial genetic structure of H. depressus is also similar to that of its host plant, consisting of random historical dispersal from a highly diversified ancestral gene pool (Papa & Gepts, Reference Papa and Gepts2003; Zizumbo-Villarreal et al., Reference Zizumbo-Villarreal, Colunga-Garciamarin, Payro De La Cruz, Delgado-Valerio and Gepts2005; Kwak & Gepts, Reference Kwak and Gepts2009; Rossi et al., Reference Rossi, Bitocchi, Bellucci, Nanni, Rau, Attene and Papa2009).
Present-day domesticated bean populations from the Mesoamerican gene pool are highly differentiated and are now structured by dispersal, while their wild relatives are structured by vicariance (Papa & Gepts, Reference Papa and Gepts2003; Zizumbo-Villarreal et al., Reference Zizumbo-Villarreal, Colunga-Garciamarin, Payro De La Cruz, Delgado-Valerio and Gepts2005; Kwak & Gepts, Reference Kwak and Gepts2009; Rossi et al., Reference Rossi, Bitocchi, Bellucci, Nanni, Rau, Attene and Papa2009). Human-mediated seed dispersal, in addition to genetic drift, selection by growers and environmental pressures, have affected the genetic diversity of insects since the beginning of domestication (Papa & Gepts, Reference Papa and Gepts2003; Zizumbo-Villarreal et al., Reference Zizumbo-Villarreal, Colunga-Garciamarin, Payro De La Cruz, Delgado-Valerio and Gepts2005; Blair et al., Reference Blair, Díaz, Buendía and Duque2009; Kwak & Gepts, Reference Kwak and Gepts2009; Rossi et al., Reference Rossi, Bitocchi, Bellucci, Nanni, Rau, Attene and Papa2009).
Evolutionary dynamics
Inconsistent patterns among trophic levels could be explained by distinct evolutionary dynamics. In spite of an extensive human-mediated migration that homogenized the population structure of beetle hosts, parasitoid populations (H. depressus) remain highly differentiated, and therefore parasitoids likely migrate from wild-weedy bean populations adjacent to crop fields.
The relatively high nucleotide and haplotype diversity within H. depressus populations indicates the existence of a large and stable population with a long evolutionary history and subsequent contacts among differentiated lineages associated with wild beans. This corresponds with the fourth category, defined by Grant & Bowen (Reference Grant and Bowen1998), to infer on the likelihood of mtDNA lineages survival under peculiar demographic scenarios. The maintenance of ancestral lineages in the Horismenus parasitoid complex suggests past fragmentation and restricted gene flow among parasitoid populations. The complex topography of the southern altiplano of Mexico (i.e. a large range of altitudes), together with the limited effect of the last glaciations (i.e. altitudinal effect: Bryant & Holloway, Reference Bryant and Holloway1985; Ramamoorthy, Reference Ramamoorthy1998), may constitute important factors favoring the conservation of mtDNA lineages in subdivided populations. Furthermore, subdivided populations have the capacity to retain more diversity as drift may operate distinctly within each subpopulation. However, genetic drift within extinction-recolonization dynamics could be responsible for the absence of a large number of intermediate haplotypes with respect to limited sampling effort.
Parasitoids may not have a large enough capacity for dispersal between crop fields and houses where seeds are stored. Furthermore, they may not be able to survive storage conditions since they need other sources of nutrition (e.g. nectar and pollen). On the other hand, the bruchid beetle hosts are well pre-adapted to storage conditions since they consume dry seeds and show polymorphism in dispersal and reproductive traits (Tuda et al., Reference Tuda, Ronn, Buranapanichpan, Wasano and Arnqvist2006). Furthermore, A. obtectus has been found to exhibit resistance to several types of pesticides (Alvarez et al., Reference Alvarez, Mckey, Hossaert-Mckey, Born, Mercier and Benrey2005b). This species is now cosmopolitan while Horismenus parasitoids have a much more restricted distribution.
The surrounding environment could be responsible for the population genetic structure observed in Horismenus parasitoids since H. depressus populations are, even over short distances, highly differentiated (table 5). Traditional crop fields in Mexico are commonly surrounded by wild-weedy bean populations (Papa & Gepts, Reference Papa and Gepts2003; Zizumbo-Villarreal et al., Reference Zizumbo-Villarreal, Colunga-Garciamarin, Payro De La Cruz, Delgado-Valerio and Gepts2005) known to support far higher numbers of Horismenus parasitoids compared to domesticated bean populations (Laurin-Lemay, personal observations). In addition, local adaptation to highly differentiated wild-weedy-domesticated bean complexes (Campan et al., Reference Campan, Callejas, Rahier and Benrey2005; Zizumbo-Villarreal et al., Reference Zizumbo-Villarreal, Colunga-Garciamarin, Payro De La Cruz, Delgado-Valerio and Gepts2005) might also prevent gene flow.
Our data revealed inconsistent genetic structure among members of different trophic levels, as well as within a trophic level. Future research should focus on two main questions aimed to elucidate the microevolutionary processes occurring in this multitrophic system. First, what is the role of parasitoid populations associated with wild-weedy beans in structuring the genetic diversity of parasitoids attacking bruchids in crop fields? Second, what is the origin of migrants detected among all members of the system? Additional molecular data should then be obtained for a higher-resolution assessment of the phylogeographical inferences and the putative role of bean domestication on insect population structure.
Acknowledgements
This work was financially supported by the Canada Research Chair Program and the Swiss National Science Foundation (Project No. 31003A_127364). We thank Omar Arellano-Aguilar for help with sampling in Mexico and the Instituto de Ecologia at UNAM for logistical assistance. We thank Josée Doyon for technical assistance and Sarah Kenyon for comments on an earlier version of this paper and for help during field work in Mexico. We also thank the editor and two anonymous reviewers who provided thoughtful comments.
Supplementary material
The online figures and tables can be viewed at http://journals.cambridge.org/ber.



