1. Introduction
Mechanical forces such as libration, precession and tides, which arise from gravitational interactions, are essential to generate complex fluid flows within astrophysical and geophysical bodies (Le Bars, Cébron & Le Gal Reference Le Bars, Cébron and Le Gal2015). In the subsurface oceans of celestial bodies such as Enceladus, such forcing initiates dynamical processes that are crucial to understanding the internal structures of these bodies (Noir et al. Reference Noir, Hemmerlin, Wicht, Baca and Aurnou2009; Thomas et al. Reference Thomas, Tajeddine, Tiscareno, Burns, Joseph, Loredo, Helfenstein and Porco2016; Soderlund et al. Reference Soderlund, Rovira-Navarro, Le Bars, Schmidt and Gerkema2024). The energy dissipation from libration-driven turbulence may provide heat sources that maintain these subsurface oceans, while libration has been proposed as a potential mechanism driving planetary dynamos (Le Bars et al. Reference Le Bars, Wieczorek, Karatekin, Cébron and Laneuville2011; Wu & Roberts Reference Wu and Roberts2013; Reddy, Favier & Le Bars Reference Reddy, Favier and Le Bars2018; Wilson & Kerswell Reference Wilson and Kerswell2018). In the Earth’s ocean, the interaction of tidal flows and supercritical topographies is an important source for creating strong concentrated internal wave beams, which play a key role in tidal conversion (Smith & Young Reference Smith and Young2003; Balmforth & Peacock Reference Balmforth and Peacock2009; Echeverri & Peacock Reference Echeverri and Peacock2010).
In rotating fluids, when the external forcing frequency is less than twice the rotation frequency, smooth inertial modes can be excited within containers where regular inertial modes exist (Greenspan Reference Greenspan1968). However, the dynamics becomes more complex in geometries such as spherical shells, where regular inertial modes generally do not exist. Instead, inertial wave beams are generated at critical latitudes due to oscillatory viscous concentrated boundary layer singularities (Kerswell Reference Kerswell1995; Rieutord & Valdettaro Reference Rieutord and Valdettaro1997). Historical studies have shown that such wave beams can be well described by self-similar solutions (Moore & Saffman Reference Moore and Saffman1969; Thomas & Stevenson Reference Thomas and Stevenson1972). These solutions have been adapted to more complex cases, such as those involving beam reflections or limit cycles known as attractors (Maas et al. Reference Maas, Benielli, Sommeria and Lam1997; Rieutord, Georgeot & Valdettaro Reference Rieutord, Georgeot and Valdettaro2001; Le Dizès & Le Bars Reference Le Dizès and Le Bars2017). He et al. (Reference He, Favier, Rieutord and Le Dizès2022) expanded the work of Le Dizès & Le Bars (Reference Le Dizès and Le Bars2017) to a closed domain such as the spherical shell by deriving the asymptotic explicit expression of the linear harmonic velocity as a sum of many self-similar beams.
Transitioning to nonlinear phenomena, the interaction among wave beams introduces complexities, notably when beams intersect or reflect. Such interactions can lead to the creation of mean flow and second-harmonic corrections. For example, when beams of the same frequency interact as a result of reflection, they generate significant mean zonal flow and harmonic effects (Tabaei & Akylas Reference Tabaei and Akylas2003; Tabaei, Akylas & Lamb Reference Tabaei, Akylas and Lamb2005; Peacock & Tabaei Reference Peacock and Tabaei2005). These nonlinear processes manifest themselves notably in the formation of mean zonal flows, which have been extensively documented through experimental and numerical studies (Tilgner Reference Tilgner2007; Sauret & Le Dizès Reference Sauret and Le Dizès2013; Favier et al. Reference Favier, Barker, Baruteau and Ogilvie2014). Previous studies have demonstrated that, in the absence of inertial waves, nonlinear interactions within viscous boundary layers can drive zonal flows. The characteristics of these flows are strongly influenced by the libration amplitude, while remaining largely independent of the Ekman number and depend on the cylindrical variable
 $r$
only (Busse Reference Busse2010; Sauret & Le Dizès Reference Sauret and Le Dizès2013). The dominant contribution to the mean flow arises in the bulk, manifesting as an azimuthal flow that scales as
 $\epsilon ^2$
, where
 $\epsilon$
denotes the small oscillation amplitude. However, when the libration frequency falls below twice the rotation rate, allowing for the excitation of inertial waves, the resulting interactions become more complex, influencing the structure and behaviour of mean zonal flows. This intricate interplay remains a significant challenge in fluid dynamics research within enclosed domains, where wave reflections and interactions can alter fundamental fluid behaviours (Cébron et al. Reference Cébron, Vidal, Schaeffer, Borderies and Sauret2021).
Of particular interest to the present study, Tilgner (Reference Tilgner2007) explored the dynamics of mean flow within a rotating spherical shell under the influence of an oscillating tidal mode. His research revealed that Reynolds stresses are primarily concentrated along wave beam paths, with an intensity peak observed at reflection points and beam intersections. In a subsequent investigation of thin viscous beams reflecting on flat boundaries in rotating and stratified fluids, Le Dizès (Reference Le Dizès2020) found that when the libration frequency
 $\omega$
is less than the rotation rate
 $\varOmega$
(
 $\omega \lt \varOmega$
), the reflection process generates both a second-harmonic correction and a mean flow correction. The second-harmonic beam exhibits a larger amplitude compared to the mean flow correction throughout most of the domain, except within the local interaction region.
Le Dizès (Reference Le Dizès2020) noted that the structure of the wave beam reflections, which have a characteristic width scaling as
 $E^{1/3}$
, maintained self-similarity with a
 $O(E^{1/6})$
correction, where
 $E$
is the Ekman number. For scenarios involving purely stratified or rotating fluids, a mean flow correction occurs with an amplitude of
 $\epsilon ^2 E^{-1/6}$
, except in cases where the boundary is either horizontal or vertical, which exhibit a localised mean flow correction with a distinct triple-layer structure, including a significant
 $O(E^{4/9})$
viscous layer. More recent studies by Lin & Noir (Reference Lin and Noir2021) focused on the numerical analysis of nonlinear mean flow in a spherical shell with libration forcing at the inner core boundary. They observed that the mean flow correction remains localised at reflection points, scaling approximately as
 $E^{-1/6}$
. Multiple bands were also identified in the bulk flow, directly corresponding to the positions of the reflection points. However, discrepancies were noted between theoretical predictions and numerical results, particularly regarding slight increases in the mean flow amplitude with the Ekman number.
In this paper we extend the study to nonlinear mean flow within a rotating spherical shell subjected to libration forcing at the inner core boundary. Our objective is to use the linear self-similar solutions within the spherical shell to establish a theoretical framework for addressing mean flow corrections. This involves generalising the previous results of Le Dizès (Reference Le Dizès2020) and validating the scaling of the mean flow via numerical integration. For illustrative purposes, the internal shear layers in a spherical shell, induced by the libration of the inner core, along with the corresponding mean flow, are depicted in figure 1(a) at a low Ekman number
 $E=10^{-10}$
. Using direct numerical integration of the linear viscous governing equations, we first compute the linear harmonic velocity field. From this velocity field, we subsequently calculate the mean flow through a pseudo-spectral method. A detailed analysis of the interaction regions reveals that mean flow corrections are significantly larger in those regions than in both the outer region and the bulk bands, as shown in figure 1(b–e). These high-amplitude regions are of particular interest, motivating the development of an asymptotic theory to characterise the mean flow correction within these specific regions.
 $(a)$
Contours of the amplitudes of the mean flow azimuthal velocity
 $|v_{0\phi }|$
(upper part) and the linear harmonic solution
 $|v_{1\phi }|$
(lower part) for
 $E = 10^{-10}$
. The harmonic solution and the mean flow correction have been normalised by
 $\varepsilon$
and
 $\varepsilon ^2$
, respectively, where
 $\varepsilon$
is the libration amplitude (see (2.2)). The critical latitude is marked at
 $S_c$
whose cylindrical coordinates are
 $(\eta \sqrt {1 - \omega ^2/4}, \eta \omega /2)$
. The aspect ratio of the spherical shell is
 $\eta = 0.35$
and the libration frequency of the inner core is
 $\omega = \sqrt {2}$
. The white dashed lines represent the path of characteristics emitted from the critical latitude. (b–e) Zoomed-in regions of the interaction points located at
 $P_1$
,
 $P_3$
,
 $P_7$
and
 $P_4$
, respectively.

The structure of the paper is as follows. In § 2 we introduce the configuration and settings of the problem. Section 2.1 outlines the fundamental equations. In § 2.2 we review the numerical methods employed to solve the linear harmonic governing equations and extend these approaches to address the nonlinear mean flow. Section 3 revisits the asymptotic theory, examining self-similar solutions and scaling laws. It also summarises the structure of the linear harmonic solution for this configuration, providing approximations for this solution close to points where the interactions will be the strongest. The mean flow correction is addressed in §§ 4 and 5. We first compare numerical results with the predictions known for the contribution generated from oscillating boundary layers in § 4.1. We then consider the nonlinear interactions along the periodic beam, especially in the places where the interactions are the strongest, on the axis, and at the reflection points on the boundary (§ 4.2). Asymptotic expressions are derived and compared to numerical results. In § 5 we focus on the mean flow band structures that originate from the strong interaction points. The scaling and form of the solution in these bands are analysed numerically using the asymptotic prescriptions that can be derived for these structures (Appendix C). Finally, the paper concludes with § 6, which summarises the key findings and discusses their consequences for other configurations.
2. Framework
In this paper we study the dynamics of an incompressible fluid with a constant kinematic viscosity
 $\nu$
, which fills a spherical shell and rotates around the axis
 $\boldsymbol{e}_z$
at a uniform rate
 $\widehat {\varOmega }$
. The flow is further subjected to the libration of the inner core, as depicted in figure 2(a). The inner core librates with a small amplitude
 $\widehat {\varepsilon }$
and at a frequency
 $\widehat {\omega }=\sqrt {2}\widehat {\varOmega }$
, resulting in an angular velocity of
 $\widehat {\varepsilon } \cos (\widehat {\omega } t)$
relative to the rotating system. Following the configuration of He et al. (Reference He, Favier, Rieutord and Le Dizès2022), the radii of the inner and outer spherical cores are
 $\widehat {\rho }_i$
and
 $\widehat {\rho }_o$
, respectively, with the aspect ratio
 $\eta = \widehat {\rho }_o/\widehat {\rho }_i= 0.35$
to generate an Earth-like ratio. Time and space are non-dimensionalised using the inverse rotation rate
 $1/\widehat {\varOmega }$
and the outer sphere radius
 $\widehat {\rho }_o$
of the spherical shell. The non-dimensional inner core radii is then
 $\eta$
. The non-dimensional angular velocity of the outer and inner core are
 $1$
and
 $1+\varepsilon \cos \omega t$
, respectively, with libration amplitude
 $\varepsilon = \widehat {\varepsilon }/\widehat {\varOmega }$
and frequency
 $\omega =\widehat {\omega }/\widehat {\varOmega }$
.
Sketch of the problem:
 $(a)$
the outer radius of the concentric shell is
 $\widehat {\rho }_o$
and rotates at the angular velocity of
 $\widehat {\varOmega }$
, the inner radius is
 $\widehat {\rho }_i$
and rotates at an angular velocity of
 $\widehat {\varOmega }+\widehat {\varepsilon } \cos \widehat {\omega } t$
with the amplitude
 $\widehat {\varepsilon }$
and frequency
 $\widehat {\omega }$
of the libration;
 $(b)$
a local coordinate system is defined in the northward direction. The red lines represent the critical lines, while
 $x_{\|}$
and
 $x_{\perp }$
are the local coordinates. The southward direction is the inverse of the northward direction.

2.1. Basic equations
In the rotating frame the velocity
 $\boldsymbol{V}=(v_r,v_{\phi },v_z)$
, written in cylindrical coordinates, and pressure
 $P$
are governed by the equations
 \begin{align} \frac { \partial \boldsymbol{V} }{ \partial t } + (\boldsymbol{V}\boldsymbol{\cdot }\boldsymbol{\nabla })\boldsymbol{V} + 2\boldsymbol{e}_{z}\times \boldsymbol{V} & =-\boldsymbol{\nabla }P+E{\nabla} ^{2}\boldsymbol{V} , \end{align}
 \begin{align} \boldsymbol{\nabla }\boldsymbol{\cdot }\boldsymbol{V} & = 0 , \end{align}
where
 $E$
is the Ekman number, which is defined as
 $E = \nu /\widehat {\varOmega } \widehat {\rho }_o^{2}$
.
Contrarily to He et al. (Reference He, Favier, Rieutord and Le Dizès2022), which exclusively addressed the linear aspects by omitting the advection term in (2.1a
), this study expands into the nonlinear regime. We consider the following asymptotic expansion of the velocity
 $\boldsymbol{V}$
and pressure
 $P$
:
 \begin{equation} (\boldsymbol{V},P) = \varepsilon (\boldsymbol{v}_1, p_1)\textrm{e}^{-\mathrm{i}\omega t}+ \varepsilon ^2\left [(\boldsymbol{v}_0,p_0)+(\boldsymbol{v}_2,p_2)\textrm{e}^{-2\mathrm{i}\omega t} \right ]+ \mathrm{c}.\mathrm{c}. \end{equation}
Here
 $\mathrm{c}.\mathrm{c}$
denotes the complex conjugate,
 $(\boldsymbol{v}_1,p_1)$
is the linear harmonic,
 $(\boldsymbol{v}_0,p_0)$
is the mean flow correction and
 $(\boldsymbol{v}_2,p_2)$
is the secondary harmonic velocity. In this paper we focus solely on the mean flow correction.
Three steps are required to compute the mean flow correction. First, similarly to He et al. (Reference He, Favier, Rieutord and Le Dizès2022), the linear response is found by solving
 \begin{align} -\mathrm{i}\omega \boldsymbol{v}_1+2\boldsymbol{e}_{z} \times \boldsymbol{v}_1 & =-\boldsymbol{\nabla }p_1+E{\nabla} ^{2} \boldsymbol{v}_1 , \end{align}
 \begin{align} \boldsymbol{\nabla }\boldsymbol{\cdot }\boldsymbol{v}_1 & =0 , \end{align}
 \begin{align} \quad \boldsymbol{v}_1 & = r\boldsymbol{e}_{\phi } \quad(\text{inner boundary condition}), \end{align}
 \begin{align} \quad \boldsymbol{v}_1 & = \boldsymbol{0} \quad(\text{outer boundary condition}). \end{align}
Once the linear harmonic velocity
 $\boldsymbol{v}_1$
is obtained, the nonlinear terms corresponding to its self-interaction can be calculated at leading order. The resulting Reynolds stresses comprise two parts: the steady forcing and the second harmonic oscillating at
 $2\omega$
. Throughout this paper, we refer to the divergence of the Reynolds stress tensor (which provides the mean flow forcing) simply as the ‘Reynolds stress’. As the present study focuses on the mean flow, we only consider the steady Reynolds stress
 $\mathcal{N}_{0}$
,
 \begin{equation} \boldsymbol{\mathcal{N}}_{0}=\boldsymbol{v}_1\boldsymbol{\cdot }\boldsymbol{\nabla }\boldsymbol{v}_{1}^{*} + \mathrm{c}.\mathrm{c} , \end{equation}
where
 $^*$
denotes complex conjugation. The mean flow response
 $\boldsymbol{v}_0$
corresponds to a perturbation with a zero frequency
 $\omega =0$
and is governed by the linear forced system
 \begin{align} 2\boldsymbol{e}_{z} \times \boldsymbol{v}_{0}+\boldsymbol{\nabla }p_{0} & =-\boldsymbol{\mathcal{N}}_{0}+E {\nabla} ^{2} \boldsymbol{v}_{0} , \end{align}
 \begin{align} \boldsymbol{\nabla }\boldsymbol{\cdot }\boldsymbol{v}_0 & =0 , \end{align}
 \begin{align} \quad \boldsymbol{v}_0 & =\boldsymbol{0} \quad(\text{inner and outer boundary condition}) , \end{align}
where the forcing
 $\boldsymbol{\mathcal{N}}_0$
arises from the nonlinear self-interaction of the linear harmonic
 $v_1$
.
2.2. Numerical approach
To solve the equations outlined in § 2.1 and validate our theoretical predictions through asymptotic analysis, we have employed high-precision spectral methods for the numerical integrations. These methods, previously used in Rieutord & Valdettaro (Reference Rieutord and Valdettaro1997) and He et al. (Reference He, Favier, Rieutord and Le Dizès2022) to solve the linear governing equations (2.3), have enabled us to capture the linear harmonic velocity profiles
 $\boldsymbol{v}_{1}$
displayed in figure 1(a). We have looked for the solution of the linear governing equation (2.3a
) expressed in vorticity form as
 \begin{equation} -\mathrm{i}\omega \boldsymbol{\nabla }\times \boldsymbol{v}_1+2\boldsymbol{\nabla }\times (\boldsymbol{e}_z\times \boldsymbol{v}_1)=E\boldsymbol{\nabla }\times ({\nabla} ^{2}\boldsymbol{v}_1) . \end{equation}
For this three-dimensional problem, we use spherical coordinates
 $(\rho , \theta , \phi )$
representing radial, polar and azimuthal directions, respectively. The velocity fields are expanded using spherical harmonics in the polar and azimuthal directions and Chebyshev polynomials in the radial direction, i.e.
 \begin{equation} \boldsymbol{v}_{1}=\sum ^{+\infty }_{l=0}\sum ^{+l}_{m=-l}u_{m}^{l}(\rho )\boldsymbol{R}_{l}^{m}+v^{l}_{m}(\rho )\boldsymbol{S}_{l}^{m}+w_{m}^{l}(\rho )\boldsymbol{T}_{l}^{m} , \end{equation}
where
 \begin{equation} \boldsymbol{R}_{l}^{m}=Y_{l}^{m}(\theta ,\phi )\boldsymbol{e}_{\rho },\qquad \boldsymbol{S}_{l}^{m}=\boldsymbol{\nabla }Y_{l}^{m},\qquad \boldsymbol{T}_{l}^{m}=\boldsymbol{\nabla }\times \boldsymbol{R}_{l}^{m} . \end{equation}
Projecting the vorticity (2.6) onto this basis allows us to solve the linear system using a block tridiagonal algorithm. In our cases, we are assuming an axisymmetric fluid response along with the no-slip boundary conditions on the spherical shell. Detailed descriptions of the numerical methods and the construction of the system are available in He et al. (Reference He, Favier, Rieutord and Le Dizès2022) and He et al. (Reference He, Favier, Rieutord and Le Dizès2023) for readers interested in further details.
After obtaining the linear harmonic response numerically, we apply a pseudo-spectral method to calculate the steady Reynolds stress. Subsequently, we solve the governing equations (2.5) to determine the mean flow velocity,
 $\boldsymbol{v}_0$
, shown in figure 1(a). The nonlinear vorticity equation for the mean zonal flow is expressed as
 \begin{equation} 2\boldsymbol{\nabla }\times (\boldsymbol{e}_z\times \boldsymbol{v}_0)=-\boldsymbol{\nabla }\times (\boldsymbol{v}_1\boldsymbol{\cdot }\boldsymbol{\nabla }\boldsymbol{v}_1^{*}+\mathrm{c}.\mathrm{c}) +E \boldsymbol{\nabla }\times {\nabla} ^{2}\boldsymbol{v}_{0} . \end{equation}
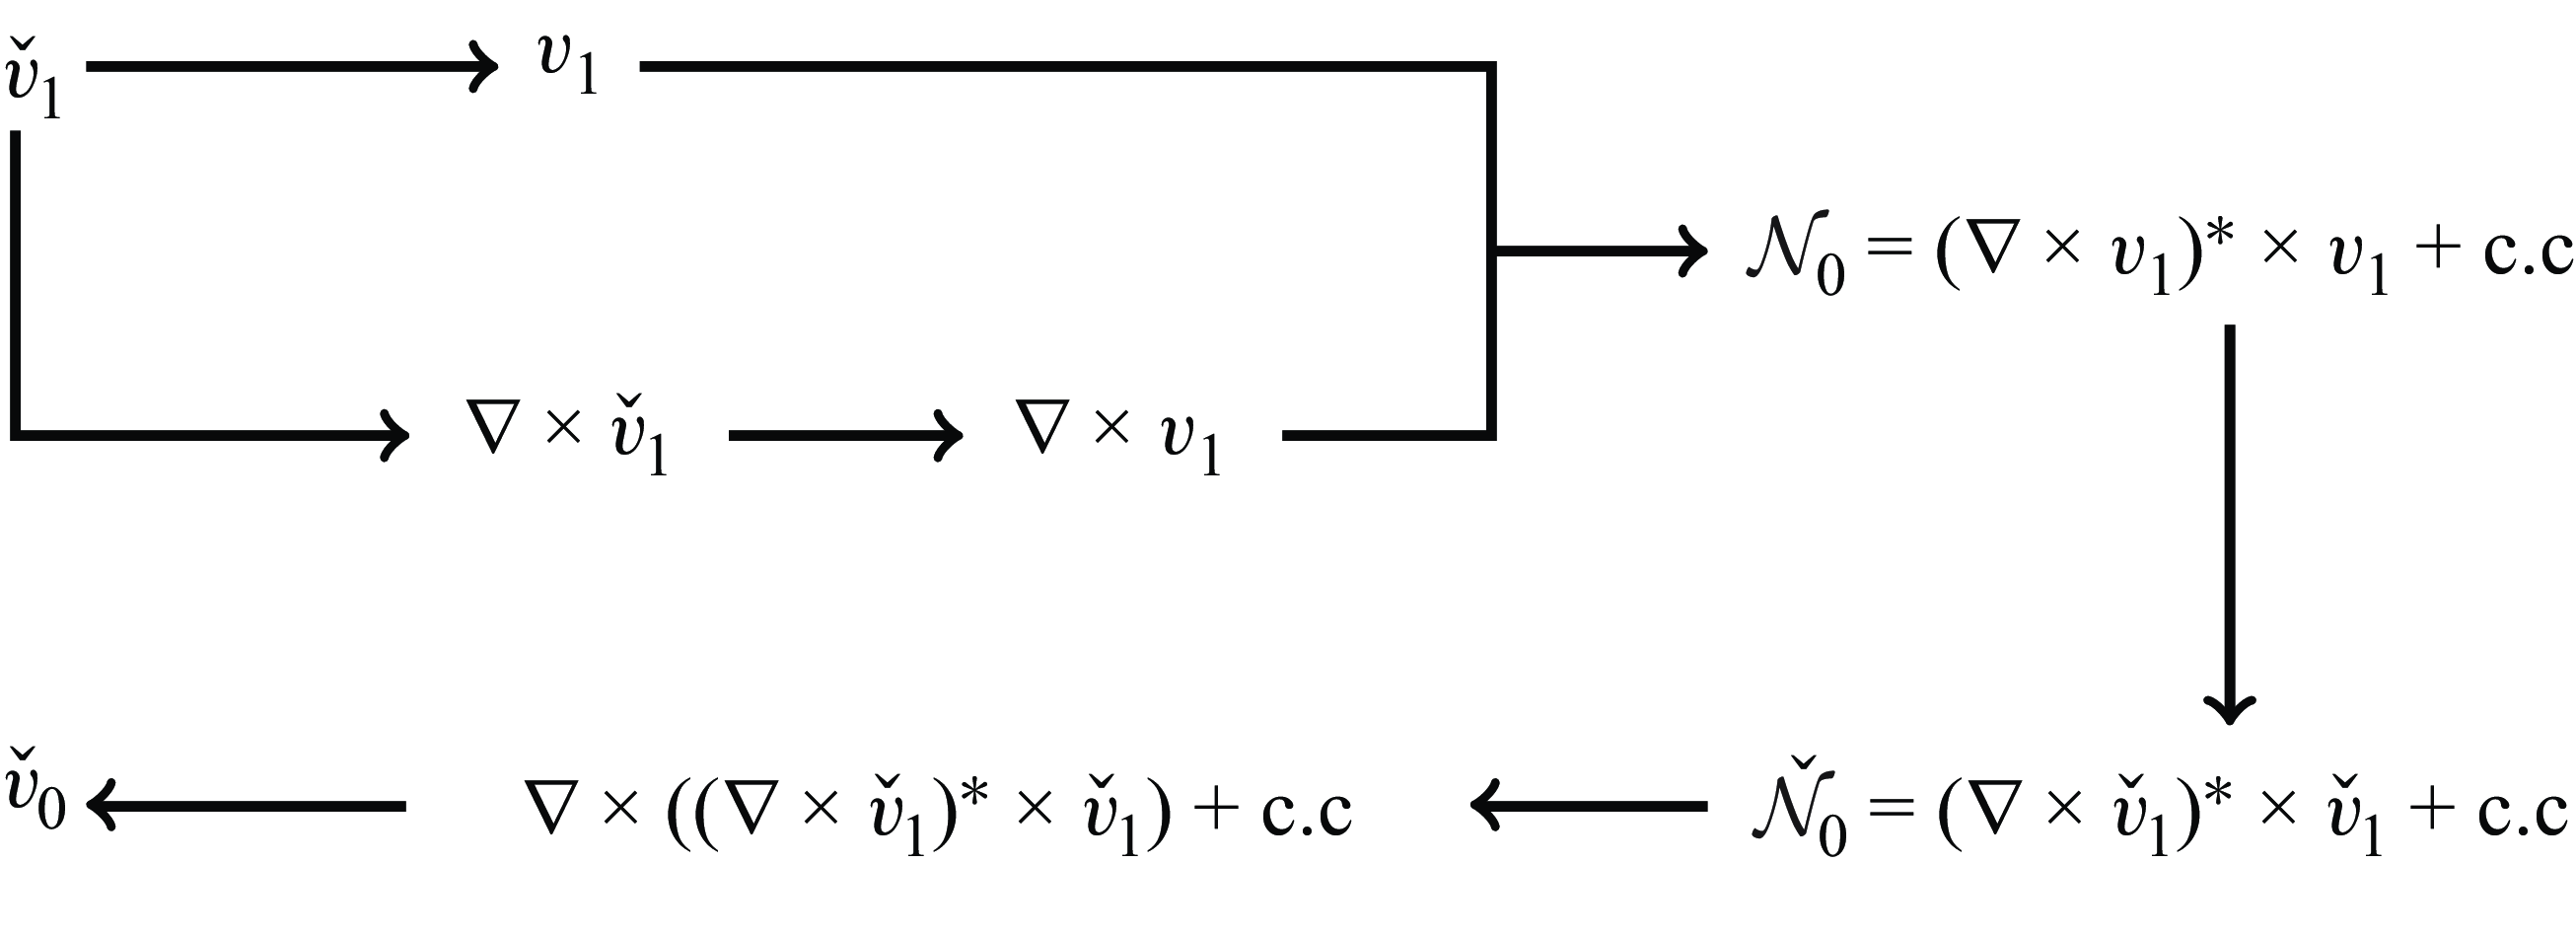
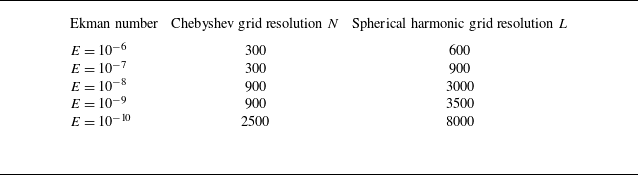
Details on the pseudo-spectral numerical workflow are provided in Appendix A and illustrated in figure 24. We have also investigated potential aliasing issues in this nonlinear set-up and found no significant impact on the results, regardless of whether dealiasing was applied or not. Consequently, all the results discussed in the present paper have not been dealiased. The convergence of our simulations is further demonstrated in Appendix A and the numerical resolutions for different Ekman numbers are documented in table 1 of this appendix. It is important to note that the resolutions required for the nonlinear simulations exceed those used in the purely linear analyses, to ensure similar convergence properties in both cases.
3. Asymptotic description of the harmonic solution
As first demonstrated by Moore & Saffman (Reference Moore and Saffman1969), the propagation and viscous smoothing of a localised singularity can be described, in the limit of small Ekman numbers, by a self-similar solution. This viscous smoothing leads to the emergence of a self-similar expression for the primary components of the wave beam velocity. Note that the concentrated beams that originate from the critical latitude are linked to an inviscid singularity along the critical ray, as identified by Le Dizès (Reference Le Dizès2024).
In the scenario under consideration, it is postulated that concentrated beam rays emanate from the critical latitude singularity where the boundary is locally tangent to the direction of inertial wave propagation, denoted as
 $S_c(r,z)=(\eta \sqrt {1-\omega ^2/4},\eta \omega /2)$
, and propagate in two distinct directions: clockwise, designated as the northward direction, following the path
 $S_c \to P_1 \to P_3 \to P_7 \to P_4 \to S_c$
, and counterclockwise, referred to as the southward direction. As shown in figure 2(b),
 $P_1$
is the point on the characteristic path crossing the rotation axis,
 $P_3$
and
 $P_7$
are the reflection points on the outer boundary while
 $P_4$
is on the equator where two beams are crossing. A local coordinate system
 $(x_{\parallel }, x_{\perp })$
is introduced to locally describe the asymptotic structure of the beam, where
 $x_{\parallel }$
represents the distance from the source located at the critical latitude point
 $S_c$
, and
 $x_{\perp }$
denotes the distance measured perpendicularly to the direction of beam propagation. For simplicity, it is assumed that the orientation of propagation does not change sign. When considering southward propagation, the direction of the corresponding local coordinate system is reversed.
In the following subsections we provide expressions for the harmonic solution in the various regions where the mean flow correction becomes significant. We first review the results obtained by He et al. (Reference He, Favier, Rieutord and Le Dizès2022) on the characteristic path, then present asymptotic expressions near the various interaction regions.
3.1. Self-similar solution and scaling
For the harmonic solution, the localised concentrated beams travel on the beam ray with a constant width of order
 $E^{1/3}$
. The self-similar beam solution provided by Moore & Saffman (Reference Moore and Saffman1969) was used by Le Dizès & Le Bars (Reference Le Dizès and Le Bars2017) and He et al. (Reference He, Favier, Rieutord and Le Dizès2022) to describe at leading order the velocity
 $v_{1\parallel }$
along the direction of the beam propagation,
 \begin{equation} v_{1\parallel }\sim \frac {1}{\sqrt { r }}C_{0}H_{m}(x_{\parallel },x_{\perp })=\frac {1}{\sqrt { r }}C_{0}\left ( \frac {x_{\parallel }}{2\sin \theta } \right )^{-m/3}h_{m}(\zeta ) . \end{equation}
The special function
 $h_m(\zeta )$
is
 \begin{equation} h_m(\zeta )=\frac {\text{e}^{-\mathrm{i}m\pi /2}}{(m-1)!}\int _0^{+\infty }\text{e}^{\mathrm{i}p\zeta -p^3}p^{m-1}{\rm d}p , \end{equation}
with the similarity variable,
 \begin{equation} \zeta =\frac {x_{\perp }}{E^{1/3}}\left ( \frac {2\sin \theta }{x_{\parallel }} \right )^{1/3} . \end{equation}
Here
 $\theta$
is the angle between the inertial wave propagation direction and the equatorial plane, where
 $\theta = \pi /4$
enables the formation of a simple closed wave circuit in our configuration (see figure 2
b). This angle also defines the inclination of the internal shear layers relative to the equatorial plane, with the libration frequency
 $\omega = 2\cos \theta$
. The index
 $m$
of the function
 $h_m(\zeta )$
characterises the nature of the singularity that leads to the formation of the beam (Moore & Saffman Reference Moore and Saffman1969; Thomas & Stevenson Reference Thomas and Stevenson1972), while the complex amplitude
 $C_0$
represents the amplitude of the singularity. A brief review of different values of the index
 $m$
for various configurations is provided by Le Dizès (Reference Le Dizès2020). In particular, for any axisymmetric convex librating object, such as the inner sphere considered in the present study, Le Dizès & Le Bars (Reference Le Dizès and Le Bars2017) determined the values
 $m = 5/4$
and
 $C_0$
by matching the similarity solution with the boundary layer solution around the critical latitude leading to
 \begin{align} C_0^N & = E^{1/12}\tilde {C}_{0}^{N}=E^{1/12}\frac {\textrm{e}^{\mathrm{i}\pi /2}}{8(2\sin \theta )^{3/4}} \quad (\text{northward ray}) , \end{align}
 \begin{align} C_0^S & =E^{1/12}\tilde {C}_{0}^{S}=E^{1/12}\frac {\textrm{e}^{\mathrm{i}3\pi /4}}{8(2\sin \theta )^{3/4}} \quad (\text{southward ray}) . \end{align}
Expression (3.1) describes the main velocity component. In the
 $(r,z)$
plane, there also exists a component along
 $\boldsymbol{e}_\perp$
that is
 $O(E^{1/3})$
smaller.
As shown by (3.4), the velocity amplitude scales as
 $E^{1/12}$
in the asymptotic theory. Internal shear layers within a spherical shell were observed to preserve their self-similar structure upon reflecting on boundaries, undergoing either contraction or expansion during this process. Particular attention was given to how these layers propagate along a periodic rectangular path at specific frequencies of the libration forcing (He et al. Reference He, Favier, Rieutord and Le Dizès2022). Additionally, reflections on the rotation axis were found to induce a phase shift, facilitating the convergence of the summation describing the beam superpositions. The final expressions for the velocity components were derived from these self-similar solutions, resulting in the following compact form in the
 $(r,z)$
plane:
 \begin{equation} \boldsymbol{v}_{1_{2D}}\sim \frac {E^{1/12}}{\sqrt {r}}(\tilde {C}_{0}^{N}G_{m}(x_{\perp }^{N},x_{\parallel }^{N},L^{N}) \boldsymbol{ e}_{\parallel }^N+\tilde {C}_{0}^{S}G_{m}(x_{\perp }^{S},x_{\parallel }^{S},L^{S})\boldsymbol{e}_{\parallel }^S) . \end{equation}
Here the new function
 $G_m$
is given by
 \begin{align} G_{m}(x_{\perp },x_{\|},L)&=\left ( \frac {x_{\parallel }}{2\sin \theta } \right )^{-m/3}g_{m}(\zeta ,L/x_{\parallel }) , \end{align}
 \begin{align} g_{m}(\zeta ,L/x_{\parallel })&=\frac {\textrm{e}^{-\mathrm{i}m\pi /2}}{(m-1)!}\int _0^\infty \frac {\textrm{e}^{\mathrm{i}p\zeta -p^3}p^{m-1}}{1-\mathrm{i}\textrm{e}^{-p^3L/x_{\parallel }}}{\rm d}p , \end{align}
where
 $L$
is the cumulative propagation distance along the rectangular characteristic path for one cycle (explicit form in Appendix B, (B1)).
Compared to the function
 $h_m$
in (3.2), the denominator of
 $g_m$
comes from the beam summation and the ‘
 $\mathrm{i}$
’ factor from the phase shift induced by the reflection on the axis. Note that
 $\boldsymbol{ e}_{\parallel }^S= -\boldsymbol{e}_{\parallel }^N$
.
Expression (3.5) describes the solution on the rectangular circuit
 $P_1P_3P_7P_4$
. As explained in He et al. (Reference He, Favier, Rieutord and Le Dizès2022), a weaker secondary beam is also present between
 $S_c$
and
 $P_6$
owing to the reflection on the inner core. The width scaling of this secondary beam is
 $E^{1/6}$
, indicating a relatively larger transverse scale on which viscous diffusion becomes negligible. Consequently, the parallel velocity component
 $v_{1\parallel }$
of the beam remains constant throughout its path. Furthermore, the amplitude of the beam scales as
 $E^{1/4}$
, which is significantly smaller than the amplitude of the solution on the main beam. The velocity profile along the beam is asymptotically described by
 \begin{equation} \boldsymbol{v}_{1_{2D}} \sim \frac {E^{1/4}}{\sqrt {r}}( \tilde {C}_0^{N}\breve {F}_{m}(\breve {x}_{\perp }^N,\lambda ^{N}) \boldsymbol{e}_{\parallel }^N + \tilde {C}_0^{S}\breve {F}_{m}(\breve {x}_{\perp }^S,\lambda ^{S}) \boldsymbol{e}_{\parallel }^S) ,\end{equation}
where
 \begin{equation} \breve {F}_m(\breve {x}_{\perp },\lambda ) =\frac {\breve {x}_\perp }{\sqrt {2}}\frac {\textrm{e}^{-\mathrm{i}m\pi /2}}{(m-1)!}\int _0^\infty \textrm{e}^{\mathrm{i}p\lambda (\breve {x}_{\perp })^2}\frac {\textrm{e}^{-p^3L/\sqrt {2}}p^{m-1}}{1-\mathrm{i}\textrm{e}^{-p^3L/\sqrt {2}}}{\rm d}p , \end{equation}
with
 $\lambda ^{N}=-\sqrt {2}/4$
,
 $\lambda ^{S}=\sqrt {2}/4$
and
 $\breve {x}_{\perp }=x_\perp /E^{1/6}$
.
A detailed comparison between this asymptotic solution (AS) and numerical solutions (NS) of the linear harmonic viscous problem can be found in He et al. (Reference He, Favier, Rieutord and Le Dizès2022).
The azimuthal velocity,
 $v_{1\phi }$
, can be readily derived from
 $v_{1\|}$
using
 \begin{equation} v_{1\phi }\sim \pm \mathrm{i}v_{1\|} , \end{equation}
where the positive sign (respectively negative sign) corresponds to an obtuse angle (respectively acute angle) between
 $\boldsymbol{e}_{\parallel }$
and
 $\boldsymbol{e}_r$
. This equation also implies that, for
 $\theta =\pi /4$
,
 \begin{equation} v_{1\phi }\sim -\sqrt {2}\mathrm{i} v_{1r}. \end{equation}
The velocity field defined by (3.5) and (3.7) also satisfies, for
 $\theta =\pi /4$
, the remarkable property
 \begin{equation} \frac {\partial v_{1r} }{\partial z} \sim - \frac {\partial v_{1z} }{\partial r} . \end{equation}
The symbol `
 $\sim$
’ in (3.9), (3.10) and (3.11) has to be understood as denoting equality up to corrections of order
 $E^{1/3}$
. We shall see below the importance of these equations for simplifying the expression of the Reynolds stress.
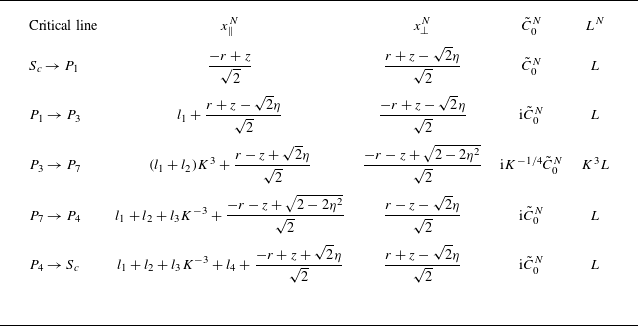
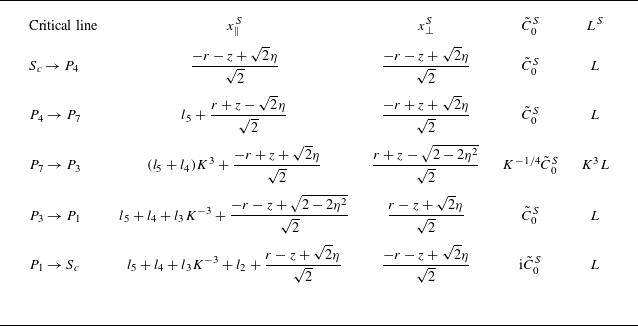
For detailed information about the local coordinate system relationships of northward and southward ray propagation paths, as well as more details about the different beam amplitudes, see tables 2 and 3 in Appendix B. In the following, we shall often keep the parameter
 $m$
unprescribed to show the dependency of the various expressions with respect to this parameter, but one has to keep in mind that in the present analysis
 $m$
and
 $\theta$
are actually fixed to
 $m=5/4$
and
 $\theta =\pi /4$
.
Figure 3 illustrates the scaling behaviour derived from the linear part of the asymptotic analysis. In this figure the beam width scalings are shown in red, while the amplitude scalings are depicted in blue. In particular, the main beam is characterised by a beam width scaling like
 $E^{1/3}$
and an amplitude scaling like
 $E^{1/12}$
. The corresponding scaling for the nonlinear mean flow will be discussed in § 5.
Ekman scalings of the azimuthal velocity
 $v_{1\phi }$
of the linear harmonic solution, reproduced from figure 4 in He et al. (Reference He, Favier, Rieutord and Le Dizès2022), while the amplitudes and the length scales are shown in blue and red, respectively.

3.2. Harmonic solution near
 $P_3$
,
$P_4$
and
$P_7$


As shown in figure 2(b), the beams reflect on the outer boundary at the interaction points
 $P_3$
and
 $P_7$
while two beams intersect on the equatorial plane at the point
 $P_4$
. For describing the solution near those points, it is convenient to introduce the local variables
 \begin{equation} \tilde {r}_\beta = \frac {r-r_{P_\beta }}{E^{1/3}} ,\qquad\tilde {z}_\beta = \frac {z-z_{P_\beta }}{E^{1/3}}, \end{equation}
and express the variables
 $x_\perp$
and
 $x_\parallel$
of the beam in terms of these local variables. Both northward and southward beams exhibit two parts, an incident beam, corresponding to the beam reaching
 $P_ \beta$
and a reflected beam, corresponding to the beam leaving
 $P_\beta$
. Note that the point
 $P_4$
is not on a boundary, but the symmetry of the solution with respect to the equator has the effect of reflecting the beam on the horizontal plane. We shall use the compact notation
 $\tilde {B}_{\beta }^{\textit{Ni}}$
,
 $\tilde {B}_{\beta }^{\textit{Nr}}$
,
 $\tilde {B}_{\beta }^{Si}$
,
 $\tilde {B}_{\beta }^{\textit{Sr}}$
to denote the four contributions present near
 $P_\beta$
. The northward incident beam reaching
 $P_\beta$
is, for instance, given by
 \begin{equation} \tilde {B}_{\beta }^{\textit{Ni}}(\tilde {r}_\beta , \tilde {z}_\beta ) =\tilde {C}_{0\beta }^{\textit{Ni}}G_{m}\left (x_{\perp \beta }^{\textit{Ni}}, x_{\parallel \beta }^{\textit{Ni}}, L_\beta ^{\textit{Ni}}\right )\! , \end{equation}
where the parameters
 $\tilde {C}_{0\beta }^{\textit{Ni}}$
and
 $L_\beta ^{\textit{Ni}}$
and the variables
 $x_{\perp \beta }^{\textit{Ni}}$
and
 $ x_{\parallel \beta }^{\textit{Ni}}$
can be obtained using table 2 of Appendix B. For the southward beam, these quantities are given in table 3.
In each local region around
 $P_3$
,
 $P_4$
and
 $P_7$
, we can write the velocity field as
 \begin{equation} \boldsymbol{v}_{1}\sim \frac {1}{\sqrt {r}}E^{1/12} \boldsymbol{\tilde {v}}_{1} , \end{equation}
with
 \begin{align} \tilde {v}_{1r} &=2^{-1/2}\tilde {B}_3^{+} , \qquad\,\,\, \tilde {v}_{1\phi } =-\mathrm{i}\tilde {B}_3^{+} ,\qquad \tilde {v}_{1z} =2^{-1/2}\tilde {B}_3^{-} \quad\,\,\,\, \textrm {for }\,\,P_3, \end{align}
 \begin{align} \tilde {v}_{1r} &=-2^{-1/2}\tilde {B}_4^{+} , \quad\,\,\,\, \tilde {v}_{1\phi } =\mathrm{i}\tilde {B}_4^{+} ,\qquad\,\,\,\, \tilde {v}_{1z} =-2^ {-1/2}\tilde {B}_4^{-} \quad \textrm {for }\,\,P_4, \end{align}
 \begin{align} \tilde {v}_{1r} &=2^{-1/2}\tilde {B}_7^{-} ,\qquad\,\,\, \tilde {v}_{1\phi } =-\mathrm{i}\tilde {B}_7^{-} , \qquad \tilde {v}_{1z} =-2^ {-1/2}\tilde {B}_7^{+} \quad \textrm {for }\,\,P_7, \end{align}
where
 \begin{align} \tilde {B}_\beta ^{+}(\tilde {r}_\beta ,\tilde {z}_\beta ) = \left( \tilde {B}_{\beta }^{\textit{Ni}}-\tilde {B}_{\beta }^{\textit{Sr}}\right) +\left(\tilde {B}_{\beta }^{\textit{Nr}}-\tilde {B}_{\beta }^{Si}\right)\!, \end{align}
 \begin{align} \tilde {B}_\beta ^{-}(\tilde {r}_\beta ,\tilde {z}_\beta ) = \left(\tilde {B}_{\beta }^{\textit{Ni}}-\tilde {B}_{\beta }^{\textit{Sr}}\right)-\left(\tilde {B}_{\beta }^{\textit{Nr}}-\tilde {B}_{\beta }^{Si}\right)\!. \end{align}
There is a relation between incident and reflected beams: they are such that the normal velocity of the sum of these two contributions vanish on the boundary. This condition can be written, at the three points
 $P_3$
,
 $P_4$
and
 $P_7$
, as
 \begin{align} &\tilde {B}^{\textit{Ni}}_{3}(\tilde {x}_n=0) = K \tilde {B}^{\textit{Nr}}_{3}(\tilde {x}_n=0) , \qquad \tilde {B}^{Si}_{3}(\tilde {x}_n=0) = (1/K) \tilde {B}^{\textit{Sr}}_{3}(\tilde {x}_n=0) , \end{align}
 \begin{align} &\tilde {B}^{\textit{Ni}}_{4}(\tilde {x}_n=0) = \tilde {B}^{\textit{Nr}}_{4}(\tilde {x}_n=0) , \qquad \tilde {B}^{Si}_{4}(\tilde {x}_n=0) = \tilde {B}^{\textit{Sr}}_{4}(\tilde {x}_n=0) , \end{align}
 \begin{align} &\tilde {B}^{\textit{Ni}}_{7}(\tilde {x}_n=0) = (1/K) \tilde {B}^{\textit{Nr}}_{7}(\tilde {x}_n=0) , \qquad \tilde {B}^{Si}_{7}(\tilde {x}_n=0) = K \tilde {B}^{\textit{Sr}}_{7}(\tilde {x}_n=0) , \end{align}
where
 $\tilde {x}_n=0$
denotes the boundary and
 \begin{equation} K =\frac {\sin (\alpha +\pi /4)}{\sin (\alpha -\pi /4)} \end{equation}
the contraction factor of the northward beam at
 $P_3$
.
However, the tangential velocity does not vanish on the boundary. Consequently, in the local region
 $P_3$
and
 $P_7$
where a real boundary is present, a viscous boundary layer is expected to form. This boundary layer was studied in Le Dizès (Reference Le Dizès2020). It was shown to induce a
 $O(E^{1/6})$
viscous correction to the reflected beam, which is further discussed in § 3.5.
3.3. Harmonic solution near
$P_5$
and
$P_6$


The weak beam propagating between
 $S_c$
and
 $P_6$
interacts with the main beam propagating between
 $P_3$
and
 $P_7$
at the point
 $P_5$
. In this interaction region, which is
 $O(E^{1/3})$
large and
 $O(E^{1/6})$
long in the direction aligned with the main beam, the harmonic solution exhibits a particular approximation that can be written as
 \begin{equation} \boldsymbol{v}_{1} \sim \frac {1}{\sqrt {r}}\left(E^{1/4}\boldsymbol{\breve {v}}_{1}+E^{1 /12}\boldsymbol{\tilde {v}}_{1}\right)\! , \end{equation}
with
 \begin{align} & \breve {v}_{1r} = \frac {1}{\sqrt {2}}\left(\breve {B}^{N}-\breve {B}^{S}\right)\! , \quad \breve {v}_{1\phi } = -\mathrm{i}\left(\breve {B}^{N}-\breve {B}^{S}\right)\!, \quad \breve {v}_{1z} = \frac {1}{\sqrt {2}}\left(\breve {B}^{N}-\breve {B}^{S}\right)\!, \end{align}
 \begin{align} & \tilde {v}_{1r} = \frac {1}{\sqrt {2}}\left(\tilde {B}_5^{N}-\tilde {B}_5^{S}\right)\!,\quad \tilde {v}_{1\phi } = -\mathrm{i}\left(\tilde {B}_5^{N} -\tilde {B}_5^{S}\right)\!,\quad \tilde {v}_{1z} = -\frac {1}{\sqrt {2}}\left(\tilde {B}_5^{N}-\tilde {B}_5^{S}\right)\! , \end{align}
where the beam structures are given, for example, for the northward beams by
 \begin{align} & \breve {B}^{N} = \tilde {C}_0^{N}\breve {F}_m \left(\breve {x}_{\perp }^{N},\lambda ^{N}\right) \! , \end{align}
 \begin{align} & \tilde {B}_5^{N}= \tilde {C}_{05}^{N}G_{m}\left(\tilde {x}_{\perp 5 }^{N},x_{\parallel 5}^{N},L_5^N\right)\! . \end{align}
A similar expression is obtained for
 $P_6$
, upon changing
 $\tilde {B}_5^N$
by
 $\tilde {B}_6^S$
and
 $\tilde {B}_5^S$
by
 $\tilde {B}_6^N$
. However,
 $P_6$
being on the boundary, a viscous correction is expected. Because
 $P_6$
is a critical point, this viscous correction is larger than that of
 $P_3$
and
 $P_7$
. It is expected to be of order
 $E^{1/12}$
as shown in Le Dizès (Reference Le Dizès2024). No such correction is generated at
 $P_5$
.
3.4. Harmonic solution near
$P_1$

The point
 $P_1$
where the critical beam reaches the axis is peculiar. At that point, the approximation (3.5) exhibits a singularity, which means that another approximation must be used in the local region near
 $P_1$
. In that region, the velocity and pressure should be expressed using the Hankel transform, as discussed by Le Dizès & Le Bars (Reference Le Dizès and Le Bars2017, (A1)) and He et al. ((Reference He, Favier, Rieutord and Le Dizès2022), (4.1)).
In Le Dizès (Reference Le Dizès2015) the solution was derived for an open-domain configuration, focusing on the local region of beam reflection along the axis. The theory was extended to a closed domain with periodic characteristics in He et al. (Reference He, Favier, Rieutord and Le Dizès2022). Introducing the local variables
 $\tilde {r}_1 = r/E^{1/3}$
and
 $\tilde {z}_1 = (z - \sqrt {2}\eta ) / E^{1/3}$
, they showed that the linear harmonic velocity in
 $P_1$
region can be written as
 \begin{equation} \boldsymbol{v}_{1} \sim E^{-1 / 12}\boldsymbol{\hat {v}}_{1} , \end{equation}
where
 \begin{align} \hat {v}_{1r} & = \frac {\mathrm{i}}{\sqrt {2}}\left ( Q^{N}_{1}+Q^{S}_{1} \right )\! , \end{align}
 \begin{align} \hat {v}_{1\phi } & =Q^{N}_{1}+Q^{S}_{1} , \end{align}
 \begin{align} \hat {v}_{1z} & = \frac {1}{\sqrt {2}}\left ( -Q^{N}_{0}+Q^{S}_{0} \right )\! . \end{align}
The functions
 $Q^{N}_l(\tilde {r}_1, \tilde {z}_1)$
and
 $Q^{S}_l(\tilde {r}_1, \tilde {z}_1)$
are defined, for
 $l=0,1$
, by
 \begin{align} & Q^{N}_{l}(\tilde {r}_1,\tilde {z}_1)=\int _{0}^{\infty }\hat {V}^{N}(\tilde {k})J_{l}(\tilde {k}\tilde {r}_1) \textrm{e}^{ \mathrm{i}\tilde {k}\tilde {z}_1 }\, {\rm d}\tilde {k} , \end{align}
 \begin{align} & Q^{S}_{l}(\tilde {r}_1,\tilde {z}_1)=\int _{0}^{\infty }\hat {V}^{S}(\tilde {k})J_{l}(\tilde {k}\tilde {r}_1) \textrm{e}^{ -\mathrm{i}\tilde {k}\tilde {z}_1 }\, {\rm d}\tilde {k} , \end{align}
where
 $J_l$
are Bessel functions of the first kind. The superscripts
 $N$
and
 $S$
designate the northward and southward beam, respectively.
The functions
 $\hat {V}^{N}$
and
 $\hat {V}^{S}$
are obtained by matching the Hankel transform expression to the solution (3.5) valid away from
 $P_1$
. As shown by He et al. (Reference He, Favier, Rieutord and Le Dizès2022), this leads to the expressions
 \begin{align} \hat {V}^{N} & =2^{m/2-3+1/8}\sqrt { \pi }\textrm{e}^{-\mathrm{i}\pi /4 } \frac {\textrm{e}^{ -\mathrm{i}m\pi /2 }}{(m-1)!} \frac {\tilde {k}^{m-1/2}\textrm{e}^{ -2x_{\parallel }^{N}\tilde {k}^{3} }}{1-\mathrm{i}\textrm{e}^{ -2L\tilde {k}^{3} }}, \end{align}
 \begin{align} \hat {V}^{S} & =2^{m/2-3+1/8}\sqrt { \pi }\frac {\textrm{e}^{ -\mathrm{i}m\pi /2 }}{(m-1)!} \frac {\tilde {k}^{m-1/2}\textrm{e}^{ -2x_{\parallel }^{S}\tilde {k}^{3} }}{1-\mathrm{i}\textrm{e}^{ -2L\tilde {k}^{3} }}, \end{align}
where we have used expressions (3.4) for
 $C_0^{N}$
and
 $C_0^S$
to simplify the expressions given in He et al. (Reference He, Favier, Rieutord and Le Dizès2022, (4.8a,b
)).
Note the scaling of the amplitude in
 $E^{-1/12}$
and of the region size in
 $E^{1 / 3}$
, which has been illustrated in figure 3. The methodology developed for the
 $P_1$
region can be generalised to any beam interaction on the rotation axis. Note in particular that the functions
 ${\hat {V}}^N$
and
 ${\hat {V}}^S$
in our current analysis contain a term in
 $1 - \mathrm{i} \textrm{e}^{-2Lk^3}$
in the denominator, which arises from the summation of infinitely many beam contributions owing to the periodicity of the critical path. For a simple beam interaction without summation, no such term in the denominator is present (see Le Dizès Reference Le Dizès2015).
3.5. Higher-order corrections to the harmonic solution
In the previous sections we provided the leading-order approximation of the harmonic response in the interaction regions. These expressions are based on the similarity solution (3.1) obtained by Moore & Saffman (Reference Moore and Saffman1969), which is known to be valid in an open domain up to
 $O(E^{1/3})$
corrections induced by variations along the beam.
Larger viscous corrections are created when the beam reflects on the boundary. Le Dizès (Reference Le Dizès2020) showed that a viscous correction with an amplitude
 $O(E^{1/6})$
smaller than the main beam is created at reflection. Le Dizès further showed that it takes the form of (3.1) with a larger index,
 $m+1$
. In the present closed geometry, these corrected waves propagate on the closed circuit and, upon summation, yield an expression of the form (3.5) with an amplitude of order
 $E^{1/4}$
and functions
 $G_{m+1}$
replacing
 $G_m$
. Corrections of this form are expected to be created at the points
 $P_3$
and
 $P_7$
for both northward and southward beams.
For the reflections at
 $P_2$
and
 $P_6$
, an even larger viscous correction is expected. Le Dizès (Reference Le Dizès2024) indeed showed that a corrected beam of amplitude
 $O(E^{1/6})$
(that is
 $O(E^{1/12})$
smaller than the main beam) was created at the critical point. This beam has also the similarity form (3.1) but an index
 $m+5/4$
. As for the corrections generated at
 $P_3$
and
 $P_7$
, this correction is expected to accumulate as it propagates along the closed circuit, resulting in an expression of the form (3.5) with an amplitude of order
 $E^{1/6}$
and functions
 $G_{m+5/4}$
instead of
 $G_m$
. Naturally, these first-order corrections will themselves generate higher corrections of order
 $E^{1/4}$
as they reflect at
 $P_2$
and
 $P_6$
, and of order
 $E^{1/3}$
as they reflect at
 $P_3$
and
 $P_7$
. As a result, we expect the higher-order corrections to the harmonic solution (3.5) to be composed, up to
 $O(E^{5/12})$
, of the sum of functions
 $G_{m'}^N$
and
 $G_{m'}^S$
with different values of
 $m'$
. This has an important consequence: the harmonic solution including these viscous corrections satisfies (3.10) and (3.11) up to
 $O(E^{5/12})$
.
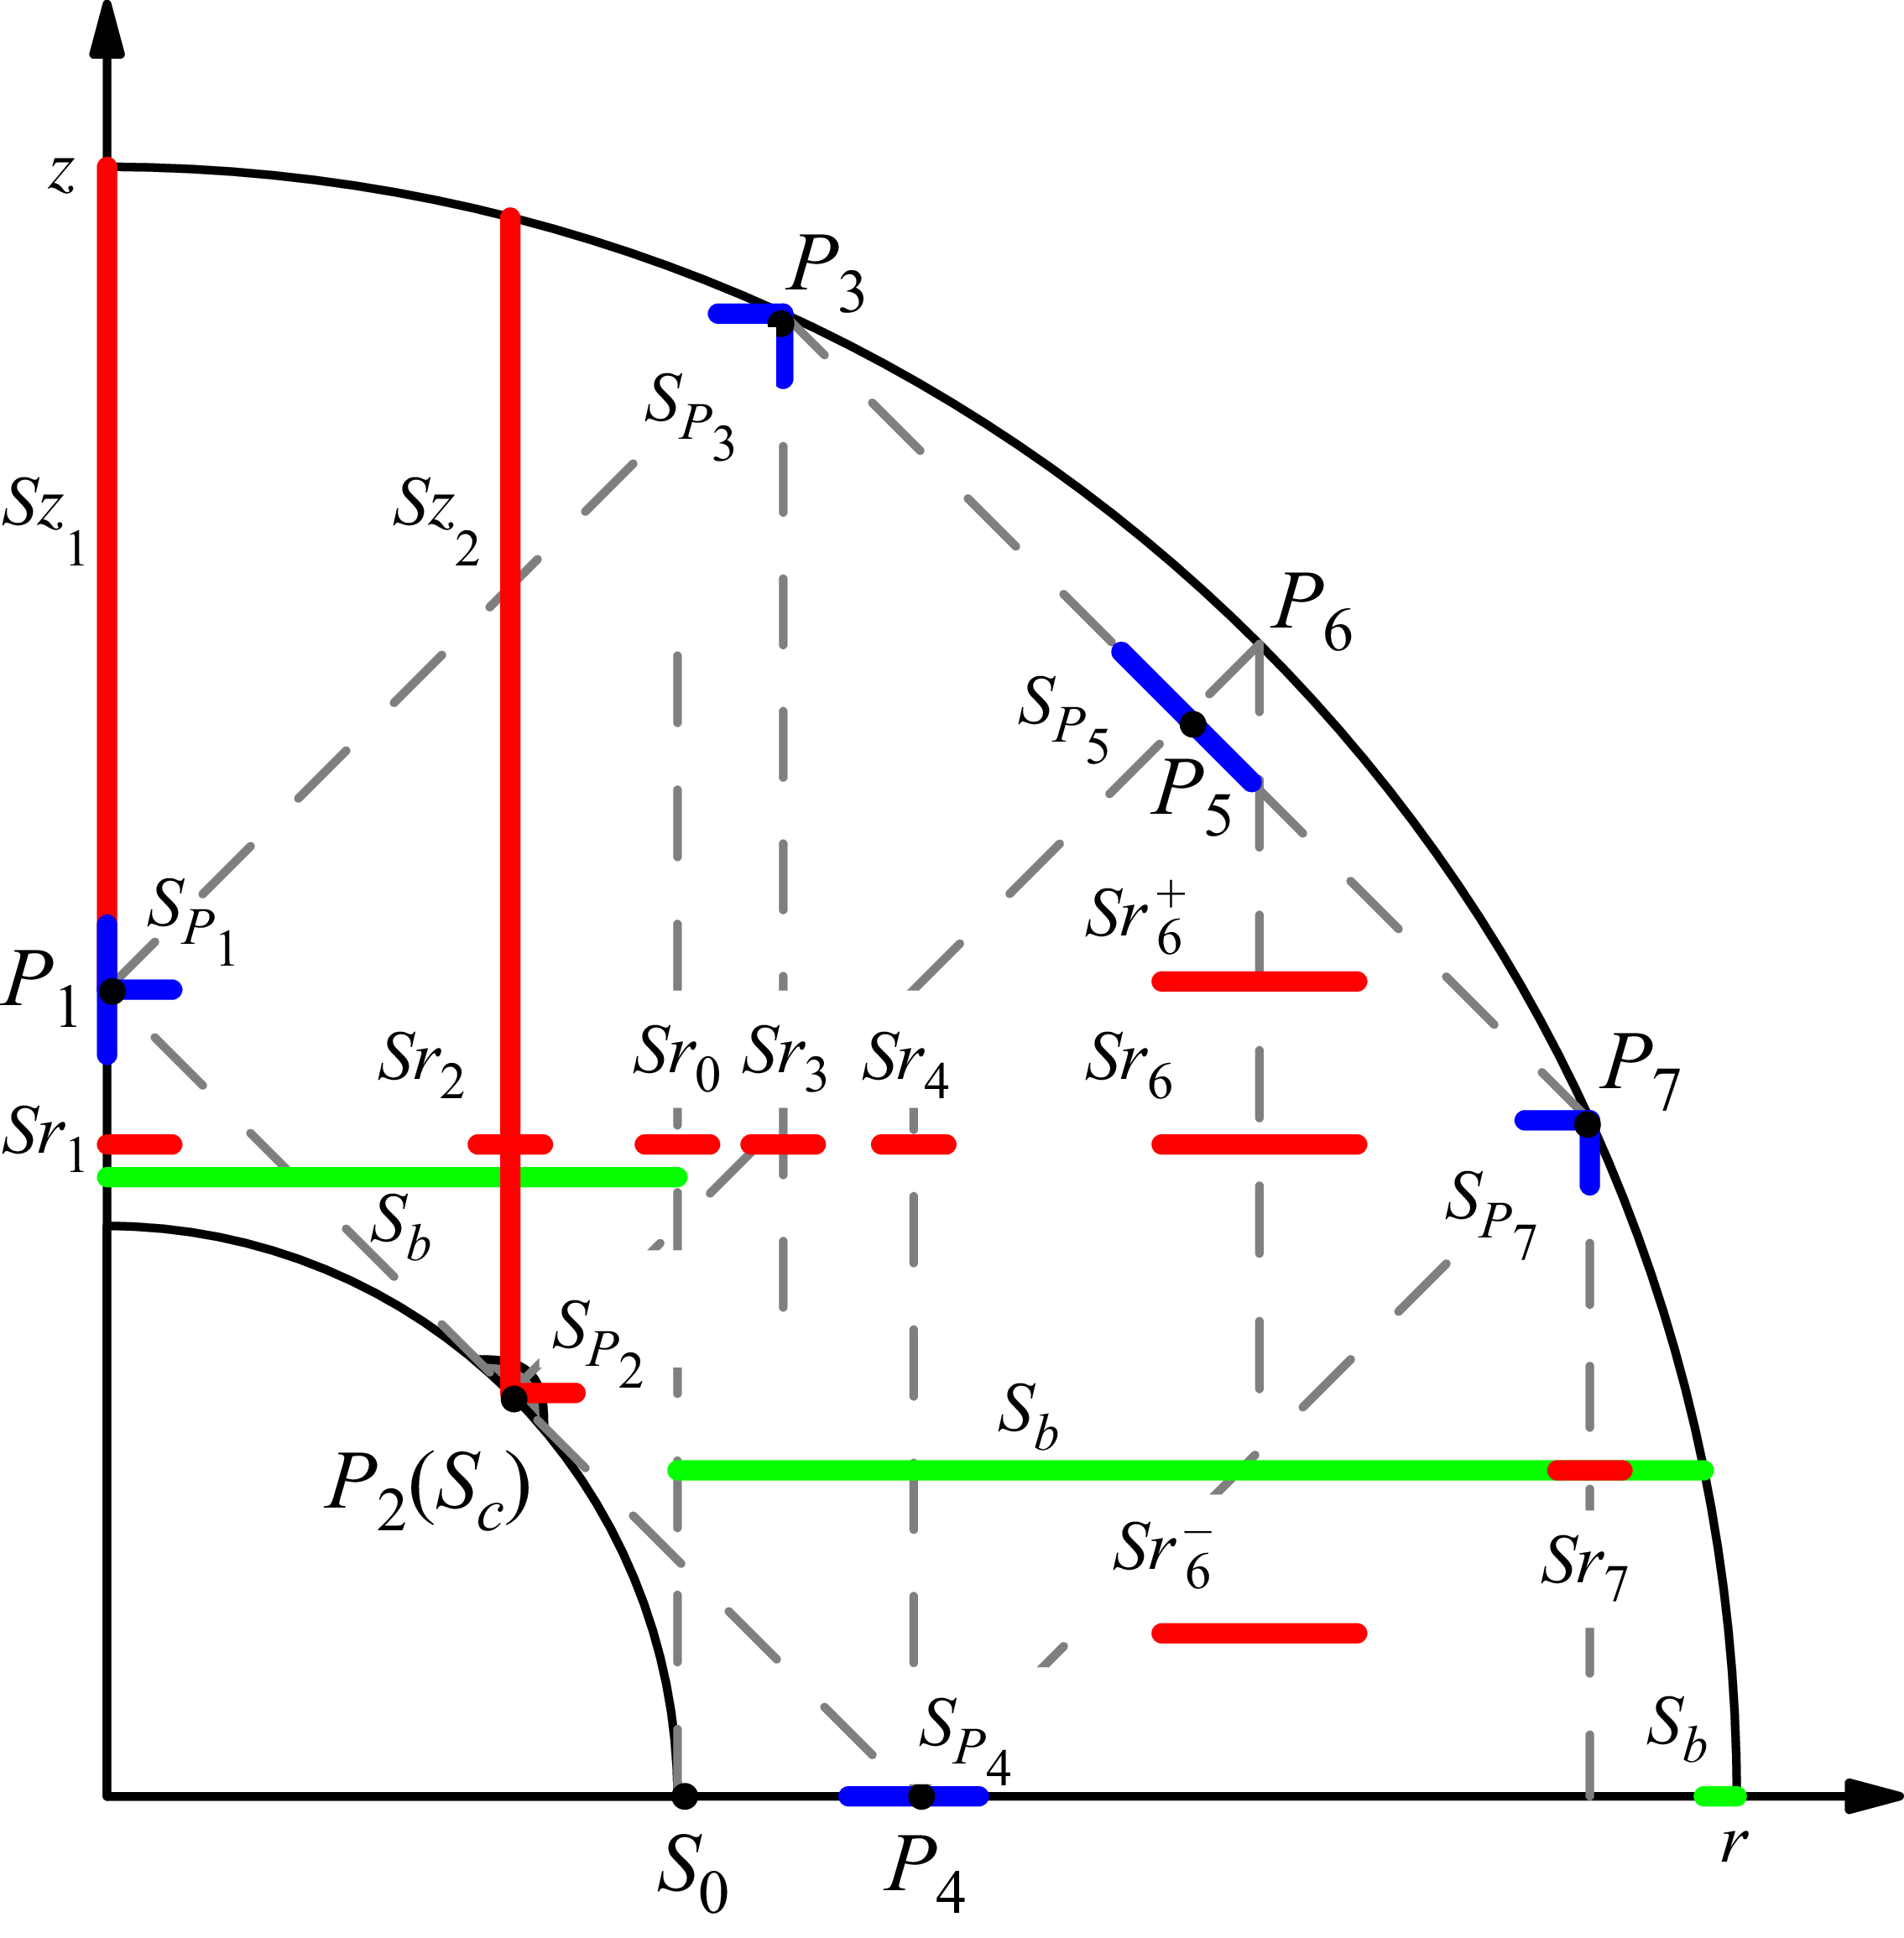
Schematic diagram of the positions of the slices used for comparing theoretical and NS (blue cuts). Green cuts are used to show the global bulk response. Red slices correspond to cases where only the NS is discussed.

4. Mean flow corrections
Our investigation of mean flow corrections proceeds systematically through two main aspects: the global response driven by oscillating boundary layers, and the localised interactions at beam crossing regions. For each interaction region, we present detailed comparisons between numerical and AS, accompanied by rigorous analysis of their scaling behaviours with respect to the Ekman number. This analysis encompasses the scaling of beam characteristics and velocity amplitudes.
To facilitate a clear visualisation of the analysis locations, we employ the colour-coded cutting system shown in figure 4. Blue markers indicate the locations where theoretical solutions are obtained and compared to NS, red markers designate the positions where only numerical results are analysed, and green markers highlight the cuts along which bulk flow solutions are compared.
4.1. Solution in the bulk generated from the boundary layers
In this section we consider the mean flow correction driven by oscillating boundary layers on the inner core. Such a correction was already examined by Sauret & Le Dizès (Reference Sauret and Le Dizès2013) in the absence of critical latitudes and inertial waves. They determined that the mean zonal flow within a spherical shell could be directly inferred from the analytical solutions derived for a full sphere. They showed that an azimuthal velocity of order
 $E^{0}$
was generated in the bulk,
 $v_{0\phi }=\mathcal{F}(\rho ;\omega )$
in their (4.27). Furthermore, they extended their analysis to cases where
 $0\lt \omega \lt 2$
, a condition in which inertial waves emerge and have a weak nonlinear effect on the fluid. Building upon this foundational work, Cébron et al. (Reference Cébron, Vidal, Schaeffer, Borderies and Sauret2021) expanded the theory to include non-homoeoidal spheroidal shells, accounting for variations in the amplitudes of libration forcing at different boundaries. They succinctly expressed the rotation velocity of the mean zonal flow in dimensionless form, presented as (5.5) in their publication.
 $(a)$
Mean azimuthal velocity
 $v_{0\phi }$
in the bulk as predicted by numerical computations (red solid line,
 $E = 10^{-10}$
) and theoretical results (black dashed line, based on Sauret & Le Dizès Reference Sauret and Le Dizès2013 and Cébron et al. Reference Cébron, Vidal, Schaeffer, Borderies and Sauret2021). The light blue background highlights the interior region inside the tangent cylinder, located at
 $r = 0.35$
.
 $(b)$
Logarithm mean azimuthal velocity outside the tangent cylinder from numerical computations at different Ekman numbers. Inside the tangent cylinder, cuts are taken at
 $S_{b}$
and
 $z = 0.4$
. For the outer region, cuts are taken at
 $z = 0.2$
initially and then on the equator once the cut reaches the outer boundary; see figure 4. The directory containing the data and the Jupyter notebook used to compute the asymptotic theory and generate this figure can be accessed at https://multimediafluids.uam.elogim.com/S0022112025109841/JFM-Notebooks/files/Figure5/Figure5.ipynb.

In our study, we use (5.5) from Cébron et al. (2021), illustrating the theoretical predictions with a black dashed line in figure 5(a). Our numerical computations at
 $E=10^{-10}$
show excellent agreement with this theoretical prediction. This confirms that nonlinear effects within the Ekman boundary layer remain one of the important sources of mean zonal flow within the shell. Additionally, we identify two critical lines:
 $r=\eta /\sqrt {2}$
, which marks the critical latitude, and
 $r=\eta$
, denoting the cylinder tangent to the inner core boundary. Our numerical computations confirm that (5.5) from Cébron et al. (Reference Cébron, Vidal, Schaeffer, Borderies and Sauret2021) remains applicable even in the presence of inertial waves.
In the band issued from
 $S_0$
, which is tangent to the inner core, we expect Stewartson layers characterised by three distinct widths:
 $E^{2/7}$
for the internal layers,
 $E^{1/3}$
for the inner layer and
 $E^{1/4}$
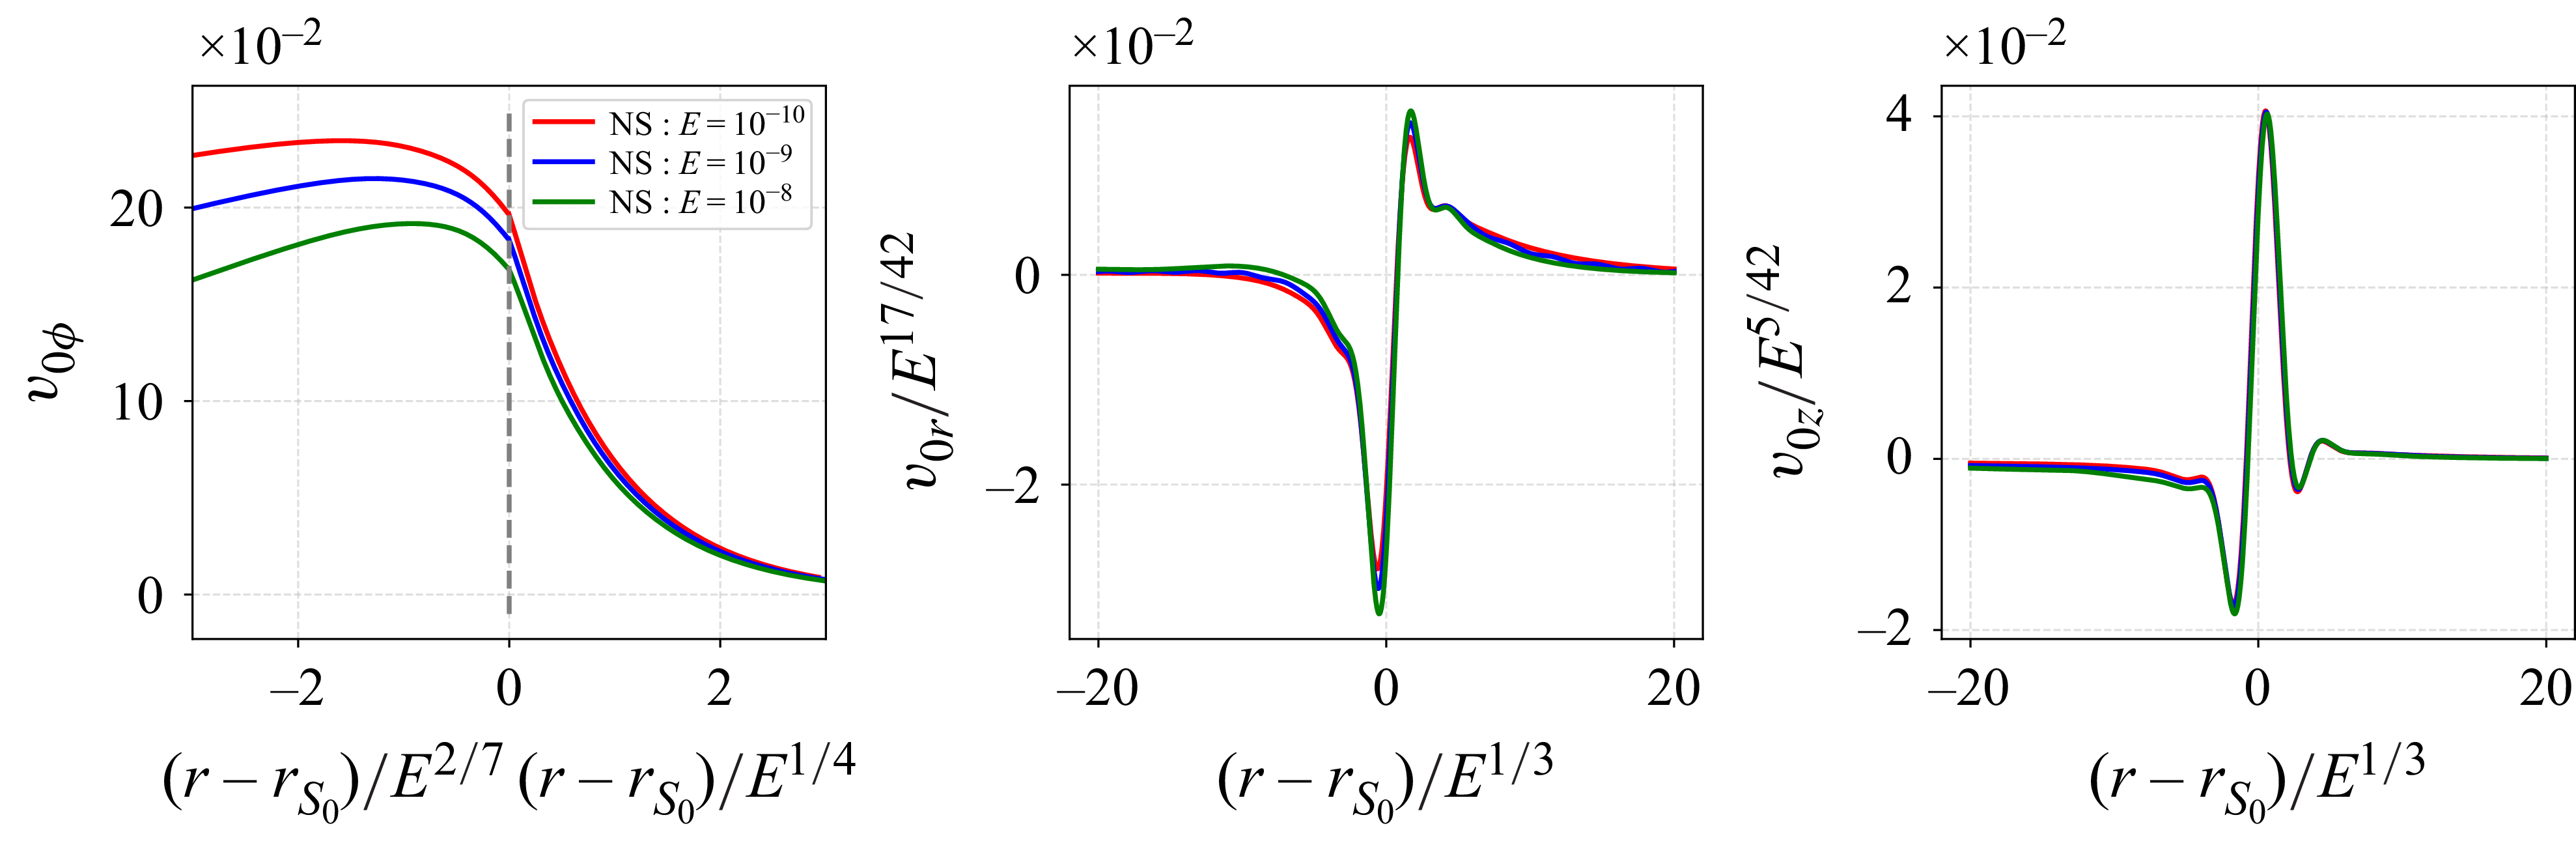
for the external layers (Stewartson Reference Stewartson1966; Dormy & Soward Reference Dormy and Soward2007; Sauret & Le Dizès Reference Sauret and Le Dizès2013). In figure 6(a) the azimuthal velocity is plotted using the internal and external layer variables. The external scaling is perfectly recovered for this component. For the radial and axial velocity components, the scalings in
 $E^{17/42}$
and
 $E^{5/42}$
, which are predicted by the theory (Sauret & Le Dizès Reference Sauret and Le Dizès2013) in the inner layer, are compatible with the numerical results, as shown in figure 6(b,c).
The length and amplitude scaling at
 $Sr_{0}$
are revealed from the NS by the velocity profiles of three Ekman numbers. The different scalings observed in the azimuthal velocity component
 $v_{0\phi }$
originate from the Stewartson layer.

It is important to note that previous theoretical frameworks generally assumed that the velocity outside the tangent cylinder remains zero when forcing is applied at the inner core boundary only. Contrary to this assumption, our numerical results shown in figure 5(b) reveal that this is not the case when inertial waves are present. We indeed observe a bulk azimuthal flow of order
 $E^{1/3}$
. Also visible are distinct peaks in the velocity profiles within the outer shell. These peaks correspond to specific regions where shear layers emitted from the critical latitude interact, either due to reflection on boundaries or through intersection within the volume. Although weak, these bands appear to exhibit the same scaling in
 $E^0$
as the mean flow generated by the boundary layer on the inner core. This observation provides important context for the subsequent research questions: What is the origin of these weak nonlinear zonal beams? How can we determine the corresponding amplitude and beam width? Addressing these questions constitutes one of the objectives of the present study. In the following sections we explain the origin of these weak nonlinear zonal beams and demonstrate the observed Ekman scaling.
4.2. Solution generated from the interaction along the beam
Equations (2.5) governing the mean flow correction read in cylindrical coordinates as
 \begin{align} -2v_{0\phi }+\frac { \partial p_{0} }{ \partial r } & =-\mathcal{N}_{0r} + E\left (\Delta -\frac {1}{r^2}\right )v_{0r}, \end{align}
 \begin{align} 2v_{0r} & =-\mathcal{N}_{0\phi } +E\left (\Delta -\frac {1}{r^2}\right )v_{0\phi }, \end{align}
 \begin{align} \frac { \partial p_{0} }{ \partial z } & =-\mathcal{N}_{0z} +E\Delta v_{0z} , \end{align}
 \begin{align} \frac {1}{r}\frac { \partial }{ \partial r } (rv_{0r})+\frac { \partial v_{0z} }{ \partial z } & =0 , \end{align}
where the Reynolds stress
 $\mathcal{N}_0=(\mathcal{N}_{0r}, \mathcal{N}_{0\phi }, \mathcal{N}_{0z})$
is given by
 \begin{align} \mathcal{N}_{0r} & = v_{1r}\frac { \partial v_{1r}^{*} }{ \partial r } +v_{1z}\frac { \partial v_{1r}^{*} }{ \partial z } - \frac {v_{1\phi }v_{1\phi }^{*}}{r}+\mathrm{c}.\mathrm{c} , \end{align}
 \begin{align} \mathcal{N}_{0\phi } & = v_{1r}\frac { \partial v_{1\phi }^{*} }{ \partial r } +v_{1z}\frac { \partial v_{1\phi }^{*} }{ \partial z } + \frac {v_{1r}v_{1\phi }^{*}}{r}+\mathrm{c}.\mathrm{c} , \end{align}
 \begin{align} \mathcal{N}_{0z} & =v_{1r}\frac { \partial v_{1z}^{*} }{ \partial r } +v_{1z}\frac { \partial v_{1z}^{*} }{ \partial z } +\mathrm{c}.\mathrm{c} . \end{align}
The Reynolds stress expression can be simplified along the beam using the properties (3.10) and (3.11) that the harmonic solution satisfies. It gives, using (3.10) and (3.11),
 \begin{align} &\mathcal{N}_{0r} \sim \frac {\partial }{\partial r}\left ( | v_{1r}|^2 - | v_{1z}| ^2\right ) - 4 \frac {| v_{1r} |^2 }{r} , \end{align}
 \begin{align} & \mathcal{N}_{0\phi } \sim 2 \frac {\partial }{\partial z} \operatorname {Im}(v_{1r} v_{1z}^*) , \end{align}
 \begin{align} & \mathcal{N}_{0z} \sim -\frac {\partial }{\partial z}\left ( | v_{1r}|^2 - | v_{1z}| ^2\right ) \! . \end{align}
If we neglect the viscous terms, a particular solution to (4.1) can be obtained as
 \begin{align} &v_{0r} = - \frac {\partial }{\partial z} \operatorname {Im}(v_{1r} v_{1z}^*) , \end{align}
 \begin{align} &v_{0\phi } = \frac {\partial }{\partial r}\left ( | v_{1r}|^2 - | v_{1z}| ^2\right ) - 2 \frac {| v_{1r} |^2 }{r} , \end{align}
 \begin{align} &v_{0z} = \frac {1}{r}\frac {\partial }{\partial r} r \operatorname {Im}(v_{1r} v_{1z}^*) . \end{align}
As the harmonic velocity
 $\boldsymbol{v}_1$
varies with respect to a spatial variable that scales as
 $E^{1/3}$
for the main beam and as
 $E^{1/6}$
for the secondary beam, the viscous terms associated with the solution (4.4) remain small. This expression is therefore expected to be valid along the beam.
However, this solution is small, of order
 $E^{1/6}$
, when evaluated using (3.5), and of order
 $E^{1/2}$
, when evaluated using (3.7). It becomes large only when two beams intersect, that is, in the local regions
 $P_\beta$
. In the next subsections we provide the scaling and the expression of the solution in the three typical interaction regions.
4.2.1. Solution in the local regions
$P_3$
,
$P_4$
and
$P_7$


Close to those points, the particular solution reduces, at leading order, to
 \begin{equation} \boldsymbol{v}_0 \sim \frac {1}{r}E^{-1/6} \boldsymbol{\tilde {v}}_0 , \end{equation}
with
 \begin{equation} \begin{pmatrix} \tilde {v}_{0r} \\[10pt] \tilde {v}_{0\phi } \\[10pt] \tilde {v}_{0z} \end{pmatrix}=\begin{pmatrix} \displaystyle {-\frac {1}{\sqrt {2}} \frac { \partial \widetilde {\mathcal{N}}_{P_\beta } }{ \partial \tilde {z}_\beta } } \\[8pt] \displaystyle { \frac { \partial \widetilde {\mathcal{M}}_{P_\beta } }{ \partial \tilde {r}_\beta } } \\[8pt] \displaystyle {\frac {1}{\sqrt {2}} \frac { \partial \widetilde {\mathcal{N}}_{P_\beta } }{ \partial \tilde {r}_\beta } } \end{pmatrix} , \end{equation}
where the functions
 $\widetilde {\mathcal{M}}_{P_{\beta }}$
and
 $\widetilde {\mathcal{N}}_{P_{\beta }}$
are given by
 \begin{align} \widetilde {\mathcal{M}}_{P_{3}} = 2\mathrm{Re}\widetilde {\mathcal{Q}}_3,\qquad \widetilde {\mathcal{M}}_{P_{4}} = 2\mathrm{Re}\widetilde {\mathcal{Q}}_4 ,\qquad \widetilde {\mathcal{M}}_{P_{7}} = - 2\mathrm{Re}\widetilde {\mathcal{Q}}_7, \end{align}
 \begin{align} \widetilde {\mathcal{N}}_{P_{3}} = -2\mathrm{Im}\widetilde {\mathcal{Q}}_3 ,\qquad \widetilde {\mathcal{N}}_{P_{4}} = -2\mathrm{Im}\widetilde {\mathcal{Q}}_4 ,\qquad \widetilde {\mathcal{N}}_{P_{7}} = -2\mathrm{Im}\widetilde {\mathcal{Q}}_7, \\[9pt] \nonumber \end{align}
with
 \begin{equation} \widetilde {\mathcal{Q}}_\beta (\tilde {r}_\beta ,\tilde {z}_\beta ) =\left(\tilde {B}_{\beta }^{\textit{Ni}}- \tilde {B}_{\beta }^{\textit{Sr}} \right)\left( \tilde {B}_{\beta }^{Nr*} - \tilde {B}_{\beta }^{Si*}\right)\! . \end{equation}
As it can be seen on these expressions, only four nonlinear contributions remain. They are all confined to the local interaction regions. This result aligns with the outcomes of our numerical computations and meets our expectations. This further supports the idea that the main sources of zonal flow are constrained to the
 $O(E^{1/3})$
regions where incident and reflected beams interact.
From (4.6), one can also obtain the normal and tangential velocity associated with this solution:
 \begin{equation} \tilde {v}_{0n}=-\frac {1}{\sqrt {2}} \frac { \partial \widetilde {\mathcal{N}}_{P_\beta } }{ \partial \tilde {x}_{t} } ,\qquad \tilde {v}_{0t}=\frac {1}{\sqrt {2}} \frac { \partial \widetilde {\mathcal{N}}_{P_\beta } }{ \partial \tilde {x}_{n} } . \end{equation}
Thanks to (3.17), one can see that expression (4.7) with (4.8) reduces at the boundary (
 $\tilde {x}_n=0$
) to
 $ \widetilde {\mathcal{N}}_{P_\beta } (\tilde {x}_n=0) = 0$
. This implies that the normal velocity vanishes at the boundary. The non-penetration condition is then automatically satisfied. This has an important consequence. It means that the particular solution (4.6) is the leading-order solution in each local region around
 $P_\beta$
. It is this expression that will be compared to the NS close to each
 $P_\beta$
. Since the functions
 $ \widetilde {\mathcal{M}}_{P_\beta }$
and
 $\widetilde {\mathcal{N}}_{P_\beta }$
are both localised, all the velocity components are also localised near
 $P_\beta$
at this order.
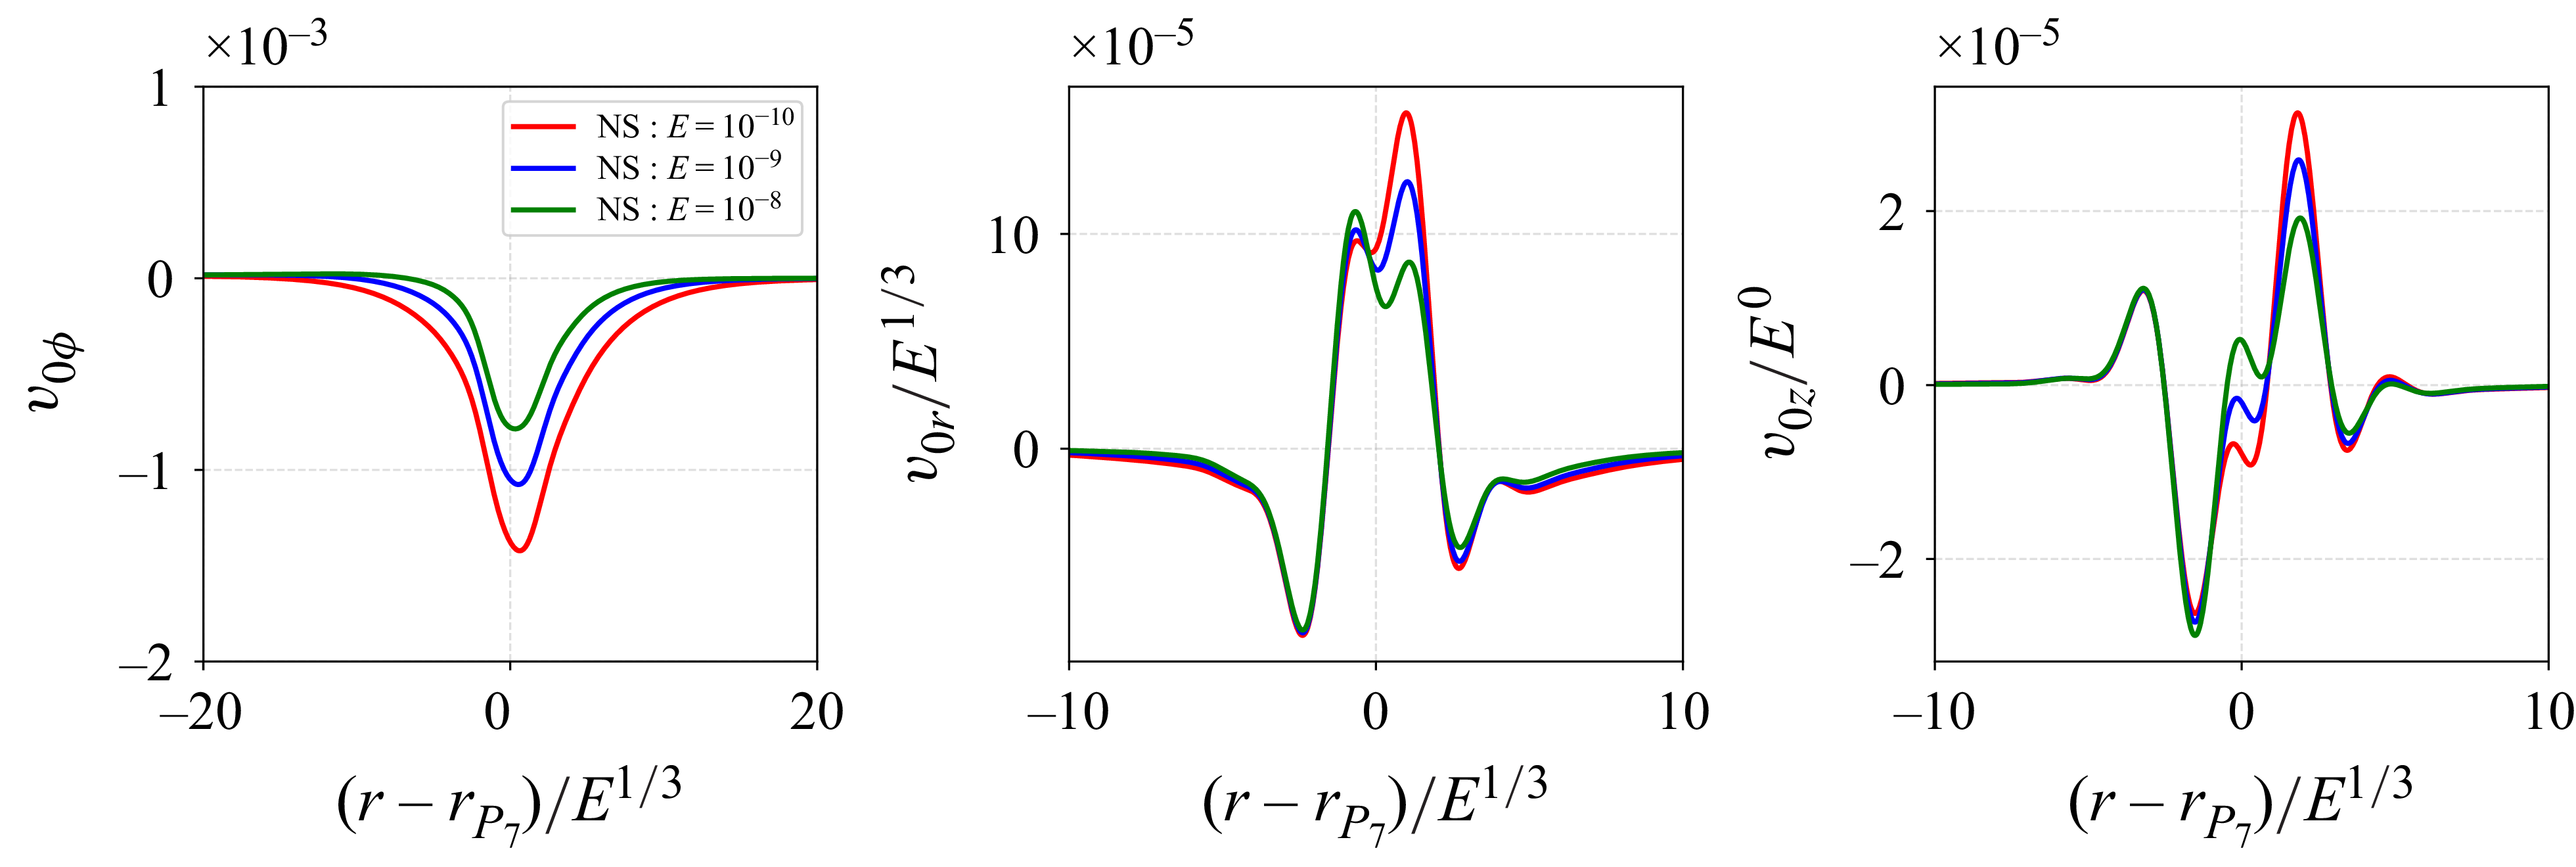
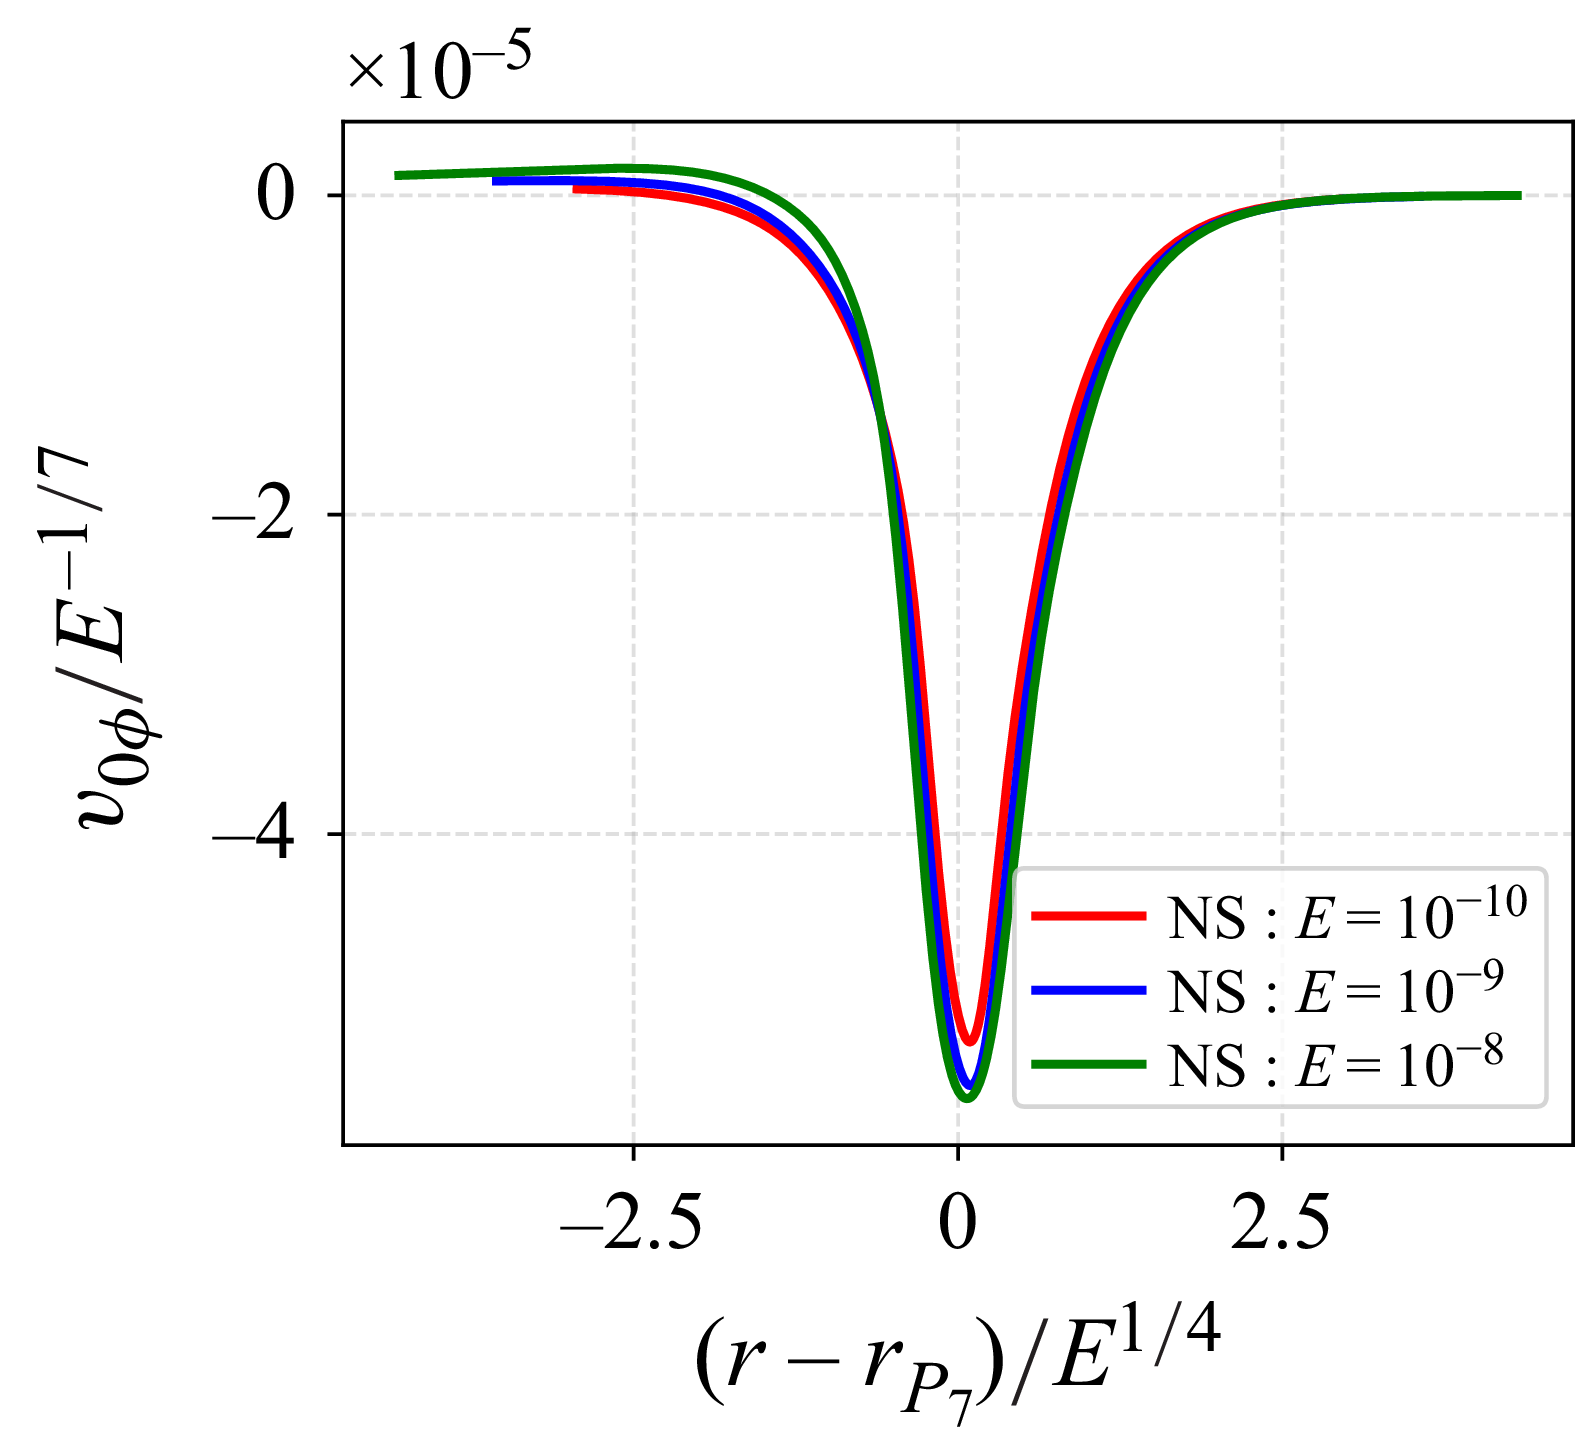
Figure 7 compares the profiles of three asymptotic velocity components with NS for three different Ekman numbers near
 $P_7$
. The comparison is performed on the vertical and horizontal slices
 $S_{P_7}$
, as depicted in figure 4. As expected, the asymptotic theoretical results increasingly align with the numerical data as the Ekman number decreases. However, discrepancies are observed in the radial velocity,
 $v_{0r}$
, and the axial velocity,
 $v_{0z}$
, near the boundary. These discrepancies arise because the numerical boundary condition employs a no-slip condition, causing the NS to approach zero at the boundary, while only the non-penetration condition is satisfied by the AS. As demonstrated in Le Dizès (Reference Le Dizès2020), another approximation can be constructed in a viscous boundary layer of
 $O(E^{1/2})$
width to capture this behaviour.
In addition, the azimuthal velocity along the
 $z$
axis, parallel to the rotation axis, tends to zero in the asymptotic theory as one moves away from the local interaction point. However, numerical results display a small amplitude zonal flow in the bulk (see the bottom left panel of figure 7). This is also evident in figure 1, where several weak bands are visible throughout the bulk. The scaling of these bands will be discussed in the next section, using the results given in Appendix C.
Three velocity component profiles of the
 $AS$
and the NS for three different Ekman numbers at local region
 $P_7$
with two direction cuts (
 $S_{P_7}$
in figure 4). The directory containing the data and the Jupyter notebook used to compute the asymptotic theory and generate this figure can be accessed at https://multimediafluids.uam.elogim.com/S0022112025109841/JFM-Notebooks/files/Figure7/Figure7.ipynb.

Same caption as figure 7 but at local region
 $P_3$
(cuts at
 $S_{P_3}$
). The directory containing the data and the Jupyter notebook used to compute the asymptotic theory and generate this figure can be accessed at https://multimediafluids.uam.elogim.com/S0022112025109841/JFM-Notebooks/files/Figure8/Figure8.ipynb.

Comparison of AS and NS of two velocity components (
 $v_{0z}=0$
) at local region
 $P_4$
(cuts position at
 $S_{P_4}$
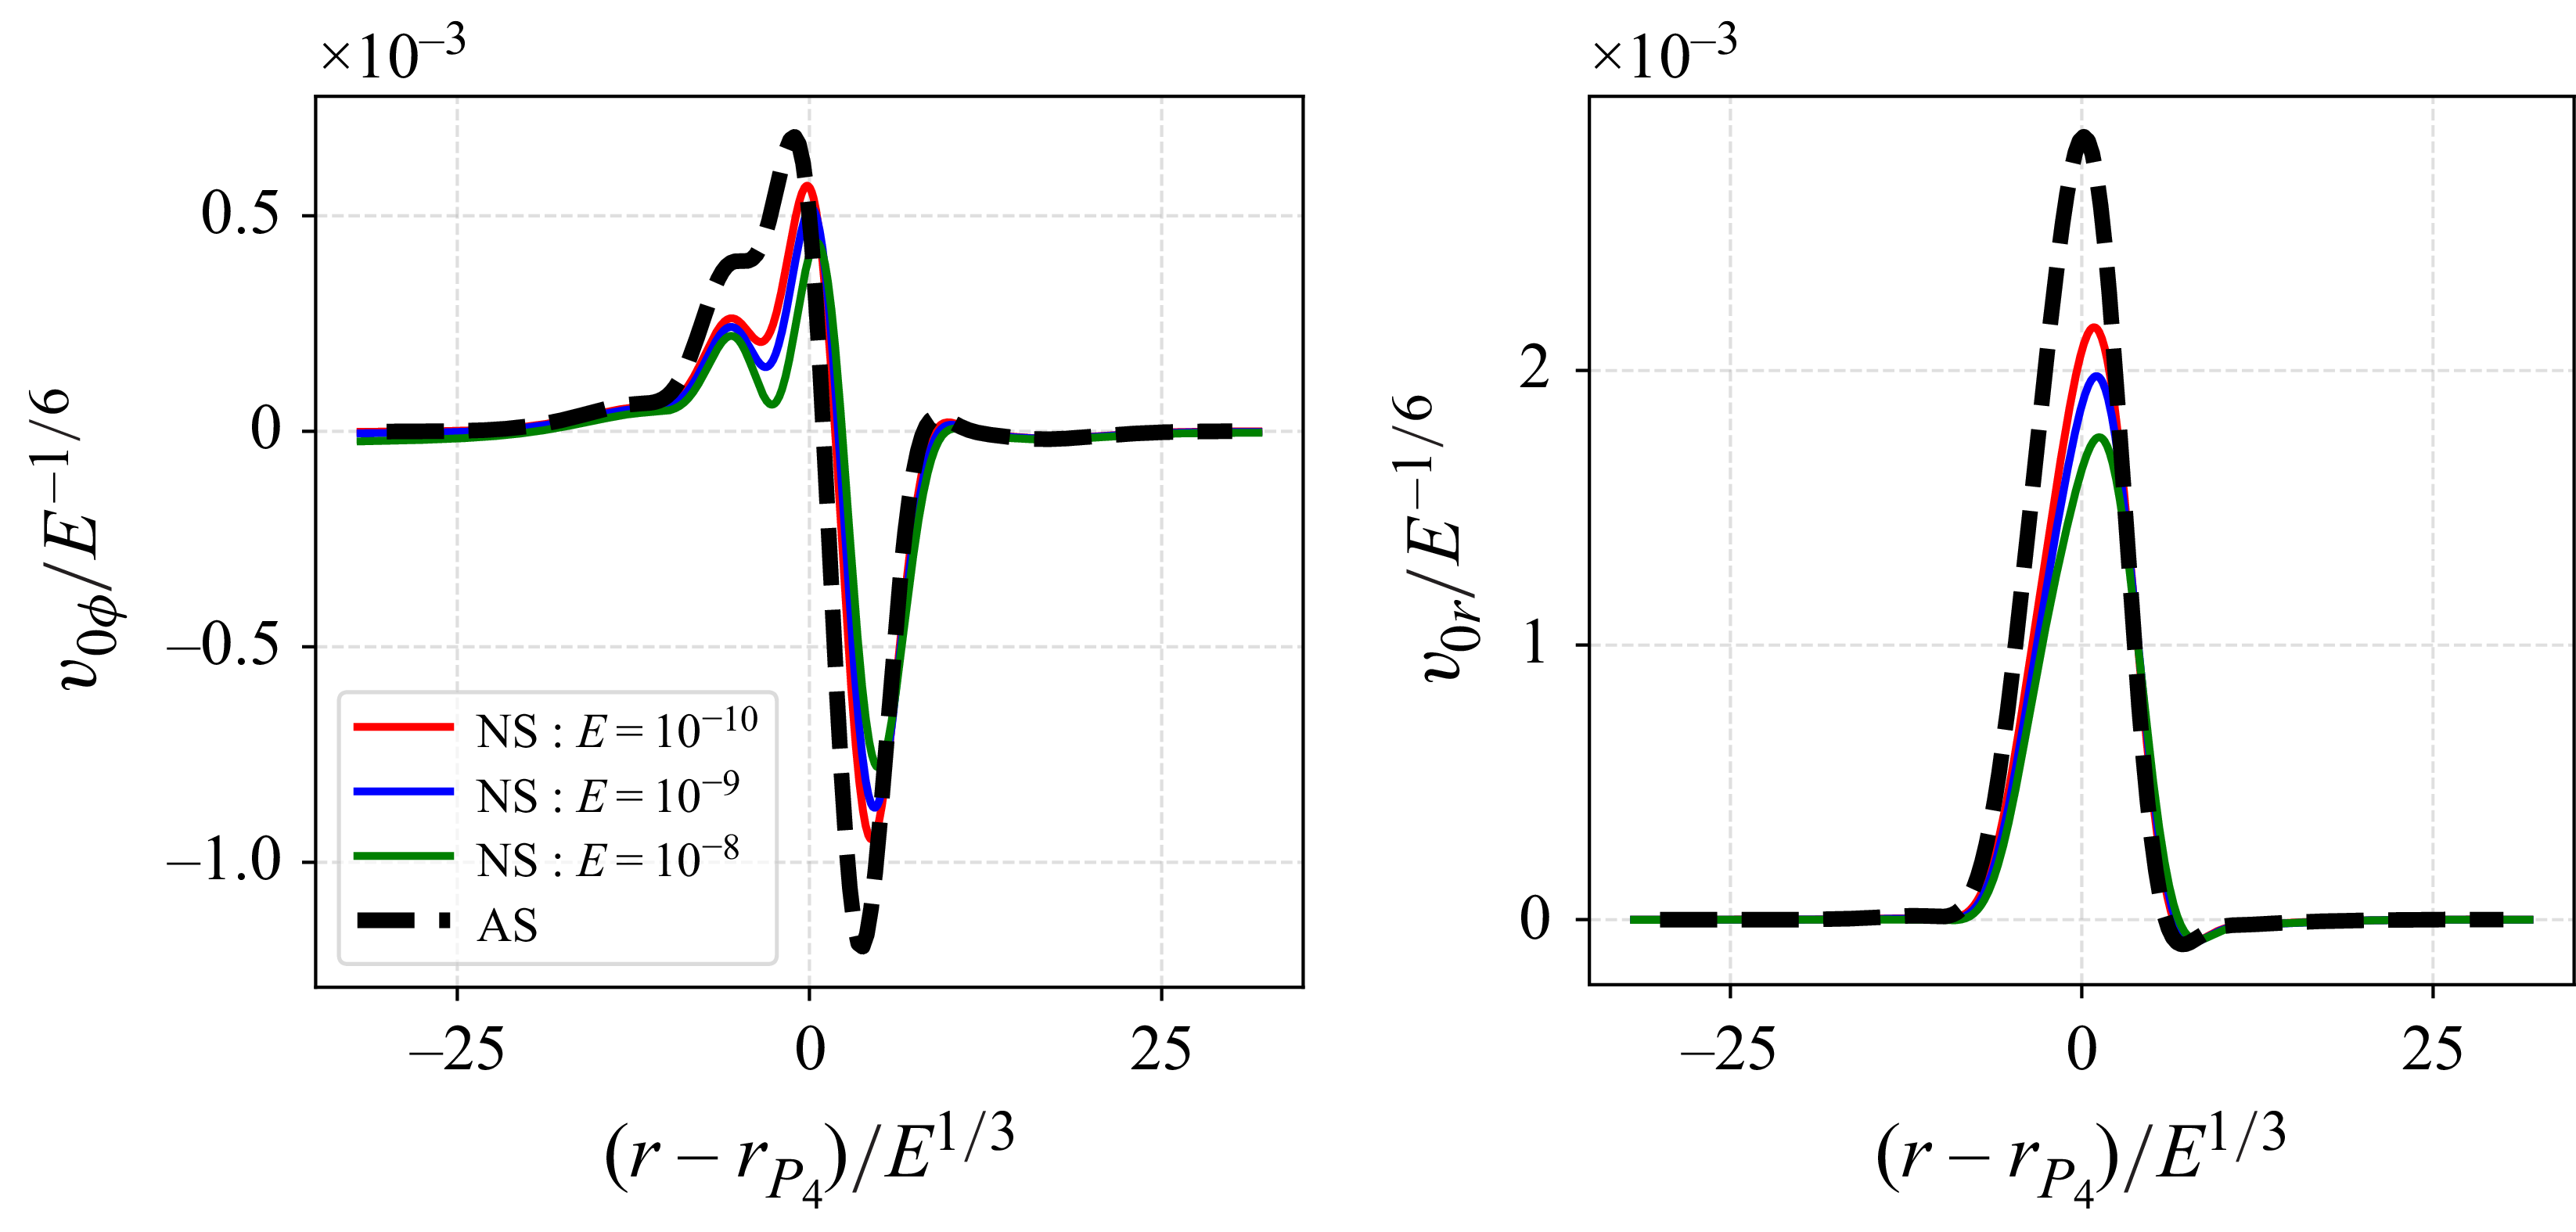
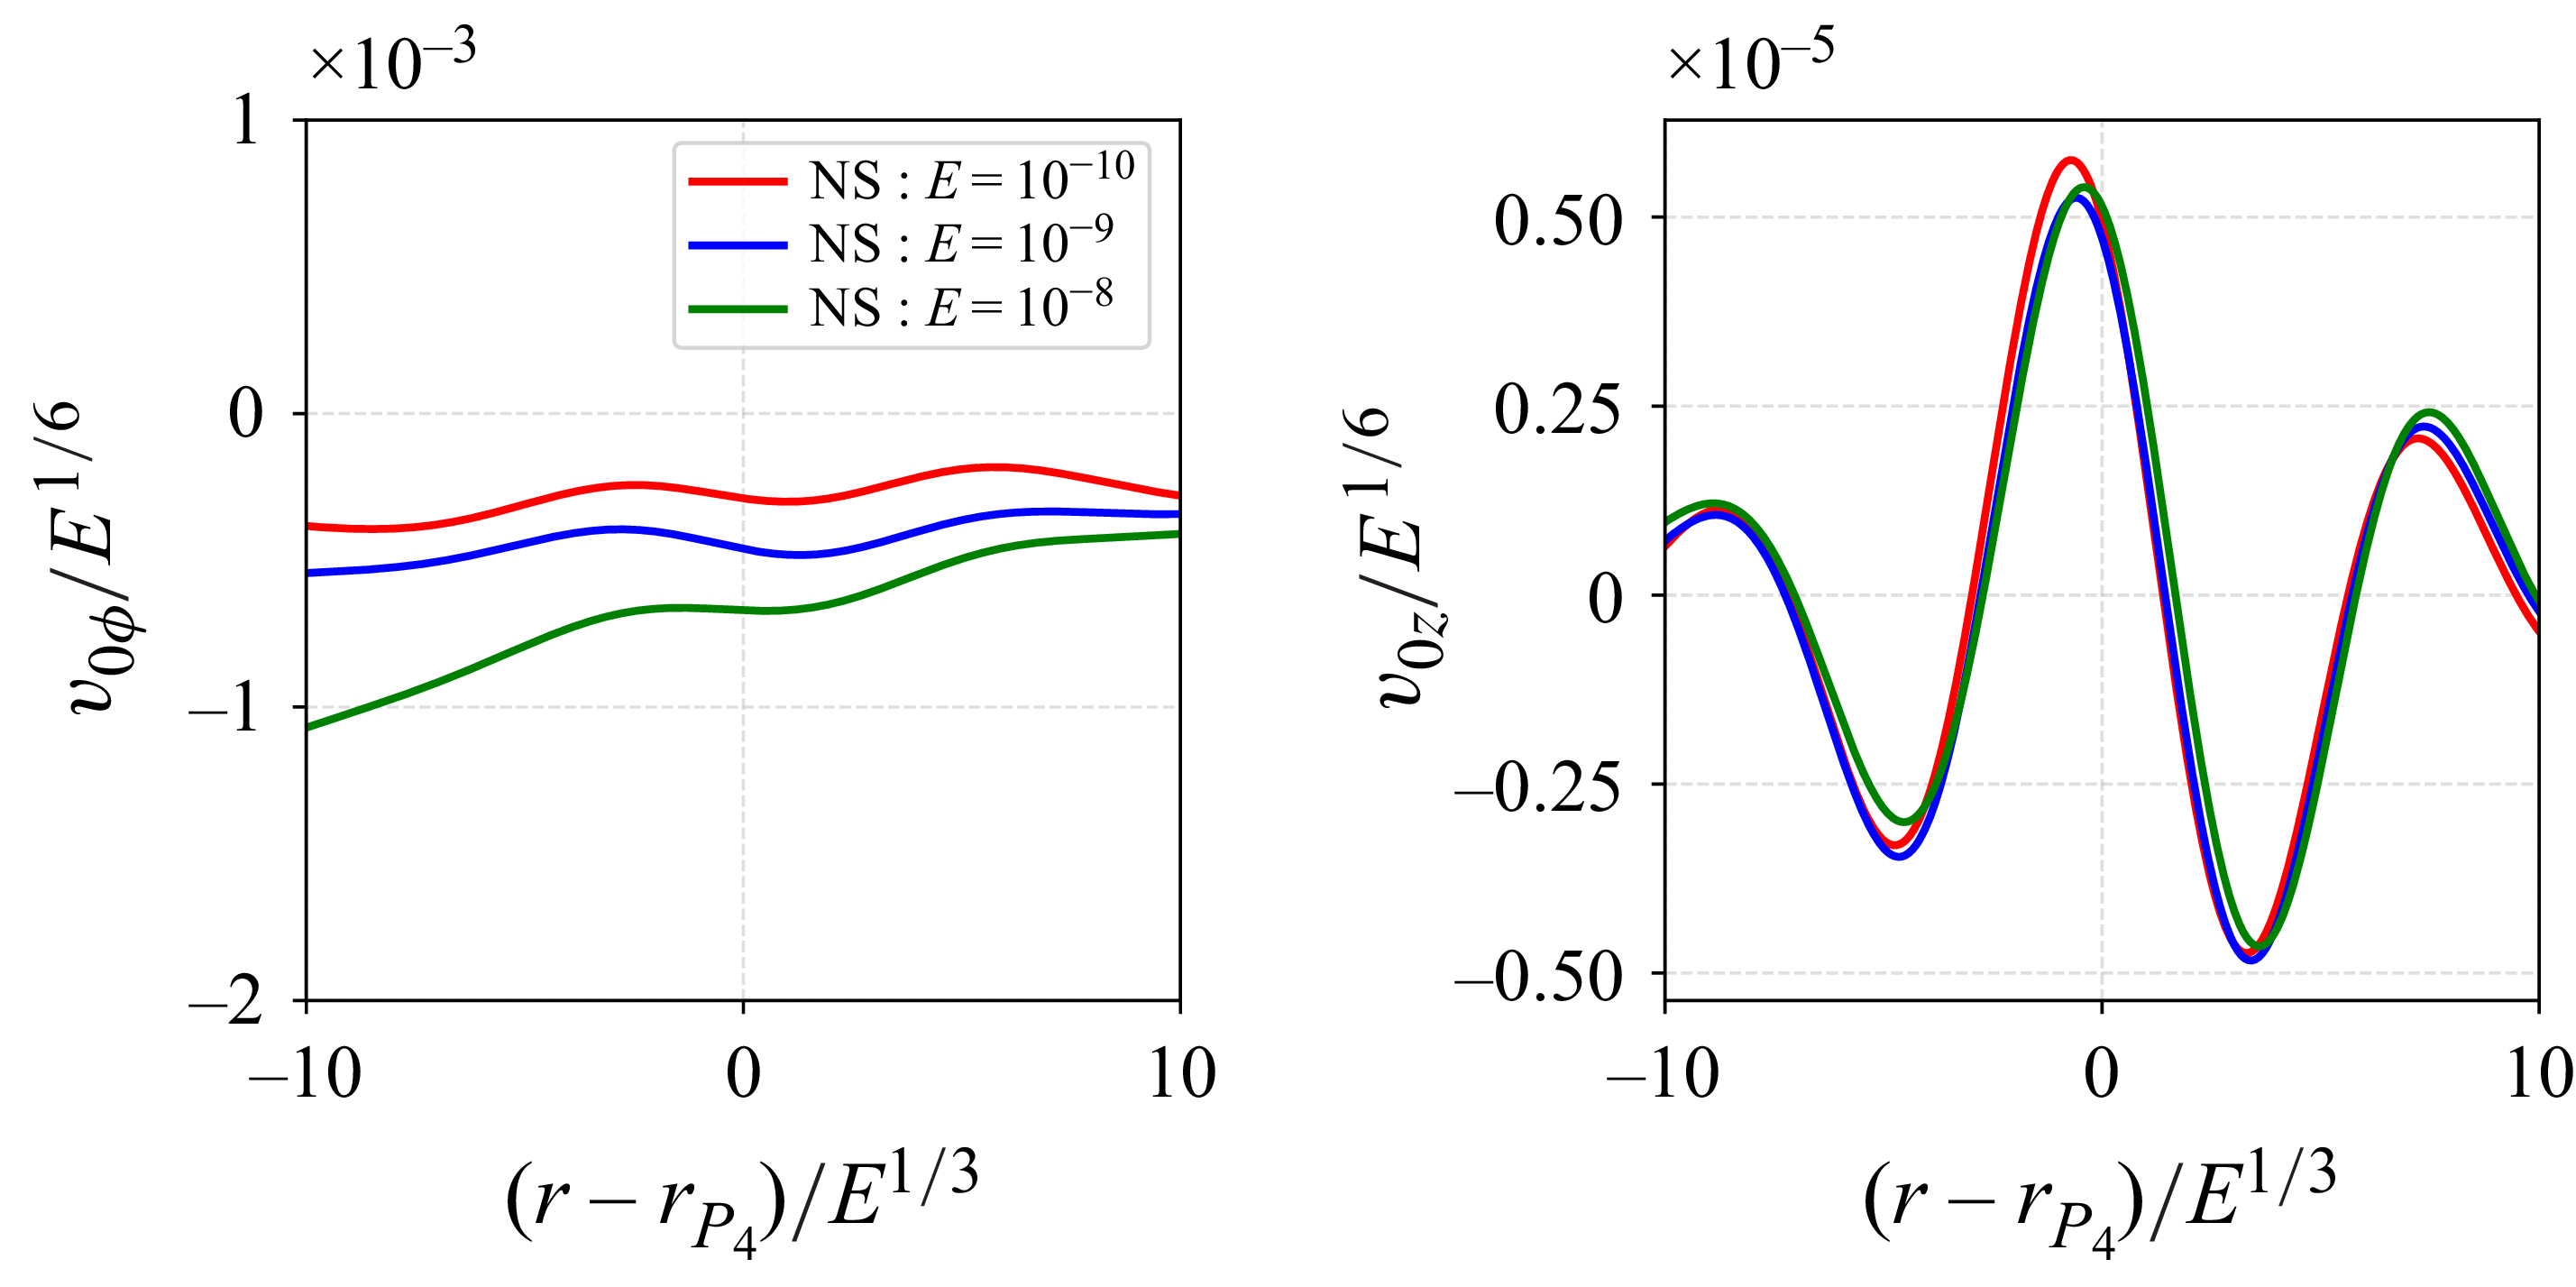
). The directory containing the data and the Jupyter notebook used to compute the asymptotic theory and generate this figure can be accessed at https://multimediafluids.uam.elogim.com/S0022112025109841/JFM-Notebooks/files/Figure9/Figure9.ipynb.

Comparisons between two similar interaction regions,
 $P_3$
and
 $P_4$
, and the numerical results are presented in figures 8 and 9, respectively. The observations from figure 7 regarding differences in the boundary layer and the azimuthal velocity in the bulk are also applicable here. Notably, near
 $P_4$
, located on the equatorial plane, the axial velocity
 $v_{0z}$
remains zero by symmetry. Additionally, improvements in the comparison with decreasing Ekman numbers are observed, consistent with the findings at other local positions.
At the three specific locations
 $P_7$
,
 $P_3$
and
 $P_4$
the asymptotic analysis yielded consistent scaling behaviours: the interaction region scales as
 $E^{1/3}$
and the amplitude scales as
 $E^{-1/6}$
for all three velocity components. Note however that the rescaled velocity remains small, of order
 $10^{-3}$
, at each of these points. This explains why these regions are not more visible on the contour map shown in figure 1.
4.2.2. Solution in the local regions
$P_5$
and
$P_6$


The secondary weak beams encounter the main critical beam in the bulk at
 $P_5$
. This case is interesting because the scalings of the two beams differ.
The mean flow correction is weaker and given by
 \begin{equation} \boldsymbol{v}_{0}\sim \frac {1}{r}E^{0}\boldsymbol{\breve {v}}_{0} , \end{equation}
with
 \begin{equation} \begin{pmatrix} \breve {v}_{0r} \\[10pt] \breve {v}_{0\phi } \\[10pt] \breve {v}_{0z} \end{pmatrix} =\begin{pmatrix} \displaystyle {-\frac {1}{\sqrt {2}} \frac { \partial \breve {\mathcal{N}}_{P_5} }{ \partial \tilde {z}_5 } } \\[8pt] \displaystyle { \frac { \partial \breve {\mathcal{M}}_{P_5} }{ \partial \tilde {r}_5 } } \\[8pt] \displaystyle {\frac {1}{\sqrt {2}} \frac { \partial \breve {\mathcal{N}}_{P_5} }{ \partial \tilde {r}_5 } } \end{pmatrix}, \end{equation}
where
 \begin{align} \breve {\mathcal{M}}_{P_5} & = 2\operatorname {Re} \left ( \left( \breve {B}^{N}- \breve {B}^{S}\right) \left( \tilde {B}_{5}^{N*} -\tilde {B}_{5}^{S*}\right) \right )\! , \end{align}
 \begin{align} \breve {\mathcal{N}}_{P_5} & = -2 \operatorname {Im}\left ( \left( \breve {B}^{N}- \breve {B}^{S}\right) \left( \tilde {B}_{5}^{N*} -\tilde {B}_{5}^{S*}\right) \right )\!. \\[12pt] \nonumber\end{align}
These expressions are similar to that obtained near point
 $P_4$
, where the
 $Nr$
and
 $Si$
beams at
 $P_4$
are now the strong
 $S$
and
 $N$
beams propagating between
 $P_3$
and
 $P_7$
, while
 $Ni$
and
 $Sr$
beams at
 $P_4$
are the weak
 $S$
and
 $N$
beams propagating between
 $P_2$
and
 $P_6$
(see figure 2
b). Note that because
 $\breve {B}^S$
and
 $\breve {B}^N$
are functions of the slow variable
 $\breve {x}_\perp = E^{1/6} (\tilde {z}_5-\tilde {r}_5)/\sqrt {2}$
, the spatial derivatives in (4.11) should be applied to
 $\tilde {B}_{5}^{S}$
and
 $\tilde {B}_{5}^{N}$
only.
Comparison of the AS and NS of velocity profiles at local region
 $P_{5}$
(cuts at
 $S_{P_5}$
). The directory containing the data and the Jupyter notebook used to compute the asymptotic theory and generate this figure can be accessed at https://multimediafluids.uam.elogim.com/S0022112025109841/JFM-Notebooks/files/Figure10/Figure10.ipynb.

In figure 10 we compare the AS from (4.11) with numerical results for three different Ekman numbers. The secondary weak beam, characterised by its larger width scaling in
 $E^{1/6}$
, is analysed by taking profile cuts parallel to the critical beam from
 $P_3$
to
 $P_7$
(see figure 4,
 $S_{P_5}$
). Due to the anti-symmetry of the weak beam, the cuts in the perpendicular direction (that is on the
 $z = r$
line) are zero.
The width of the local region scales as
 $E^{1/6}$
, while the other direction scales as
 $E^{1/3}$
. The amplitude scaling is
 $E^{0}$
, which is significantly weaker than in other local interaction regions. Despite the two beams having different scaling factors, the asymptotic method demonstrates overall accuracy. The asymptotic theory matches the NS well, exhibiting convergence as the Ekman number decreases.
However, some perturbations are observed on the right-hand side of figure 10, specifically in the
 $v_{0\phi }$
component. These perturbations arise because the cut profiles are influenced by the weak band issued from the point
 $P_6$
, as shown in figure 5(b).
In the local region
 $P_6$
, a particular solution of the same form as (4.11) can be obtained. However, as we will see in § 5 and Appendix C, this particular solution is modified by an additional homogeneous solution, which describes the mean flow correction associated with the vertical band originating from
 $P_6$
. Therefore, it cannot be directly compared to numerical results.
4.2.3. Solution in the local region
$P_1$

For the point on the rotation axis, we must use the expressions (3.23) for the harmonic solution. We obtain the following expression for the mean flow:
 \begin{equation} \boldsymbol{v}_0=E^{-1/2} \boldsymbol{\hat {v}}_{0} \end{equation}
with
 \begin{align} \hat {v}_{0r} & = -\frac {1}{\sqrt {2}}\frac {\partial }{\partial \tilde {z}_1} \left \{\operatorname {Re}\left [ \left(Q^{N}_{1}+ Q^{S}_{1}\right)\left(-Q^{N*}_{0}+Q^{S*}_{0}\right) \right ]\right \}, \end{align}
 \begin{align} \hat {v}_{0\phi } & = \frac {1}{2}\frac {\partial }{\partial \tilde {r}_1} \left \{\left |Q^{N}_{1}+Q^{S}_{1}\right |^2 - \left |-Q^{N}_0 + Q^S_0\right |^2 \right \} - \frac {\left |Q^{N}_{1}+Q^{S}_{1}\right |^2 }{\tilde {r}_1}, \end{align}
 \begin{align} \hat {v}_{0z} & = \frac {1}{\sqrt {2}}\left (\frac {\partial }{\partial \tilde {r}_1}+ \frac {1}{\tilde {r}_1} \right )\left \{\operatorname {Re}\left [ \left(Q^{N}_{1}+ Q^{S}_{1}\right)\left(-Q^{N*}_{0}+Q^{S*}_{0}\right) \right ]\right \} . \\[12pt] \nonumber \end{align}
In figure 11 we compare the AS from (4.15) with numerical results for three different Ekman numbers. The profiles analysed are taken at
 $S_{P_1}$
and include one profile in the direction perpendicular to the rotation axis and another along the rotation axis (see figure 4). Due to the axisymmetry of the system, only the axial velocity component is considered along the rotation axis, as the two other components,
 $v_{0r}$
and
 $v_{0\phi }$
, are identically zero.
The width of the local region scales with
 $E^{1/3}$
, while the amplitude scales with
 $E^{-1/2}$
. Although the overall agreement between the AS and the numerical results is strong, particularly for the azimuthal component, a noticeable deviation is observed in the smaller
 $v_{0r}$
component near the axis. This discrepancy was already observed in the linear harmonic solution in He et al. (Reference He, Favier, Rieutord and Le Dizès2022). We suspect that it could come from higher-order corrections that could become non-negligible owing to the smallness of the solution at this leading order.
Comparison of the AS and NS of velocity profiles at local region
 $P_1$
(cuts position at
 $S_{P_1}$
). The directory containing the data and the Jupyter notebook used to compute the asymptotic theory and generate this figure can be accessed at https://multimediafluids.uam.elogim.com/S0022112025109841/JFM-Notebooks/files/Figure11/Figure11.ipynb.

5. Numerical scalings of the bands
In the previous section we analysed the mean flow corrections generated in the interaction regions and in the bulk from the oscillating boundary layer on the inner core. These represent the dominant contributions. As illustrated in figure 1, numerical results also reveal the presence of faint vertical beam-like bands within the bulk. These bands originate from the local interaction regions. However, the leading-order mean flow corrections computed in these regions were shown to be localised. The observed bands must therefore be associated with higher-order effects. Finding an approximation for the velocity field in the bands is thus also more complex, as it requires higher-order expansions of the harmonic solution. Nevertheless, some general insight into the scaling and structure of the velocity field in each band can be obtained through asymptotic reasoning. These results are summarised in Appendix C and will be used to interpret the numerical results that are now presented.
Figure 12 displays the scaling of the vertical band aligned with the rotation axis, analysed along the cut
 $Sr_{1}$
shown in figure 4. Near
 $r=0$
, the width of the band scales as
 $E^{1/3}$
. As explained in the appendix, the amplitude of the axial and azimuthal velocity components in the band should be
 $E^{1/3}$
smaller than in the local region around
 $P_1$
. This leads to expected scalings of
 $E^{-1/6}$
for
 $v_{0\phi }$
and
 $v_{0z}$
, and
 $O(E^{1/6})$
for
 $v_{0r}$
. These scaling are confirmed by the numerical results shown in figure 12. The variation of the mean flow correction within this band along the axial coordinate is also complex, as illustrated in figure 13(a).
Velocity scalings from the NS in the band originating from
 $P_1$
. Variation along the cut
 $Sr_{1}$
(indicated in figure 4) for three different Ekman numbers
 $E=10^{-8}$
,
 $E=10^{-9}$
and
 $E^{-10}$
. (a) Azimuthal velocity. (b) Radial velocity. (c) Axial velocity. The scalings are those predicted by the theory (Appendix C).

Vertical dependency of the bands originating from
 $P_1$
and
 $P_2$
(NS). (a) Band from
 $P_1$
. Axial velocity along the axis (cut
 $Sz_1$
), demonstrating a nonlinear dependency with respect to the vertical coordinate
 $z$
. (b,c) Band from
 $P_2$
. Axial velocity versus
 $z$
along the cut
 $Sz_2$
, showing a uniform behaviour at the order
 $E^{1/5}$
(b) and a linear variation at the order
 $E^{3/10}$
. The localised variation of the velocity close to
 $z\approx 0.75$
in (b) and (c) corresponds to the crossing with the main beam travelling between
 $P_1$
and
 $P_4$
.

Velocity scalings from the NS in the local region
 $P_2$
(cut
 $S_{P_2}$
in panel b) and in the band originating from
 $P_2$
(cut
 $Sr_{2}$
in panel a).

Figure 14 illustrates the scaling behaviours in two distinct regions: the critical latitude region (analysed at cut
 $S_{P_2}$
) and the resulting zonal band in the bulk (analysed at cut
 $Sr_{2}$
). The horizontal width of the critical latitude region scales as
 $E^{2/5}$
, while the width of the associated band is
 $O(E^{1/5})$
. As explained in Appendix C, the scaling of the azimuthal velocity in the band depends on the Ekman pumping generated in the local region
 $P_2$
, which is challenging to evaluate analytically. However, the scalings of the different components are interrelated. In figure 14(a) we propose a scaling in
 $E^{-1/10}$
for
 $v_{0\phi }$
,
 $E^{1/2}$
for
 $v_{0r}$
and
 $E^{1/5}$
for
 $v_{0z}$
that is consistent with the expected structure of the mean flow correction in the band issued from
 $P_2$
. Figure 14(b) presents scaling behaviour in the local region
 $P_2$
that may be compatible with the observed scalings in the band. In particular, a scaling of
 $v_{0r}$
and
 $v_{0z}$
in
 $E^{-1/5}$
is expected to yield an Ekman pumping of order
 $E^{1/5}$
, which matches the amplitude of the axial velocity observed in the band. In figure 13(b,c) we observe that the axial velocity within the band from
 $P_2$
is uniform along the axial direction at leading order
 $E^{1/5}$
but linear at the next order
 $E^{3/10}$
, as predicted by the theory.
Figures 15 and 16 present the velocity profiles along cuts
 $Sr_{3}$
and
 $Sr_{7}$
, respectively. We have applied the scalings predicted by the asymptotic analysis, namely, an amplitude of order
 $E^0$
for the azimuthal and axial velocity components, and
 $E^{1/3}$
for the radial velocity (see Appendix C). These scalings are consistent with the numerical results. However, for the azimuthal velocity in the band issued from
 $P_7$
, an alternative scaling appears to better match the numerical data (see figure 17). At present, we have no theoretical justification for this alternative scaling.
Same caption as figure 12 but for the band originating from
 $P_3$
(cut
 $Sr_{3}$
).

Same caption as figure 12 but for the band originating from
 $P_7$
(cut
 $Sr_{7}$
).

Alternative NS scaling for the azimuthal velocity in the band originating from
 $P_7$
(cut
 $Sr_{7}$
).

As discussed in Appendix C, no significant band is expected to form from
 $P_4$
, which was already evident in figure 1(e). In figure 18 we confirm that the numerical results align with the theoretically predicted scaling of
 $E^{1/6}$
for both the azimuthal and axial velocity components.
Same caption as figure 12 but for the band originating from
 $P_4$
(cut
 $Sr_{4}$
). The very weak radial velocity that scales as
 $E^{1/2}$
has not been plotted.

A faint band originating from the critical point on the outer core is visible in figure 1(a). This band is not associated with the local region
 $P_5$
, which is not expected to generate any visible band, but rather with
 $P_6$
. As explained in Appendix C, the structure of the velocity field in this band is peculiar. Its width scales as
 $E^{1/6}$
, matching with the width of the local region
 $P_6$
. However, unlike the bands originating from
 $P_3$
and
 $P_7$
, the axial velocity here is significantly weaker than the azimuthal velocity and varies linearly in
 $z$
. The scaling used in figure 19(a,b) –
 $E^0$
for
 $v_{0\phi }$
and
 $E^{1/2}$
for
 $v_{0z}$
– are those predicted by the theoretical analysis. The radial velocity, which is expected to be
 $O(E^{2/3})$
, is too weak to be correctly resolved and has not been plotted. In figure 19(c) we demonstrate that the azimuthal velocity is uniform along the vertical direction, as expected from the theory.
Velocity scalings from NS in the band originating from
 $P_6$
. (a) Azimuthal velocity versus
 $r$
along the cut
 $Sr_{6}$
. (b) Axial velocity versus
 $r$
along the cut
 $Sr_{6}$
. (c) Azimuthal velocity versus
 $r$
for different
 $z$
, along the cut
 $Sr_{6}$
,
 $Sr_{6}^{+}$
and
 $Sr_{6}^{-}$
at
 $z=0.4$
,
 $z=0.5$
and
 $z=0.1$
, respectively.

6. Conclusion
In this study we have used both numerical and asymptotic approaches to analyse the mean flow corrections generated by the nonlinear self-interaction of a harmonic solution in a rotating, librating spherical shell. We have focused on the case where the inner core librates at a frequency
 $\widehat {\omega } = \sqrt {2}\widehat {\varOmega }$
, for which the harmonic solution exhibits a simple structure, primarily composed of critical point beams propagating along a closed rectangular periodic path. Using the asymptotic structure of the harmonic solution obtained in He et al. (Reference He, Favier, Rieutord and Le Dizès2022), we have obtained expressions for the dominant mean flow corrections in the limit of small Ekman numbers. These theoretical predictions have been compared with numerical results obtained for Ekman numbers ranging from
 $10^{-8}$
to
 $10^{-10}$
, providing strong validation for both the numerical and asymptotic methods. In addition, scaling laws for weaker mean flow bands have been derived and compared against numerical data. This analysis has allowed us to obtain a comprehensive picture of the mean flow correction structure, summarised for the three velocity components in figures 20, 21 and 22.
Ekman scaling of the mean flow correction azimuthal velocity
 $v_{0\phi }$
. The blue and red colours denote the amplitude and length scale scalings, respectively. The scalings indicated in bold have been validated by an AS.

Same caption as in figure 20 but shown for the velocity component
 $v_{0z}$
.

Same caption as in figure 20 but shown for the velocity component
 $v_{0r}$
.

The main findings are as follows. We have shown that the largest mean flow corrections are localised in the regions where two beams propagating in different directions intersect. In these localised overlap regions, the three velocity components share the same scaling. The largest correction, of order
 $E^{-1/2}$
, occurs in the local region
 $P_1$
where the critical beam reaches the rotation axis. Significant corrections of order
 $E^{-1/6}$
have also been found in regions
 $P_3$
and
 $P_7$
, where the critical beam reflects on the outer boundary, and in region
 $P_4$
, where it intersects its symmetric counterpart on the equator. Weaker contributions, scaling as
 $E^{0}$
have been observed in regions
 $P_5$
and
 $P_6$
where the main critical beam interacts with the wider and weaker secondary beam propagating between the critical points on the inner and outer core.
We have further demonstrated that these strong localised interactions could serve as sources of weaker mean flow bands aligned with the rotation axis. From regions
 $P_3$
and
 $P_7$
on the outer boundary, we have shown that mean flow bands are generated, characterised by axial and azimuthal velocities of order
 $E^{0}$
and a radial velocity of order
 $E^{1/3}$
, thus confirming the viscous generation mechanism proposed by Le Dizès (Reference Le Dizès2020). When the local interaction occurs away from the boundary, as in regions
 $P_1$
and
 $P_4$
, the resulting mean flow bands are relatively weaker. In all of these bands, each of width
 $E^{1/3}$
, the velocity and pressure fields have a complex axial structure and, therefore, do not form Taylor–Proudman columns. In contrast, broader mean flow bands are generated from the critical point region
 $P_2$
and
 $P_6$
located on the inner and outer cores. These bands behave as Taylor–Proudman columns, characterised by a dominant azimuthal velocity component that is independent of the axial coordinate, accompanied by much weaker axial and radial velocity components.
In this study we focused on the mean flow correction. However, double-harmonic corrections, scaling as the square of the harmonic solution, are also expected. For the frequency considered,
 $2\omega$
lies outside the frequency range of inertial waves. As a result, double-harmonic corrections are not expected to propagate. Nevertheless, as explained in Le Dizès (Reference Le Dizès2020), such corrections are still generated within the interaction regions. We expect them to exhibit the same scaling as the mean flow corrections in the local regions
 $P_\beta$
, but without the emission of beams from these regions.
In the present study we have considered a viscous libration forcing of the inner core, which gives rise to an harmonic response of order
 $E^{1/12}$
. For a larger harmonic response, such as that obtained with inviscid forcing, larger mean flow corrections are expected. He, Favier & Le Dizès (Reference He, Favier and Le Dizès2025) considered the same geometry but with a different forcing, corresponding to an inner core vertical oscillation. When the same frequency is used, they showed that a similar harmonic solution is obtained, concentrated along the same rectangular critical ray pattern, but characterised by a different similarity index,
 $m=1/2$
, and a larger amplitude scaling as
 $E^{-1/6}$
. A similar analysis can be applied to this solution, which has an amplitude
 $E^{-1/4}$
larger than the present harmonic solution. We expect analogous results for the mean flow corrections generated by the interaction of the critical beam with itself, specifically within the local interaction regions
 $P_\beta$
, as well as in the bands originating from these points. However, since the mean flow corrections scale with the square of the harmonic solution amplitude, all such corrections would be amplified by a factor of
 $E^{-1/2}$
in that case. In particular, this leads to amplitude scalings of
 $E^{-3/2}$
in
 $P_1$
,
 $E^{-2/3}$
in
 $P_3$
,
 $P_4$
and
 $P_7$
, and
 $E^{-1/2}$
in the bands originating from
 $P_3$
,
 $P_6$
and
 $P_7$
.
Our results give some theoretical grounds to previously observed results in the literature. For example, the fact that differential rotation is preferentially driven at locations where wave beams reflect on the boundaries has been observed in the tidally driven zonal flows of Favier et al. (Reference Favier, Barker, Baruteau and Ogilvie2014), albeit at a much higher Ekman number that those discussed here and for different forcing frequencies. Additionally, tentative scaling for the volume-averaged energy of the differential rotation were reported in Tilgner (Reference Tilgner2007) and Favier et al. (Reference Favier, Barker, Baruteau and Ogilvie2014), with exponents ranging from
 $E^{-1/2}$
to
 $E^{-3/2}$
(see also the scaling of
 $E^{-3/10}$
for the azimuthal velocity observed experimentally by Morize et al. (Reference Morize, Le Bars, Le Gal and Tilgner2010) but for a full sphere, less relevant to our particular spherical shell). Since these authors considered tidally driven flows, their scaling are to be compared with our prediction for an inviscid forcing. From our local analysis, we expect scaling for the volume-averaged energy of the differential rotation of
 $E^{-2}$
for the local region around
 $P_1$
and
 $E^{-2/3}$
for the local regions around
 $P_3$
,
 $P_4$
and
 $P_7$
. The volume-averaged energy associated with the bands emanating from
 $P_3$
,
 $P_6$
and
 $P_7$
are predicted to scale as
 $E^{-2/3}$
. Our predictions are compatible with existing scaling, in particular with the fact that we expect intense zonal flows in the limit of the vanishing Ekman number. Note however that our approach remains valid only in the weakly nonlinear limit but clearly disentangles the different zonal flow contributions, which was not the case of the volume-averaged approach used in Tilgner (Reference Tilgner2007) and Favier et al. (Reference Favier, Barker, Baruteau and Ogilvie2014). Note finally that the strongest response on the rotation axis around
 $P_1$
might be connected to the focusing effect discussed by Shmakova et al. (Reference Shmakova, Voisin, Sommeria and Flór2021) and Liu et al. (Reference Liu, Oberlack, Wang, Delache and Godeferd2022) in the case of an oscillating torus. The fact that both the harmonic solution and the mean flow corrections reach their largest amplitudes near
 $P_1$
allows us to consider the future development of a strongly nonlinear theory, in which the nonlinear effects are concentrated in the vicinity of that point. At a qualitative level, our predicted localised corrections and axial bands agree with the experimental steady zonal flow patterns of Subbotin et al. (Reference Subbotin, Shmakova, Ermanyuk and Kozlov2022, Reference Subbotin, Shmakova, Kozlov and Ermanyuk2023), but we refrain from making a quantitative comparison because the forcings and accessible Ekman numbers in those experiments differ significantly from the asymptotic regime considered in our study.
These scalings, for both an inviscid and a viscous forcing, define the limits of validity for the weakly nonlinear approach employed in this study. The requirement that the mean flow corrections remain small implies that the forcing amplitude
 $\epsilon$
must be much smaller than
 $E^{1/4}$
in the viscous case, and much smaller than
 $E^{3/4}$
in the inviscid case. An even more stringent condition arises from requiring that the mean flow correction remains smaller than the harmonic solution. This leads to the constraint
 $\epsilon \ll E^{5/12}$
for the viscous case and
 $\epsilon \ll E^{7/6}$
for the inviscid case. This condition also ensures that the gradient of the mean flow correction remains small, thereby guaranteeing that the propagation of the harmonic beam is not perturbed by the mean flow correction at leading order.
The weakly nonlinear solution may also lose its physical relevance if it becomes unstable. The harmonic solutions exhibit strong shear regions that are potentially unstable. A crude estimate of the instability threshold associated with this shear is obtained by balancing the vorticity within each layer against the viscous damping of a perturbation with a characteristic wavelength comparable to the layer width. For the libration forcing, this yields the condition
 $\varepsilon \gt O(E^{1/2})$
for instabilities in the Stokes–Ekman layer on the inner sphere, and
 $\varepsilon \gt O(E^{7/12})$
for instabilities in both the main internal shear layer of width
 $E^{1/3}$
and the secondary internal shear layer of width
 $E^{1/6}$
. These constraints are more restrictive than the condition of validity of the weakly nonlinear analysis. It would be valuable to obtain more precise estimates for the instability thresholds through a dedicated stability analysis of the harmonic solution or by means of direct numerical simulations.
(a) Contours of amplitudes of harmonic linear azimuthal velocity
 $|v_{1\phi }|$
. The blue lines are a critical line from the source point
 $S_{c}$
. (b) Mean flow azimuthal velocity
 $|v_{0\phi }|$
at
 $E=10^{-9}$
and the libration frequency of the inner core is
 $\omega =0.8317$
.

It is worth emphasising that the results presented here are for a harmonic solution with a relatively simple structure, in which the number of beam crossings is limited. For other forcing frequencies, the harmonic response can be significantly more complex, involving multiple reflections of the critical point beams and the possible formation of wave attractors (He et al. Reference He, Favier, Rieutord and Le Dizès2023). An illustration of such a harmonic response is shown in figure 23(a) for a libration frequency
 $\widehat {\omega } = 0.8317 \widehat {\varOmega }$
. In figure 23(b) we present the azimuthal velocity contours of the mean flow correction obtained numerically from this harmonic response. Despite the added complexity, many features of the mean flow corrections remain similar. The dominant contribution arising from the boundary layer oscillation of the inner core is still present. Localised contributions at beam intersection points in the bulk are also clearly visible, as are bands originating from locations where beams reflect on the boundaries. For both the localised contributions and the emitted bands, a similar asymptotic analysis is expected to hold. In fact, the structure of the solution may be simpler in this case, as the main beam is now a single critical point beam (with the same similarity index
 $m=5/4$
and amplitude scaling as
 $E^{1/12}$
), propagating in only one direction – unlike in our previous case, which involved an infinite sum of beams propagating in both directions. As long as the analysis is restricted to regions away from the attractor, we therefore expect similar localised contributions of order
 $E^{-1/6}$
at beam intersections, and bands of width
 $O(E^{1/3})$
, with velocity scaling as
 $E^0$
, originating from reflection points on the outer boundary.
Supplementary materials
Computational Notebook files are available as supplementary material at https://doi.org/10.1017/jfm.2025.10984 and online at https://multimediafluids.uam.elogim.com/S0022112025109841/JFM-Notebooks. The directory stores the data, scaling parameters and Jupyter notebook used for the validation of Ekman scaling at various cut positions (shown in figure 4) from numerical computations at https://multimediafluids.uam.elogim.com/S0022112025109841/JFM-Notebooks/files/Figure_num_scaling/mean-num-scaling.ipynb. This validation corresponds to figure 6 and figures in § 5.
Acknowledgements
The Centre de Calcul Intensif d’Aix-Marseille is acknowledged for granting access to its high-performance computing resources. The authors thank Professor Yufeng Lin for providing the numerical simulation data for comparison.
Funding
This work was granted access to the HPC resources of IDRIS under the allocations A0140407543 and A0180407543 made by GENCI.
Declaration of interests
The authors report no conflict of interest.
Author contributions
X. C. performed the numerical simulations, conducted the asymptotic analysis and the comparison between theory and numerics, created all the figures, and wrote the original draft. J. H. developed the numerical code. B. F. designed the study, supervised the numerical aspects, and reviewed/edited the manuscript. S. L. D. designed the study, supervised the theoretical aspects, and reviewed/edited the manuscript.
Appendix A. Numerical convergence details
The pseudo-spectral method workflow is shown in figure 24. Based on the linear velocity in spectral space
 $\check {v}_1$
of the harmonic solution, we calculate the steady Reynolds stress through the pseudo-spectral method and then obtain the mean flow. For the angular components, we employ the SHTns package to efficiently transform spherical harmonic coefficients to physical space (Schaeffer Reference Schaeffer2013).
Schematic of the pseudo-spectral method workflow.

We tested two dealiasing approaches: traditional
 $2/3$
truncation for the spherical harmonic coefficients and the SHTns package’s anti-aliasing capability for angular dimensions (Schaeffer Reference Schaeffer2013). No dealiasing was needed in the radial direction as we used Chebyshev differentiation matrices in physical space. Since both methods yielded identical results to simulations without dealiasing at our resolution, we present all results without applying dealiasing operations.
The convergence of the spectral codes with various resolutions is tested by the spectra of the Chebyshev coefficients and the spherical harmonic components, as in Rieutord & Valdettaro (Reference Rieutord and Valdettaro1997). Figure 25 shows the spectra at the smallest Ekman number
 $E=10^{-10}$
. We have verified that for all Ekman numbers, the resolutions shown in table 1 ensure that the ratio
 $Es_{\textit{min}}/Es_{\textit{max}}$
is less than
 $10^{-8}$
, where
 $Es_{\textit{min}}$
and
 $Es_{\textit{max}}$
are the minimum and maximum values of the energy spectrum, respectively. This ensures that all of the length scales are properly resolved down to small dissipative structures, as is attested by the exponential cutoff observed at high wavenumbers in figure 25.
Resolutions of different Ekman numbers.

Spectra comparison of
 $(a)$
linear Chebyshev coefficients,
 $(b)$
linear spherical harmonic components,
 $(c)$
nonlinear Chebyshev coefficients and
 $(d)$
nonlinear spherical harmonic components at
 $E=10^{-10}$
with three different resolutions
 $Res1 = (2500,8000)$
,
 $Res2=(2500,7000)$
and
 $Res3=(2000,8000)$
, as red, green and blue lines, respectively. The toroidal component (
 $w$
solid line) and the radial component (
 $\rho u$
dashed line) have been separated. For each
 $l$
and
 $n$
, the maximum value over the other spectral component is chosen.

Appendix B. Parameters for the harmonic solution
The parameters defining the harmonic solution along the main rectangular circuit are given in tables 2 and 3 for the northward and southward beam, respectively.
They use the quantities
 \begin{equation} L=l_1+l_2+l_3K^{-3}+l_4+l_5, \end{equation}
with
 \begin{equation} l_{1}=\eta ,\qquad l_{2}=\sqrt { 1-\eta ^{2} }-\eta ,\qquad l_{2}=2\eta ,\qquad l_{4}=l_{2},\qquad l_{5}=l_{1}, \end{equation}
and
 \begin{align} K=\frac {\sin (\alpha +\pi /4)}{\sin (\alpha -\pi /4)} . \end{align}
Northward path coordinates, amplitudes and propagation distances within one cycle.

Southward path coordinates, amplitudes and propagation distances within one cycle.

Appendix C. Mean flow bands
In this section we analyse the structure of the mean flow bands that are created within the bulk from the local interaction regions
 $P_\beta$
. These bands have the particularity to be present in fluid regions where the Reynolds stress is very small. The corresponding velocity field is therefore expected to satisfy homogeneous equations.
C.1. Bands issued from
$P_3$
,
$P_4$
and
$P_7$


We first consider bands generated from the local regions
 $P_3$
,
 $P_4$
and
 $P_7$
. These regions have a width of order
 $E^{1/3}$
and we can expect the bands to have the same width. It is thus natural to introduce the local radial variable
 $\tilde {r}=E^{-1/3}(r-r_{P_\beta })$
and to use the following ansatz for the velocity field:
 \begin{equation} \boldsymbol{v}_0 = (E^{1/3} v_{0r}, v_{0\phi }, v_{0z}, E^{1/3} p_0) (\tilde {r},z) . \end{equation}
The velocity field then satisfies the following set of equations:
 \begin{align} -2 v_{0\phi } + \frac {\partial p_0}{\partial \tilde {r}} &=0 , \end{align}
 \begin{align} 2 v_{0r} - \frac {\partial ^2 v_{0\phi }}{\partial \tilde {r}^2} &=0 , \end{align}
 \begin{align} \frac {\partial p_0}{\partial z} - \frac {\partial ^2 v_{0z}}{\partial \tilde {r}^2} &=0 , \end{align}
 \begin{align} \frac {\partial v_{0r}}{\partial \tilde {r}} + \frac {\partial v_{0z}}{\partial z} &=0 . \end{align}
For
 $P_3$
and
 $P_7$
, the solution should be valid from
 $-z_{P_\beta }$
to
 $z_{P_\beta }$
with a condition of anti-symmetry on the axial velocity component with respect to the equatorial plane. This implies that the general solution for the bands issued from
 $P_3$
and
 $P_7$
takes the form
 \begin{align} v_{0r} &= -\frac {\mathrm{i}}{4} \int _{-\infty }^{+\infty } A(k) k^3\cosh (k^3z/2)\textrm{e}^{\mathrm{i}k\tilde {r}} {\rm d}k , \end{align}
 \begin{align} v_{0\phi } &= -\frac {\mathrm{i}}{2} \int _{-\infty }^{+\infty } A(k) k \cosh (k^3z/2)\textrm{e}^{\mathrm{i}k\tilde {r}} {\rm d}k, \end{align}
 \begin{align} v_{0z} &=-\frac {1}{2} \int _{-\infty }^{+\infty } A(k) k \sinh (k^3z/2)\textrm{e}^{\mathrm{i}k\tilde {r}} {\rm d}k, \end{align}
 \begin{align} p_{0} &= \int _{-\infty }^{+\infty } A(k) \cosh (k^3z/2)\textrm{e}^{\mathrm{i}k\tilde {r}} {\rm d}k, \end{align}
where
 $A(k)$
is a function determined by the boundary condition at
 $z=z_{P_\beta }$
. In particular,
 $A(k)$
is set by the Ekman pumping generated at the boundary close to
 $P_\beta$
. We have seen that, at the order
 $E^{-1/6}$
, the Ekman pumping vanishes. This explains why the order of the band is smaller than
 $E^{-1/6}$
. As shown in Le Dizès (Reference Le Dizès2020), the Ekman pumping first appears at the order
 $E^{0}$
. If we denote by
 $w_{\infty } (\tilde {r}) = \tilde {v}_{0z}(\tilde {r},\tilde {z}=-\infty )$
the Ekman puming at this order, the function
 $A(k)$
is just obtained by the condition
 $v_{0z}(\tilde {r},z_{P_\beta }) = w_{\infty } (\tilde {r})$
, which leads to
 \begin{equation} A(k) = -\frac {2\hat {w}_\infty }{k\sinh (k^3z_{P_\beta }/2)} , \end{equation}
where
 $\hat {w}_\infty$
is the Fourier transform of
 $w_\infty$
.
For the band issued from the point
 $P_4$
on the equatorial plane, the solution must satisfy non-penetration conditions at the ends of the band, corresponding to
 $z=\pm z_{4}=\pm \sqrt {1-2\eta ^2}$
. This leads to the following form for
 $z\gt 0$
:
 \begin{align} v_{0r} &= -\frac {\mathrm{i}}{4} \int _{-\infty }^{+\infty } A(k) k^3\cosh (k^3(z-z_{4})/2)\textrm{e}^{\mathrm{i}k\tilde {r}} {\rm d}k , \end{align}
 \begin{align} v_{0\phi } &= -\frac {\mathrm{i}}{2} \int _{-\infty }^{+\infty } A(k) k \cosh (k^3(z-z_{4})/2)\textrm{e}^{\mathrm{i}k\tilde {r}} {\rm d}k, \end{align}
 \begin{align} v_{0z} &=-\frac {1}{2} \int _{-\infty }^{+\infty } A(k) k \sinh (k^3(z-z_{4})/2)\textrm{e}^{\mathrm{i}k\tilde {r}} {\rm d}k, \end{align}
 \begin{align} p_{0} &= \int _{-\infty }^{+\infty } A(k) \cosh (k^3(z-z_{4})/2)\textrm{e}^{\mathrm{i}k\tilde {r}} {\rm d}k. \end{align}
The amplitude
 $A(k)$
is now prescribed by the axial flux generated from the Reynolds stress close to
 $z=0$
around
 $P_4$
. We have seen that it is zero at the order
 $E^{-1/6}$
. We further claim that it also vanishes at the orders
 $E^{-1/12}$
and
 $E^{0}$
, due to the similar form of the Reynolds stress at these orders. Indeed, as shown in § 3.5, up to
 $O(E^{1/3})$
, the viscous corrections to the leading-order harmonic solution has a similar structure to the main beam. They also satisfy the two key properties – (3.10) and (3.11) – that were used to derive the mean flow correction expression (4.4), which notably exhibits no axial flux.
The first correction that generates a non-zero axial flux from
 $P_4$
is therefore expected to appear at a magnitude
 $E^{1/3}$
smaller than the dominant term – that is, at the order
 $E^{1/6}$
. If this flux is denoted as
 $E^{1/6} w_\infty (\tilde {r})$
, the function
 $A(k)$
is obtained by enforcing the condition
 $v_{0z}(\tilde {r},z=0) = E^{1/6}w_\infty (\tilde {r})$
, leading to
 \begin{equation} A(k) = E^{1/6}\frac {2\hat {w}_\infty }{k\sinh (k^3z_{Q_4}/2)} \,. \end{equation}
We therefore expect the band generated from
 $P_4$
to be of order
 $E^{1/6}$
smaller than those originating from
 $P_3$
and
 $P_7$
.
It is worth emphasising that the velocity field in the bands issued from the three points
 $P_3$
,
 $P_4$
and
 $P_7$
depends on the axial coordinate
 $z$
. These bands are therefore not Taylor–Proudman columns, in which axial and azimuthal velocity components are invariant along the rotation axis. Here, due the smallness of the radial scale, the viscous effects responsible for axial variations become observable over the
 $O(1)$
axial extent of the column.
C.2. Band issued from
$P_1$

For the band originating from the point
 $P_1$
, the analysis differs slightly due to the presence of the cylindrical singularity. We still introduce the local variable
 $\tilde {r}=E^{-1/3}r$
and adopt the same ansatz (C1) for the mean flow corrections. The governing equations become:
 \begin{align} -2 v_{0\phi } + \frac {\partial p_0}{\partial \tilde {r}} =0 , \end{align}
 \begin{align} 2 v_{0r} - \left (\frac {\partial ^2}{\partial \tilde {r}^2} + \frac {1}{\tilde {r}}\frac {\partial }{\partial \tilde {r}} -\frac {1}{\tilde {r}^2}\right )v_{0\phi } =0 , \end{align}
 \begin{align} \frac {\partial p_0}{\partial z} - \left (\frac {\partial ^2}{\partial \tilde {r}^2} + \frac {1}{\tilde {r}}\frac {\partial }{\partial \tilde {r}}\right ) v_{0z} =0 , \end{align}
 \begin{align} \frac {\partial v_{0r}}{\partial \tilde {r}}+ \frac {v_{0r}}{\tilde {r}} + \frac {\partial v_{0z}}{\partial z} =0 . \end{align}
On either side of
 $P_1$
, we obtain solutions that satisfy the non-penetration condition at
 $z=z^+_1=1$
and at
 $z=z_1^-=\eta$
, respectively. These solutions take the following form:
 \begin{align} v_{0r}^\pm &= \frac {1}{4} \int _{-\infty }^{+\infty } A^{\pm }(k) k^3\cosh (k^3(z-z^{\pm }_1)/2)J_1(k\tilde {r}) {\rm d}k , \end{align}
 \begin{align} v_{0\phi }^\pm &= -\frac {1}{2} \int _{-\infty }^{+\infty } A^{\pm }(k) k \cosh (k^3(z-z^{\pm }_1)/2)J_1(k\tilde {r}){\rm d}k, \end{align}
 \begin{align} v_{0z}^\pm &=-\frac {1}{2} \int _{-\infty }^{+\infty } A^{\pm }(k) k \sinh (k^3(z-z^{\pm }_1)/2)J_0(k\tilde {r}) {\rm d}k, \end{align}
 \begin{align} p_{0}^\pm &= \int _{-\infty }^{+\infty } A^{\pm }(k) \cosh (k^3(z-z^{\pm }_1)/2)J_0(k\tilde {r}) {\rm d}k. \end{align}
Here the superscript `
 $+$
’ refers to the region
 $z_{P_1} \lt z \leqslant 1$
and the superscript `
 $-$
’ refers to
 $\eta \leqslant z \lt z_{P_1}$
. The two functions
 $A^{\pm }(k)$
are obtained by the conditions of matching with the local solution close to
 $P_1$
. As previously shown, at the order
 $E^{-1/2}$
, the local solution is confined to the vicinity of
 $P_1$
, and thus, does not generate any mean flow bands. For the same reasons as in the case of
 $P_4$
, the corrections at the orders
 $E^{-5/12}$
and
 $E^{-1/3}$
are also localised and do not induce any non-local band structure. The first non-localised contribution is expected to arise at the order
 $E^{-1/6}$
. The functions
 $A^{\pm }$
can be related to the jumps
 $E^{-1/6}\delta \hat {v}$
and
 $E^{-1/6}\delta \hat {w}$
of the azimuthal and axial velocity across the local region around
 $P_1$
by the following relations:
 \begin{align} v_{0\phi }^+ (\tilde {r}, z=z_{P_1}) - v_{0\phi }^- (\tilde {r}, z=z_{P_1}) =E^{-1/6} \delta \hat {v}(\tilde {r}) , \end{align}
 \begin{align} v_{0z}^+ (\tilde {r}, z=z_{P_1}) - v_{0z}^- (\tilde {r}, z=z_{P_1}) = E^{-1/6}\delta \hat {w}(\tilde {r}) . \end{align}
As with the bands originating from
 $P_3$
,
 $P_4$
and
 $P_7$
, the band emanating from
 $P_1$
also exhibits axial dependence.
C.3. Bands issued from
$P_2$
and
$P_6$


The bands issued from the local regions
 $P_2$
and
 $P_6$
differ from those previously discussed, as their radial width is larger than
 $E^{1/3}$
. As a consequence, the azimuthal velocity can no longer depend on the axial coordinate
 $z$
. These bands are then Taylor–Proudman columns.
For
 $P_6$
, the appropriate radial variable and velocity ansatz are
 $\breve {r} = (r-r_{P_6})/E^{1/6}$
and
 \begin{equation} \boldsymbol{v}_0 = (E^{2/3} v_{0r}, v_{0\phi }, E^{1/2} v_{0z}, E^{1/6} p_0) (\breve {r},z) . \end{equation}
This leads to the following governing equations:
 \begin{align} -2 v_{0\phi } + \frac {\partial p_0}{\partial \breve {r}} =0 , \end{align}
 \begin{align} 2 v_{0r} - \frac {\partial ^2 v_{0\phi } }{\partial \breve {r}^2} =0 , \end{align}
 \begin{align} \frac {\partial p_0}{\partial z} =0 , \end{align}
 \begin{align} \frac {\partial v_{0r}}{\partial \breve {r}} + \frac {\partial v_{0z}}{\partial z} =0 . \end{align}
The ansatz, (C10) and (C11a
) show that an azimuthal velocity of order 1 in the bulk can only be compatible with an axial velocity of order
 $E^{1/2}$
. In particular, (C11b,d
) imply that the axial velocity, which has to be antisymmetric with respect to the equatorial plane, must satisfy
 \begin{equation} v_{0z} = -z \frac {\partial v_{0r}}{\partial \breve {r}} = -\frac {z}{2} \frac {\partial ^3 v_{0\phi }}{\partial \breve {r}^3} \end{equation}
for a given azimuthal velocity profile
 $v_{0\phi }(\breve {r})$
. However, the
 $O(1)$
particular solution that we computed in § 4.2.2 is expected to induce Ekman pumping of order
 $E^{1/3}$
. Similarly, an
 $O(1)$
azimuthal velocity in the bulk also generates Ekman pumping of the same order. These two contributions must cancel each other to ensure compatibility with the axial flow in the bulk. This matching condition prescribes the function
 $v_{0\phi }(\breve {r})$
, from which the full velocity and pressure field in the band is entirely determined.
The case of
 $P_2$
is more complex, as both
 $E^{1/5}$
and
 $E^{1/6}$
radial scales are, a priori, possible. Assuming the
 $E^{1/5}$
scale dominates, we introduce
 $\bar {r} = (r-r_{P_2})/E^{1/5}$
and the ansatz
 \begin{align} \boldsymbol{v}_0 = (E^{3/5} v_{0r}, v_{0\phi }, E^{2/5} v_{0z}, E^{1/5} p_0) (\bar {r},z) . \end{align}
The resulting equations are analogous to those in (C11) with
 $\breve {r}$
replaced by
 $\bar {r}$
. As in the case of
 $P_6$
, the leading-order azimuthal velocity component must be independent of
 $z$
. However, the axial velocity may now either be linear in
 $z$
with the scaling prescribed by the ansatz (C13) or independent of
 $z$
and larger in magnitude. It is important to note that the bulk solution with an
 $O(1)$
azimuthal velocity is expected to generate
 $O(E^{3/10})$
Ekman pumping at both the inner and outer cores. These Ekman pumpings differ on each boundary and are larger than the possible linear axial flow in the bulk. Therefore, the azimuthal velocity in bulk must be chosen such that the Ekman pumping generated in
 $P_2$
, by the solution forced by the Reynolds stress, exactly cancels the Ekman pumping produced by the bulk solution at the outer boundary. This cancellation allows for a
 $z$
-independent axial flow in the bulk at leading order. Although evaluating the Ekman pumping precisely is challenging, the above reasoning enables us to deduce the relative orders of the velocity components. For instance, if the Ekman pumping in
 $P_2$
is
 $O(E^{1/5})$
then, in the bulk, we expect
 $v_{0\phi } = O(E^{-1/10})$
,
 $v_{0z}=O(E^{1/5})$
and
 $v_{0r}=O(E^{1/2})$
. A weak axial dependence of the axial velocity is also expected at the order
 $E^{3/10}$
and given by the analogue of (C12) for this band.
To conclude this section, we briefly comment on the band originating from
 $P_5$
. As in the case of
 $P_1$
, such a band is generated by the jumps of
 $v_{0\phi }$
and
 $v_{0z}$
across the local region
 $P_5$
. Due to the different scales of the two interacting beams, these jumps are expected to be of order
 $E^{2/3}$
. The jump of
 $v_{0z}$
must be compensated by an Ekman pumping of the same order at the outer boundary. This requires an azimuthal velocity in the band of order
 $E^{1/3}$
. This velocity amplitude is comparable to the background azimuthal velocity in the bulk, which explains why no distinct band originating from
 $P_5$
is visible in figures 1 and 5(b).