
I. INTRODUCTION
Nickel–aluminum bronze known as NAB alloy contains 9–12% (wt pct) aluminum with additions of less than 6% (wt pct) of Ni and Fe. Currently NAB has been extensively used where high strength, excellent wear, and corrosion resistance are required. Reference Rizi and Kokabi1–Reference Wharton, Barik, Kear, Wood, Stokes and Walsh4 However, it is difficult for NAB to be fabricated by traditional gravity casting (GC) process because of the narrow range of solidification, the complex nature caused by additions of high-melting elements (such as Fe and Ni) and the casting difficulties associated with the formation of alumina in the melt. Reference Alam, Marshall and Sasaki5 In addition, mechanical properties of traditional as-cast NAB alloy are always difficult to meet growing requirements. Many researchers have mainly studied the phase transformation, hot working, heat treatment, and corrosion behavior of NAB alloy. Suresh and Rammurty Reference Suresh and Ramamurty6 carried out an extensive investigation on the solidification structure as well as the effects of heat treatment and mold types on microstructure of NAB (Cu–9Al–4Ni–4Fe) alloy produced in a sand mold and a die mold, respectively. The results showed that the structure became considerably homogenous. Besides, the hardness and tensile strength were increased significantly after heat treatment. What’s more, J. Anantapong et al. Reference Anantapong, Uthaisangsuk, Suranuntchai and Manonukul7 investigated the effects of hot working on microstructure evolution of as-cast NAB alloy. And then they put forward that higher cooling rate significantly led to the increase of the β′ phase and finer Widmanstatten structure in the resulting microstructures, which improved hardness of NAB. According to these literature studies, many aspects have been focused on NAB except changing casting methods so as to minimize the difficulties of fabrication and improve microstructure distribution and mechanical properties.
Special casting process combined with appropriate heat treatment can perfect comprehensive performances of as-cast alloy in a large extent. Reference Kaplan and Yildiz8–Reference Yaşar and Altunpak11 Centrifugal casting (CC) is a kind of special casting process which has with many advantages. Alloys fabricated by CC can obtain higher tensile strength, hardness, and better wear resistance compared with GC alloys. Reference Chirita, Soares and Silva12–Reference Sun, Lorimer and Ridley16 Owing to dramatically centrifugal force, the blisters, dross, and oxidate slag that are lighter than the melt will be forced to the innermost surface, which can be eliminated by the following machining. Therefore, CC definitely plays an important role in the reduction of shrinkage porosity and the density of as-cast alloys can be significantly improved. G. Chirita et al. Reference Chirita, Soares and Silva12 revealed that centrifugal force affected phase distribution and morphologies and improved mechanical properties of the whole casting, especially the outer layer where the centrifugal force was the highest. Nowadays, CC has been widely used to fabricate alloys (zinc alloys and aluminum alloys).
In the present work, microstructure and mechanical properties of a kind of NAB (Cu–10Al–4Fe–4Ni) fabricated by CC were investigated. For comparison, this kind of NAB manufactured by GC was also under consideration. What’s more, different heat treatments of CC alloy were carried out and the optimal heat treatment process was confirmed.
II. EXPERIMENTAL
A. Materials
NAB with a nominal composition of Cu–10Al–4Fe–4Ni was studied, which was fabricated by CC process at a rotational speed of 600 rpm and GC process, respectively. The ingot was 100 mm high with the inner diameter of 200 mm and the outer diameter of 300 mm.
To study the effects of different heat treatments on mechanical properties of CC alloys, heat treatments were performed at various temperatures for 1 h. The solution treated specimens were quenched into water from 830 °C to 950 °C at a constant interval of 30 °C, respectively, after which microstructure was studied and mechanical properties were examined to determine the optimal solution temperature. On this basis, the specimens under the optimal solution temperature were aged at 450 °C, 490 °C, 530 °C, 570 °C, 610 °C, respectively. And then air cooling to room temperature was done.
B. Characterization
Microstructure was characterized by optical microscope (POLYVAR-MET, Photonic Microdevices Inc., Murray Hill, New Jersey), Tecnai G2 F20 transmission electron microscope (TEM; FEI Corporation, Eindhoven, The Netherlands) and Sirion 200 field emission scanning electron microscope (SEM; FEI Corporation) equipped with an energy spectrum analysis (EDS) for element analysis.
Tensile tests were performed on MTS 810 (MTS Systems Corp., Eden Prairie, Minnesota) at a speed of 1 × 10⁻³ s−1. Macrohardness tests were conducted on a Brinell hardness tester (HB-3000B, Shandong Hualai Testing Equipment Co. Ltd., Shandong, China), while the microhardness tests were examined by a Vickers hardness tester (HVS-1000, Shanghai Lianer Testing Equipment Co. Ltd., Shanghai, China) at a load of 0.98 N with a holding time of 10 s. To evaluate the wear behavior, reciprocating wear tests were performed using a tribometer system (UMT-3, Bruker Corporation, Billerica, Massachusetts) under a load of 100 N at a speed of 240 rpm for 1 h.
III. RESULTS AND DISCUSSION
A. Effects of CC on Cu–10Al–4Fe–4Ni
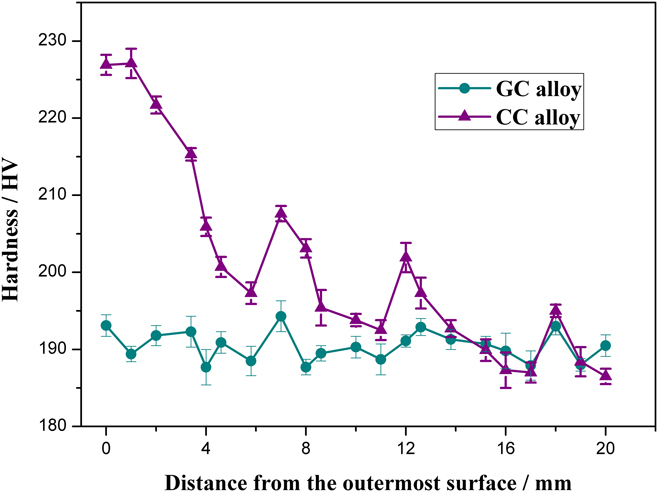
Microhardness tests were performed at several random positions of Cu–10Al–4Fe–4Ni from external to internal layers and the results are briefly described as curves shown in Fig. 1. Obviously, hardness of CC alloy indicates a declining tendency with oscillations from outer layer to innermost layer while those of GC alloy are basically consistent. It is noted that the highest peak hardness (227.1 HV) is obtained in CC alloy compared to GC alloy (194.3 HV). Additionally, hardness of CC alloy from external surface to internal surface firstly increases to the peak value (227.1 HV) due to vast majority of hard β′ phase or various κ precipitates and then sharply decreases corresponding to lots of soft α phase. What’s more, the internal layer has a relatively low hardness value (186.5 HV). In the external layer, various κ precipitates are dominant because more iron and nickel are conducive to precipitation of κIV phase caused by centrifugal force. However, there are many hard β′ phases in the internal layer although κ precipitates are almost disappeared. The inhomogeneous distribution of hard β′, various κ, and soft α phase interact with each other and consequently contribute to the large-scale fluctuation existed in the hardness curve of CC alloy.
Hardness of CC alloy and GC alloy from external to internal layer.

The microstructures of the different regions (centrifugal radius r A = 140 mm, r B = 130 mm, and r C = 120 mm) in CC alloy are shown in Fig. 2(a). For comparison, those of GC ingot are also presented [Fig. 2(b)]. It can be seen that the microstructure morphologies of three regions in CC alloy are significantly different mainly caused by dramatically centrifugal force and heat transfer during solidification. In the external layer (region A), light phase and the gray phase are almost equivalent in size and shape, and a number of small rosette-shaped or spherical black particles dispersedly distribute among the whole area, which makes contribution to higher peak hardness (227.1 HV). In terms of region B and region C, the light phase tends to be large columnar and dendritic-shaped because of rotational molding. Additionally, black particles are almost invisible. However, it is noted that GC alloy consists of light phase, gray phase and a smaller number of rosette-shaped or spherical black particles, which are evenly distributed. By comparing the microstructures of different positions, it can be confirmed that the microstructures of CC alloy shows nonuniformity owing to dramatically centrifugal force, heat transfer during solidification, complex fluid dynamics, and free surface flows.
Microstructures of as-cast alloy, (a) CC alloy from external to internal layer, (b) GC alloy.

When the melt is poured into the mold, its rotational speed is far less than the mold and the turbulence occurs because of drastic relative motion. Accordingly, arms of the primary dendritic columnar grains detach increasingly which can provide sites for nucleation of α phase in the external layer. As rotational speed of the melt increases, laminal flow originally arises from the external layer and expands to the internal layer gradually. This process promotes the growth of large columnar or dendritic-shaped grains. With the development of this process, turbulence and laminal flow appear alternately in the crystalline regions, resulting in inhomogeneous microstructures in the different layers. Moreover, as analyzed before, the content of iron in CC alloy is much higher. Therefore, more Fe-rich precipitates which appear at the early stages of solidification are likely to act as new nuclei. And precipitates can hinder the growth of α phase, eventually leading to a refinement of the microstructure. Reference Hasan, Iqbal and Ridley17
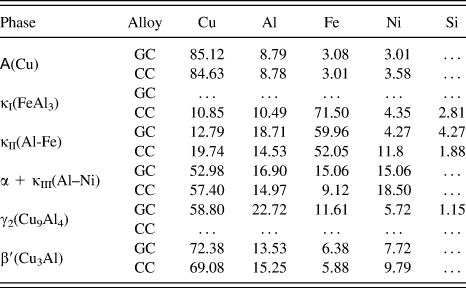
The microstructures in Fig. 2 are demonstrated at a higher magnification in the SEM micrographs (Fig. 3), where the structures, morphologies, and distribution of phases can be clearly identified. As shown in Figs. 3(a) and 3(b), CC alloy mainly consists of α phase, several κ phases, and β′ phase. Besides, γ2 phase has not been found possibly because CC alloy has a higher content of iron so a large amount of aluminum is used to form Fe-rich κ phases. All phases presented in the alloy are identified according to the morphologies, distribution and EDS results (Table I). It can be confirmed that the large dendritic-shaped or spherical particles in α grains are κI precipitates. And the smaller, dendritic-shaped particles dispersed in the periphery of α grains are κII precipitates. Besides, the lamellar or globular eutectoid decomposition products originating from grain boundaries of α phase and growing into β phase are referred to as κIII precipitates. Owing to the slow cooling rate, most of lamellar κIII phases turn into globular shape. As regards GC alloy [Figs. 3(c) and (d)], κI phase is invisible because of less content of iron and morphologies and distribution of other κ phases are essentially similar to CC alloy. In terms of α phase, GC alloy has the Widmanstätten morphology different from small equiaxed grains in CC alloy. Moreover, γ2 phase and β′ phase can be seen in the intergranular regions.
SEM micrographs of as-cast alloys, (a and b) CC alloy and (c and d) GC alloy.

EDS of different phases observed in CC alloy and GC alloy (wt%).

Figure 4 shows TEM micrographs of as-cast CC alloy. Obviously, κIII phases distribute not only in the areas of β phase but also in α grains [Fig. 4(a)]. And the small precipitates throughout α grains are definitively κIV phase which is explicitly exhibited in Fig. 4(b). In addition, β′ phase is needle-shaped martensite consisted with the previous works. Reference Hasan, Iqbal and Ridley17
TEM micrographs of as-cast CC alloy, (a) κIV phase, (b) κIII phase in α grains, and (c) the morphology of β′ phase.

Differences of microstructures are substantially related to dramatically centrifugal force and the heat transfer during solidification. In regard to CC process, the ingot solidifies from external to internal layer sequentially and should not be removed from the mold until its temperature is low enough to prevent the distortion. Additionally, heat transfer of CC process mainly consists of heat dissipation through the mold and slight convection between the internal melt and ambient air in that the internal surface is formed by centrifugal force. On the contrary, GC alloy is formed by core instead of centrifugal force. On the one hand, the core is capable of absorbing a certain amount of heat from the melt. On the other hand, it should be removed when the solidification is finished to avoid the corn being held tightly, which results in the enhancement of heat dissipation area and cooling intensity. Therefore, the cooling rate during solidification of GC process is higher compared with that of CC process, leading to the differences of microstructures. What’s more, turbulence and vibration of CC apparatus can promote the detachment of arms on the primary dendritic columnar crystals, conducing to the formation of finer equiaxed α grains. Reference Sui, Li, Liu, Guo and Fu15
B. Mechanical properties of as-cast alloys
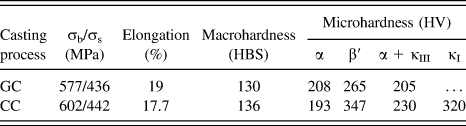
Mechanical properties of two as-cast alloys are listed in Table II. The ultimate tensile strength (UTS) and hardness of CC alloy are 602 MPa and 136 HBS, respectively, which are superior to 577 MPa and 130 HBS of GC alloy. However, the elongation of CC alloy is 17.7%, slightly lower than 19% (GC alloy). By comparison, CC process can improve UTS and hardness at a cost of elongation. The discrepancies of comprehensive mechanical properties have a close relationship with microstructure morphologies of as-cast alloy. As mentioned before, soft α phase in CC alloy is finer. Reference Ping, Rong, Jie, Yun, Qing and Zhi18 And γ2 phase presented in GC alloy has a deleterious effect on mechanical properties. All these factors combined with devoid of κI phases lead to significant reduction of mechanical properties for GC alloy.
Mechanical properties of as-cast alloys fabricated by GC and CC process, respectively.

Obviously, it is noted that the microhardness of α phase in GC alloy is 208 HV while it is reduced to 193 HV in CC alloy. It is mainly due to the solution strengthening. According to EDS results in Table I, solution of a substantial fraction of iron and nickel is observed in α phase during the rapid cooling. However, the microhardness of other phases in GC alloy are much lower, especially β′ phase. This may result from different quantities and morphologies of precipitates in β′ phase influenced by casting conditions.
C. Effects of quenching temperatures on microstructure and properties
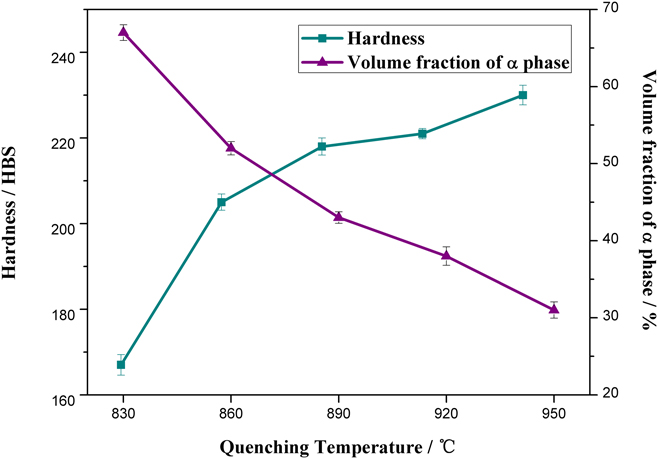
Hardness and volume fraction of α phase in CC samples quenched at various temperatures are plotted in Fig. 5. Obviously, hardness of CC alloy shows a tendency to increase significantly below 890 °C while disparity of hardness becomes inconspicuous when temperature exceeds 890 °C. This phenomenon can be explained by the development of microstructure as the quenching temperature increases.
Hardness and volume fraction of α phase at various quenching temperatures in CC alloy.

Figure 6 shows microstructure of as-cast CC alloy quenched at various temperatures. In Fig. 6(b), it can be seen that vast majority of eutectoid decomposition products, i.e., α + κIII have been absorbed by α matrix while the other phases are seldom changed. As the temperature continues to rise, α phase gradually dissolves into β phase corresponding to the downswing of volume fraction of α phase as plotted in Fig. 5. And at the same time, the increasing hard β′ phase leads to significant elevation of the hardness. At 890 °C, it is noted that overwhelming majority of various κ phases have been eliminated, counteracting the elevation of the hardness caused by the increasing hard β′ phase (218 HBS). In addition, when the temperature exceeds 890 °C, the morphology of β phase seems to be apparent and the grain boundaries can be seen definitely in the alloy quenched at 950 °C.
Microstructure of as-cast CC alloy quenched at various temperatures, (a) as-cast alloy, (b) 830 °C, (c) 860 °C, (d) 890 °C, (e) 920 °C, and (f) 950 °C.

With the increase of temperature, the volume fraction of β′ phase manifests a tendency to increase progressively, resulting in significant improvement of the hardness. However, excessive content of β′ phase has a deleterious effect on toughness because β′ phase is needle-shaped martensite. Furthermore, quenching stress has a close relationship with quenching temperature and exorbitant quenching temperature will promote the occurrence of quenching cracks. Consequently, the optimal quenching temperature of CC alloy is determined as 890 °C. On the one hand, the hardness cannot meet the demand when the temperature is below 890 °C. On the other hand, quenching stress increases significantly as the temperature exceeds 890 °C.
D. Effects of aging temperature on microstructure and properties
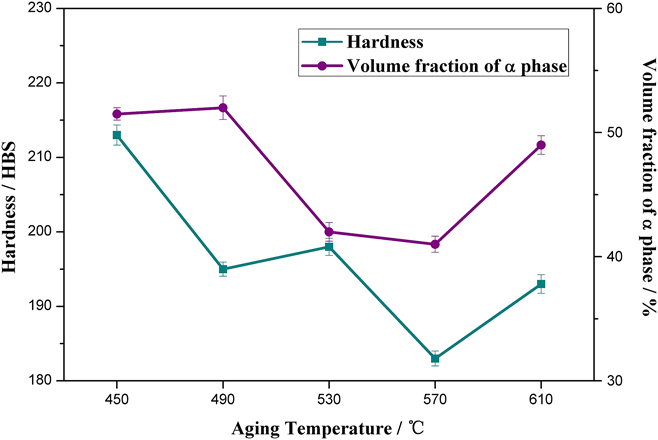
Figure 7 illustrates the hardness and volume fraction of α phase in CC alloy at various aging temperatures based on the optimal quenching temperature. It can be seen that the variation of hardness seems to be complicated. And the peak hardness is 212 HBS appearing at 450 °C, which is slightly lower than those of the as-quenched alloy. This is mainly because the volume fraction of soft α phase increases after aging process. According to Figs. 5 and 7, the volume fraction of α phase is 42% for as-quenched alloy (890 °C) whiles the aging alloy increases to 52%. Nevertheless, the quenching stress can be substantially eliminated during aging treatment, ameliorating the fatigue, and corrosion resistance.
Hardness and volume fraction of α phase at various aging temperature in CC alloy.

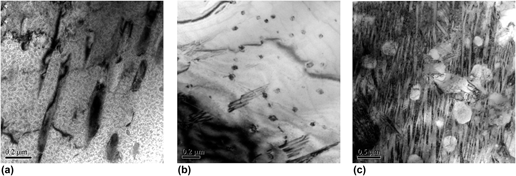
Microstructures of the age treated CC alloy are exhibited in Fig. 8. As analyzed before, microstructure of as-quenched CC alloy mainly consisted of α phase, acicular martensitic β′ phase and a few κ phases. For the alloy aged at 450 °C, morphology of martensitic β′ phase turns into lath-shaped which is further exhibited in the TEM micrograph perspicuously [Fig. 9(a)]. As the temperature increases, eutectoid transformation of martensite initiates and its morphology becomes increasingly obscure. In addition, decomposition of β′ phase contributes to the dramatic decrease of the hardness. At 530 °C, numerous κ phases precipitate predominantly in α grains, deterring the downswing of the hardness. Obviously, most of martensite has been decomposed at 570 °C and the laminar eutectional composition products are presented in Fig. 9(b). When the temperature reaches 610 °C, the eutectoid transformation has been accomplished and the martensite is almost eliminated. What’s more, minor coarsen α phase appears in Fig. 8(e) combined with α phase in the increasing eutectional composition products, arising the anomaly increase of volume fraction of α phase (Fig. 7). Therefore, the optimal aging temperature is 450 °C according to the development of microstructure and hardness.
Microstructure of CC alloy aged at various temperatures, (a) 450 °C, (b) 490 °C, (c) 530 °C, (d) 570 °C, and (e) 610 °C.

TEM micrographs of aging treated CC alloy, (a) the morphology of lath martensite and (b) laminar eutectoid decomposition products.

E. Mechanical properties of CC alloys
Comparisons of mechanical properties and wear resistance between as-cast CC alloy and heat-treated CC alloy are listed in Table III. After optimal heat treatment (890 °C/1 h + 450 °C/1 h), the UTS and hardness of CC alloy are 663 MPa and 212 HBS, respectively, which is superior to as-cast alloy (602 MPa and 136 HBS). Compared to as-cast CC alloy, the friction coefficient of heat-treated CC alloy greatly reduces to 0.38. It is obvious that this heat treatment can improve the UTS and hardness as well as wear resistance significantly at a cost of elongation.
Mechanical properties and wear resistance of as-cast CC alloy and heat-treated CC alloy.

By means of heat treatment, microstructure morphologies, distribution as well as volume fraction of soft and hard phases are improved, increasing the hardness and UTS. Similarly, the deformation resistance is also enhanced so plastic deformation reduces relatively during wear tests. Consequently, the elevated mechanical properties and deformation resistance can mitigate not only abrasive wear by preventing the wear debris being pushed into the matrix but also adhesive wear of friction pairs, which contributes to the reduction of friction coefficient. Furthermore, the initiation and propagation of cracks are inhibited to some extent, meliorating the wear resistance of the alloy.
The SEM micrographs of the worn surface are presented in Fig. 10. As regards as-cast alloy, large pits and shallow furrows can be seen on the worn surface while the wear debris is not obvious [Fig. 10(a)]. The large pits mainly result from serious adhesive wear. According to the morphologies of the worn surface, the wear mechanisms of as-cast alloy consist of adhesive wear and slight abrasive wear as well as fatigue wear. Compared with as-cast alloy, significant furrows and wear debris appears in heat-treated CC alloy instead of large pits as shown in Fig. 10(b). Therefore, the wear mechanisms of heat-treated alloy include abrasive wear, fatigue wear, and slight adhesive wear.
SEM micrographs of the worn surface, (a) as-cast CC alloy and (b) heat-treated CC alloy.

IV. CONCLUSIONS
In this work, microstructure and mechanical properties of Cu–10Al–4Fe–4Ni prepared by CC and GC process were investigated. The development of microstructure and properties of CC alloy heat-treated at various temperatures were also evaluated. The conclusions can be summarized as follows.
-
(1) Microstructure of CC alloy mainly consists of α, κI, κII, κIII, κIV, and β′ phase, while GC alloy comprises α, κII, κIII, κIV, γ2, and β′ phase. Morphologies of α phase in two alloys are quite different. GC alloy has the Widmanstätten morphology while CC alloy tends to be finer equiaxed grains.
-
(2) Microstructure of CC alloy reveals nonuniformity from external to internal layer. And Fe-rich precipitates are prone to aggregate in the external layer caused by centrifugal force. Consequently, the hardness of CC alloy also appears an inhomogeneity and decreases from external to internal layer.
-
(3) By comparison, comprehensive mechanical properties of CC alloy are superior to those of GC alloy.
-
(4) According to the development of microstructure and mechanical properties, it can be conformed that the optimal heat treatment process is aging at 450 °C for 1 h by air cooling after solution treated at 890 °C for 1 h by water quench for CC alloy. Under this condition, the UTS increases by about 10% and hardness by about 56% than as-cast CC alloy, while the elongation decreases by 53%. Besides, wear resistance is also improved significantly.