Introduction
The objective of this study is to estimate associations between social capital and health when other factors are controlled for. Social capital has several dimensions. In their extensive literature review, Islam et al. (2006b) provide a description and discussion of the central concepts used in the theoretical and empirical literature. Firstly, social capital is divided into cognitive and structural components. While cognitive social capital refers to norms, values, attitudes and beliefs, structural social capital contains observable aspects of social organizations, such as membership in formal voluntary organizations and participation in informal networks. Structural social capital and cognitive social capital are likely to interact. Trusting other people may facilitate the formation of organizations and networks, and networking may contribute to the building of mutual trust in the community. It has been suggested that virtuous circles in which trust encourages social participation, which again enhances trust, may prevail. Similarly, a decline in trust may lead to less social participation, which may lead to even less trust and create vicious circles. In the literature, a distinction is also made between bonding social capital and bridging social capital. According to Putnam (Reference Putnam2000), bonding social capital creates benefits only for participants in a particular network, while bridging social capital also creates benefits for a broader group of people. Hence, bonding social capital is typically present within homogeneous structures such as families, voluntary organizations, and religious communities, while the bridging social capital expresses mutual trust and social interactions between the less homogeneous groups of individuals in the society. In empirical studies of social capital, one often finds a distinction between individual and community social capital. This distinction corresponds to the distinction between variables at the individual level and the community level, and may reveal interesting information about the types of social capital in a community. While community social capital (CSC; for instance, total number of memberships in voluntary organizations) informs us about the aggregate level of interactions and networks in the community, irrespective of whether or not a particular individual is part of the network, individual social capital (ISC; measured for instance by the number of networks and formal organizations in which an individual is a member) indicates the social capital of this particular person.
An increasing literature of the relationship between social capital and healthFootnote 1 consists both of comparative cross-country studies at the aggregate level and of disaggregated studies within a country. While cross-country studies have failed to find associations at the aggregate level (Kennelly et al., Reference Kennelly, O’Shea and Garvey2003), strong associations have been found in disaggregated studies (Bolin et al., Reference Bolin, Lindgren, Lindstrom and Nystedt2003, Brown et al., Reference Brown, Scheffler, Seo and Reed2006 and Miller et al., Reference Miller, Scheffler, Lam, Rosenberg and Rupp2006). In between we find cross-country studies that employ data both at the national level and at the individual level. Using data from the European Social Survey, Poortinga (2006) finds beneficial properties of social capital at the individual level. At the same time, the aggregate social trust and civic participation variables are found to have a complex interaction with social capital at the individual level. This suggests that social capital may not uniformly benefit individuals living in the same community or society.
There are a few Norwegian studies of the relation between social capital and health. Kravdal (Reference Kravdal2001, Reference Kravdal2003, Reference Kravdal2006) has in multilevel studies examined the relationship between socioeconomic factors and cancer survival. He finds that being married and having children are factors that both add to survival. The protective effect of marriage is also emphasized by Folland (Reference Folland2006) who argues that the social capital a family represents is an incentive for the individual to choose a less risky and healthier life style. Van der Wel (Reference van der Wel2007) studies the relationship between social capital and self-assessed health in the Norwegian capital Oslo. In a multilevel analysis, he initially finds that social capital at the individual and community levels both have a positive impact on health. The impact was much weakened when other community-level variables, such as education level were entered into the regressions. Hence, the relationship between community social capital and self-assessed health was not found to be robust. There is presently no Norwegian multilevel study that examines the association between social capital and self-assessed health with representative data from the whole country.
Although Norway is a small country (4.5 million inhabitants), a study of the association between social capital and health may have some general interest because of the institutions of the country. As a welfare state with extensive income redistribution and a high level of public provision of private goods, one could argue that the state takes care of many of the health improving tasks that are handled privately in countries with a less extensive welfare state. Hence, even if the welfare state does not necessarily crowd out social capital in a country, the impact of social capital on health could be less significant because of almost free access to preventive and curative health and care services.
The article is related to other studies of the association between social capital and health in countries with a welfare state. The closest are Islam et al. (2006a, 2008), who apply voting participation as an indicator of community social capital. Referring to Putnam’s work, they argue that voting participation can be considered a proxy measure of social capital. People vote when they have a strong sense of mutual responsibility and support even with no prospect of personal gain. They argue for several mechanisms that may create a positive association between voting participation and health. First, voting participation is likely to be associated with awareness of health problems in the community and with collective action to solve the problems. Second, through closer social ties, information about healthy behaviour is facilitated. It is also claimed that an increase in voting participation is likely to represent an increase among lower socioeconomic status groups, who are more likely to vote for generous welfare programs. The last effect is not directly related to community social capital and may blur the interpretation of empirical studies. Islam et al. (Reference Islam2006a) find that voting participation at the community level is positively related to self-assessed health in their multilevel analysis of Swedish survey data.
This paper adds to Islam et al. (2006a, 2008) in several respects. In the cross-sectional survey, I add voting participation at the individual level, making it possible to study whether information at the individual level adds to the effect at the community level. Secondly, the panel data study has a maximum of six observations per individual, while Islam et al. (Reference Islam2006a) had at most three observations of each individual. Hence, the present study strengthens confidence in the results. Thirdly, I include variables of structural social capital (membership in organizations), which makes it possible to study whether or not different type of social capital have distinct effects on self-assessed health. Studies from the US (Scheffler et al., Reference Scheffler and Brown2007; Folland Reference Folland2007) show that population health is positively related to structural social capital. Possible mechanisms behind these relations are described in Scheffler (2008) in his introduction to this special issues. Main points are that social capital may give access to information about a healthy life-style. Local communities may also enforce social norms that discourage destructive behaviour and provide psychosocial support that mitigate stress and mental problems. In a country with a welfare state, one might suggest that the contribution to population health of membership in voluntary organizations is crowded out by the state. This suggestion is to be tested empirically. Lastly, including studies from several countries is beneficial since it helps us to evaluate whether or not a certain effect is country specific or more general.
The present study is exploratory in the sense that hypotheses are not derived from a rigorous economic model, but rather put forward informally. In each analysis, I study whether self-assessed health is associated with socio-demographic factors, indicators of human capital, and indicators of social capital. Hence, a static health production function is estimated (Grossmann, Reference Grossman1972).
The article is organized as follows. Section 2 presents the datasets, explains the variables, and displays some descriptive statistics. The estimation strategy and the empirical results are presented in Section 3. Finally, Section 4 contains some concluding remarks.
Data and descriptives
The data for this study were obtained by merging data from the standard-of-living survey by Statistics Norway, from the Commune Database compiled by Norwegian Social Science Data Services (NSD), and from several other sources. The merged files combine data at the individual level with indicators of community-level social capital related to each person’s county of residence. Hence, the data are appropriate for multilevel studies.
The standard-of-living surveys contain information on self-assessed health, socio-demographic characteristics, and some information on individual social capital. There are two types of surveys: an annual cross-sectional survey having health as a theme every 3–5 years, and an annual and less detailed survey of a panel of households. Both types of surveys are used in this paper.
The 1998 standard-of-living conditions survey consists of a sample of 5,000 respondents from the Norwegian non-institutionalized population, aged 16 and older. The sample is representative with respect to sex, age, marital status, and geographical region. Interviews were conducted with 3,449 persons. Data from 3,134 persons are of sufficient quality for use in the analyses, yielding a response rate of 63%. In addition to a major focus on health-related questions, the survey also included questions on living conditions, education, income, employment, etc. In particular, the survey is quite detailed regarding an individual’s participation in organized community life in terms of memberships and voting.
A supplementary analysis uses data from a panel set up in 1997 consisting of a representative sample of 5,000 individuals. In 2002, the panel contained 2,562 persons who had been interviewed annually a total of six times. Parallel to the attrition, the panel was supplemented with new individuals, so that in 2002 the panel consisted of a total of 5,119 individuals. Of these, 3,590 people were interviewed, a response rate of 70.1%. All individuals who were interviewed at least once were included in the dataset that consists of 21,770 observations of 5,055 individuals. This represents an average of 4.8 observations per individual.
Norway has 19 counties and 434 municipalities. In 2002, county population varied from 73,732 in Finnmark to 512,589 in Oslo (both a county and a municipality). Important trade-offs are involved in what community level to choose for data on community social capital. Initially, one would probably think that the municipality is superior because a municipality is more homogeneous than a county. With survey data this is however not so obvious, since we would have a very small number of observations in the smaller municipalities. Therefore, the county was used as the regional unit for measuring community social capital.Footnote 2
Several measures are suggested for measuring community social capital. Robert Putnam (2000) initiated the Social Capital Community Benchmark Survey (SCCBS), an instrument that tracks residents’ involvement and membership in community organizations. Inspired by the SCCBS, The Petris Social Capital Index (PSCI) (Scheffler, 2008) looks at community voluntary organizations using public data available for the entire United States. Since US Census data do not contain actual membership data, but do contain data on paid employment in voluntary organizations, the number of paid employees as a percentage of the population is used to measure CSC. Data necessary for making the Petris Index were not available at the regional level in Norway. Therefore, other indicators of structural community social capital were used. The four county-level measures of community social capital used are:Footnote 3
Number of people attending church services relative to population
Membership in sports organizations relative to population
Number of votes as a proportion of the number entitled to vote in local elections
Fundraising per capita in annual national campaigns
The first two are structural measures that reveal information about the degree of organizational activity in the community. Church membership is very large. Norway has a state church and the overwhelming majority of people belong to it. For most, church membership seems to be a formality; a much lower proportion goes to church regularly. Hence, the number of people attending church services relative to the population is a more useful indication of involvement in organized religion. The second measure of structural community social capital is the proportion of the population who are members of sports organizations. Next to the church, sports organizations are the organizations with most members in Norway and often play a significant role in the local communities.
The last two measures of community social capital are of a cognitive kind. As argued in the introduction, the proportion of people who vote in local elections tells something about the concern for and involvement in the local community; but since increased voting participation also seems to have a direct impact on the level of spending on welfare programs, it could be claimed that it should be supplemented with other indicators. In this study, we use the level of local fundraising per capita. In Norway, there is a major annual fundraiser for a humanitarian purpose. These campaigns also turn out to be competitions between local communities in the act of giving, and a ranked list is published in the media each year. Since the contributed sum can be considered a public good, the total contribution per capita is an indicator of mutual involvement in the community.
Indicators 1, 3, and 4 are compiled from the Commune Database (http://www.nsd.uib.no/english/data/regional.html) by the Norwegian Social Science Data Service (NSD). The Commune Database contains demographic and occupational information, welfare-related statistics, and data on the provision of public services at the municipality level. Data on memberships in sports organizations are from the Norwegian Confederation of Sports.
Two health indicators are considered as dependent variables: self-assessed general health and self-assessed mental health. The first is an individual’s answer to the question: ‘How would you assess your health in general?’ The answer has five alternatives: very good, good, neither good nor bad, bad, and very bad. Self-assessed mental health comes from the Norwegian translation of the five questions that constitute the mental health component (MH) of SF-36 (http://www.sf-36.org/tools/sf36.shtml). MH is measured according to a 0–100 scale with 100 as the highest possible score.
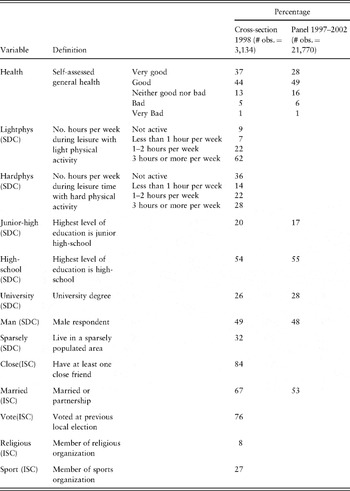
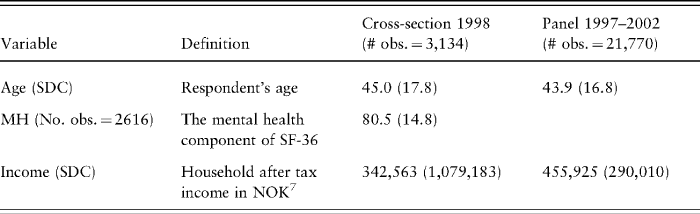
Table 1 shows variable definitions and basic descriptives for the 1998 cross-sectional survey and for the 1997–2002 panel.
Descriptive statistics – frequencies of values of discrete variables

Notes: SDC = Socio-demographic control.
ISC = Individual social capital.
In both data sets, the proportion of respondents who consider their health to be very good or good is around 80% and is somewhat higher in the cross-sectional data compared with the panel data. The cross-sectional data set is more detailed than the panel data set with regard to individual lifestyle information. From Table 1 we see that 62% of the respondents do light physical activity three hours or more per week and 28% do a similar amount of hard physical training. The proportion of participants who consider themselves to have at least one close friend is 84%. Eighty percent have at least a high school education. The proportion living in a marriage or partnership is 67% in the cross-section and 53% in the panel data set. The main reason for the different proportions is that cohabitation is registered in the cross-sectional dataset only. Some 76% of participants voted in the previous local election, and 8% are members of a religious organization (for some in addition to being a member of the state church). Finally, 27% are members of a sports organization.
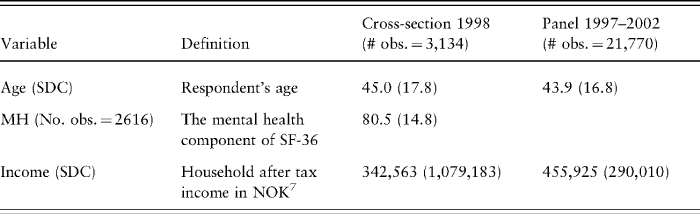
Table 2 shows descriptives for the continuous variables. The average of MH is 80.5, which is quite similar to what has been found internationally. We notice that the mean income in the panel dataset is considerably larger than the mean income in the cross-sectional survey. We also see that the coefficient of variation (standard deviation/mean) of income is considerably larger in the cross-sectional dataset than in the panel dataset. The reason for these differences seems to be some negative incomes of huge absolute value in the cross-sectional survey.
Descriptive statistics of continuous variables – mean (std dev)
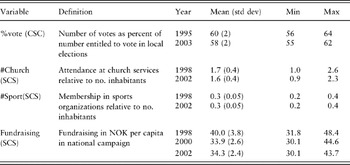
The indicators of community social capital are described in Table 3 for two years. The figures are quite similar from one year to the next if fundraising is disregarded. These variables are merged with the survey data (cross-sectional and panel) according to the residential county of the respondent.
Indicators of community social capital (CSC) at the county level

Note: CSC = Community social capital.
Estimation and results
The cross-sectional dataset contains two levels (individual and county), while the panel dataset contains three levels (time, individual, and county). Due to unobserved heterogeneity at the individual level, the error terms are likely to be correlated across years and the assumption of ordinary least squares of independent error terms is then not fulfilled. This argument also applies to the county level, since due to unobserved heterogeneity at the county level, error terms are likely to be correlated for individuals who live in the same county. Unobserved heterogeneity is adjusted for by estimating multilevel models using the program gllamm (Rabe-Hesketh and Skrondal, Reference Rabe-Hesketh and Skrondal2005) in Stata 9. In the program, the hierarchical structure of data is modeled as random intercepts.
Since general health is measured by an ordinal scale with five points, we estimate an ordered probit model with the county as a second level. An ordered probit model is derived from a linear regression model for a latent continuous response variable yi *, where the subscript indicates individual no. i

where xi is a vector of explanatory variables, ui is a classic error term with a normal distribution and β is a vector of coefficients to be estimated. Observed ordinal responses are generated from the latent continuous response via a threshold model:
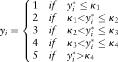
A cut point κi (to be estimated) helps in calculating the probability of a particular response, sinceFootnote 4:

where F() is the cumulative density function of ui. All estimated parameters are displayed in Tables 4 and 5.
The measure of mental health appears as a continuous variable between 0 and 100, and we estimate a linear regression model with county as a second level.
Since only the 1998 survey contains information of individual membership in organizations, this survey is analyzed separately.
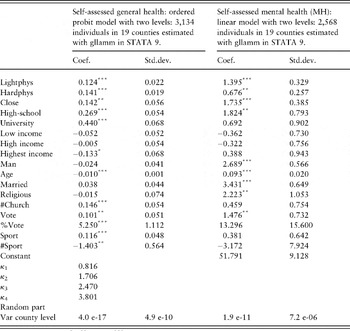
Table 4 displays the results from the estimation of the models with cross-sectional data. In general, the analyses confirm previous studies showing that level of education is positively related to self-assessed general health. However, university education does not add to mental health (MH). There is no association between the level of income and health in general. One of the indicators used for individual social capital (having at least one close friend) is always positively associated with general health and mental health.
Associations between indicators of Self-assessed Health and individual and community level capital 1998

Notes: The symbols *, (**), and ((***)) mean that an effect is statistically significant at 10, (5), and ((1)) percent level. κi denotes a cut-off point and its interpretation is commented on in the text that explains the estimation methods.
The associations between community social capital and health are somewhat mixed. The analysis distinguishes between individual and community social capital. We can see that being a member of a religious organization is not associated with better health in general, while religious activity in the community as a whole is associated with better general health. For mental health, it seems to be the other way around. Hence, for general health, religious activity appears in this study as bridging social capital since it is associated with good health irrespective of whether a particular individual is active. This is contrary to membership in sports organizations, which is positively associated with general health for members, and negatively associated with the proportion of members in the community. Hence, the result suggests that these organizations represent extreme bonding social capital in the sense that the benefit for their members has a negative externality to non-members in the community. Voting participation at the community level is positively associated with general health, while for mental health a similar effect cannot be identified.
The last line of Table 4 displays the estimated variance at the county level. We see that estimated variance is not significantly different from zero. This implies that we are not able the reject the null hypothesis of no clustering of individuals at the county level.
To study whether the association between community social capital and health depends on an individual’s human capital, I also included interaction terms between community social capital and individual income and education. The interaction terms were not associated with health and the results are not shown in the tables.
Cross-sectional survey data may give rise to biased estimates because of unobserved heterogeneity that is correlated with the explanatory variables. With panel data, unobserved heterogeneity can be controlled for, since we now have variation in variables over time for each individual. Although panel data represent a step forward compared with cross-sectional data we are still left with two problems: First, causality is still not determined. Second, the data do not allow us to adjust for possible selection problems. Because of insufficient data, it is not possible, for example, to adjust for the fact that people who are not religious may choose to move from counties with a high rate of church attendance.
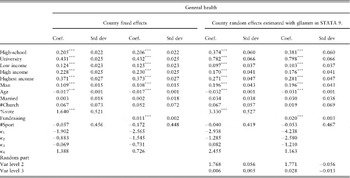
We estimate a panel data model with a maximum of six years of observations (1997–2002) per individual. The dataset that we use contains information of self-assessed general health, but not of self-assessed mental health. This dataset does not include individual social capital variables, which means that only indicators of community social capital can be included in the regressions. Since self-assessed health is measured along an ordinal scale, we estimate an ordered probit model with three levels. The model is first estimated with counties as fixed effects and then with counties as random effects. The results of the estimation are shown in Table 5.
Associations between self-assessed general health and community social capital variables in the Norwegian Level of Living Conditions Panel 1997–2002. Ordered probit model with three levels: 21,770 observations of 5,055 individuals in 19 counties

Notes: The symbols *, (**), and ((***)) mean that an effect is statistically significant at 10, (5), and ((1)) percent level. κi denotes a cut-off point and its interpretation is commented on in the text that explains the estimation methods.
Table 5 shows that the significance of the estimated coefficients is not much influenced by whether the county level is included as a fixed or a random effect. Years of education, level of income, and being male are all positively related to self-assessed health. As expected, self-assessed health declines with age. Interestingly, we see that only one of the significant community social capital variables from the cross-sectional survey is statistically significant in the panel data analysis. While voting participation at the community level contributes positively to self-assessed health, church attendance no longer has an impact. The last part of Table 5 shows the results of the analyses when %Vote is replaced with Fundraising.Footnote 5 We see that Fundraising has a positive impact on self-assessed health without having much influence on the estimated effects of other variables.
I have calculated the magnitude of the effects of %Vote and Fundraising. For a 50-year old married man with high school and low income I found that increasing %Vote from 55% to 64%Footnote 6 increased the probability of having very good health by four percentage points. A similar magnitude was calculated for an increase in the fundraising variable from 30 to 48 NOK. The magnitude of the effects is independent of whether the estimated coefficients from fixed effects or the random effects model are used.
Concluding remarks
The purpose of this study has been to explore associations between social capital and self-assessed health, as found in population surveys merged with community databases. Data are from Norway, a small country with a welfare state that organizes extensive income redistribution and provides a high level of private goods. Even if the welfare state does not crowd out social capital in a country, the impact of structural social capital on health could be less significant because of almost free access to preventive and curative health and care services.
In particular one indicator of community social capital – voting participation in local elections – was positively associated with self-assessed health in both cross-sectional and panel data studies. The association seems to be of considerable magnitude. That voting participation is positively related to self-assessed health was also found by Islam et al. (2006a) in their analysis of Swedish survey data. Since it could be claimed that a high voting participation is more related to high public spending on welfare goods than to social capital as such, we replaced the voting participation rate with the average contribution in annual fundraising. The association was still present. The associations between community organizations and health were somewhat mixed. While we find that church attendance at the community-level has a positive effect in the cross-sectional survey, the effect is not there in the panel study. This is contrary to several studies from the US, for example Brown et al. (Reference Brown, Scheffler, Seo and Reed2006). A reason might be that the church, and perhaps voluntary organizations in general, have more important functions for people’s health in the US than in Norway. These possible cultural differences would be interesting to explore further.
As argued in Section 2, the level of local fundraising indicates the degree of identification with the local community and as such is included as a community social capital variable. The fundraising variable in the empirical analyses is at the county level, while the suggested competition between local communities operates more at the municipality level. The argument is still valid since a strong local identity as a driving force behind the competition between municipalities within the same county, also contributes to a high level of aggregate spending at the county level.
We find that sports organizations have a negative effect on health in the cross-sectional survey and no effect in the panel study. This result indicates that sports organizations may represent bonding social capital. Perhaps a lot of organized sport in the community makes those who do not attend feel worse than they otherwise would have done? In general, one might argue that sports organizations also could represent bridging social capital, if their members commit themselves to the physical exercise of the community at large. An important follow-up to this study would be to find out more about the factors that effect whether organizations are characterized by bonding or bridging social capital.
The study has certain limitations that should be considered in future studies. First of all, the data and statistical methods used do not allow us to make any conclusion about causality. Second, lack of individual social capital data in the panel data analysis does not allow us to test whether community social capital, for instance voting participation, has an effect additional to the individual effect of voting. Third, the geographical scale of the multilevel analysis is taken as given and has not been an object of sensitivity analysis. Forth, possible selection effects related to residential mobility are not taken into account.
Acknowledgements
Financial contribution from the Research Council of Norway through the Health Economics Research Programme at the University of Oslo (HERO) is acknowledged. Data are provided by Norwegian Social Science Data Services (NSD). NSD is neither responsible for data analyses nor interpretations. Much of the work with this paper was done while the author was on sabbatical leave at University of California at Berkeley. Thanks to the Petris Center and its Director, Professor Richard Scheffler and Associate Director of Research, Tim Brown for hospitality, inspiration and help and to Michael Hsin for excellent research assistance. I would also like to thank participants at the Petris Center Workshop on Social Capital, Oct. 26-28, 2006 and Snorre Kverndokk for helpful comments and suggestions. Finally, critique and suggestions from two anonymous reviewers have contributed to the improvement of the paper. As usual, I am alone responsible for remaining weaknesses.