Introduction
Malnutrition, defined as either under-nutrition (underweight, wasting and stunting) or over-nutrition (overweight and obesity), is a global public health challenge. Underweight is listed among the top ten leading risk factors for the global burden of disease. The World Health Organization (WHO) defines underweight as a body mass index (BMI) <18.5 (WHO, 2002). It is associated with low energy levels, tiredness and poor perceptions of body image (Reddy et al., Reference Reddy, Resnicow, James, Kambaran, Omardien and Mbewu2009). Globally 842 million people are undernourished, of which 827 million live in developing countries. Sub-Saharan Africa has the highest prevalence of under-nutrition (24.8%) compared with 14.3% worldwide (Food and Agriculture Organization of the United Nations, 2014).
Though malnutrition’s effects on women, especially those of reproductive age (15–49 years), have been recognized for decades, there has been little specific investigation into this, with the focus mainly on malnutrition among under-five children.
Women are more likely to suffer from nutritional deficiencies than men, because of their reproductive biology, low social status, poverty, lack of education, sociocultural traditions and disparities in household work patterns (Ransom & Elder, Reference Ransomm and Elder2003). Malnutrition poses a variety of threats to women. It weakens their ability to survive childbirth, makes them more susceptible to infections and leaves them with fewer reserves to recover from illness. Women who have a low body mass index before they become pregnant are 72% more likely to suffer a miscarriage in the first three months of pregnancy. By contrast, healthy women can fulfil their multiple roles (generating income, ensuring their families’ nutrition and having healthy children) more effectively and thereby help advance their countries’ socioeconomic development (Ransom & Elder, Reference Ransomm and Elder2003). As in many regions of sub-Saharan Africa, Nigeria is facing multiple disease burdens with an unfinished agenda of under-nutrition, a high burden of infectious disease and poor reproductive health outcomes (Kandala & Stranges, Reference Kandala and Stranges2014). The aim of this paper was to gain an in-depth understanding of the epidemiology of under-nutrition and the ecological, socioeconomic, community, individual and household factors that affect it in Nigerian women of reproductive age (15–49 years).
Methods
Study population
The Demographic and Health Survey (DHS), funded by the United States Agency for International Development (USAID), is a well-established source of reliable population-level data with a substantial focus on health. The objectives, organization, sample design and questionnaires used in the DHSs are described elsewhere (National Population Commission & ICF Macro, 2009).
A random sample of 34,596 women from the 2008 Nigerian DHS (2008 NDHS) were identified to be eligible for individual interview. Anthropometric measurements of height and weight were collected from a sample of 28,200 women aged 15–49 years (National Population Commission & ICF Macro, 2009, p. 181), and risk factors for underweight were recorded, as were socio-demographic data and women’s state of residence. Body mass index (BMI), or the Quetelet index, was used to measure thinness and obesity. There were a few participants with missing data for BMI and other covariates in the selected sample, so BMI data analysis was based on 27,967 women with a complete set of data (National Population Commission & ICF Macro, 2009). Respondents for whom there was no information on height and weight and for whom a BMI could not be estimated were excluded from the sample.
Outcome measurement
Anthropometric measures were taken, including height, weight and waist circumference; BMI was calculated as weight in kilograms divided by height in metres squared and categorized as follows: underweight, BMI <18.5 kg/m2; normal weight, BMI 18.5–24.9 kg/m2 (reference category); overweight, BMI 25–29.9 kg/m2; and obese, BMI ≥30 kg/m2, according to WHO guidelines (WHO, 1995). For the present analyses, the outcome or dependent variable was the prevalence of underweight, defined as BMI <18.5 kg/m2. The binary outcome was chosen instead of the continuous BMI values for interpretability reasons, since with the binary outcome one can estimate the likelihood of underweight in a given state, while accounting for a number of potential covariates.
Covariates
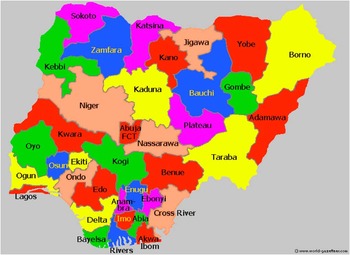
The main exposure variable investigated was the respondent’s geographic location, i.e. state of residence at the time of the survey (Fig. 1), in addition to various individual-level control variables such as socio-demographic factors known to be associated with nutritional status. The respondent’s and her partner’s ages at the time of survey were also included as indicators of the birth cohort of the women. Other socio-demographic covariates were religion (Catholic vs Other Christian, Islam, Traditionalist and other), wealth index (poorest vs poorer, middle, richer and richest) and education of the respondent and partner (no education vs primary, secondary and higher education). Women’s parity (number of children ever born) was recorded as: low parity (<4 children), medium parity (5–7 children) and higher parity (8+ children). Women’s parity was also modelled as a continuous variable using a flexible non-linear effect. Women’s pregnancy status was recorded as ‘yes’ or ‘no’. Finally, environmental factors included women’s place (locality) of residence (rural vs urban) and state of residence, including her ethnicity (Ekoi vs Fulani, Hausa, Ibibio, Igala, Igbo, Ijaw/ Izon, Kanuri/ Beriberi, Tiv, Yoruba and other).
Map of Nigeria showing the 37 states.

Statistical analysis
To account for spatial effects in the prevalence of underweight at the state level in Nigeria, a unified approach was applied to account for possible non-linear effects of continuous risk factors. This was achieved using a geo-additive semi-parametric mixed model. The model employed a fully Bayesian approach using Markov Chain Monte Carlo (MCMC) techniques for inference and model checking (Brezger et al., Reference Brezger, Kneib and Lang2005; Kandala & Stranges, Reference Kandala and Stranges2014). The response variable was defined as y i =1 if underweight and y i =0 normal weight. The standard measure of effect was the posterior odds ratio (POR) and 95% credible region (CR).
The analysis was carried out using version 2.0.1 of the BayesX software package, which permits Bayesian inference based on MCMC simulation techniques (Brezger et al., Reference Brezger, Kneib and Lang2005). The statistical significance of apparent associations between potential risk factors and the prevalence of underweight was explored with chi-squared (χ 2) and Mann–Whitney U-tests, as appropriate. Adjusted Marginal Odd Ratios (MORs) of underweight risk across states were obtained from standard logistic regression models, with Anambra used as the reference category because of its lowest crude underweight prevalence (see Table 2). Multivariate Bayesian geo-additive regression models were used to evaluate the significance of the PORs determined for the fixed, non-linear effects and spatial effects. The PORs of the state residual spatial effects are represented in maps in Figs 4 and 5 respectively.
Results
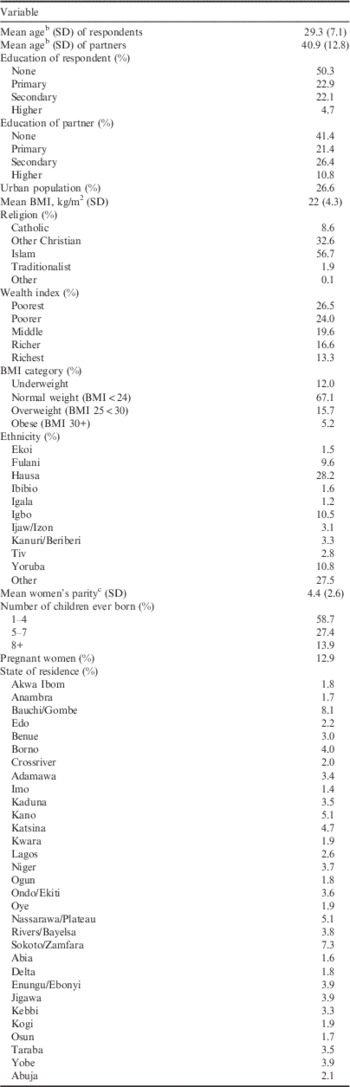
Table 1 shows the background characteristics of the study population, and Table 2 describes the study population’s characteristics according to their nutritional status (underweight vs normal BMI). Overall, the mean age of participants was 29.3 (±7.1) and that of their partners was 40.9 (±12.8). The percentage of participants with no education was high (50.3%), and 41.4% among their partners. Mean BMI was 22.0 (±4.3), 26.6% of participants were living in an urban area, 56.7% were Muslim and 26.5% were in the lowest poorer quintile of the wealth index.
Baseline characteristics of the study population, N=27,967, 2008 NDHSFootnote a

a Data are expressed as means (SD) or percentages.
b Age ranges from 15 to 95 years.
c Women’s parity (total children ever born) from one to eighteen children.
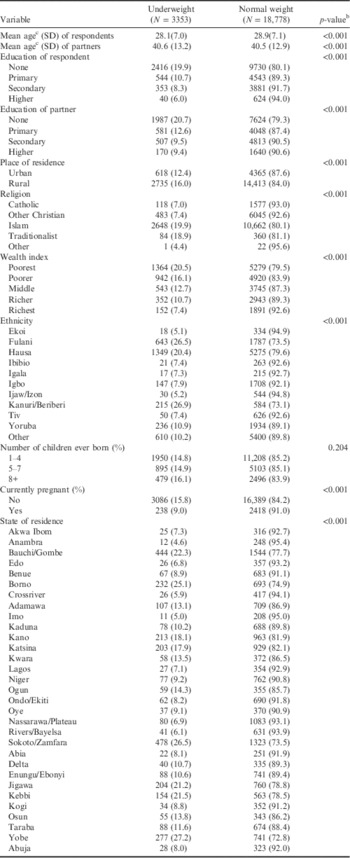
Baseline characteristics of the study population by underweight status, 2008 NDHS a
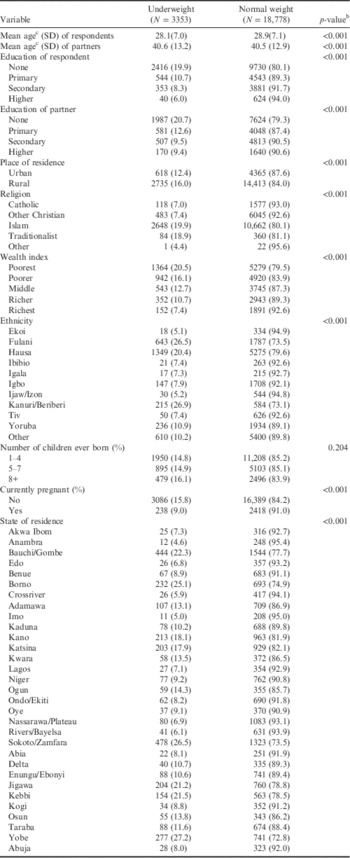
a Data are expressed as means (SD) or percentages.
b p-values for comparison.
c Age ranges from 15 to 95 years.
The overall underweight prevalence was 12.0%, with variation across states, ranging from 4.6% in Anambra in the southern part of the country to 27.2% in Yobe in the north. There was no statistically significant difference between underweight and normal weight women and their partners in terms of age, but underweight women were more likely to be uneducated, have partners with no education, to be living in rural areas and Muslim. In addition, underweight women were more likely to be poorer, from the Kanuri/Beriberi ethnic group and living in Yobe state in northern Nigeria (Table 2).
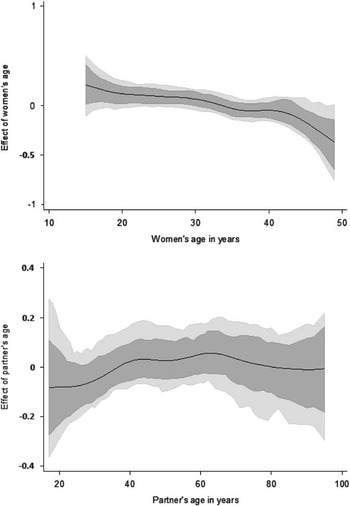
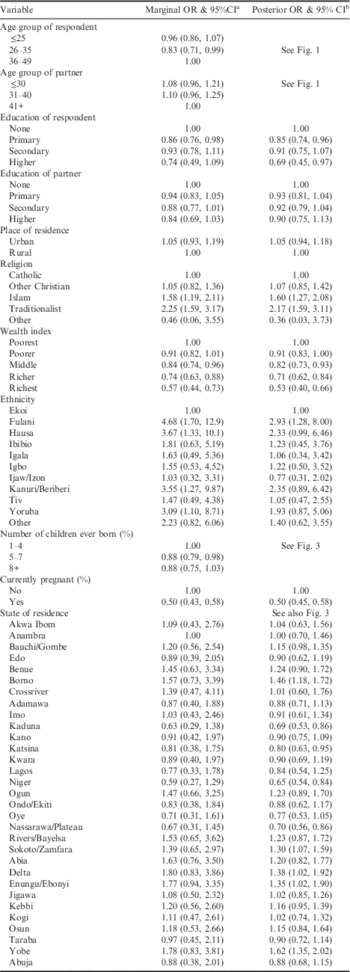
Table 3 shows both MORs and PORs of underweight women across the selected study characteristics. Results from both standard logistic regression and multivariate Bayesian geo-additive analyses support the role of women’s wealth, religion and ethnicity as risk factors. Specifically, women from the richest wealth index (POR and 95% credible region (CR): 0.56 [0.46, 0.70]) were all consistently associated with lower odds of being underweight. On the other hand women from the Muslim (1.61 [1.10, 2.23]) or traditional religion (2.12 [1.44, 3.00]) and women from the Fulani ethnic group (2.90 [1.64, 5.55]) were all consistently associated with higher odds of being underweight. Factors that were not significantly associated with underweight were age, women’s and partner’s education (no education) and place of residence (living in rural areas). Moreover, there was an inverse negative linear association between women’s age and underweight status: the older the women the more underweight they became. This relationship was somehow inconclusive with the partner’s age, as shown in Table 2 and in Fig. 2 using a flexible non-linear curve.
Estimated non-linear (logit) effects of women’s age and partner’s age on underweight in Nigeria. The posterior logit within the 95% and 80% credible intervals is shown (2008 NDHS).

Marginal and posterior odds ratios of underweight across selected covariates, 2008 NDHS
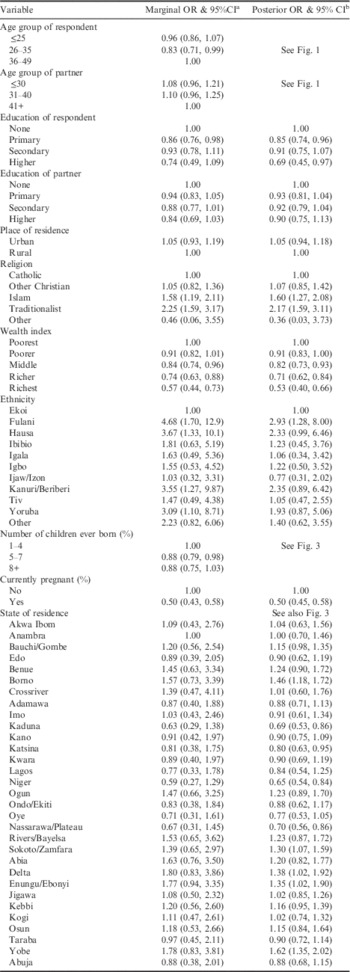
a Adjusted marginal odds ratio (OR) from standard logistic regression models.
b Spatially adjusted posterior odds ratio (OR) from Bayesian geo-additive regression models after controlling for non-linear effect of age, categorical variables and state of residence (spatial effects).
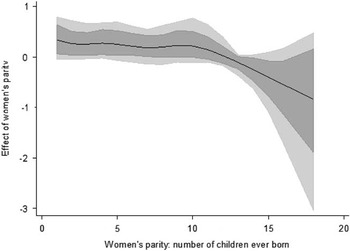
There was no statistically significant difference between underweight and normal women in terms of parity (number of children ever born) (p=0.204). There was a statistically significant association between underweight and pregnancy status: not pregnant women were more likely to be underweight than their pregnant counterparts (p<0.001). Moreover, using a flexible non-linear curve, there was a non-linear negative association between women’s parity and underweight status (Fig. 3): the risk of underweight decreased with women’s higher parity with a peak at around ten children and then a decrease in higher parity thereafter.
Estimated non-linear (logit) effects of women’s parity (number of children ever born) on underweight in Nigeria. The posterior logit within the 95% and 80% credible intervals is shown (2008 NDHS).

With regard to underweight status by states in the marginal regression analyses, there was a striking variation in underweight risk across states, the highest being in the northern states of Yobe (2.37 [1.14, 4.94]) and Borno (2.12 [1.01, 4.45]), and the lowest in Niger (0.75 [0.35, 1.59]) and Anambra.
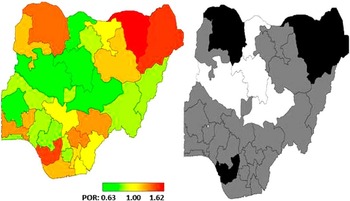
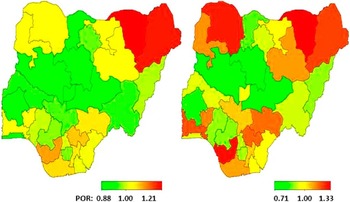
Figure 4 shows the results for covariate-adjusted spatial variation of underweight captured by the global total state effects, and Fig. 5 shows the local state effects (left) and smoothed state effects (right). There is a clear pattern of states, with higher risk of underweight in mostly the northern states of Sokoto and Yobe/Borno but also the southern state of Delta, while states in the centre were associated with a lower underweight prevalence. These spatial patterns confirm the observed marginal model findings shown in Table 3.
Total residual spatial provincial effects (left) and 95% posterior probability map (right) of the risk of underweight in Nigeria (2008 NDHS). Red: high risk of underweight, posterior odds ratio (POR) 1.62; green: low risk of underweight, POR 0.63; black: significant positive spatial effect; white: significant negative spatial effect; grey: no significant effect.

Residual spatial effects (smoothed) of underweight at state level in Nigeria (left). The posterior odds ratios and the corresponding residual random (localized) spatial effects (right) are shown (2008 NDHS). Red: high risk of underweight, POR 1.21 (left) to 1.33 (right); green: low risk of underweight, POR 0.88 (left) to 0.71 (right).

The left-hand map in Fig. 4 shows the estimated posterior total residual state odds of underweight for each state (raging from a POR of 0.63 to 1.62), with the red colour indicating the maximum posterior odds recorded while green denotes lower odds. The right-hand maps show the 95% posterior probability maps of underweight, which indicate the statistical significance associated with the total excess risk in the left-hand map. White colour indicates a negative spatial effect (associated with reduced risk of underweight), black colour a positive effect (an increased risk) and grey colour a non-significant effect. However, the total spatial residuals in the right-hand side of Fig. 4 show that much of the variation in underweight remains to be explained. These spatial effects are then allocated by the model into structured effects (smoothed: ranging from a POR of 0.88 to 1.21), which are shown in the left-hand map in Fig. 5, and unstructured residual effects (local effects: raging from a POR of 0.71 to 1.33), shown in the right-hand map of Fig. 5.
In all, there was a consistently higher prevalence of underweight in the north-western states covering Yobe/Borno and Sokoto as well as in the southern state of Delta. By contrast, the findings showed lower prevalence in the central states covering Niger, Kaduna and Nassarawa. However, on splitting the total residual spatial effects of underweight into local spatial effects and smoothed effects, many of these spatial effects were no longer indicating statistical significant effects (Fig. 5: probability maps not shown).
Discussion
This study found that 12.0% of the Nigerian study population were underweight in 2008. The findings were clear about the pattern of states with higher risk of underweight (mostly the northern states of Sokoto and Yobe/Borno). A similar finding was found in Uganda using the DHS, where underweight clustered significantly in the northern and north-eastern regions (Turi et al., Reference Turi, Christoph and Grigsby-Toussaint2013).
Underweight women were more likely to be poorer, from the Kanuri/Beriberi ethnic groups and living in Yobe state. Results from both standard logistic regression and multivariate Bayesian geo-additive analyses support the role of women’s wealth, religion and ethnicity as risk factors. Specifically, women with higher education and with the richest wealth index were consistently associated with lower odds of being underweight. Education has been found in several studies to be a predictor of most health outcomes. It is believed in some parts of Africa that being fat is a sign of affluence and vice versa. Low-quality diets and poverty contribute to poor nutritional status.
The study also found an inverse negative linear association between women’s age and underweight status: the older the women were, the more underweight they became. This may increase the risk of mortality among older women. A study by Sissi et al. (Reference Sissi, Moineddin, Urquia, Razak and Ray2014) confirmed that adults who are underweight – with a BMI of 18.5 or less – had a 1.8 times higher risk of dying than those with a ‘normal’ BMI of 18.5 to 24.9. Furthermore, findings from the present study revealed that underweight female adults were more likely to be living in rural areas. This is consistent with a study done by Mendez et al. in Reference Mendez, Monteiro and Popkin2005 in developing countries. Underweight is predominant among adults, especially women, living in rural areas of the least developed countries and remains a concern. There are inadequate data on the underweight status of adults, especially women, in developing countries.
Though the rate of malnutrition, especially among under-five children, in general is declining in many countries, it is not the same for all countries, within countries and within states/provinces/districts and social groups. In Eastern African and South Asian countries, the rate has either been increasing or remaining constant for several years. This appears to be the case for countries where geographic and social structure remains highly heterogeneous, such as Nigeria, India, Nepal, Bolivia, Columbia, Mongolia and Ethiopia (World Bank, 2006). In Nigeria, for instance, underweight among women in the southern state of Anambra is 4.6% compared with 27.2% in Yobe (north) and 7.1% in Lagos. Because of the high and often increasing socioeconomic variation across different spatial units (globally, regionally or within country), spatial disparity is of interest to policymakers (Krugman, Reference Krugman1991; Kanbur & Venables, Reference Kanbur and Venables2005; World Bank, 2009). Spatial variation in underweight has been observed in other countries. Although the focus is mostly on economic disparity, interest has also emerged in other well-being-related inequality issues such as underweight among under-five children, child mortality, maternal mortality and maternal contraceptive use (McNay et al., Reference McNay, Arokiasamy and Cassen2003; Kravdal, Reference Kravdal2004; Kandala & Stranges, Reference Kandala and Stranges2014).
As in many cross-sectional studies, this study has some limitations that are worth mentioning. The cross-sectional nature of the study does not allow for establishing temporal and causal associations between the observed relationships. Given the fact that exposure variables in this study were primarily demographic and socioeconomic factors, the potential of reverse causation should not be discounted. Second, the analysis was only carried out in Nigerian women, so the generalizability and applicability of these findings to male populations or other sub-Saharan African countries cannot be established.
In conclusion, this study shows that underweight is a major public health problem in Nigeria affecting adult females in the northern states of Nigeria, and pinpoints specific states. It also demonstrates that the DHS can be used to assess geographic clustering and burden of disease, thereby allowing for targeted programmes and policies. It is crucial to take into account sex and spatial and socio-cultural issues and risk factors when developing and implementing evidence-based strategies and interventions for lifestyle health promotion.
Acknowledgments
The authors thank Macro International for providing free access to the 2008 Demographic and Health Survey data-sets for Nigeria. They also thank Samuelina Siipara Arthur for helping with the literature search and for her comments on the earlier version of the paper. The authors declare no conflict of interest.