



1. Introduction
Cavitation is the process of rupturing a liquid by decrease in pressure at roughly constant liquid temperature (Brennen Reference Brennen1995), which can cause significant consequences in nature and technological applications. For instance, cavitation in a snapping shrimp's claw shutting can cause intense flashes of light (Lohse, Schmitz & Versluis Reference Lohse, Schmitz and Versluis2001), and cavitation around a turbine's vanes may induce their severe erosion (Li Reference Li2015). For its application, cavitation enables surface cleaning (Ohl et al. Reference Ohl, Arora, Dijkink, Janve and Lohse2006) as well as non-invasive drug delivery (Coussios & Roy Reference Coussios and Roy2008). Cavitation in practical situations commonly occurs at pre-existing cavitation nuclei within the liquid, which has been studied in a considerable amount of research (Greenspan & Tschiegg Reference Greenspan and Tschiegg1967; Caupin & Herbert Reference Caupin and Herbert2006). To the best knowledge of the authors, Harvey et al. (Reference Harvey, Barnes, McElroy, Whiteley, Pease and Cooper1944) were the first to demonstrate the effect of pre-existing gas cavities on cavitation, and attributed the measured low tensile strength of plain water to gaseous nuclei, a view since shared by many other researchers. For a detailed review concerned with pre-existing gaseous nuclei, the reader should refer to Jones, Evans & Galvin (Reference Jones, Evans and Galvin1999). In general, these gaseous nuclei are stabilized micrometre-sized bubbles located on container walls (Andersen & Mørch Reference Andersen and Mørch2015) or particle surfaces (Arora, Ohl & Mørch Reference Arora, Ohl and Mørch2004; Borkent, Arora & Ohl Reference Borkent, Arora and Ohl2007; Borkent et al. Reference Borkent, Arora, Ohl, De Jong, Versluis, Lohse, Mørch, Klaseboer and Khoo2008; Zhang et al. Reference Zhang, Belova, Wang, Dong and Möhwald2014), or freely suspended within the liquid (Yount, Gillary & Hoffman Reference Yount, Gillary and Hoffman1984). However, under the condition that the liquid is purified and degassed as much as possible and away from any walls, where the existence of micrometre-sized gaseous nuclei is greatly suppressed, like in the experiments by Herbert, Balibar & Caupin (Reference Herbert, Balibar and Caupin2006), the obtained tensile strengths (less than 30 MPa) are still far away from about 140 MPa, which is expected theoretically and reached in the inclusion experiments by Zheng et al. (Reference Zheng, Durben, Wolf and Angell1991) and Azouzi et al. (Reference Azouzi, Ramboz, Lenain and Caupin2012). The reason for such a discrepancy still remains unclear.
To explain this discrepancy, this study concentrates on the nanoscale nuclei providing preferential sites for cavitation, like nanobubbles and nanoscale particles, since dissolved gases as well as nanoscale contaminants are virtually impossible to eliminate completely from any substantial liquid volume. Mørch (Reference Mørch2018) discussed the possibility of nanoscale gas bubbles and/or droplets serving as cavitation nuclei, which can be stabilized by the surface tension forces of the bounding water molecules, and can be in gas diffusion balance with the surrounding liquid. The stabilization of a nanobubble on a heterogeneous substrate is studied by molecular dynamics simulations (Zhou Reference Zhou2020). Li, Gu & Chen (Reference Li, Gu and Chen2018) simulated cavitation from particles of 0.5 to 2 nm, indicating that both hydrophobic and hydrophilic nanoparticles can promote cavitation, and cavitation with hydrophobic nanoparticles is promoted to a greater extent than that with hydrophilic nanoparticles. However, the evaluation of the influence of such nanoscale nuclei on cavitation is still limited. It is hard to observe cavitation nuclei at the nanoscale, and thus it is challenging to quantify their effects on cavitation through experimental research. In the present study, theoretical analysis (by extending the classical nucleation theory) and numerical simulation (by the molecular dynamics method) are considered. Classical nucleation theory (CNT) is a theoretical model widely used to study homogeneous cavitation, and its reliability in predicting homogeneous cavitation has been verified by experiments (Azouzi et al. Reference Azouzi, Ramboz, Lenain and Caupin2012) and numerical simulations (Menzl et al. Reference Menzl, Gonzalez, Geiger, Caupin, Abascal, Valeriani and Dellago2016). It is the basis of modern nucleation theory such as the density functional method (Oxtoby & Evans Reference Oxtoby and Evans1988) and kinetic nucleation theory (Shen & Debenedetti Reference Shen and Debenedetti2003). The concepts and practical application method of CNT have been developed to cover heterogeneous cavitation, such as cavitation at a smooth rigid surface (Blander & Katz Reference Blander and Katz1975). The present study further models the cavitation arising from nanoscale nuclei, allowing evaluation of their effects on cavitation.
Molecular dynamics (MD) simulation could capture the microscopic dynamics of the cavitation process. Thus, it is an important supplement and verification to the theoretical analysis. It has been utilized successfully to simulate homogeneous cavitation in water (Abascal et al. Reference Abascal, Gonzalez, Aragones and Valeriani2013) and liquid copper (Cai, Wu & Luo Reference Cai, Wu and Luo2014) and heterogeneous cavitation (Okumura & Itoh Reference Okumura and Itoh2014; Li et al. Reference Li, Gu and Chen2018). The present study performs non-equilibrium MD simulations of cavitation in liquids (including water and liquid copper) suspended with nanoscale nuclei, and the effects of nuclei size and liquid properties are discussed in detail. The aim is to verify whether the present model could be used for different liquids through simulating two kinds of liquids, and the selection of liquid copper is following the previous simulation (Cai et al. Reference Cai, Wu and Luo2014), which gives a guideline for simulation configuration and references to the liquid properties. For the simulations, ultrasonic waves are used to stimulate the cavitation, referring to prior research (Okumura & Itoh Reference Okumura and Itoh2014).
This paper is organized as follows. Section 2 describes in detail the physical model, and then gives a brief mathematical derivation; the detailed derivation is provided in appendix A. Section 3 describes the simulation methods employed to stimulate cavitation and demonstrates the estimation of the cavitation pressure from the simulation results. The finite-size effect verification conducted to confirm the reliability of the MD simulations is provided in appendix B. The comparison between simulations containing an actual nanoparticle and an equivalent void is provided in appendix C. Section 4 presents and discusses the results obtained in the MD simulations, and the effects of the nanoscale nuclei size and liquid properties are analysed. Section 5 summarizes the conclusions.
2. Cavitation at nanoscale nuclei: physical and mathematical models
2.1. Physical model
There has already been a wide array of existing models about cavitation. The so-called classical model, dating back to Volmer & Weber (Reference Volmer and Weber1926) and many other researchers, describes cavitation in a homogeneous solution or that catalysed by the presence of another material (Jones et al. Reference Jones, Evans and Galvin1999), from the thermodynamic point of view. Harvey et al. (Reference Harvey, Barnes, McElroy, Whiteley, Pease and Cooper1944) regarded the pre-existing gas cavities adhering to surfaces as potential cavitation nuclei, whose stabilities are determined by the surface geometry and the gas–surface contact angles, etc. The circumstances of skin-stabilized micrometre-sized gas bubbles freely suspended in liquid (Yount Reference Yount1979) or attached on solid walls (Andersen & Mørch Reference Andersen and Mørch2015) are also representative as gaseous nuclei. Although the aforementioned models have great significance for understanding cavitation in most scenarios, they still could not explain the discrepancies of the tensile strength of highly purified water (purified and degassed as much as possible) between the experimental measurements and theoretical predictions. It is just the speculation that such discrepancies could be ascribed to nanoscale nuclei suspended in the highly purified water, which are virtually impossible to eliminate completely, that motivates the present research.
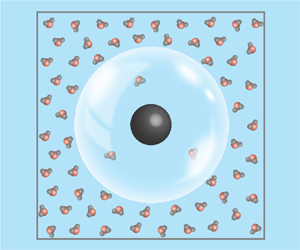
To study cavitation arising from nanoscale nuclei, this subsection proposes the present physical model, and a schematic diagram is shown in figure 1. Nanoscale nuclei in highly purified water may be suspended nanoscale gas bubbles and/or droplets as proposed by Mørch (Reference Mørch2018), which could be stabilized by a ‘densely populated shell of liquefied gas molecules’. On the other hand, they could also be suspended nanoparticles. The numerical simulations by Li et al. (Reference Li, Gu and Chen2018) suggested that both hydrophilic and hydrophobic nanoparticles promote cavitation in pure water, due to their destabilizing the hydrogen bond network.
Schematic diagram of the study subject: (a) same-sized nanoscale nuclei (spherical voids) evenly suspended in liquid; (b) close-up of the study subject, which is cut out from the liquid.

Some issues have been addressed in the way to model cavitation at nanoscale nuclei. Firstly, the stability mechanism of bulk nanobubbles, as well as their internal and interfacial properties (like the  $\zeta$ potential (Cho et al. Reference Cho, Kim, Chun and Kim2005)) are not clearly understood yet (Alheshibri et al. Reference Alheshibri, Qian, Jehannin and Craig2016). This will lead to difficulty in precisely quantifying the effects of nanobubbles on cavitation. Secondly, the irregular shapes and different hydrophobicity of nanoparticles can complicate the objects of study. Finally, gas cavities may also adhere to nanoparticles as long as the stability condition is satisfied (Sun et al. Reference Sun, Xie, Peng, Xia and Sha2016), and thus their effects on cavitation inception become highly coupled. The aforementioned will bring a difficulty of quantitative analysis. To simplify the analysis and avoid a cumbersome model, some simplifications should be considered.
On the one hand, the aforementioned nuclei could be represented by equivalent voids, in terms of their effects on promoting cavitation. The equivalent size of the void is unnecessarily the same as that of the original nucleus, and it may change accordingly to be representative when different kinds of effects are considered. On the other hand, the water in the study exists with a high degree of metastability (the tensile stress is more than 30 MPa). Under such conditions, thermal fluctuations may dominate the inception of cavitation rather than other effects. Thus, the simplification of the nanoscale nuclei taken as equivalent voids may be feasible to some extent.
The present physical model is then derived based on the equivalent voids. For simplicity, it is assumed that these voids are the same size (with an equivalent radius  $r_0$) and evenly distributed in the pure liquid, so attention can be focused on one cube of liquid with volume
 $V$ containing only one single void, which simplifies the study subject and corresponding derivation. Since the liquid is highly purified, it is reasonable to assume that the volume of the liquid cube is much larger than that of the nanoscale void. To exclude the effects of the container walls, this model assumes that the liquid is far away from the wall. Thus in the present model, the nanoscale spherical void at the centre is the only preferential site for cavitation.
Under these conditions, when the liquid moves from liquid–vapour equilibrium into a metastable state (the liquid pressure  $P_{{l}}$ is lower than its saturated vapour pressure
 $P^{{e}}$) and reaches a particular degree of metastability, cavitation will arise at the nanoscale nuclei (spherical voids) due to the system's thermal fluctuations. In the next subsection, we will derive the mathematical model that predicts the variations in the cavitation pressure with the equivalent size of nuclei and liquid properties.
2.2. Mathematical model
In this subsection, we briefly derive the mathematical model that describes the cavitation occurring at the nanoscale voids. A detailed derivation is provided in appendix A. The derivation could be regarded as a development of CNT. The so-called CNT dates back to the work of Volmer & Weber (Reference Volmer and Weber1926), Farkas (Reference Farkas1927), Zeldovich (Reference Zeldovich1943) and others, and was originally for droplet condensation from supercooled vapours. It is widely used to analyse homogeneous cavitation, from a thermodynamic point of view. For a detailed description of CNT, the reader could refer to the monograph by Debenedetti (Reference Debenedetti1996), and for a concise derivation to the monograph by Brennen (Reference Brennen1995). CNT has been developed to cover heterogeneous cavitation, such as cavitation at a smooth rigid surface (see Blander & Katz Reference Blander and Katz1975). Following their methodology, we further study the cavitation arising at nanoscale voids, and the derivation is provided below.
In the context of CNT, cavitation is an activated process: a free energy barrier must be overcome to form a critical nucleus, beyond which the bubble grows spontaneously. In this derivation, a superscript asterisk denotes the properties related to a critical nucleus; for instance,  $W^{*}$ denotes the energy barrier that must be overcome for cavitation to occur. Exceeding the energy barrier (the formation of the critical nucleus) is ascribed to thermal fluctuations in the metastable liquid. Its rate per unit volume and time is defined as the rate of cavitation
 $J$, which could be expressed as
 \begin{equation} J = {J_0}\exp \left( - \frac{{{W^{*}}}}{{kT}}\right),\end{equation}
where  $k$ is the Boltzmann constant,
 $T$ is the liquid temperature and
 $J_0$ is a prefactor whose expression varies (Brennen Reference Brennen1995). The exact value of energy barrier
 $W^{*}$ is much more important than that of
 $J_0$ due to the exponential. In this model,
 ${J_0} = 4\sqrt {2\sigma /{\rm \pi} m}\, r_0^{2}N_0^{2/3}/V$ (its derivation is provided in appendix A), where
 $\sigma$ is the surface tension of the liquid–gas interface,
 $m$ is the molecular mass,
 $r_0$ is the radius of the void,
 $N_0$ is the molecular number density of the liquid and
 $V$ is the volume of the object in figure 1. As Brennen (Reference Brennen1995, p. 23) describes:
surface tension is the macroscopic manifestation of the intermolecular forces that tends to hold molecules together and prevent the formation of large holes  $\ldots$ it is assumed that its concept can be extended down to bubbles or vacancies a few intermolecular distances in size. Such an approximation is surprisingly accurate.
To calculate  $W^{*}$, the work
 $W$ required to form a bubble with radius
 $r$ from a nanoscale void with radius
 $r_0$ could be expressed as
 \begin{equation} W = 4{\rm \pi} ({r^{2}} - r_0^{2})\sigma + \frac{{4{\rm \pi} }}{3}({r^{3}} - r_0^{3})({P_{{l}}} - {P_{{v}}}), \end{equation}
where  $P_{{l}}$ and
 $P_{{v}}$ are the liquid and vapour pressure, respectively. Given
 $P_{{l}}$,
 $P_{{v}}$ can be approximated using the Poynting correction
 ${P_{{v}}} - {P_{{l}}} = \delta ({P^{{e}}} - {P_{{l}}})$, where
 $\delta = 1 - {P^{{e}}}/{N_0}kT$ and is called the Poynting correction factor (Blander & Katz Reference Blander and Katz1975). The first term in (2.2) is the energy cost associated with the increase in the liquid–gas interface area, which is denoted by
 $W_{{S}}$. The second term is the energy gained due to the increase in the bubble volume, which is denoted by
 $W_{{V}}$. Figure 2 shows the contributions of the two terms to
 $W$. Because the first term is quadratic and the second term is cubic, the energy barrier increases at the early stage and then decreases. When the bubble grows to a critical nucleus,
 $W$ reaches its maximum.
Energy barrier to overcome for the formation of a bubble with radius  $r$ from a nanoscale void with radius
 $r_0$. The red line is the energy barrier, and the black lines are the two terms that constitute it.

The critical nucleus size can be derived through  ${\textrm {d}}W/{\textrm {d}}r = 0$ and is expressed as
 \begin{equation} {r^{*}} = \frac{{2\sigma }}{{({P_{{v}}} - {P_{{l}}})}} = \frac{{2\sigma }}{{\delta ({P^{{e}}} - {P_{{l}}})}}, \end{equation}
which is identical to Laplace's law (Brennen Reference Brennen1995). This demonstrates that the critical nucleus is in an unstable mechanical equilibrium: bubbles smaller than the critical nucleus shrink spontaneously, while those larger than the critical nucleus grow spontaneously. As is the case in CNT,  $r^{*}$ is dependent on the surface tension and the degree of metastability
 $(P_{{v}} - P_{{l}})$. If the surface tension and the degree of metastability are kept constant, then
 $r^{*}$ will not change, no matter whether a void (smaller than
 $r^{*}$) is included or not. The effect of the added void is just to reduce the energy barrier for the thermal fluctuations to overcome as a critical nucleus is formed, and cavitation is then promoted. Under this condition, the cavitation inception process could be briefly described as follows: the thermal fluctuations cause the void to grow from
 $r_0$ to
 $r^{*}$, and then the bubble grows spontaneously. Substituting the expression of
 $r^{*}$ in (2.2), the energy barrier for a critical nucleus is derived as
 \begin{equation} {W^{*}} = \frac{{16{\rm \pi} {\sigma ^{3}}}}{{3{\delta ^{2}}{{({P^{{e}}} - {P_{{l}}})}^{2}}}}\left( {1 - \left( {3 - \frac{{{r_0}\delta ({P^{{e}}} - {P_{{l}}})}}{\sigma }} \right){{\left( {\frac{{{r_0}\delta ({P^{{e}}} - {P_{{l}}})}}{{2\sigma }}} \right)}^{2}}} \right). \end{equation}
Regarding the rigorous derivation of (2.4), please refer to appendix A. Equations (2.3) and (2.4) demonstrate that, as the liquid pressure  $P_{{l}}$ decreases (the degree of metastability of the liquid increases), the size of the critical nucleus and the energy barrier decrease and will eventually become low enough to be overcome by thermal fluctuations. Combining (2.1) and (2.4), the formula for predicting the rate of cavitation arising at nanoscale voids is expressed as
 \begin{equation} J = J_0\exp \left[ { - \frac{{16{\rm \pi} }}{{3kT}}\frac{{{\sigma ^{3}}}}{{{\delta ^{2}}{{({P^{{e}}} - {P_{{l}}})}^{2}}}}\left( {1 - \left( {3 - \frac{{{r_0}\delta ({P^{{e}}} - {P_{{l}}})}}{\sigma }} \right){{\left( {\frac{{{r_0}\delta ({P^{{e}}} - {P_{{l}}})}}{{2\sigma }}} \right)}^{2}}} \right)} \right],\end{equation}
which can be utilized to predict the cavitation pressure in experiments. Assuming that the liquid pressure is sustained at  $P_{{l}}$, the time of application of the tensile stress is
 ${\rm \Delta} t$, and the probability
 $\varSigma$ of cavitation is
 \begin{equation} \varSigma = 1 - \exp ( - JV{\rm \Delta} t).\end{equation}
In this study, we use the definition of cavitation pressure  $P_{{cav}}$ (the magnitude of
 $P_{{v}}-P_{{cav}}$ is the tensile strength) following Caupin et al. (Reference Caupin, Arvengas, Davitt, Azouzi Mel, Shmulovich, Ramboz, Sessoms and Stroock2012): the cavitation pressure
 $P_{{cav}}$ is defined as the liquid pressure
 $P_{{l}}$ at which
 $\varSigma =1/2$. Then combining (2.5) and (2.6), the only unknown quantity is the cavitation pressure, which can be solved through the algebraic equation.
A demonstration follows utilizing the present model to predict the cavitation pressure in highly purified water suspended with nanoscale nuclei (represented by voids). Referring to Herbert et al. (Reference Herbert, Balibar and Caupin2006), we calculate the cavitation pressure with the parameters  $V = 2.1\times 10^{-4}$ mm
 $^{3}$ and
 ${\rm \Delta} t=4.5\times 10^{-8}~\textrm {s}$ using the present derived model as well as CNT. The results are shown in figure 3. The formula for predicting the homogeneous cavitation rate is taken from the review of Blander & Katz (Reference Blander and Katz1975) and expressed as
 \begin{equation} J = {N_0}\sqrt {\frac{{2\sigma }}{{{\rm \pi} m}}} \exp \left[ { - \frac{{16{\rm \pi} }}{{3kT}}\frac{{{\sigma ^{3}}}}{{{\delta ^{2}}{{({P^{{e}}} - {P_{{l}}})}^{2}}}}} \right].\end{equation}
Comparison of the water cavitation pressure predicted using the present model and CNT. Here  $V = 2.1\times 10^{-4}$ mm
 $^{3}$ and
 ${\rm \Delta} t=4.5\times 10^{-8}~\textrm {s}$. (a) Effect of the nanoscale void size on the cavitation pressure. (b) Effect of the water temperature on the cavitation pressure.

Figure 3(a) shows that a nanoscale nucleus with an equivalent radius around 4 nm reduces the tensile strength to 30 MPa, which is commonly obtained in previous experiments in highly purified water. This indicates that the present model could give a possible explanation for the discrepancy between the experimental results of highly purified water (Herbert et al. Reference Herbert, Balibar and Caupin2006) and theoretical predictions as well as that reached in the inclusion experiments by Zheng et al. (Reference Zheng, Durben, Wolf and Angell1991). Figure 3(a) indicates that even nanoscale nuclei with an equivalent radius of 1 nm decrease the tensile strength drastically and larger nuclei decrease it more; and the decrease decelerates as the equivalent size increases. This can be explained using (2.5): under certain conditions,  $r_0^{3}({P^{{e}}} - {P_{{{cav}}}})$ is approximately equal to a constant, that is,
 ${P_{{{cav}}}} \approx - ( {C/r_0^{3} + {P^{{e}}}} )$, where
 $C$ is a constant. Thus,
 $\partial {P_{{{cav}}}}/\partial {r_0} \propto 1/r_0^{4}$, so when
 $r_0$ increases, the decreasing tendency of the tensile strength is mild. Figure 3(b) shows that when the equivalent size is fixed, the promotion effect of nuclei on cavitation is reduced at high temperatures and eliminated as the temperature approaches a critical point.
To verify the present model, MD simulations of cavitation at nanoscale nuclei are performed in this study, which could capture the microscopic dynamics of the cavitation process. The following section presents the detailed simulation methods.
3. Molecular dynamics simulation of cavitation at nanoscale nuclei
3.1. The MD method
To verify the mathematical model proposed in § 2.2, non-equilibrium MD simulations on cavitation at nanoscale nuclei are conducted with an imposed sinusoidal pressure. This section introduces the simulation method. The simulations are carried out using the LAMMPS open-source code (Plimpton Reference Plimpton1995).
Following the physical model in § 2.1, the object of the simulation is an  $L$-length cube filled with water or liquid copper, with a spherical nanoscale nucleus embedded at the centre. Periodic boundary conditions are employed and the simulation time step is set as 1 fs. Figure 4 shows a schematic diagram of the simulation object. The gas–liquid interface is determined using six detectors in different directions (Fu et al. Reference Fu, Comer, Cai and Chipot2015), which start from the centre of the bubble and detect the nearest molecule in that direction, as illustrated in figure 4(c). The distances are denoted as
 $r_1$ to
 $r_6$, and their average value
 $\bar {r}$ is the bubble radius.
Schematic diagram of the object of simulation. (a) Diagram of the cubic simulation configuration and close-up of the embedded nanoscale void. (b) Diagram of the liquid pressure temporal variation. (c) Illustration of the method used to calculate the mean bubble radius.

The nanoscale nucleus with a diameter  $2r_0$ is created by a spherical force field expressed as
 \begin{equation} F(r) = \left\{ {\begin{array}{@{}ll} { - K{{(r - {r_0})}^{2}}}, & {r < {r_0}}, \\ 0, & {r \ge {r_0}}, \end{array}} \right. \end{equation}
where  $K$ is the force constant. The force field repels atoms at a distance smaller than
 $r_0$ from the centre of a sphere, creating a spherical void which acts as a nanoscale nucleus. The approach of imposing force field is an equivalent method, not like that placing a realistic nanoscale nucleus in physics. Different kinds of nuclei could be built by potential models describing different interatomic interactions, while the complexity of the nuclei makes it hard to realize. Therefore, the present simulations utilize a void created by the force field to represent the nucleus, in terms of its effects on promoting cavitation. The void here is similar to that proposed in the theoretical model, and its size may change accordingly when different effects are included, which is not always the same as that of the original nucleus. To demonstrate the reliability of representing the nucleus with a void created by the force field, we also conduct simulations considering an actual nucleus as comparison; please refer to appendix C.
In the cavitation process, the liquid–gas surface tension  $\sigma$ is significant. The TIP4P/2005 potential model (Abascal & Vega Reference Abascal and Vega2005) is used in water simulations due to its ability to mimic water's properties, including surface tension (Vega & de Miguel Reference Vega and de Miguel2007; Alejandre & Chapela Reference Alejandre and Chapela2010). The embedded atom method (EAM) potential model (Mishin et al. Reference Mishin, Mehl, Papaconstantopoulos, Voter and Kress2001) is used in simulations of homogeneous cavitation in liquid copper (Cai et al. Reference Cai, Wu and Luo2014, Reference Cai, Huang, Wu, Zhu, Goddard and Luo2016) and is utilized herein. The EAM potential files are distributed online, and the TIP4P/2005 model is also accomplished in LAMMPS. The interatomic interactions of water include the Lennard-Jones (LJ) potential and the Coulombic interaction. The LJ potential is expressed as
 \begin{equation} \left. {V_{{{LJ}}}}(R) = {{4}}{\varepsilon _{{I}}}\left[ {{{\left( {\frac{{{\sigma _{{I}}}}}{R}} \right)}^{12}} - {{\left( {\frac{{{\sigma _{{I}}}}}{R}} \right)}^{6}}} \right] \right|_{R \le {R_C}},\end{equation}
where  ${V_{{{LJ}}}}(R)$ is the LJ potential energy between two non-bonding atoms with a separation
 $R$,
 $R_C$ is the cutoff radius,
 ${\varepsilon _{{I}}}$ is the depth of the potential well,
 ${\sigma _{{I}}}$ is the interatomic distance at which the potential energy is zero, and the subscript
 $I$ represents the atom type. The LJ parameters (
 ${\varepsilon _{{I}}}$ and
 ${\sigma _{{I}}}$) for different types of atoms are obtained using the Lorentz–Berthelot combination rule. In simulations of water, the cutoff radius of the LJ potential is set as 9
 , and long-range calculations (including the LJ
 $1/R^{6}$ dispersion term and the Coulombic interaction) are calculated using the particle–particle particle–mesh (PPPM) method (Eastwood, Hockney & Lawrence Reference Eastwood, Hockney and Lawrence1980).
To construct the object of simulation for the non-equilibrium MD simulation, Packmol (Martinez et al. Reference Martinez, Andrade, Birgin and Martinez2009) is first used to add liquid molecules/atoms randomly in the cube. The cube in water simulations contains approximately 1.56 million atoms, and in liquid copper simulations it contains approximately 4 million atoms. To relax the system to equilibration, the constant volume–temperature ( $NVT$) ensemble MD simulation is performed for 10 ps, and then the constant pressure–temperature (
 $NPT$) ensemble MD simulation is conducted for 0.5 ns. The equilibrium configuration is then employed for the following non-equilibrium MD simulation to simulate cavitation. In the simulation, temperature is controlled by the use of a Nosé–Hoover thermostat and pressure is controlled via the Andersen barostat (Okumura & Itoh Reference Okumura and Itoh2014). What should be noted is that it is impossible to simulate the cases in practical experiments because the computational cost of MD simulation is very expensive. Taking the simulation case of water as an example, one case simulating 0.1 ns needs around 14 h on 120 cores of the supercomputer.
As discussed in § 2.2, as the liquid pressure  $P_{{l}}$ decreases, the energy barrier becomes low enough to be overcome by thermal fluctuations. Thus, by imposing high-intensity sinusoidal pressure (ultrasonic waves), cavitation will occur if the liquid pressure becomes lower than the cavitation pressure during the pressure evolution. Using this method, we fix the period of sinusoidal pressure to constrain the tension duration, then progressively increase the pressure amplitude to trigger cavitation. The cavitation pressure can then be easily estimated, which is described in detail in the next subsection. The sinusoidal liquid pressure is
 \begin{equation} {P_{{l}}}(t) = {P_0} + A\sin \left(\frac{{2{\rm \pi} }}{\tau }t\right), \end{equation}
where  $A$ is the ultrasonic wave pressure amplitude, the first term
 $P_0$ is the original pressure without imposing the ultrasonic wave and is
 $0.5A$, and the second term is the superimposed ultrasonic wave pressure. Figure 4(b) shows a schematic diagram illustrating the liquid pressure temporal variation. When
 $P_0=0.5A$, the liquid minimum pressure is
 $-0.5A$, and the duration of liquid under tension is
 $\tau ' = \tfrac {1}{3}\tau$. Thus, the liquid minimum pressure can be decreased by gradually increasing
 $A$ while its duration remains constant due to the constant ultrasonic period.
This section describes the ultrasonic waves in the MD simulation. The following conditions apply to all of the simulations in the present study. The wave speed  $V_{{s}}$ in the liquid has an order of magnitude of
 $10^{3}$ m s
 $^{-1}$. The ultrasonic wave period
 $\tau$ has an order of magnitude of 1 ns. According to the relationship between the wavelength and period
 $\lambda =\tau V_{{s}}$, the wavelength
 $\lambda$ has an order of magnitude of 1
 $\mathrm {\mu }$m. The cubic side length
 $L$ has an order of magnitude of 10 nm (
 $L=25$ nm in our water simulations and
 $L=38$ nm in our liquid copper simulations, which was determined after the verification of the finite-size effect, which is provided in appendix B), which is far less than
 $\lambda$, so the liquid pressure
 $P_{{l}}$ in the cube is regarded as uniform, and is controlled with an Andersen barostat in the MD simulation.
3.2. Cavitation inception and cavitation pressure
In the MD simulations of the present study, the ultrasonic amplitude is increased gradually to investigate the cavitation inception process. First, a series of water simulations are analysed; see figure 5. The time  $t=0$ is set when the liquid is under tension (
 $P_{{l}}-P_{{v}}<0$). Figure 5(a) presents the temporal variation of the liquid pressure and bubble radius when
 $r_0=1$ nm,
 $T=298$ K,
 $\tau =0.2$ ns and
 $A=200$ MPa. The bubble radius fluctuates, and the fluctuation is at its maximum when the liquid pressure is minimal at
 $t=0.033$ ns. As discussed in § 2.2, a bubble larger than the critical nucleus grows spontaneously, but here no spontaneous growth is observed, not even if the liquid pressure reaches its minimum. Thus, the bubble remains smaller than the critical nucleus and no cavitation inception occurs.
Bubble radius–time evolution in a series of water simulations. The ultrasonic period  $\tau =0.2\ \textrm {~ns}$, and the other simulation parameters are listed. (a) The raw data and data filtered via the LOESS smoothing method are presented. (b) Only the filtered data are presented for different pressure amplitudes.

Figure 5(b) can be analysed in a similar manner. The simulation conditions are the same as previously described except that  $A=220$, 240 and 260 MPa, respectively. The maximum bubble radius when
 $A=260$ MPa is far larger than the others, which is ascribed to the bubble's spontaneous growth after it crosses the cavitation energy barrier. The aforementioned is a qualitative analysis of cavitation inception, and we also quantitatively analyse it as follows.
The changes in the maximum bubble radius can be quantified by defining  $\delta _A$ as
 ${\delta _A} = (({\bar r _{\max }} - {r_0})/{r_0})|_A$. As previously discussed,
 $\delta _A$ stems from the thermal fluctuation when the energy barrier is not overcome; but, if the fluctuation exceeds the energy barrier, the bubble will grow spontaneously and
 $\delta _A$ will be much larger. Figure 5(b) is an example when
 $\delta _{200}=0.23$,
 $\delta _{220}=0.33$,
 $\delta _{240}=0.4$ and
 $\delta _{260}=0.88$. The first three values increase consistently due to the steady increase in the ultrasonic amplitude (which causes an increase in the thermal fluctuation), while the last value surges, which is ascribed to the bubble's spontaneous growth after cavitation inception. Thus, under these simulation conditions, when the amplitude of the ultrasonic pressure increases to 260 MPa, cavitation inception is triggered. Since the minimum liquid pressure equals
 $-0.5A$, in the aforementioned case, the cavitation pressure is between
 $-0.5\times 240=-120$ MPa and
 $-0.5\times 260=-130$ MPa. As an approximation, we use the average of the two values as the cavitation pressure under the corresponding conditions, that is,
 $P_{{cav}}=-125$ MPa. This kind of approximation is acceptable. Firstly, cavitation pressure predicted by CNT as well as the present model are generally of the order of
 $-100$ MPa, and thus the incremental step of the amplitude chosen in the water simulations has an appropriate accuracy (the error is less than 5 MPa). To distinguish the cavitation pressure within an acceptable range, there is no necessity to adopt an incremental step such as of the order of 1 MPa. Secondly, the MD simulations are conducted to verify the mathematical model, while its computational cost is expensive. Thus, choosing a moderate incremental step of the amplitude is also a trade-off for expense.
We also present a case with a smaller incremental step, 10 MPa, of the ultrasonic pressure amplitude, shown in figure 6. Similarly, when  $A=80$ MPa, the maximum bubble radius is far larger than those under the three other conditions, which is ascribed to the inception of cavitation. The simulation results (including those in the following sections) show that the spontaneous growth of the bubble is more pronounced at high temperature, which may be ascribed to the low surface tension and liquid density (resisting spontaneous growth of the bubble) in corresponding conditions. In other words, a lower surface tension and liquid density (when the liquid temperature is raised) generally corresponds to a more pronounced cavitation inception.
Bubble radius–time evolution in a series of water simulations. The ultrasonic period  $\tau =0.2\ \textrm {~ns}$, and the other simulation parameters are listed.

4. Effects of nanoscale nuclei on cavitation
4.1. Cavitation at nanoscale nuclei in water
In the previous subsection, we analysed the cavitation inception process and estimated the cavitation pressure from the MD results. In this subsection, we present MD water simulations with different equivalent sizes of nanoscale nuclei within a range of liquid temperatures, and estimate the dependence of the cavitation pressures on these two parameters. The equivalent radius ranges from 1 nm to 3 nm, and the water temperature ranges from 298 K to 500 K. The simulation results of bubble radius are shown in figure 7. In each set of simulations, the ultrasonic amplitude is gradually increased with an incremental step of 20 MPa until cavitation is triggered. When the amplitude is low, the bubble radius fluctuates randomly, but no spontaneous growth occurs. When the pressure amplitude is increased beyond a certain limit, the maximum bubble radius is far larger than before, which is ascribed to cavitation inception. From the qualitative and quantitative analysis exemplified in § 3.2, it is easy to determine the tensile stress at which cavitation first occurs with the increase of the pressure amplitude, and corresponding cavitation pressures are shown in figure 8.
Bubble radius–time evolution in sets of water simulations under ultrasonic waves with different amplitudes;  $\bar {r}$ is smoothed via the LOESS smoothing method. All of the ultrasonic periods are 0.2 ns, and the other simulation parameters are listed.

The cavitation pressure versus the temperature in water when  $V=(25\ \textrm {nm})^{3}$ and
 ${\rm \Delta} t=0.01$ ns. The blue crosses are CNT predictions, the filled black dots and triangles show the estimated cavitation pressure from the MD results, and the open red circles and triangles are predictions of the theoretical model derived in § 2.2.

Figure 8 shows that the predictions of the cavitation pressure  $P_{{cav}}$ by the mathematical model proposed in § 2.2 are consistent with the MD prediction results for different equivalent sizes of nuclei and liquid temperatures. To highlight the effect of the nanoscale nuclei, the numerical results are also compared to the CNT predictions (without nuclei).
The present mathematical model makes a good prediction on the cavitation pressure under the given study condition. The tensile strength of the liquid ( $P_{{v}}-P_{{cav}}$) drops strongly if the equivalent radius of the nucleus is increased from 1 nm to 3 nm, and it converges towards zero if increased further, as shown in figure 3(a). Likewise, the tensile strength is reduced if the liquid temperature is increased from 298 K to 500 K. Thus, the results present that nanoscale nuclei can promote cavitation. The discrepancy between the CNT predictions (without nuclei in the liquid) and the present mathematical model suggests that nanoscale nuclei, even with an equivalent radius of the order of 1 nm, are responsible for the reduced tensile strength of ultra-pure water observed at room temperature. What should be noted is that the prediction results by CNT in figure 7 are about twice those in figure 3, which is ascribed to the difference of
 $V{\rm \Delta} t$ used in the respective calculations. In the context of CNT, the tensile strength of a liquid is dependent not only on the waiting time
 ${\rm \Delta} t$, i.e. the duration of the liquid tension, but also on the volume of liquid
 $V$ subjected to the tension (Brennen Reference Brennen1995). From (2.6) and (2.7) one can get the relation between
 $V{\rm \Delta} t$ and
 $P_{{cav}}$, and normally
 $V{\rm \Delta} t$ does not affect
 $P_{{cav}}$ too much, because it is in the logarithm term. As shown by Zheng et al. (Reference Zheng, Durben, Wolf and Angell1991), the predicted tensile strength varies by less than 5 % for
 ${\rm \Delta} t$ ranging between
 $10^{-3}$ s and
 $10^{3}$ s, while
 $V$ is kept constant. However, the
 $V{\rm \Delta} t$ in figure 7 is 20 orders of magnitude smaller than that in figure 3, which causes the difference shown in figures 3 and 7. The large gap in
 $V{\rm \Delta} t$ between practical experiments and our simulations is due to the expensive computational cost of MD simulations, which has been noted previously.
4.2. Effects of liquid properties
The effects of nanoscale nuclei on cavitation by ultrasonic waves in water was investigated in § 4.1. To generalize the conclusions, a similar study with liquid copper is presented in this subsection.
In the simulations of liquid copper, the equivalent radius also ranges from 1 nm to 3 nm, and the temperature ranges from 1400 K to 2000 K. The incremental step of the ultrasonic amplitude is 50 MPa here, considering that the surface tension and density of liquid copper are far larger than those of water. Results for liquid copper obtained by MD simulation are shown in figure 9. In figure 10 cavitation pressures estimated from these results (exemplified for water in § 3.2) and those obtained with the present mathematical model are compared with the predictions by CNT.
Bubble radius–time evolution in sets of liquid copper simulations under ultrasonic waves with different amplitudes;  $\bar {r}$ is smoothed via the LOESS smoothing method. All of the ultrasonic wave periods are 0.2 ns, and the other simulation parameters are listed.

The cavitation pressure versus the temperature in liquid copper when  $V=(38\ \textrm {nm})^{3}$ and
 ${\rm \Delta} t=0.01$ ns. The blue crosses are the CNT predictions, the filled black dots and triangles show the estimated cavitation pressure from the MD results, and the open red circles and triangles are predictions of the present derived model.

The cavitation pressures of liquid copper obtained by MD simulations agree with those by the present mathematical model. The results show that the present mathematical model can be used to analyse the cavitation at nanoscale nuclei in different liquids. Similar to cavitation in water, cavitation in liquid copper is facilitated by the nuclei: the more, the larger the equivalent size of nuclei. The difference between the predictions of the CNT and the present model becomes smaller if the temperature is increased, which is similar to the tendency in the simulations for the water case. In other words, the ability of nanoscale nuclei to reduce tensile strength is also affected by the liquid properties: it is suppressed at high liquid temperature. This could be ascribed to the decrease of the surface tension, since the surface tension is reduced with increasing liquid temperature.
5. Conclusions
To explain the discrepancy between the tensile strength obtained with highly purified liquids used in experiments and that predicted by CNT, this study has conducted theoretical and numerical analyses to clarify the effects of nanoscale nuclei on cavitation in different liquids, taking water and liquid copper as examples.
Firstly, we derive a theoretical model to predict cavitation pressure, describing cavitation at nanoscale nuclei, which is a development of CNT. For simplification, a liquid cube suspended with one equivalent nanoscale void is established, based on the fact that the nuclei can be solid nanoparticles or stabilized nanobubbles contained in highly purified liquids. The size of voids can be changed due to mobility and aggregation, and any other complex properties of the nanoscale nuclei. Then, MD simulations are performed for the cavitation at nanoscale nuclei in water and liquid copper triggered by ultrasonic waves, and the cavitation pressures are obtained from the simulation results and compared with predictions by the present model. The agreement verifies the present model, indicating that the model could provide insight into cavitation at nanoscale nuclei. The simulations of water and liquid copper suggest that the present model has the capacity to be applied to different liquids. Finally, the analyses are performed to study the influences of nuclei sizes and liquid properties. The results show that the tensile strength always decreases as the nuclei size or liquid temperature increases under the study condition. The change rule of cavitation pressure is also affected by the liquid properties such that the ability of nanoscale nuclei to reduce tensile strength is suppressed at high liquid temperature.
Both the derived model and MD simulations function well for describing the cavitation at nanoscale nuclei in a highly purified liquid. The results supply an explanation of the reported difference between experimental values of tensile strength of highly purified water and theoretical ones. Also, they can deepen the understanding of the effects of the smallest cavitation nuclei present in liquids, even if purified and degassed as much as possible.
The properties of bulk nanobubbles remain yet unclear, and therefore some simplifications have been taken in the study. The stability mechanism of bulk nanobubbles should also be studied in the future, and the authors regard that the MD method is a feasible way, since MD simulations can capture well the internal and interfacial properties of bulk nanobubbles.
Funding
The work is partially supported by the National Natural Science Foundation of China under the Grants Nos. 51676111 and NSAF-U1730104, respectively.
Declaration of interests
The authors report no conflict of interest.
Appendix A
To develop CNT to cover the cavitation at nanoscale nuclei (nanoscale impurities such as nanobubbles and nanoparticles), a physical model is proposed in § 2.1 and a mathematical model is derived briefly in § 2.2. A detailed derivation of the mathematical model is presented in this appendix.
According to CNT, cavitation is an activated process: a free energy barrier must be overcome to form a critical nucleus, beyond which the bubble grows spontaneously. For the model proposed in § 2.1, the energy barrier decreases because of the nanoscale nuclei (spherical voids) suspended in the liquid, and thus cavitation occurs preferentially at the voids.
In this derivation, a superscript asterisk is used to denote properties related to a critical nucleus;  $n$ is the number of vapour molecules in a nucleus caused by the void (called the void nucleus), and
 $n^{*}$ denotes the number of vapour molecules in a critical nucleus that arise from the void. Referring to Debenedetti (Reference Debenedetti1996), the rate of formation of critical nuclei per unit liquid volume and time, that is, the rate of cavitation
 $J$, is expressed as
 \begin{equation} J = \frac{1}{{\displaystyle\sum_{n = 2}^{n^{*}} {\frac{1}{{\beta F(n)N(n)}}} }},\end{equation}
where  $\beta$ is the number of vapour molecules leaving the void nucleus into the liquid per unit nucleus surface area and time. According to the kinetic theory of gases, it is expressed as
 $\beta = {P_{{v}}}/\sqrt {2{\rm \pi} mkT}$, in which
 $P_{{v}}$ is the vapour pressure in the nucleus,
 $m$ is the molecular mass,
 $k$ is the Boltzmann constant and
 $T$ is the bulk liquid temperature. Above,
 $F(n)$ is the surface area of the
 $n$-molecule void nucleus; and
 $N(n)$ is the equilibrium concentration of the
 $n$-molecule void nucleus in the liquid. The latter is expressed as
 \begin{equation} N(n) = aN_0^{{2}/{3}}\exp \left( { - \frac{{W(n)}}{{kT}}} \right),\end{equation}
where  $a=4{\rm \pi} r_0^{2}/V$ is the surface area of nuclei per unit liquid volume,
 $N_0$ is the molecular number density of bulk liquid and
 $W(n)$ is the energy barrier that must be overcome to form the
 $n$-molecule void nucleus. In the above,
 $aN_0^{2/3}$ is the number of molecules on the void surface per unit liquid volume. When
 $n=1$,
 $W(1)=0$, so
 $N(1)$ is the number of molecules on the void surface.
Referring to Debenedetti (Reference Debenedetti1996), if we use the radius  $r$ of the void nucleus instead of its vapour molecule number
 $n$ to identify its size, the energy barrier that must be overcome for its formation is expressed as
 \begin{equation} W(r,{P_{{v}}}) = 4{\rm \pi} ({r^{2}} - r_0^{2})\sigma - \frac{{4{\rm \pi} }}{3}({r^{3}} - r_0^{3})({P_{{v}}} - {P_{{l}}}) + \frac{{4{\rm \pi} {P_{{v}}}}}{3}({r^{3}} - r_0^{3})\ln \frac{{{P_{{v}}}}}{{{P_{{v}}^{*}}}}, \end{equation}
where  $r_0$ is the radius of the nanoscale void,
 $\sigma$ is the surface tension of the liquid–gas interface,
 $P_{{l}}$ is the liquid pressure and
 $P_{{v}}^{*}$ is the vapour pressure in the critical nucleus. The first term in (A3) is the energy cost associated with the increase in the liquid–gas interface area, the second term is the energy gained due to the increase in the bubble volume, and the third term is the change in the chemical potential due to the phase transition. When the nucleus increases to a critical nucleus, the third term will equal zero, and
 $P_{{v}}^{*} - {P_{{l}}} = 2\sigma /{r^{*}}$ (Brennen Reference Brennen1995). Thus, the energy barrier of a critical nucleus can be derived from (A3) and is expressed as
 \begin{equation} {W^{*}} = \frac{{4{\rm \pi} \sigma {r^{*2}}}}{3}\left( {1 - \left( {3 - \frac{{2{r_0}}}{{{r^{*}}}}} \right){{\left( {\frac{{{r_0}}}{{{r^{*}}}}} \right)}^{2}}} \right). \end{equation}
For small departures from the critical nucleus, we can expand the energy barrier in (A3) in a Taylor series, which is expressed as
 \begin{gather} W(r,{P_{{v}}}) \approx {W^{*}} + \tfrac{1}{2}{W_{rr}}{(r - r^{{*}})^{2}}{{ + }}\tfrac{1}{2}{W_{{P_{{v}}}{P_{{v}}}}}{({P_{{v}}} - P_v^*)^{2}} + {W_{r{P_{{v}}}}}(r - r^{*})({P_{{v}}}-P_{v}^{*}),\end{gather}
where the first-order derivatives vanish at a critical state, and  $W_{rr}$,
 $W_{P_{{v}} P_{{v}}}$ and
 $W_{rP_{{v}}}$ are the second-order partial derivatives evaluated at stated departures from the critical nucleus. Evaluating these partial derivatives from (A3) and introducing the assumption that
 $P_{{v}}$ equals
 $P_{{v}}^{*}$ (Debenedetti Reference Debenedetti1996), (A5) then becomes
 \begin{equation} W(r) \approx \frac{{4{\rm \pi} \sigma {r^{*2}}}}{3}\left( {1 - \left( {3 - \frac{{2{r_0}}}{{{r^{*}}}}} \right){{\left( {\frac{{{r_0}}}{{{r^{*}}}}} \right)}^{2}}} \right) - 4{\rm \pi} \sigma {(r - r*)^{2}}. \end{equation}
Combining (A1), (A2) and (A6), replacing the summation by an integral, and changing the integration variables from  $n$ to
 $r$ and from
 $r$ to
 $\delta r$ and the integration limits to
 $[-\infty ,+\infty ]$, we can derive the equation predicting the rate of cavitation at nanoscale nuclei
 $J$, expressed as
 \begin{equation} J = J_0 \exp \left[ { - \frac{{16{\rm \pi} }}{{3kT}}\frac{{{\sigma ^{3}}}}{{{{({P_{{v}}}^{*} - {P_{{l}}})}^{2}}}}\left( {1 - \left( {3 - \frac{{{r_0}({P_{{v}}}^{*} - {P_{{l}}})}}{\sigma }} \right){{\left( {\frac{{{r_0}({P_{v}}^{*} - {P_{{l}}})}}{{2\sigma }}} \right)}^{2}}} \right)} \right], \end{equation}
where  ${J_0} = 4\sqrt {2\sigma /{\rm \pi} m} \, r_0^{2}N_0^{2/3}/V$. In (A7)
 $P_{{v}}^{*}$ is unknown, so the Poynting correction (Blander & Katz Reference Blander and Katz1975) is introduced:
 $P_{{v}}-P_{{l}}=\delta (P^{{e}}-P_{{l}})$ and
 $\delta =1-P^{{e}}/N_0 kT$, where
 $\delta$ is the Poynting correction factor. We can then derive the equation describing the relationship between the cavitation rate
 $J$ and the pressure of the liquid
 $P_{{l}}$ as
 \begin{equation} J = J_0 \exp \left[ { - \frac{{16{\rm \pi} }}{{3kT}}\frac{{{\sigma ^{3}}}}{{{\delta ^{2}}{{({P^{{e}}} - {P_{{l}}})}^{2}}}}\left( {1 - \left( {3 - \frac{{{r_0}\delta ({P^{{e}}} - {P_{{l}}})}}{\sigma }} \right){{\left( {\frac{{{r_0}\delta ({P^{{e}}} - {P_{{l}}})}}{{2\sigma }}} \right)}^{2}}} \right)} \right]. \end{equation}
Appendix B
The bubble radius–time evolution in the simulation could be non-reproducible due to the finite size of the simulated systems. To determine that the finite-size effect in simulations could be negligible, we conduct two typical simulations in a larger simulation domain (Fu et al. Reference Fu, Comer, Cai and Chipot2015; Man et al. Reference Man, Li, Derreumaux and Nguyen2018) for water and liquid copper. In both cases, the final results are similar to those of the original simulation. The behaviour of the cavitation bubble is observed and recorded in figures 11 and 12.
Bubble radius and liquid pressure evolution in two water simulations. The ultrasonic pressure amplitude  $A=240$ MPa, the ultrasonic period
 $\tau =0.2$ ns, the nanoparticle radius
 $r_0=3$ nm, and the liquid temperature
 $T=298$ K. (a) The simulation domain
 $L=25$ nm. (b) The simulation domain
 $L=35$ nm.

Bubble radius and liquid pressure evolution in two liquid copper simulations. The ultrasonic pressure amplitude  $A = 2000$ MPa, the ultrasonic period
 $\tau = 0.2$ ns, the nanoparticle radius
 $r_0= 3$ nm, and the system temperature
 $T = 1400$ K. (a) The simulation domain is
 $L = 38$ nm. (b) The simulation domain is
 $L = 53$ nm.

Figure 11 shows the bubble radius and liquid pressure evolution in two water simulation cases. Initially, the bubble radius equals that of the nanoscale void. When the liquid pressure drops below the cavitation pressure, cavitation inception occurs. Moreover, cavitation occurs before the liquid pressure reaches its minimum, suggesting that the cavitation pressure is higher than this minimum pressure. The bubble grows until positive pressure forces it to shrink, and the time when the bubble reaches its maximum size is far later than the time when the pressure reaches its minimum, which agrees with CNT (after cavitation inception, the cavitation bubble will grow spontaneously, so even if the liquid pressure is higher than the cavitation pressure, the bubble will grow after inception). The cavitation bubble grows slowly in the negative pressure cycle but collapses drastically in the positive pressure cycle, indicating the energy-focusing effect of cavitation. (This can be analysed intuitively: when the bubble grows, the pressure difference between the liquid and vapour supports it but the surface tension obstructs it; when the bubble collapses, the pressure difference and surface tension support it. That is why the bubble grows slowly but collapses drastically.) The interface radii  $r_1$ to
 $r_6$ are consistent with each other, suggesting that the bubble grows isotropically under the simulation conditions. The simulation domain shown in figure 11(a) contains approximately 1.56 million atoms, and a larger simulation domain in figure 11(b) contains approximately 4.29 million atoms. Comparing the two simulations, the maximum
 $\bar {r}$ in figure 11(a) is almost identical to that in figure 11(b), and their relative difference is 0.4 %. Thus, the simulation domain
 $L=25$ nm of water embedded with the nanoscale void (with a radius smaller than 3 nm) is large enough to ignore the finite-size effect of the MD simulation.
Figure 12 shows the bubble radius and liquid pressure evolution in two liquid copper simulation cases. The ultrasonic amplitude is far larger than that used in figure 11, which is because the surface tension of liquid copper is far larger than that of water. The simulation domain in figure 12(a) contains approximately 4 million atoms, and the simulation domain in figure 12(b) contains approximately 11 million atoms. The maximum  $\bar {r}$ in figure 12(a) is in line with that in figure 12(b), and their relative difference is 1 %. Thus, the simulation domain
 $L = 38$ nm of the liquid copper is large enough to ignore the finite-size effect. Because there are more atoms in the liquid copper simulation than in the water simulation, the statistical fluctuations will also be lower, as reflected in figure 12 (the bubble radius curves are smoother than in figure 11).
The simulation domain  $L = 25$ nm of the water and
 $L = 38$ nm of the liquid copper are large enough to ignore the finite-size effect and are adopted in our MD simulations. Comparing the simulation scales between water and liquid copper, since the water and liquid copper potentials vary, they also have different simulation scales to diminish the finite-size effect.
Appendix C
To verify the reliability of representing actual nuclei with voids created by the force field in the MD simulations, two sets of simulations considering an actual nucleus are conducted, shown in figures 13 and 14.
Schematic diagram of the object of simulation. The red and grey points represent water molecules, and the black points represent hydrophobic LJ particles composing a spherical nucleus embedded at the centre of the domain.

Bubble radius–time evolution in two sets of water simulations with an actual nucleus under ultrasonic waves with different amplitudes;  $\bar {r}$ is smoothed via the LOESS smoothing method. All of the ultrasonic periods are 0.2 ns, and the other simulation parameters are listed.

Figure 13 shows the schematic diagram of the object of simulation. The nucleus embedded at the centre of the domain is composed of hydrophobic LJ particles. The LJ parameters are  ${\varepsilon _{{C}}} =0.0289$ kcal mol
 $^{-1}$ and
 , and the cutoff radius of the LJ potential between these LJ particles and water molecules is set as 10
 , following Zhou (Reference Zhou2020). Except for the actual nucleus, other simulation settings are the same as those in § 3.1.
Figure 14 presents the bubble radius evolution in two sets of simulations. The initial radius in figure 14 is a little bit larger than its counterpart in figure 7, which is attributed to the dewetting effects. On the other hand, the corresponding cavitation pressure could be estimated as about  $-45$ MPa and about
 $-30$ MPa, which are the same as those adopting a void as nucleus (referring to figure 7f,j). This suggests that the nucleus here has nearly the same effect on promoting cavitation as that of the void and could be represented by a same-sized void. Therefore, the cavitation is dominated by thermal fluctuations, and the dewetting and other effects of the particle do not dominate cavitation under the simulation condition. To some extent this case provides the reassurance that the nanoscale nucleus can be represented by an equivalent void.



