Introduction
The role of the major histocompatibility complex (MHC) in the adaptive immune response of mammals has been extensively studied (Rothschild et al., Reference Rothschild, Skow and Lamont2000; Xu, Reference Xu2011; Duangjinda et al., Reference Duangjinda, Jindatajak, Tipvong, Sriwarothai, Pattarajinda, Katawatin and Boonkum2013). The MHC in cattle is known as the bovine leukocyte antigen (BoLA) and is located on BTA 23 (Untalan et al., Reference Untalan, Pruett and Steelman2007). MHC genes are highly polymorphic, with class I and II having the most important functions in terms of anti-body and cell-mediated response. Genetic variation in the MHC class II genes and in particular the Bola-DRB3, has been shown to be associated with resistance to tick-borne diseases (Machado et al., Reference Machado, Azevedo, Teodoro, Pires, Peixoto, de Freitas, Prata, Furlong, da Silva, Guimarães and Regitano2010; Duangjinda et al., Reference Duangjinda, Jindatajak, Tipvong, Sriwarothai, Pattarajinda, Katawatin and Boonkum2013).
Tick infestation is a limiting factor in beef production in the sub-tropical areas of both South Africa (SA) and Namibia. The consequences of tick infestation include blood loss, suppressed growth and damaged hides (Muchenje et al., Reference Muchenje, Dzama, Chimonyo, Raats and Strydom2008). In addition, the ticks act as vectors of viral, bacterial and protozoan diseases (Mapholi et al., Reference Mapholi, Marufu, Maiwashe, Banga, Muchenje, MacNeil, Chimonyo and Dzama2016). Most farmers use acaricides as the primary method to control ticks, but many tick species have developed levels of resistance to these chemicals (Muchenje et al., Reference Muchenje, Dzama, Chimonyo, Raats and Strydom2008; Duangjinda et al., Reference Duangjinda, Jindatajak, Tipvong, Sriwarothai, Pattarajinda, Katawatin and Boonkum2013). This, as well as environmental pollution and the economic impact to the farmers with regards to labour and veterinary costs (Muchenje et al., Reference Muchenje, Dzama, Chimonyo, Raats and Strydom2008), make this an inefficient long-term solution.
Sanga and Bos indicus breeds are well known for their adaptive characteristics and tick tolerance (Muchenje et al., Reference Muchenje, Dzama, Chimonyo, Raats and Strydom2008; Marufu et al., Reference Marufu, Chimonyo, Mans and Dzama2013.). South Africa and Namibia both have a number of indigenous breeds well adapted to produce in sub-tropical regions and which currently contributes to commercial beef production (Mapholi et al., Reference Mapholi, Maiwashe, Matika, Riggio, Bishop, MacNeil, Banga, Taylor and Dzama2014). Adaptive mechanisms such as the sleekness of coat, hide thickness and skin vascularity have been associated with lower tick infestation in these indigenous breeds (Mapholi et al., Reference Mapholi, Maiwashe, Matika, Riggio, Bishop, MacNeil, Banga, Taylor and Dzama2014). The locally developed, composite Bonsmara breed is also a hardy, heat-resistant breed (Muchenje et al., Reference Muchenje, Dzama, Chimonyo, Raats and Strydom2008), while the Hereford is an exotic breed of British origin which is not as well adapted to the harsh Southern African environment.
Previous studies on tick resistance in the South African cattle were based on quantitative assessment of tick counts (Muchenje et al., Reference Muchenje, Dzama, Chimonyo, Raats and Strydom2008) and local cutaneous responses (Marufu et al., Reference Marufu, Chimonyo, Mans and Dzama2013). A preliminary whole genome investigation on Nguni cattle indicated that certain copy number variation could contribute towards the breed’s adaptive traits (Wang et al., Reference Wang, Dzama, Hefer and Muchadeyi2015). It is important to understand the underlying genetic variation of the MHC genes and their potential role in tick susceptibility and resistance to tick-borne diseases. The aim of the study was to investigate the genetic variability in the DRB3 region in three SA and two Namibian beef cattle breeds using microsatellite markers.
Material and methods
A total of 192 beef cattle were included in the study with the consent of the individual cattle farmers. In South Africa samples were collected from one farm per province namely Mpumalanga for 40 Bonsmara (SABON), Limpopo for 41 Nguni (SANGU) and Gauteng for 39 Hereford (SAHER) cattle. In Namibia, the sample collection was done at the Neudamm Experimental farm, situated about 42 km from Windhoek for 42 Afrikaner (NAFR) and 30 Sanga (NSAN). Ethical approval (EC 007-15) for the study was obtained from the University of Pretoria Animal Use and Care Committee in the Faculty of Natural and Agricultural Sciences, as well as the University of Namibia through the Centre for Research and Publications. Sample collections were performed in summer (September to March) in both countries. Blood samples were collected in 5 ml EDTA tubes. Deoxyribonucleic acid extraction was performed using standard commercial extraction kits (Machery-Nagel Nucleospin Blood kit (www.mn-net.com) and ZR Zymo Blood kit (www.zymoresearch.com)). Ticks were counted by lifting the tail of the animal and counting ticks in the perineal area. Tick counts were converted into six classes ranging from class one (0 to 10) to class six (>50).
PCR were performed on all the samples in the Animal Breeding and Genetics Laboratory of the Department of Animal and Wildlife Sciences and genotyping at the Forestry and Agricultural Biotechnology Institute sequencing laboratory of the University of Pretoria. Four microsatellite markers mapped in or in close proximity to the DRB3.2 region were used namely DRB3, DRBP1, RM185 and BM181 (Untalan et al., Reference Untalan, Pruett and Steelman2007). The microsatellites were fluorescently labelled, and PCR amplification was carried out using a GeneAmp® PCR System 9700 thermocycler (Applied Biosystems, Foster City, CA, USA). Successful amplicons were genotyped using an ABI PRISM® 3500XL DNA Genetic Analyser (Applied Biosystems).
Raw genotyping results were processed with the GeneMarker™ software (www.softgenetics.com/GeneMarker.html) to determine the fragment sizes for each locus. Excel Microsatellite Toolkit (Park, Reference Park2001) was used to perform quality control, and to determine Polymorphic Information Content (PIC) values and allelic frequencies. Analysis of the population structure was performed with the software STRUCTURE 2.3.4 (Pritchard et al., Reference Pritchard, Stephens and Donnelly2000; Falush et al., Reference Falush, Stephens and Pritchard2003) to determine the true number of populations (K), by using Bayesian-based assignment principles. The model used for the simulation assumes admixture in the ancestry, and therefore assumes correlated allele frequencies. The model assumed the probability of the number of populations (Ln Pr (X|K)) to be 2⩽K⩽9. In total, five independent runs were performed for each K, and the probability value for each K was averaged over the runs. The runs were carried out with a burn-in period of 100 000 steps, followed by 500 000 Markov chain Monte Carlo iterations.
Results
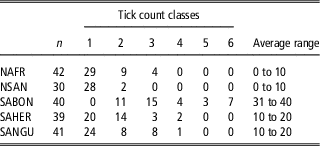
Tick scores were low with counts between 11 and 20 for all the breeds except for the Bonsmara with counts of 31 to 40 ticks per animal. In Table 1, a summary is provided for the tick counts from the different breeds from the different locations.
Tick scores for three South African and two Namibian breeds included in the study

NAFR=Namibian Afrikaner; NSAN=Namibian Sanga; SABON=South African Bonsmara; SAHER=South African Hereford; SANGU=South African Nguni.
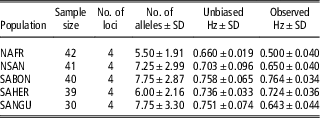
The four microsatellite markers had a PIC ranging from 0.508 to 0.847. The number of alleles varied between 5.5 in the NAFR population to 7.7 for both the SABON and NSAN. The genetic diversity for the DRB3 based on the four markers analysed was relatively high with unbiased heterozygosity values ranging from 0.66 for the NAFR cattle to 0.76 for the SABON cattle (Table 2).
Summary of the heterozygosity and number of alleles observed in the five cattle breeds

Hz=heterozygosity; NAFR=Namibian Afrikaner; NSAN=Namibian Sanga; SABON=South African Bonsmara; SAHER=South African Hereford; SANGU=South African Nguni.
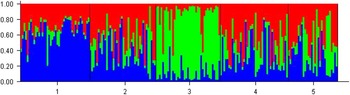
The structure analyses grouped the five populations into three indistinct clusters (indicated by colour), as shown in Figure 1.
Population structure for five beef breeds at the most probable number of populations (K=3). 1=Namibian Afrikaner (NAFR); 2=South African Bonsmara (SABON); 3=South African Hereford (SAHER); 4=South African Nguni (SANGU); 5=Namibian Sanga (NSAN).

Discussion
Tick counts in this study provided a poor indication of adaptation due to the variability between the climatic regions and the tick control programs followed by the individual breeders. Environmental bias was observed, as the cattle originated from commercial farming operations where the tick counts were directly related to the frequency of tick control. Tick counts are only useful if repeated measures are possible within a standard tick control program (Mapholi et al., Reference Mapholi, Maiwashe, Matika, Riggio, Bishop, MacNeil, Banga, Taylor and Dzama2014).
High levels of genetic variation were however observed in the DRB3.2 region, indicating that this could be a useful region for selection for adaptability. In the structure analyses the Sanga and the Bonsmara exhibited a heterogeneous variation, with the only the Hereford forming a more distinct cluster. A more detailed investigation using single-nucleotide polymorphism markers and infection status of cattle (rather than tick counts) may provide more definite results.
Acknowledgement
The authors greatly acknowledge the National Research Foundation (Grant number: N00541) for their financial support for this collaborative project between South African and Namibian researchers.