


Nomenclature
-
 Specific heats of ice, air and vapour
-
D Diffusion coefficient of water vapour in snow
-
g Gravitational acceleration
-
k Permeability of the snowpack
-
K 1, K A, K V Thermal conductivities of ice, air and vapour
-
L iv Latent heat of sublimation
-
m iv Rate of mass supply to the ice from the vapour
-
p I, p A, p V Intrinsic pressure of ice. air and vapour
-
p i, p a, p v Partial pressure of ice, air and vapour per unit mixture volume
-
p A, p V Partial pressure of air and vapour per unit gas volume
-
p G Common intrinsic gas pressure
-
Pm, P* Pressure mean and its amplitude of fluctuation
-
PcV Vapour-pressure constant
-
Non-dimensional surface gas-pressure variation
-
R A.R V Gas constant for air and vapour
-
t Time
-
t*, t s, t d Seasonal and diurnal time-scales
-
Τ Common temperature
-
T m, T* Temperature mean and its amplitude of fluctuation
-
v i, v a, v v Vertical velocity of the ice, air and vapour
-
Velocity magnitude of air and vapour
-
z Vertical coordinate
-
z* Length scale
-
ε1…ε19 Non-dimensional parameters
-
θa, θv Volume fraction of air and vapour per unit gas volume
-
θ* Magnitude of the vapour-volume fraction
-
μ Viscosity of moist air
-
ρI, ρA, ρV Intrinsic density of ice. air and vapour
-
ρi, ρa, ρv Partial density of ice, air and vapour per unit mixture volume
-
ρA, ρV Partial density of air and vapour per unit gas volume
-
ρ* Magnitude of the air density
-
ρV* Magnitude of the vapour-density concentration
-
Φi, Φa, Φv Volume fraction of ice, air and vapour per unit mixture volume
-
Φ g Matrix porosity
-
Φ m, Φ* Porosity mean and its amplitude of fluctuation
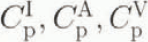 Specific heats of ice, air and vapour
 Non-dimensional surface gas-pressure variation
 Velocity magnitude of air and vapour
1. Introduction
Snowpack models have been developed to predict the mechanical and thermal properties needed for engineering applications, avalanche forecasting, remote sensing and risk assessment in meltwater hydrology. Often, the underlying physics is included in an ad hoc fashion and assumptions are made without proper discussion and justification. Here, we derive a reduced model in a rational manner, discussing the necessary constitutive postulates and pointing out areas where the physics is poorly understood or where it is not self-consistent.
Natural snowpacks in general consist of a porous ice matrix that is occupied by liquid water and a moist gas, composed of water vapour and dry air. However, in maintained sub-zero temperatures, when the water freezes, only three constituents remain; these are called dry snowpacks and are abundant on the Antarctic continent. Reference Morland, Kelly and MorrisMorland and others (1990) laid down a rigorous theoretical framework for a four-constituent phase-changing snowpack. in which the conservation equations for the ice, water, water vapour and air were derived from die principles of mixture theory (Reference MorlandMorland, 1972, Reference Morland1979), assuming that each constituent has the same common temperature T. This theory is considerably simplified in the special case of dry snowpacks, in which the mass and momentum balances for the water vanish. Also, thermal contributions from the water are no longer present in the bulk-energy balance, and the rates of mass supply associated with phase changes of melting/freezing and evaporation/condensation are absent.
A simplified mixture theory for a one-dimensional vertical snowpack that has no lateral gradients and whose horizontal velocity components are identically zero has been investigated by Reference JordanJordan (1991) and Reference Bader and WeilenmannBader and Weilenmann (1992). These were primarily developed to model both wet and dry snowpacks and many of the terms which may be of importance in dry snowpacks were neglected without proper justification. Reference Bader and WeilenmannBader and Weilenmann (1992) assumed that both gases arc stationary and that they make no sensible-or latent-heat contributions in the energy balance. Reference JordanJordan (1991) also assumed that the gas does not move but does allow a latent-heat contribution due to sublimation in the energy balance.
In order to determine the relative importance of gas contributions in the bulk-energy balance, Reference Gray and MorlandGray and Morland 1991 formulated the conservation balances for a simple two-constituent dry snowpack model consisting of a stationary porous matrix occupied by dry air. Focusing on the one-dimensional vertical snowpack, live constitutive postulates and two external prescriptions were made to obtain a closed system which was forced by annual surface variations in the temperature gradient and pressure. A non-dimensional analysis of the partial differential equations and the surface conditions determined the major balances and led to a rational reduced model. To leading order, there is a small sensible-heat contribution from the presence of air which modifies the snow’s bulk thermal conductivity but there is no similar contribution to the bulk specific heat. For slow surface-pressure variations, the original assumption that the gas is stationary, made by Reference JordanJordan (1991) and Reference Bader and WeilenmannBader and Weilenmann (1992), is very good since there are neither convective terms nor pressure working terms involving the air velocity in the energy balance. However, for Faster pressure forcing, the velocity magnitude is increased and the work done by the gas travelling through a non-uniformly porous snowpack can make a significant contribution to the energy balance.
A complete description of a dry snow pack should of course include the third constituent, water vapour. At these low temperatures, it occupies only a very small volume fraction of the moist gas and its effect on the thermal conductivity and specific heat is undoubtedly small but latent-heat contributions through phase change with the ice matrix could well be significant. In this paper, we formulate a three-constituent theory for a natural dry snowpack that includes the effects of phase change and, in one dimension, investigates the case of a sinusoidal surface-temperature gradient.
2. Mixture Framework
A dry snowpack is a mixture (interacting continua). composed of the three constituents ice, water vapour and air. In each element of the snowpack there is a proportion Φv of each constituent, defined as the volume fraction of constituent v per unit mixture volume. The constituent letters v = i, v, a will be used to refer to the ice, vapour and air, respectively. By definition, the volume fractions all lie between zero and one and their stun over all constituents equals unity:

Partial variables denoted by a lower-case superscript are defined per unit mixture volume or area, whilst intrinsic variables, defined per unit constituent volume or area, arc indicated by the upper-case superscript. The partial and intrinsic densities are therefore related by a volume-fraction scaling and we adopt the same common assumptions for the scaling of partial and intrinsic stress. Thus, for constituent v the density ρv and stress σv satisfy


is related to the intrinsic pressure by the same linear volume-fraction scaling. The constituent velocity fields v v , however, are associated with the mixture in the sense that ρv v v determines the mass flux per unit mixture cross-section in the derivation of the usual mass-conservation equation for each constituent, while the derivation of the usual conservation equations of momentum and energy for each constituent also identifies v v as the intrinsic velocity. Reference MorlandMorland (1992) showed that this also requires the assumption of equal areas and volume fractions, independent of the orientation of the cross-section. Introducing an anisotropic structure will therefore require re-examination of the velocity interpretation and of the momentum and energy fluxes. The present equations, then, are not necessarily appropriate to a structured snowpack.
Mixture theory lays down the conservation laws of mass, momentum and energy for each constituent, including the mechanical and thermal interaction effects between constituents. Following Reference Gray and MorlandGray and Morland (1994), we focus our attention on a one-dimensional vertical snowpack in which there are no lateral gradients and the horizontal velocity components arc identically zero. The coordinate z measures distance in the vertically upward sense and vv is the vertical velocity of constituent v. Mass conservation for constituent v is expressed by

where mvw is the rate of mass supply to constituent v from constituent w due to phase change. The rate of mass supply from each constituent to itself. mvv is In definition zero, and the rate of mass supply from constituent v to constituent w is equal but opposite in sign to the rate of mass supply from w to v, mvw = −mwv. The linear momentum balance for constituent v has the form

where g is the constant of gravitational acceleration. ρ is the bulk mixture density defined by

and ρBvw is the interaction force exerted on constituent v by constituent w namely, the force per unit mixture volume. The interaction force of each constituent on itself, Bvw , is by definition zero, and the force on constituent v by constituent w is equal but opposite in sign to the force on w exerted by v, Bvw = −Bwv. In the next section, we introduce an explicit drag and also a molecular interaction force between the miscible gases. The right-band side of Equation 2.5 represents momentum transfer and were termed thrusts by Reference MorlandMorland 1992 to distinguish them from the interaction drags due to the resistance to relative motion. The particular form in Equation 2.5 was derived by postulates of linearity in the mass transfer and relative velocity, consistent with the total thrust relation, with a common relation for all binary interactions.
The three constituents are in a state of thermal equilibrium, provided that the forcing time-scale is much longer than the time-scale for thermal transfers between constituents, which is assumed here. Thus, all constituents have a common temperature. T, and there is a single bulk energy balance expressed by

where for constituent v,  is the specific heat at constant pressure, r
v is the rate of external energy supply per unit volume of mixture (e.g. solar radiation). kN
is the thermal conductivity and L
vw. is the latent heat released due to phase change from constituent w. The converted derivative Dv, /Dt, defined as

is a measure of the change following a particle of constituent v. These equations parallel Reference Gray and MorlandGray and Morland (1994) with one extra mass and momentum balance for the water vapour. Here, however, phase change between each of the constituents must be considered and the resulting rates of mass supply contribute to each of the balances in Equations (2.4), (2.5) and (2.7). It has been pointed out by a reviewer that even small differences in constituent temperatures can have significant effects upon the mass-transfer rates (Reference Adams and BrownAdams and Brown. 1989, Reference Adams and Brown1990. Since our later reduced equations show that the mass transfer influences the leading-order rate of volume-fraction change, this simplifying common temperature assumption may not always be satisfactory, and comparison is needed to assess the range of validity.
3. Constitutive Properties
The conservation principles yield three mass balances in Equation (2.4), three momentum balances in Equation 2.5 and one energy balance in Equation (2.7), and in addition the volume-fraction sum equals unity, Equation (2.1), and the first stress invariant defines the mean pressure, Equation (2.3), a total of 11 conditions. For simplicity, we neglect the partial-intrinsic variable relations in the equation count and need not distinguish between these two types in the variable count. It follows that the conservation equations contain three volume fractions, three densities, three stres> fields, three pressures, three velocities, three rates of mass supply, three interaction drags, in addition to three external energy supplies and one temperature, a total of 25 variables. In order to close the model. 11 constitutive properties are needed and three external energy supplies must be prescribed.
The first two conditions prescribe the constitutive properties of each of the gases. The mean pressure is assumed to be purely hydrostatic, and equal to the intrinsic gas pressure by Equation (2.3), obeying a perfect gas law. Thus, for the water vapour

and for the air

where R v = 4.61 × 10², J kg−1 K−1 and R A = 2.87 × 10² J kg−1 Κ−1 (Reference GillGill, 1982) are the gas constants for the water vapour and air. respectively. Further, a discontinuity in pressure between the miscible vapour and dry air cannot be supported, and the third condition is that

Recall that each constituent has a common temperature T, so assuming a common gas pressure p G and the equations of state (3.1) and (3.2) implies that the vapour and gas densities arc related by

Note that, since R V > R A, the vapour density is less than the air density ρ V < ρ A, and we might expect the vapour to be buoyant and rise under the action of gravity. In practice, however, small-scale turbulence ensures that the vapour and air arc always well mixed. The total gas-volume fraction, or matrix porosity, is

by the volume-fraction relation (2.1). Volume fractions of vapour and air per unit volume of gas are obtained by dividing their mixture volume fractions by the porosity:

where the humidity θ v satisfies θ v = 1 – θ a. The partial pressures and partial densities per unit volume of gas are defined as

where pv is commonly referred to as the vapour pressure and ρv is termed the vapour-density concentration.
Sublimation from water vapour to ice, or vice versa, is the only permissible phase change, because the dry air is inert. There are no phase changes between the air and the ice matrix, or the air and the water vapour, so the rates of mass exchange between these pairs of constituents are identically zero, that is

which are the fourth and fifth conditions. There remains the rate of mass supply m iv due to sublimation to prescribe. We are run aware of an established physical relation, even though forms can be motivated Reference Adams and BrownAdams and Brown, 1990; Reference Morland, Kelly and MorrisMorland and others, 1990). We therefore adopt a simplifying approximation that the vapour pressure pV is given in terms of temperature by an equilibrium relation, which is the sixth condition discussed at greater length in section 4. Prescription of m iv by its own constitutive relation would in general predict a vapour pressure not satisfying this equilibrium relation.
Darcy’s law describes the motion of a single fluid through a porous medium, but there is no established theory when two miscible fluids pass simultaneously through the ice matrix, as is the case here with water vapour and air. Reference MorlandMorland (1978) interpreted the usual Darcy experiment results relating fluid flux to pressure difference for steady uniaxial flow under uniform pressure gradient to infer an interaction drag for matrix permeability k and gas viscosity μV , which in this one-dimensional case becomes

for constituent v. The presence of the porosity-gradient contribution had been noted by Reference GargGarg 1971 but in many-applications it is negligible. In the absence of any accepted two-component fluid relations, we propose to apply Equation (3.9) for the interaction drags between the vapour and ice, ρB vi. and the air and ice, ρB ai, assuming that μ v = μ a = μ, which are conditions seven and eight.
Experimental evidence suggests that in the presence of strong temperature gradients the vapour will disperse significantly through the air. This is driven by a molecular interaction force (Reference MorlandMorland, 1992) ρΒ va of the air on the vapour, with corresponding force −ρB av of the vapour on the air, possibly tempered by inter-fluid drag. However, the form of such an interaction force is not known, so we will first consider the conventional diffusion relation

which relates v
v to v
a. This supposes that the interaction force ρB
va is just that required to impose Equation (3.10). The mass flux ρ
v(U
v – U
a) of the vapour relative to the air, and the vapour-density concentration gradient  , in Equation (3.10) are our interpretations of the undefined quantities introduced by Reference Male and ColbeckMale (1980). Male suggested that the diffusion coefficient D has a functional dependence on pressure and temperature but, following Reference ColbeckColbeck (1993), we shall assume that the diffusion coefficient of vapour in snow is simply five times that of vapour in air. Given that D
air = 2.2 × 10⁻⁵m2s−1 (Reference WeastWeast, 1988) then D ≃ 10−4 m2
−1. This is condition nine. An alternative approximation examined later is that U
v = U
a, imposed by an inter-fluid drag which is the extreme non-dispersive case. This is given by setting D = 0.
We shall assume that the ice grains are rigid and have constant density ρ I = 918 kg m−3, this is condition ten. In the presence of gravity, the ice matrix collapses under its own overburden pressure, leading to densification of the snowpack. Reference YosidaYosida and others (1956), Reference BaderBader (1962) and Reference KojimaKojima (1964) interpreted this behaviour by means of a linearly viscous stress relation with a compactive viscosity ηc that is dependent on the porosity, temperature and grain-size, deducing that this viscosity lies in the range 1010 < η c < 1017 kgm−1 s−1. Reference MellorMellor (1975) concluded that the properties were of such bewildering complexity that it was sensible to adopt a greatly simplified description that will dominate in a particular problem, and Reference Gray and MorlandGray and Morland (in press) have derived a pressure density relation consistent with the same data. Here, we suppose that the pack is pre-compacted and, instead of prescribing the constitutive properties of the stress field σi we shall simply assume that the ice matrix is stationary. That is, the ice matrix has zero vertical velocity component

allowing the stress component  to be determined from the ice-momentum balance in Equation (2.5). The horizontal stress components are also required to determine the ice pressure p
i defined in Equation (2.3). For simplicity, and lacking a shear law, we assume that the matrix shear stress is zero so that

since we do not expert distinct horizontal stresses to have a major effect in this constrained vertical motion. Equation (3.11) in conjunction with Equations (3.12) determine the ice-stress field and provide the eleventh condition. The stationary ice matrix precludes the withdrawal of gases by matrix compaction, and is not applicable to consolidation during the build-up of the pack, but we may still investigate the main effects of surface-temperature and pressure forcing in isolation. In the same spirit, the final three conditions eliminate solar-radiation effects in the near-surface layers, i.e. the external energy supplies  . It remains to determine the ice-vapour mass transfer.
4. Phase-Equilibrium Thermodynamics
Natural dry snowpacks contain a small amount of water vapour, which is free to circulate through the ire matrix. Ice may sublime into water vapour at deeper levels in the snowpack and move upwards before resolidifying into ice, possibly forming hoar-frost layers at some later stage. Although compaction is probably still the dominant process in dry snowpack densification, vapour transport and phase change provide an alternative mechanism for the redistribution of mass. In order to model these effects, a relation for the volume fraction of water vapour within a saturated moist gas at any given temperature and pressure is required.
As a first attempt to model the process of phase change, it is assumed that the ice and water vapour co-exist at all times and are in thermal equilibrium. This means that the system must always lie on the phase boundary between the solid and gas on a pressure temperature phase diagram. Hence, at any temperature and pressure, the amount of water vapour in the air is determined by the humidity value on the phase boundary and the phase change (which can proceed in either direction) is just enough to keep the system in thermal equilibrium. Along phase boundaries the change of the chemical potential of ice. dμ 1 equals the change in chemical potential of the water vapour, dμ V. At the pore scale, the ice constituent appears as a grain with curved surface, while the water vapour is still intimately mixed with the inert dry air which inhibits the exchange of water molecules. The changes in the chemical potentials satisfy

where ρv and ρV are the partial density and pressure per unit volume of gas (accounting for the fraction of dry air), respectively, and S 1 and S V are the specific entropies. For the reversible process of sublimation these are related to the temperature by

where the latent heat of sublimation is  It is conventional to assume that the mechanical equilibrium of the ice grain is described by Laplace’s equation (Reference Defay and PrigogineDefay and Prigogine, 1951), in which the difference of the ice pressure and the pressure exerted by the gaseous components is balanced by the the surface-tension of the ice grain. Thus,

where the interfacial energy σiv = 109 m J m−2 (≃10−1J m−2) (Reference HobbsHobbs, 1974) and r is the mean radius of curvature. However, the ice-momentum balance in Equation (2.5) already determines the ice pressure p I and die additional requirement of Equation (4.3) either overdetermines the problem or tells us about the evolution of the mean radius of curvature.
Equating the chemical potentials in Equation (4.1), and using Equations (3.1), (3.7), (4.2) and (4.3), determines the phase-equilibrium balance

which is a constitutive relation between the humidity, vapour pressure and temperature. The latent-heat term is of magnitude 105J kg−1 for an average temperature of 238 Κ and temperature changes are of 35 K, while the gas-pressure changes are of the order of 103 Pa, so the second and third terms of the lefthand side are of order 103 and 10−1J kg−5. The first term is. however, of magnitude 105J kg−1 based on the the volume fraction of water vapour changing by its own order of magnitude. The fourth term, which is essentially the contribution clue to radius of curvature effects, can only contribute to the balance if

Now, if r is the maximum magnitude of the mean radius of curvature which occurs, then necessarily dr ≤ r and approximation (4.5) would require r ≤ 10−7m. That is, the fourth term contributes only if the maximum mean radius of curvature does not exceed 10−7m. While such radii may exist at a local scale, perhaps in new snow with branched crystals, we expect such sharp interfaces to be smoothed rapidly.
Radii of curvature effects do not, therefore, cause significant changes in humidity, and the first and second terms on the lefthand side must be those which balance the latent-beat term on the righthand side. Thus, our dilemma in using Laplace’s Equation (4.3) is resolved, as the terms it introduces do not enter the leading-order balance, and Equation (4.3) is superfluous. In this case, the phase-equilibrium balance in Equation (4.4) reduces to

which becomes, using the perfect gas law for the vapour in Equation (3.1),

By direct integration, the volume fraction of water vapour is related to the gas pressure and temperature by

where 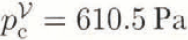 and Tc = 273.1 Κ (Reference ColbeckColbeck, 1990). At a given temperature and pressure, the amount of water vapour in the pore space is determined by this relation, and the rate of mass supply miv
is that required to maintain the vapour pressure. That is, the vapour-pressure relation. Equation (4.8), provides the sixth constitutive condition. Note that, if order-unity density changes due to phase change, occur on a time-scale t* so that m
iv ~ p
v/t* by Equation (2.4), then the vapour would have to have velocity Uv
~gt* in order that the interaction thrust terms on the righthand side of Equations (2.5) might balance the gravitational acceleration. Even at very fast time-scales t* = 103 s. this implies vv
~ 104 m s−1, and observed velocities are significantly lower, so these thrust terms are always negligible.
5. Model Equations
The conservation laws in conjunction with the constitutive properties, define a rational closed system of equations for the set of 25 variables. We now reduce this to a system of nine equations in nine unknowns. Using the stationary-matrix condition (3.11), the constant intrinsic ice density and the porosity definition in Equation (3.5), the mass balance in Equation (2.4) for the ice reduces to

Substituting the density relations in Equations (2.2), (3.4) and the humidity definition in Equation (3.5) into the mass balance of Equation (2.4) for the vapour, we obtain

Similarly, the air-mass balance is

The interaction forces exerted on the ice due to the vapour and air are equal but opposite in sign to those given by Equation (3.9) and, together with the stationary ice-matrix assumption in Equation (3.11), complete the ice-momentum balance in Equation (2.5), which becomes an equation for the ice pressure, p I,

Adding the vapour and air-momentum balance Equation (2.5) eliminates the unknown molecular dispersion forces, ρΒ va, and, substituting the Darcy matrix drags in Equation (3.9), we obtain the composite relation

The vapour velocity is related to the air velocity by the diffusion relation (3.10)

The thermal conductivity and specific heat of the composite moist gas are, in general, functions of the humidity. For simplicity, however, we shall assume that K
A = K
V and  , which results in thermal properties that are independent of the humidity. We will show in section 7 that these terms do not contribute to the leading-order balances and so this assumption is not a real restriction. The energy balance in Equation (2.7) now reduces to

where the thermal conductivities K
I = 2.2 J m−1 s−1 K−1 and K
A = 2.24 × 10⁻²J m−1 s−1 Κ−1, and the heat capacities  and
 Reference FukusakoFukusako (1990) reviewed the empirical dependence of snow thermal conductivity on porosity and catalogued the quadratic and quartic polynomials that arc used to parameterize the large spread of data but these empirical relations already include the latent-heat effects due to vapour transport. In the proposed model, the latent-heat terms, on the right-hand side of Equation (5.7), are separate contributions to the energy balance and it is, therefore, appropriate to use a linearly volume-fraction weighted thermal conductivity, the natural mixture-theory definition. In addition to the five conservation principles, we impose the perfect gas relation for the air

and the thermodynamic phase-equilibrium Equation (4.8) for the humidity

which completes the system. The model consists of seven coupled partial differential Equations (5.1)–(5.7) and two algebraic relations (5.8) and (5.9), which can be solved for the nine variables  , when seven boundary conditions and four initial conditions are specified. The constants are summarized in Table 1.
Constants

It is very important to note that the theory, as it is presented here, can lead to an inconsistency unless a very restricted set of basal-boundary conditions is adopted. Consider the vapour-density concentration, p v, which, using Equations (5.8) and (5.9) can be written as

This is a function of temperature T only. The vapour-density concentration gradient in the diffusion relation. Equation (5.6), implies that the relative velocity of the vapour to the air is proportional to the temperature gradient. It is not unreasonable to suggest that at some snow depth the pack becomes impermeable and the vapour and air velocities are identically zero, V v = Va = 0. However, the diffusion relation in Equation (5.6) can then only be satisfied if the temperature gradients are also identically zero at this point, which is over-restrictive. If there is an applied basal-temperature gradient, then, to obtain a self-consistent set of equations, either the diffusion relation in Equation (5.6) or the phase-equilibrium Equation (5.9) must be reformulated to account for different behaviour close to this basal boundary. We proceed with the present model equations and restricted class of boundary conditions on the premise that these effects take place in a narrow basal-boundary layer that does not affect the solution within the interior significantly.
It is also immediately apparent that changes in surface pressure do not change the partial vapour-density concentration directly (although they can have some minor effect through the weak coupling with the temperature) and, therefore, cannot induce disparate vapour and air velocities. This, combined with the weak humidity dependence on pressure in Equation (5.9), implies that pressure forcing on seasonal time-scales essentially reduces to the two-constituent theory of Reference Gray and MorlandGray and Morland (1994).
6. Non-Dimensional Variables
Natural dry snowpacks are forced by the atmospheric conditions prevailing at their surface. Our interest lies in predicting the temperature profile in the snow for a variety of surface-pressure and temperature scenarios. On the high Antarctic plateau, surface temperatures range between 193 and 263 K, with annual mean Tm = 228 Κ and amplitude of fluctuation T* = 35 K, whilst in coastal locations the average temperature T m = 250 Κ and fluctuates by T* = 20K (Reference WilsonWilson, 1968). This suggests a temperature scaling of the form

where the ratio of fluctuation amplitude to mean temperatures defines  , equal to 0.15 on the plateau and 0.08 at the coast. The tilde is used to indicate a non-dimensional variable. Surface pressures on the high plateau have a mean value p
m = 6.8 × 10⁴ Pa (680 mbar), and due to the large stable air mass vary only by p* = 103 Pa (10 mbar) (Reference Samson, Barnard, Obremski, Riley, Black and HoganSamson and others, 1990); in the much lower coastal regions, the mean pressure is corresponding higher, p
m = 8 × 10⁴ Pa (800 mbar), and fluctuates considerably more due to storm passages, p* = 4 × 10³ Pa (40 mbar). Thus, temperature forcing is more extreme on the plateau, whereas pressure forcing has more effect near the coast. Temperature and pressure means, and their amplitudes of variation, arc of the same order of magnitude in both coastal and interior regions, and we propose to investigate the balances for a single scenario which adopts the maximum amplitudes of variation for scaling, namely the interior temperature variations, T
m = 228 Κ and T* = 35 K, and coastal pressure variations, p
m = 680 mbar and p* = 40 mbar. In this situation, the air density responds via the ideal gas relation in Equation (5.8) and has a mean density

and at the snow surface the humidity is governed by Equation (5.9), reaching a maximum 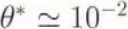 at the highest temperature and lowest pressure. Thus, terms involving θ
v in the balances are small compared to unity.
In the high polar latitudes where perpetual daylight reigns in summer and perpetual darkness in winter, surface temperatures change by order T* on a seasonal time-scale 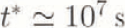 . In lower latitudes, there are also diurnal changes of temperature with amplitude T
d = 7 Κ on a time-scale t
d = 2 × 10⁴s, with mean daily temperature varying over the season. In addition, very rapid variations in surface pressure caused by wind blowing over surface dunes or ripples, known as wind-pumping (Reference ColbeckColbeck, 1989), take place in a fraction of a second, but we note later that such pressure variations are not covered by the reduced equations developed in section 7. We use the common notation t* for our time-scale, taking either the seasonal value t
s or diurnal value t
d, with the understanding that T* is replaced by Td
and an appropriate Tm
is chosen if a diurnal variation is being investigated. The various parameter magnitudes are not changed by the modification of Tm. Thus, we introduce a non-dimensional time
 by

Once the time-scale t* is selected, a balance between the conduction 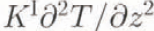 and the local heating
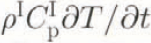 terms in Equation (5.7), which arc the leading-order contributions, defines a length scale Z* on which the non-dimensional time and length derivatives of temperature have equal status. The vertical coordinate is therefore scaled as

respectively, for t* = t
s or t
d, and for  (Reference GlenGlen. 1974; Reference HobbsHobbs, 1974) and
 . The length scale z* is typically shorter than the snow depth h at which pore space ceases to be interconnected, at a porosity
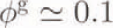 when gas is trapped within the ice.
Surface pressure is assumed to change by order p* in time t* but this does not necessarily imply that the pressure will change by the same magnitude over this length scale z*; that is,  may be greater or less than p*/z* in magnitude. Consider the terms in the gas-momentum balance in Equation (5.5) for comparison with p*/z* = 103 or 4 × 10⁴ kg m2 s−2. The gravitational force has magnitude ρ
m
g ~ 10 kg m−2 s−2, while the Darcy drag
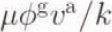 with an air viscosity μ = 1.45 × 10⁻⁵ kg m −ls−1 (Reference BatchelorBatchelor, 1967), ice-matrix permeability k = 10−9 m2 (Reference ShimizuShimizu, 1970) and
 , has a magnitude 5 × 10³
Va
kg m−2 s−2 when va
is given in m s−1. It is immediately clear that p*/z* is much greater than the gravity term and much greater than the drag term unless va
~ 0.2 or 8 ms−1 for the respective z*, which greatly exceed observed values. We can therefore conclude that
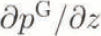 is much smaller than p*/z*, which suggests that in the z*, t* scaling determined by the thermal balance, the gas pressure has a natural decomposition into a time-dependent part uniform in depth, which corresponds to the surface variation
 , and a depth-(and time-) varying part which is governed by the momentum balance in Equation (5.5). Thus

where  . The pressure gradient is now of magnitude
 and can be no larger than the gravitational force p
m
g. Allowing this maximum magnitude, and using Equation (6.2), shows that
 or 10−5 for the respective z*. The ideal gas relation in Equation (5.8) then implies a density scaling and separation of the form

where the non-dimensional density fluctuation  . The maximum humidity is attained at the highest temperature
 and can change by its own order of magnitude over the range of temperature encountered. The humidity is, therefore, scaled on its maximum attainable magnitude

is given by the thermodynamic phase-equilibrium Equation (5.9). The vapour-density concentration, ρ v, has a similar scaling to the humidity, and from Equation (5.10.)

So far, three non-dimensional parameters ε 1, ε 2 and ε 3 (Table 3), and one non-dimensional scaling magnitude θ* (Table 2) have been introduced, of which only ε3 is very-small compared to unity. To leading order in the small parameter ε3, the air-density gradient is

from which it follows that decreases in density with height are associated with 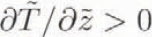 , and vice versa. In the latter case,
 , the air column is unstably stratified, which, if the motion was not constrained to the vertical, could convectively overturn. Reference Palm and TveitereidPalm and Tveitereid (1979) concluded theoretically that convection could only take place when extreme forcing was applied to old coarse-grained snow. However, Reference Sturm and JohnsonSturm and Johnson (1991) have observed almost continuous natural convection in the dry sub-Arctic snow. The conditions under which convection actually takes place are still a topic for debate but this one-dimensional treatment ignores the effects of convection. This restricts the applicability of the model but we believe that the balances described still hold for a wide range of snow covers.
Magnitudes used in the scaling argument

Non-dimensional parameters and their magnitudes

The vapour velocity is scaled to be consistent with the vapour-density concentration-gradient term in Equation(5.6),

although the latter estimate, for the diurnal time-scale, represents the most extreme forcing scenario. Hence, the Darcy drag terms, in Equations (5.4) and (5.5), between the matrix and the vapour are of order  , which are small compared to the gravitational body forces, of magnitude
 and
 , respectively. We assume an air-velocity scaling of the form

where the magnitude  has still to be determined. If the air Darcy drag in Equation: 5.5 (has the magnitude of the gravity term, then
 but we must also seek consistency with the mass balance in Equation (5.3). With Equation (6.11) and the density scaling in Equation (6.6), to leading order in the moderately small parameter θ*, Equation (5.3) becomes

Now, with the above  for the seasonal and diurnal scalings, both exceeding (θ*)
−1, so Equation (6.12) then has a consistent leading-order approximation

with a solution that is a function of time only, namely

In addition, we require that at some depth,  say by choice of origin, the pack becomes impermeable and
 . Applying this boundary condition, we find that
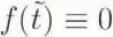 , which in turn implies that to leading order
 throughout the whole of the air column. That is, the Darcy drag does not contribute to the leading-order balance in Equation (5.5), so the above estimate of
 is not valid.
The velocity magnitude  is not then set by the momentum balance at all, which must be a pressure-gradient gravity balance, but by a balance between the two terms in the leading-order mass-balance Equation (6.12). We suppose that the motion is driven by the surface conditions and not dominated by the initial porosity gradients. Then, if surface-pressure forcing dominates,

and, since the surface-pressure forcing is independent of  , the surface velocity is given by

Therefore, since for a snow depth 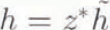 , the scaled surface velocity
 is order unity by construction, surface-pressure forcing induces a velocity magnitude

for the respective seasonal and diurnal time-scales and a snow depth of 8 m. Alternatively, if thermal effects dominate, the major contributions to the mass-balance Equation (6.12) are

The third term is of magnitude  which is
 larger than the second term; therefore, the leading-order balance lies between the third and first terms, implying, if we assume T
d = T*, the respective velocity magnitudes

Then, for both seasonal and diurnal temperature forcing, the velocity magnitude  given by the expression (6.19) is approximately 10−8m s−l. which is also that given by seasonal pressure forcing, but for diurnal pressure forcing there is a greater magnitude
 . Recalling the definition of ε2, the estimate (6.17) is
 which can be greater if p* is greater than the assumed 4 × 10³ Pa and/or t
+ is less than t
d = 2 × 10⁴s. We see now that for both seasonal and diurnal
 estimates, the Darcy drag in Equation (5.5) is less than the gravity force, so that the latter must balance the pressure gradient. If a pressure forcing increases
 so that the drag exceeds the gravity force, and balances the pressure gradient, then our thermally motivated scaling is inappropriate. Reference ColbeckColbeck (1989) has investigated wind-pumping, which is such a process, with the assumptions of constant temperature and porosity. The present model and illustrations apply to a different set of applications of equal importance and complementary to those of Colbeck.
We now adopt the expression (6.19) for  which allows seasonal and diurnal temperature forcing but excludes diurnal and more rapid pressure forcing.
In the ice-momentum balance Equation (5.4), the gravitational force ρ
I
g, of order 104kg m−2 s−2, is largest in magnitude, and the first term of the Darcy drag contribution 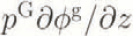 is of comparable magnitude if there are significant changes of porosity with depth. The ice-pressure gradient must, therefore, balance the gravitational force and, anticipating that the surface-boundary condition requires the intrinsic ice pressure to equal the atmospheric pressure, a scaling of the form

is suggested, where p
G is given by Equation (6.5). Note that the leading-order drag term 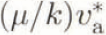 in Equation (5.4) is of order 10−4 kg m−2 s−2 for the estimate (6.19) of
 which is negligible compared to the gravity term p
I
g ~ 104 kg m −2 s−2.
The rate of mass supply miv is scaled by

where the vapour transport by diffusion in Equation (5.2) implies a magnitude

It is worth pointing out that the latent-heat term m
iv
L
iv in the energy-balance Equation (5.7) does not exceed the magnitude of the assumed leading-order balance between local heating and conduction through the ice, on which the length scale z* is based in Equation (6.4). The local heating term is of magnitude 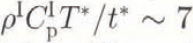 or 700 J m−3, whereas the latent heat is
 or 150 J m−3 s−1, suggesting that latent heats could con-tribute significantly in an extreme forcing scenario. Porosity changes in time arc of order m*t*/ρ
I by Equation (5.1), and the porosity is decomposed into a time-independent part
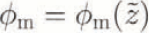 and a part
 ,

where

This suggests that diffusion alone cannot account for observations of density doubling in low-density snow-packs over a single time period 4t*, even in the most extreme diurnal temperature gradients, so compaction of the matrix or natural convection must be responsible for such rapid changes in porosity. Note, however, that the illustrations in section 10 demonstrate that porosity-increases are compounded every four time units, t*, and it is possible to obtain density doubling if diurnal forcing persists for several days. The magnitudes used to scale each of the physical variables are summarized in Table 2. It is worth noting that if there is no diffusion within the ice matrix, so D = 0, then the vapour and air velocities are equal, V
v = Va
, and the largest term on the lefthand side of Equation (5.2) is due to changes in humidity with time, 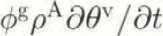 . This implies a rate of mass supply of magnitude

and the contributions to the latent heat are m*L
iv ~ 3 × 10⁻³ or 1.5 J m−3 s−1, which arc negligible compared to the estimates of the local heating on seasonal time-scales, but can make moderate contributions with diurnal forcing. In general, smaller-amplitude fluctuations with order-unity humidity changes through the non-linear temperature dependence in Equation (5.9), on either of the two time-scales, can have a moderate influence in the energy balance. However, in most situations, the no-diffusion scenario will produce a temperature distribution that is to all intents and purposes the same as that obtained by Reference Gray and MorlandGray and Morland (1994). Changes in porosity are estimated to be  in the no-diffusion case, by Equation (6.24).
At this point, the equations are still complete, and numerical solution of problems not conforming to the suggested scalings would simply involve gradients exceeding unity in magnitude. The intention, however, is to derive reduced equations which correctly describe the classes of problem used to motivate these scalings. If subsequent solutions reveal large gradients, then clearly the reduction is not applicable and the above system must be retained or reduced according to the new features. It was correctly questioned by a reviewer how the reduction to seasonal variations, implying very small velocity magnitudes, could take account of the much larger velocity associated with diurnal and storm-scale events commonly arising during the year. The prescription of seasonal forcing at the surface automatically ignores diurnal, or other short time-scale, forcing, so our later illustrations are unrealistic in that sense, but arc presented to demonstrate the simplification that can be achieved by identifying the leading-order balances appropriate to a given problem. The effects of diurnal forcing superposed on seasonal forcing can be investigated with the reduced equations based on the t d time-scale, but to extend the solution over the same period of years will require the number of time steps to increase by a factor 365, and the number of space steps by a factor of 20 to describe the same pack depth. The overall solution will depend on the (varying) amplitude of the diurnal variation about the seasonal forcing. Our present simple illustrations do not address the more realistic problem.
7. Dimensionless Equations
A system of dimensionless equations is now obtained by substituting the scalings argued in section 6 into the model equations of section 5. The leading-order balance between the dominant terms in each of these equations is of order unity and the importance of the remaining terms is measured by the size of the non-dimensional parameters, which are necessarily less than order unity. Thus, it is possible to make a clear assessment of which terms contribute to the balances and neglect those that do not to obtain a reduced system with a simplified structure. For notational consistency, the non-dimensional parameters ε 1–ε 7, of which ε 1–ε 3 have been introduced already, are given the same definitions as those in Reference Gray and MorlandGray and Morland (1994) and are summarized in the first half of Table 3.
Substituting the rate of mass-supply scaling in Equation (6.21) and the porosity scaling in Equation (6.23) into the ice mass-balance Equation (5.1), we obtain

The vapour mass balance (Equation (5.2)) can be considerably simplified by first substituting for the vapour velocity from Equation (5.6) to decompose the transport into the air-convection and diffusional terms and, recalling the expression (6.19) for  , it becomes

where the non-dimensional density in Equation 6.6) and porosity in Equation (6.23) are not substituted at this stage for notational compactness. The non-dimensional parameter

for both seasonal and diurnal forcing, indicating that the terms on the first line of Equation (7.2), which are associated with the humidity change due to local temperature change and air convection, arc less than order unity in magnitude, and the dominant balance lies between the mass transport from vapour diffusion and the rate of mass supply. Similarly, the air-mass balance in Equation (5.3) is

where the first term appears to be order  which is greater than unity. However, when the density is substituted from Equation (6.6) and the chain rule is applied, the density gradients are at most of order ε
1 and so the first term is in Fact order unity as required. Substituting the intrinsic ice-pressure scaling in Equation (6.20) and the vapour velocity in Equation (5.6) to simplify the Darcy drag term, the ice-momentum balance in Equation (5.4) reduces to

where the non-dimensional parameters

imply that all the terms that arise from substituting the Darcy interaction drags in Equation (3.9) arc extremely small, and to leading order the ice pressure increases hydrostatically with depth. Similarly, the composite gas-momentum balance relation in Equation (5.5) reduces to

where

The last two terms on the righthand side of Equation (7.7) are the Darcy drags experienced by the air and vapour as they pass through the matrix, and the non-dimensional numbers

indicate that the Darcy drag on the vapour is always negligible but the drag on the air can enter the lead-order balance on diurnal and faster surface-pressure forcing time-scales. In these non-dimensional equations, the vapour velocity has been substituted throughout, but, for completeness, the diffusion relation in Equation (5.6) reduces to

where

defines the ratio of the air velocity to the vapour velocity. Thus, the bulk air velocity is still much less than the diffusion velocity even in the latter case of large pressure variations on diurnal time-scales. The total energy balance in Equation (5.7) is

where the dominant balance is between the local heating in the ice and the thermal conduction through it. The greater ice density ensures that

and, therefore, local heating in the gas docs not contribute to the balances. Recalling the velocity scalings in Equations (6.17) and (6.19) for pressure-and temperature-driven scenarios on seasonal and diurnal time-scales, it is clear that the pressure working can reach

and can be important for pressure forcing on diurnal, or faster, time-scales but is not significant for the slow-pressure changes investigated here. Thermal conduction through the air is of minor importance in the leading-order balance since the ratio of thermal conductivities

The remaining non-dimensional parameters, which were not introduced in Gray and Morland’s (1994) theory, are

demonstrating that the local heating due to vapour diffusion, and the vapour-and ice-pressure working, are always small but that the latent heats can affect the energy balance.
Substituting the temperature, pressure and density-relations, in Equations (6.1), (6.5) and (6.6), respectively, into the ideal gas relation in Equation (5.8), we obtain

The vapour-density concentration is related to the humidity and intrinsic vapour density by Equation (5.10); substituting the humidity and partial vapour-density scalings, in Equations (6.7) and (6.8). and using Equations (3.4) and (6.2),

Similarly, the phase-equilibrium relation in Equation (5.9) becomes

where  and the non-dimensional parameter

is order unity. Note, that from Equation (7.19)

so the humidity is not sensitive to changes in surface pressure and, therefore, contributions to the rate of mass supply  , and hence to the latent heat due to pressure forcing are extremely small. However, thermal forcing produces order-unity changes. Thus, results obtained with surface-pressure forcing on seasonal time-scales with no surface-heat input are almost identical to those obtained in the simple two-constituent theory of Reference Gray and MorlandGray and Morland (1994). The non-dimensional parameters are summarized in Table 3.
8. Reduced Model
The physical equations of section 5 have been scaled to yield the equivalent order-unity dimensionless equations of section 7. No approximations have been made up to this point but it is clear that many of the terms with small non-dimensional parameters can be neglected to obtain an approximate reduced model with a greatly simplified mathematical structure. The reduced model for temperature forcing on seasonal and diurnal time-scales is now investigated. We have already demonstrated that, when no diffusion takes place, D = 0, or when the pressure changes on seasonal time-scales, that the model essentially reduces to the two-constituent theory of Gray and Morland (1994). The reduced model we describe is not intended to apply to the case of pressure forcing on diurnal or faster time-scales, where the Darcy drag and the pressure working become significant. The latter casts doubt on the validity of assuming both Τ and  are constant during wind-pumping (Reference ColbeckColbeck, 1989).
In order to have a dear understanding of what we mean by small, we define the small parameter δ to be the maximum magnitude of the terms that we consider to be small in the thermally driven problem:

Each variable  is then approximated by the first two terms of an asymptotic expansion in δ,

and substituted into the non-dimensional equations. Matching zero-and first-order powers in δ yields a leading-and first-order system of equations, which are accurate to order 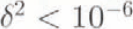 . The remaining parameters
 are less than unity but are retained, together with ε
19, which is order unity, as possible order-unity quantities. To leading order, the energy balance in Equation (7.12) is

Note that the pressure-working and convection terms involving the ice and gas pressure and the gas velocity do not enter the leading-order balance, so this is an equation for  if
 is known. Thus, given
 , the humidity relation in Equation (7.19) to leading order is

allowing  lo be computed. Similarly, the leading-order partial vapour density pet unit gas volume in Equation (7.18) can also be computed from

The leading-order air-mass balance in Equation (7.4) becomes

which, given  and
 is an equation for the leading-order gas velocity
 . The leading-order vapour mass balance in Equation (7.2) becomes

which determines the rate of mass supply  . This forms a closed set of five Equations (8.3)–(8.7), for the variables
 that completely uncouples from the remaining variables. An iterative approach is used to solve this sub-set of the problem. An appropriate guess is made for
 to enable the energy balance in Equation (8.3) to be solved for
 , and then
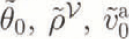 and an updated
 are computed from the balances. The updated
 is then used to re-initialize the problem and the process is repeated until some convergence criterion is satisfied. Note that the rate of mass supply from the air transport in Equation (8.7) is of order
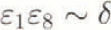 and so could have been neglected, although it is retained here. If neglected, then the air velocity,
 , is no longer needed to compute
 and the velocity balance in Equation (8.6) does not enter into the iteration sequence, which reduces to a system of four equations.
Once the leading-order temperature, humidity, vapour-density concentration, velocity and rate of mass supply have been determined to a sufficient accuracy, the remaining variables can be computed from their leading-order balances. The leading-order gas-momentum balance in Equation (7.7) is an equation for the pressure  ,

which allows the density to be calculated from the leading-order perfect gas relation in Equation (7.17),

The leading-order ice-mass balance in Equation (7.1) keeps track of the change in porosity,

and the leading-order ice-momentum balance in Equation (7.5) reduces to

which determines the ice pressure  . Finally, the vapour velocity in Equation (7.10) is determined by

All the leading-order variables have now been determined. The first-order equations follow the same pattern as the leading-order equations but are considerably more complex. The equations for the variables  once again uncouple and an iterative procedure is required to determine them to a specified accuracy. The remaining variables can then be computed from the balances. The correction from the first-order scheme is of order
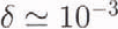 and for all practical cases the leading-order Equations (8.3)–(8.12) are adequate.
9. Initial Values and Boundary Conditions
The non-dimensional leading-order Equations (8.3)–(8.12) require four initial conditions and seven boundary conditions in order to compute a solution. We shall assume that at the base of the snowpack, which lies at  , the vapour and air velocities are identically zero,

and to avoid the inconsistency pointed out at the end of section 5 we shall restrict our attention to a zero temperature-gradient condition at this level,

The surface of the snowpack is subjected to atmospheric fluctuations, determined by the prescribed function ph in the pressure scaling in Equation (6.5), so the third boundary condition requires that

Similarly, the intrinsic pressure exerted on the ice constituent at the snow surface equals the intrinsic gas pressure, so by Equation (6.20) the leading-order non-dimensional ice pressure is also identically zero,

Pressure forcing on seasonal time-scales and the no-diffusion scenario have been shown to reduce to the two-constituent theory of Reference Gray and MorlandGray and Morland (1994), and we therefore examine the thermal problem in isolation. It is driven by a sinusoidal temperature gradient at the snow surface, of the form

where the normalization factor a ensures that the maximum non-dimensional temperature is order unity and where the surface pressure is identically zero,

Note, that this does not necessarily imply that there is no net increase in the total energy of the pack. The six boundary conditions given by Equations (9.1)–(9.6) are now supplemented by four initial conditions. We assume that the non-dimensional temperature is initially uniform at its mean value

and the surface pressure

The initial humidity is then determined by Equation (8.4) but the initial porosity is required to compute the velocity from Equation (8.5). In these results, we assume the time-independent  in Equation (6.23) to have the uniform value

and the porosity perturbation  to be initially zero

10. Illustrations
A numerical method has been developed to solve the leading-order system of Equations (8.3)–(8.12) with the associated initial conditions and boundary conditions described in section 9. The algorithm has been tested against the two-constituent analytic solutions (Reference Gray and MorlandGray and Morland, 1994) and reproduces the same results as an independent algorithm in the no-diffusion scenario. A cycle is defined as four non-dimensional time units and is the time necessary for the sinusoidal surface-temperature gradient to repeal itself. Solutions are presented for a total of four cycles, which corresponds to 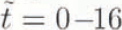 , to illustrate the evolution of the balances from cycle to cycle, and for a snow depth
 units.
The computed temperature is illustrated in Figure 1. The beginning of the cosine temperature-gradient cycle lies at  when
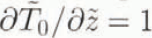 , and the temperature lags the gradient by half a time unit at the surface. As heat is conducted down, the temperature amplitude decays and its fluctuation lags behind that at the surface, until at the base of the snowpack the temperature changes only slightly from the mean. The latent heat, associated with the change of phase from water vapour to ice, causes a slow steady rise in the mean temperature in the snow. Initially, the temperature rises approximately 2% even cycle but this decreases to about 1% every cycle after 16 time units. The compounded effect of these small rises in temperature over each cycle is to raise the mean temperature by about 7%. Longer integrations suggest that by 32 time units the temperature increase per cycle is about 0.5%, and that the mean temperature is raised by 10%. We shall explain why later.
Non-dimensional temperature contours.

The humidity, a new feature, is illustrated in Figure 2, and is, as one would expect, largest in the warmer regions of the snowpack. Thus, the maximum humidity is reached at the surface of the snowpack and, like the temperature, its intensity decreases with increasing depth and it is phase-shifted in time. The slow increase in mean temperature also leads to a corresponding rise in the mean humidity. The vapour-density concentration has a similar behaviour to the humidity and is not illustrated but, to leading order in ε1, Equations (8.4) and (8.5) imply that

Thus, the largest gradients of the vapour-density concentration with temperature occur when the temperature is at its lowest value 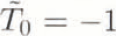 .
Non-dimensional humidity contours.

The air velocity is again similar in form to the results from Reference Gray and MorlandGray and Morland (1994) without humidity effects. The dominant balance in Equation (8.6) lies between the velocity divergence and the temporal changes in temperature,

Integrating with respect to  and applying the boundary condition (9.1) implies that the air velocity

The air-velocity cycle, illustrated in Figure 3, has the same features as the temperature cycle but it is phase-shifted ahead in lime by half a time unit. Thermal expansion, therefore, causes die air to be transported down through the matrix as the snowpack cools and is pumped back up as the pack warms, which is intuitively correct. At the end of each cycle, approximately the same amount of air resides within the matrix and so, to conserve mass, the velocity magnitude of the outgoing air when the air is light and hot is 10% greater than that of the incoming air when the air is cold and dense. The vapour velocity is balanced by the vapour-density concentration gradient in Equation (8.12),

by approximation (10.1). Therefore, the vapour velocity also behaves like the temperature gradient but it diffuses up through the snowpack as the air moves down and vice versa, as illustrated in Figure 4. Intuitively, this is also the correct behaviour, as the vapour moves from hotter regions, where the vapour-density concentration is higher, to colder regions, where the vapour-density concentration is lower, in an attempt to smooth away the concentration gradients. The largest vapour velocities are attained during the colder periods when the derivative (10.1) is larger. Note that, although the air-and vapour-velocity magnitudes appear to be similar in non-dimensional variables, their physical magnitudes given by the scalings in Equations (6.10) and (6.19) are very much different.
Non-dimensional air-velocity contours.

Non-dimensional vapour-velocity contours.

The next new feature is the rate of mass supply shown in Figure 5. The dominant balance in Equation (8.7) lies between the rate of mass supply and the vapour-diffusion terms, and, by approximation (10.1), this behaves like

Hence, as the temperature is increasing towards its maximum, 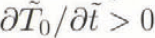 and
 is positive, vapour condenses into ice, and then as the temperature passes through its maximum and begins to decrease,
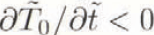 and
 is negative, ice is sublimed into vapour. Away from the temperature maximum, the vapour-density concentration is so low that hardly any phase change takes place.
Non-dimensional rate of mass supply contours.

The porosity increases, illustrated in Figure 6, indicate that with the particular temperature-gradient boundary condition (9.5), there is a net accretion of ice through phase change over each cycle, which decreases the porosity. While the amount of phase change is not enough to double the snow density in one cycle, ten, or so, cycles on diurnal time-scales could achieve this. It follows that over each cycle there is a net release of latent heat into the system, warming the snowpack, which could ultimately raise the maximum temperature to freezing point and water would then be produced. It should be noted, however, that the vapour which condenses on to the ice comes Crom outside the snowpack, as the large positive  correlates exactly with the diffusive influx of vapour, and it has implicitly been assumed that the atmosphere can supply the required water vapour, and this is not the case, either Equation (4.8) must be violated or there is a negative feed-back mechanism requiring different interface conditions between the snow and atmosphere. The feed-back cycle starts with an increase in mean snow temperature, which is associated with the latent-heat release as water vapour condenses, a net warming of the atmosphere results and sublimation of the surface ice makes up the shortfall in atmospheric humidity. Thus, the latent heat required by the sublimation process cancels out the latent-heat release on condensation within the pack and the mean temperature is stabilized. This complex coupling is beyond the scope of this paper, as it requires the treatment of the snow surface as a moving non-material boundary.
Non-dimensional porosity-perturbation contours.

The leading-order non-dimensional pressure in the gas and the ice have a simple hydrostatic distribution and at e not illustrated, Similarly, the air density behaves in exactly the same fashion as described by Reference Gray and MorlandGray and Morland (1994) and is not illustrated.
11. Conclusions
An interacting continua theory provides a rational framework in which to describe the motion, stresses and thermal effects within a natural dry snowpack. Mixture theory lays down mass, momentum and energy-balances for each of the three constituents: ice, water vapour and air, in terms of partial variables, including mechanical and thermal interactions between constituents. In addition, 11 constitutive properties and three external energy supplies must be prescribed before a closed system of equations is obtained. This approach highlights the assumptions and points to areas where the physics is poorly understood. It demonstrates clearly that phase-equilibrium thermodynamics is not consistent with all plausible basal-boundary conditions, for example, non-zero temperature gradient and zero vapour velocity, which suggests that, in general, the vapour diffusion or equilibrium humidity relation, or both, are not applicable close to an impermeable boundary. Except for a very special class of boundary-conditions, which are investigated here, the equilibrium density relations used widely by other authors (e.g. Reference JordanJordan, 1991) are violated, and then non-phase equilibrium theory must be adopted.
Non-dimensional analysis is used to draw out the dominant balances in each of the equations for seasonal and diurnal surface pressure and thermal forcing. It is assumed that the snowpack is pre-compacted so that the matrix is stationary and there is no contribution to the gas velocities from fluid withdrawal due to compaction. Air-velocity magnitudes are typically of order 10−7 ms−7 for thermal forcing and seasonal pressure forcing but are of order 2 × 10⁻⁵ ms−1 for diurnal pressure forcing. Water vapour occupies only about 1% of the pore space and diffuses easily through the matrix, reaching velocities of 3 × 10⁻⁵ or 10−3 ms−1 for thermal forcing on seasonal and diurnal time-scales, respectively. However, the vapour-density concentration is independent of pressure, so the concentration gradients, which would drive the vapour relative to the air, are not present and the gas moves en masse. Seasonal pressure forcing, therefore, reduces to the two-constituent theory of Reference Gray and MorlandGray and Morland (1994), whilst thermal forcing in the absence of diffusion has only a moderate influence on the balances.
Small parameters in the non-dimensional equations are exploited to yield a rational leading-order reduced model, applicable to thermal forcing and seasonal pressure forcing but not diurnal pressure forcing. The particular surface-temperature gradient boundary condition, considered in the illustrations, implies that water vapour is entrained from the atmosphere during warm periods and, since the humidity is greatly reduced when the vapour is expelled, there is a net gain in the ice-volume fraction over each cycle. Thus, snow-density doubling in high-porosity snowpacks can be achieved over a period of several days with thermal forcing on diurnal time-scales. The latent-heat release associated with the condensation of vapour into ice makes a significant contribution to the energy balance, raising the temperature at each cycle. Meltwater production will result if the temperature reaches the freezing point. It is postulated that either a negative feed-back through atmospheric coupling, which transports mass from a moving surface interface into the pack, or violation of phase-equilibrium thermodynamics, will stabilize the mean temperature. Implicit inclusion of the latent heat by combining it with the conduction in the energy balance, to obtain an effective thermal conductivity (e.g. Reference JordanJordan, 1991; Reference BaderBader and Weilenmann, 1992), is not supported by the leading-order approximations derived here.
Finally, it is important to note that the air is unstably stratified, as cold dense air overlies lighter warmer air deep in the snowpack for half of each full cycle, and, if the gas motion were not constrained to one-dimension, it could convect, transporting large amounts of heat and mass up through the pack.
Acknowledgements
This research has been supported by the U.K. Natural Environment Research Council. It has benefited significantly from the detailed comments of the reviewers and through discussions held with Dr S. Colbeck.



