





Population ageing is a global phenomenon, driven by increasing life expectancy and declining fertility rates. In the United Kingdom, for example, nearly one in seven people is expected to be over 75 years old by 2040(1). Ageing is often associated with changes in body composition, including a loss in muscle mass and muscle strength, called sarcopenia, and an increase in body fat mass(Reference Ribeiro and Kehayias2). Sarcopenia and obesity can result from natural ageing processes, an inadequate diet and a sedentary lifestyle, and a combination of both can have serious implications for overall health(Reference Wei, Nguyen and Zhang3). Sarcopenia is a consequence of increased inflammation and age-related endocrine changes(Reference Wei, Nguyen and Zhang3) and is linked to an array of health risk factors, including falls, disability, loss of independence(Reference Dodds, Roberts and Cooper4) and mortality(Reference Brown, Harhay and Harhay5). Obesity is a major health risk underpinning the development of many non-communicable diseases, such as cancer(Reference Bhaskaran, Douglas and Forbes6), CVD and all-cause mortality(Reference Powell-Wiley, Poirier and Burke7).
The occurrence of both sarcopenia and obesity has been defined as sarcopenic obesity(Reference Wei, Nguyen and Zhang3). Sarcopenic obesity may have important public health consequences including frailty, disability, insulin resistance, CVD and cancer(Reference Ji, Li and Ma8). Furthermore, the progression of sarcopenic obesity contributes to increased levels of proinflammatory cytokines(Reference Batsis and Villareal9), such as TNF, and lower levels of anti-inflammatory cytokines, such as IL-6(Reference Batsis and Villareal9), in visceral fat, which may independently contribute to an increased risk of CVD(Reference Schrager, Metter and Simonsick10). Over time, both the lack of physical activity and the consumption of unhealthy diets could significantly contribute to the development of sarcopenic obesity(Reference Pinckaers, Domić and Petrick11).
Dietary protein sources, timing of intake and specific amino acid composition have been linked to muscle mass and strength(Reference Pinckaers, Domić and Petrick11). Consumption of animal-sourced protein, compared with plant-based protein, induced a higher stimulation of muscle protein synthesis(Reference Pinckaers, Domić and Petrick11), and improved physical function in older people(Reference Deutz, Bauer and Barazzoni12), albeit that another study found a positive association between the intake of plant-based protein and muscle mass, strength and functional performance(Reference Gazzani, Zamboni and Spelta13). A recent systematic review and meta-analysis corroborates these findings, indicating a small beneficial effect of animal protein compared with plant protein on muscle mass, whereas both animal and plant protein improved muscle strength and physical performance. Furthermore, soy protein isolates and concentrates were equally effective as milk protein in preserving or enhancing muscle mass in older adults, albeit that more trials are needed in this area(Reference Reid-McCann, Brennan and Ward14). Dietary protein intake is therefore important to consider for the prevention and treatment of sarcopenia(Reference Morris, Cater and Green15), and sarcopenic obesity, especially since in the UK, 36 % of those aged 65–89 years old fail to consume the recommended protein intake of 0·75 g protein per kg body weight per day(Reference Morris, Cater and Green15). However, we lack a larger-scale investigation to assess the association between dietary protein intake and muscle mass, obesity, and sarcopenic obesity.
The main aim of this study, therefore, was to determine whether dietary protein intake, and the type of protein, is associated with sarcopenic obesity in an apparently healthy middle- and older aged cohort. We also assessed whether this association is dependent on socio-demographic factors.
Methods
Study population
This study used data from the Norfolk component of the European Prospective Investigation into Cancer and Nutrition (EPIC-Norfolk) study. EPIC study was approved by the Norfolk District Health Authority Ethics Committee (98CN01)(Reference Day, Oakes and Luben16). Written informed consent was provided by 30 445 participants aged between 39 and 79 years who were registered with 35 medical practices (121 general practitioners) in Norfolk, UK(Reference Day, Oakes and Luben16). 25 639 participants attended an appointment of first (baseline) health checks (1HC) between 1993 and 1997, whilst 15 786 participants aged 42–82 years attended the second (follow-up) health check (2HC) between 1997 and 2000, where measures of body composition were performed(Reference Day, Oakes and Luben16). The age range of participants in this study was 39–79 years.
Anthropometric measurements
Height was measured to the nearest millimetre, using a free-standing stadiometer, while weight was measured to the nearest 0·1 kg using calibrated digital scales, with participants wearing light clothing and no shoes(Reference Day, Oakes and Luben16). BMI was calculated from weight in kilograms divided by height in meters squared (kg/m2)(Reference Day, Oakes and Luben16). At the 2HC, body fat was measured using a bioelectrical impedance analysis machine (TANITA Body Fat Monitor/Scale TBF-531), with individuals in the standing position(Reference Day, Oakes and Luben16). Bioelectrical impedance analysis was carried out using a previously validated standardised technique (Bodystat, Isle of Man, UK)(Reference Shanholtzer and Patterson17).
Definition of sarcopenic obesity
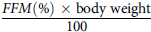
No data on skeletal muscle mass are available from the EPIC cohort. Therefore, fat-free mass (FFM) (kg) was used as a proxy for skeletal muscle mass. Fat mass (%), measured by bioelectrical impedance analysis, was recorded, and from this, FFM (%) was calculated as 100 minus fat mass (%). Absolute FFM (kg) was then estimated using the formula:
 ${{FFM\left( \% \right)\; \times \;{\rm{body}}\;{\rm{weight}}} \over {100}}$
, and we subsequently standardised FFM for BMI as
 ${{FFM\;\left( {{\rm{kg}}} \right)} \over {\;BMI\;\left( {{\rm{kg}}/{{\rm{m}}^2}} \right)}}$
. The FFMBMI (kg/kg/m2) ratio was previously validated and recommended as an index,(Reference Studenski, Peters and Alley18) which scales for the effects of body size on the proportion of FFM(Reference Welch, Skinner and Hickson19). For this study, the cut-off for sarcopenia was defined as the sex-specific 20th percentile of FFMBMI(Reference Newman, Kupelian and Visser20,Reference Delmonico, Harris and Lee21) . The cut-off point for sarcopenia in our study was ≤ 2·09 (kg/(kg/m2)) for men and ≤ 1·35 (kg/(kg/m2)) for women. Obesity was defined as BMI ≥ 30 (kg/m2). Sarcopenic obesity was defined as the coexistence of sarcopenia and obesity, according to these thresholds. All data used to calculate sarcopenic obesity (e.g. weight, height and fat mass %) were collected at the 2HC (follow-up).
Protein intake assessment
Dietary assessments were performed at 1HC (baseline). Participants were asked to complete a 7-day diet diary, which was used to calculate total protein intake(Reference Bingham, Welch and McTaggart22). They also completed an FFQ, from which protein sources were determined(Reference Bingham, Welch and McTaggart22). EPIC used Data Into Nutrients for Epidemiological Research software to calculate protein quantities from twelve sources(Reference Bingham, Welch and McTaggart22). For our analysis, we reclassified the different protein sources into three main categories: animal-derived protein (terrestrial and marine animals), plant-derived protein and mixed protein (which represents composite dishes of unknown quantities of animal/plant origin) (see online supplementary material, Supplemental Table 1). Because it was not possible to directly estimate animal and plant protein intake from the 7-d diet diary data, we estimated animal and plant protein intake by firstly calculating total protein intake from day diet diary, then determining the proportional contribution of plant v. animal protein in the diet using FFQ data, and finally applying these proportions to total protein intake, and expressing data in g/kg body weight/d.
Other variables
At 1HC, information on health and lifestyle, including smoking, alcohol consumption, social class, education levels, physical activity, use of steroids and statins, and menopausal and hormone replacement therapy status for women, were collected through questionnaires(Reference Day, Oakes and Luben16). Dates of hospital admissions due to slipping, tripping, stumbling and falls were collected using death certificate data and hospital record linkage(Reference Day, Oakes and Luben16). Smoking was assessed with two yes/no questions on past and current cigarette use. Alcohol consumption was reported as the number of drinks per week, categorised into four groups; one unit (≈8 g) equalled a half pint of beer, a glass of wine, or a single measure of spirits, and total weekly intake was calculated as the sum of units. Habitual physical activity over the past year was assessed using a validated questionnaire. Work activity was classified as sedentary, standing, physical or heavy manual, and recreational activity (cycling, swimming and jogging) was reported in hours per week for winter and summer, and averaged to daily hours. Participants were categorised as inactive, moderately inactive, moderately active or active based on a combination of work and recreational activity(Reference Day, Oakes and Luben16).
Statistical analysis
We used R programming (version 2023.6.0.421) to analyse the data. All variables of interest were analysed descriptively. Continuous variables were tested for normality and, as they were not normally distributed, they were analysed using the Kruskal–Wallis test and stratified by the presence/absence of sarcopenic obesity, sarcopenia alone and obesity alone. χ 2 tests were used to describe categorical variables. Data were expressed as median and interquartile range (IQR1, IQ3) for continuous variables and numbers and percentages for categorical variables. Dietary intake was assessed at baseline, while body composition measures (fat mass percentage and BMI) used to define the prevalence of sarcopenic obesity and obesity were assessed at the 2HC. Therefore, the present analysis examined prospective associations between baseline dietary protein intake and the prevalence of sarcopenic obesity at follow-up. As the outcome was binary, e.g. the presence of sarcopenic obesity, measured at follow-up, with time-to-event information not being available, we chose to fit a multivariable logistic regression to test the relationship between total protein intake, animal- and plant-derived protein intake and the prevalence of sarcopenic obesity at follow-up. Mixed protein sources were not included in the analysis as they reflected composite dishes, and it was not possible to determine the protein sources in each dish. We tested the assumption of linearity in the logit for continuous variables. Pearson correlation coefficients were calculated between all independent variables to assess collinearity, using pairwise complete observations to handle missing data (see online supplementary material, Supplemental Figure 1), which resulted in a correlation between total protein intake (g/kg) and energy intake (kcal/d), but not between animal and plant protein intake (g/kg) and energy intake (kcal/d). Therefore, we performed multivariable logistic regression with energy intake as a variable in the regression model to test the relationship between animal- and plant-derived protein intake and the prevalence of sarcopenic obesity, whilst energy intake was omitted from the regression model to test the relationship between total protein intake and the prevalence of sarcopenic obesity. Assumption of influential outliers for the regression models was also tested. We fitted the model by analysing the associations of the different socio-demographic factors and the outcome. Confounders that were relevant, or were significantly associated with sarcopenic obesity prevalence, such as sex, smoking status, social classes, education levels, physical activity, diabetes and bronchitis/emphysema, were included in the final model. P values < 0·01 were considered statistically significant after application of the Bonferroni correction.
Results
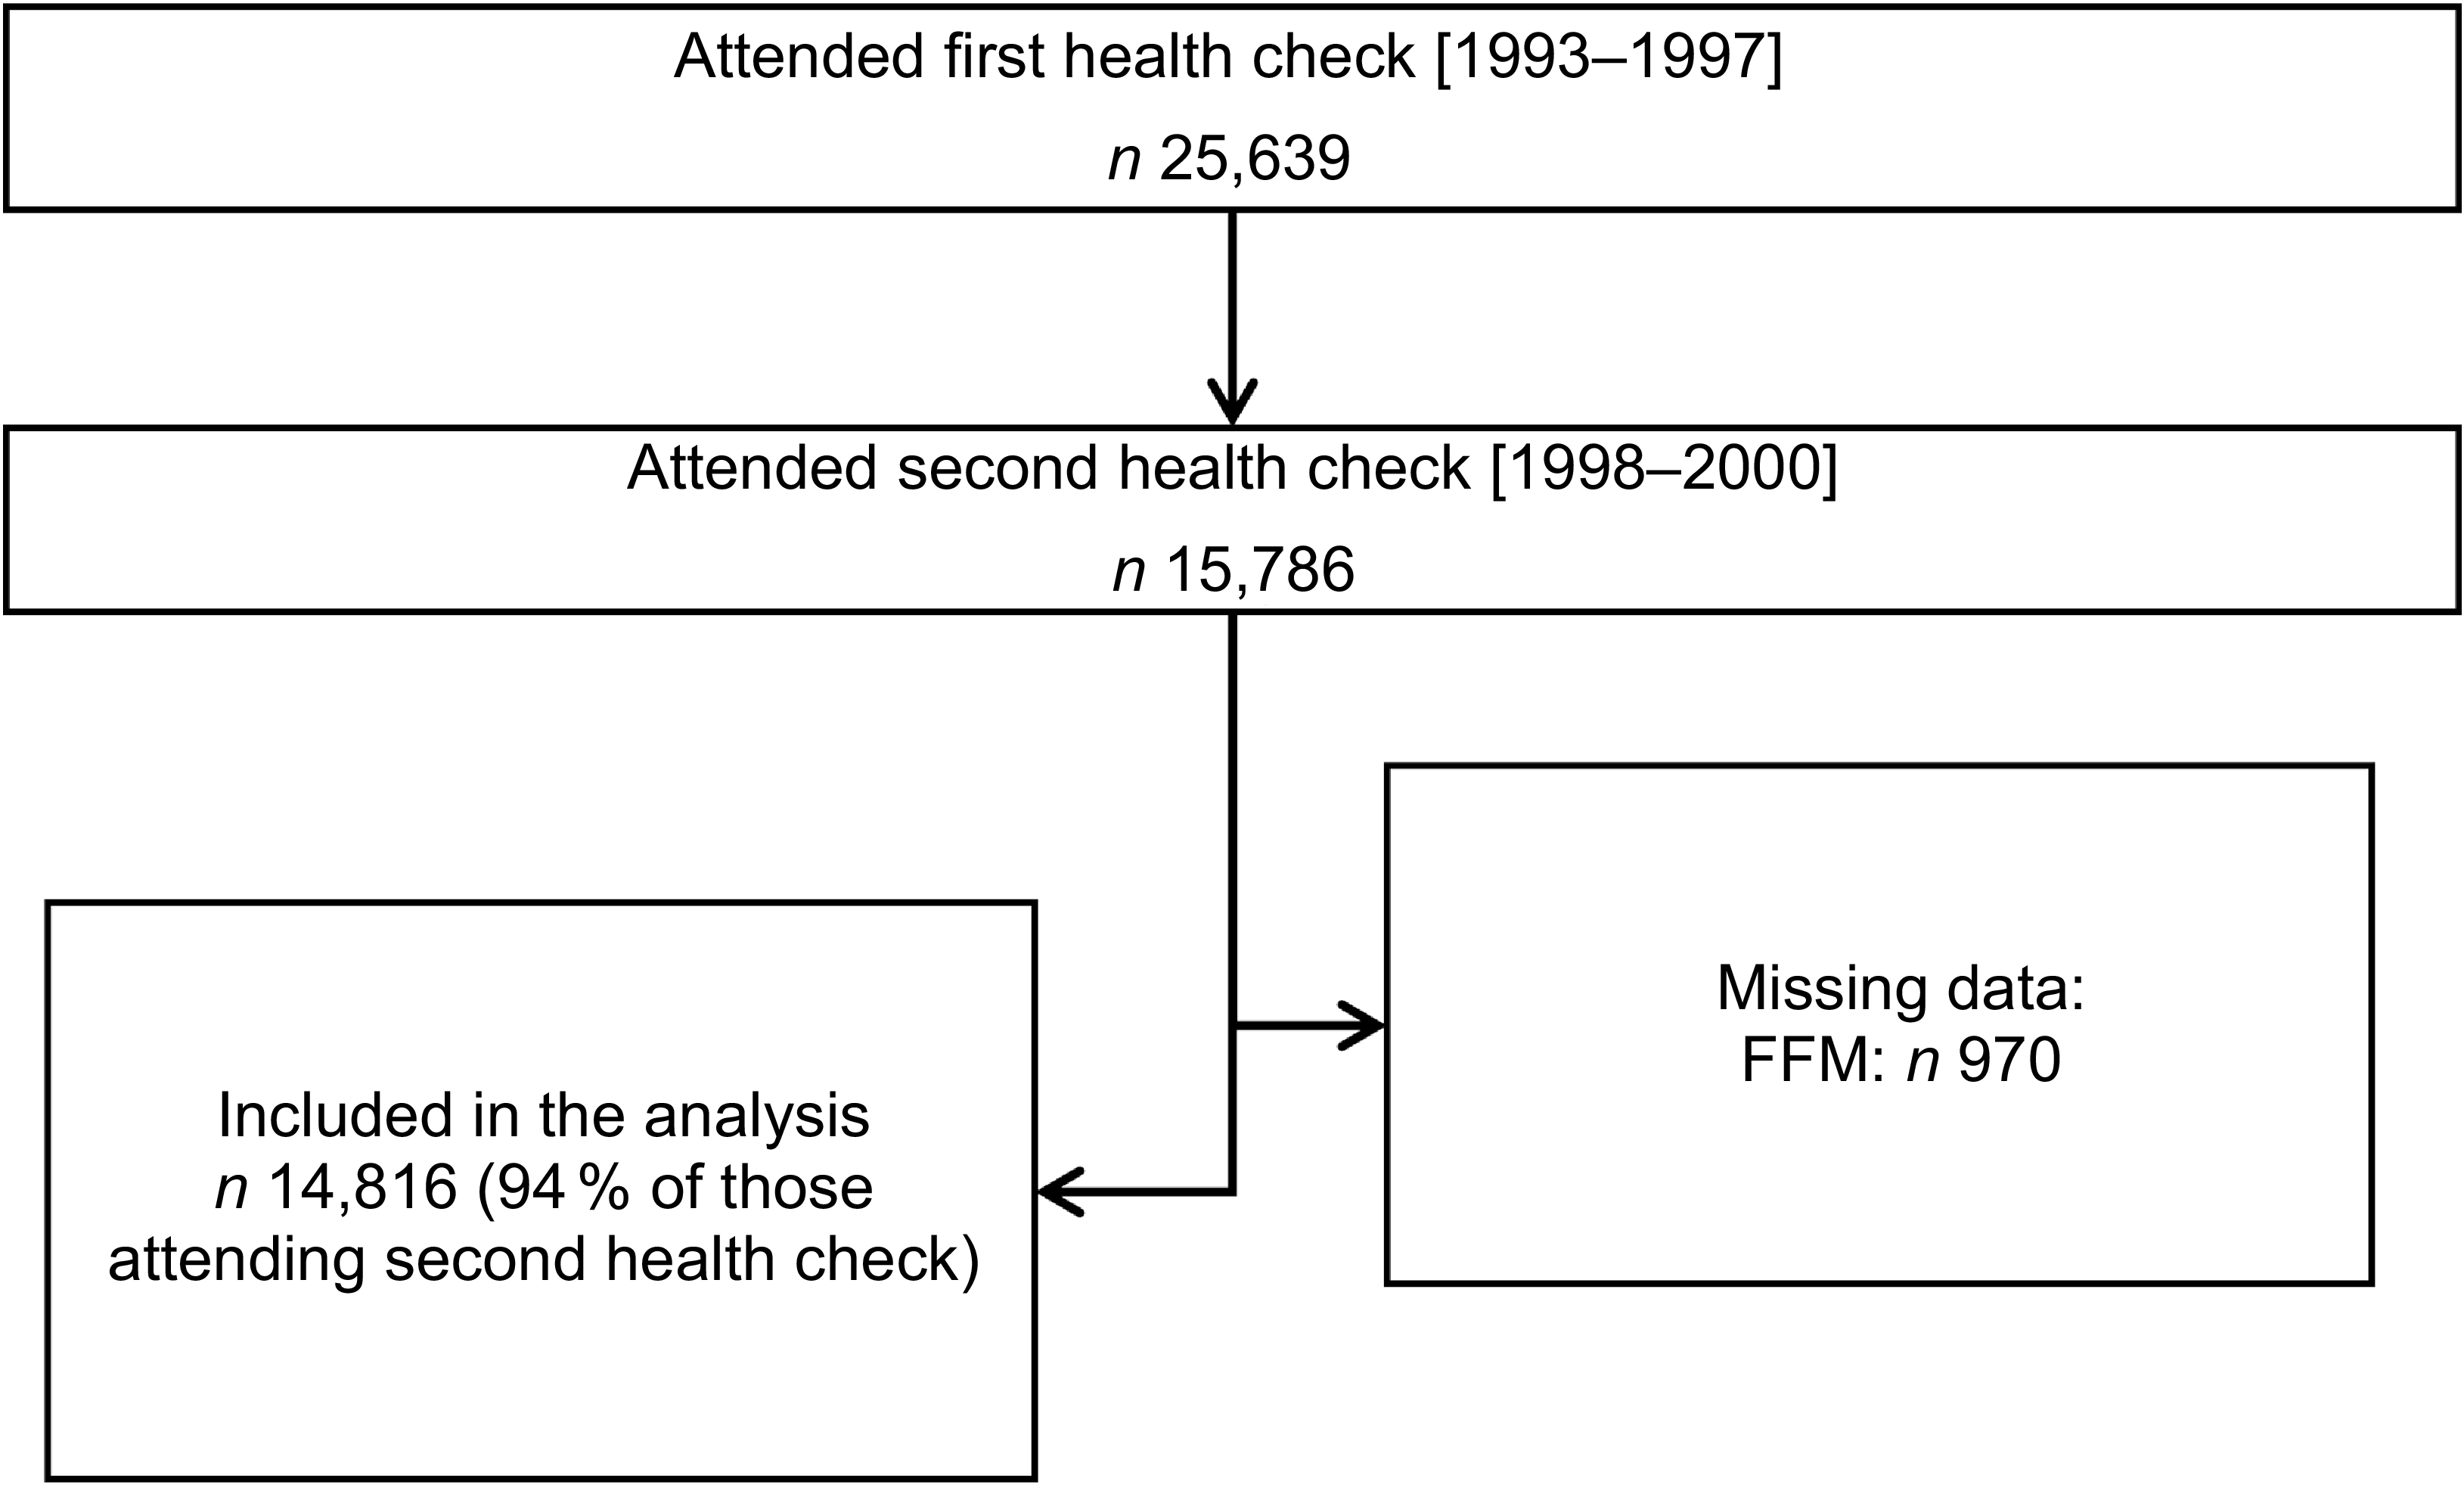
After excluding 970 participants with missing information on FFM (kg), a total of 14 816 participants in the EPIC-Norfolk cohort were included in the analysis (Figure 1). At baseline, median total protein intake was 0·99 g/kg body weight per day (IQR: 0·84–1·16), corresponding to 15 % of total energy intake (IQR: 13·5–16·7 %). Of the total protein intake, the median contribution from animal sources was 63 % (IQR: 50–79 %), from plant sources 34 % (IQR: 27–43 %), and from mixed or unclassified sources 11 % (IQR: 8–15 %).
Flow chart of participants recruited into the European Prospective Investigation of Cancer cohort study, and participants whose data were used for analysis.

The characteristics of participants with sarcopenic obesity, with sarcopenia, with obesity and without sarcopenia/obesity are shown in Table 1. Of the total population, 10·6 % had sarcopenic obesity. Women had a significantly higher prevalence of sarcopenic obesity than men (11·9 v. 8·9 %, P < 0001). FFMBMI, used as a proxy for sarcopenia, differed significantly across groups, with those having sarcopenic obesity and sarcopenia having the lowest median for FFMBMI, and the group with no sarcopenia or obesity having the highest values, and women with sarcopenic obesity having a significantly lower median of FFMBMI than men with sarcopenic obesity (1·17 v. 1·93 kg/kg/m2, respectively, P < 0·001). Women with sarcopenic obesity also had a significantly higher median BMI than men (33·2 v. 32·2 kg/m2, respectively, P < 0·001). Median dietary intake of total, animal and plant protein intake was significantly lower in those with sarcopenic obesity compared with those without sarcopenia and obesity (0·80 v. 1·04, 0·51 v. 0·66 and 0·25 v. 0·35 g/kg body weight/d, respectively, all P < 0·001). Furthermore, median dietary intake of total, animal and plant protein was significantly lower in those with obesity compared with those without obesity, whereas intake of total and plant protein was significantly lower in those with sarcopenia compared with those without sarcopenia (all P < 0·01) (Table 1). Participants with sarcopenic obesity also had a significantly higher age and lower levels of physical activity levels compared with those without sarcopenia and obesity (Table 1).
Characteristics of participants with no sarcopenia/obesity, sarcopenia alone, obesity alone or having sarcopenic obesity in the EPIC Norfolk study (n 14 816) at baseline between 1993 and 1997

Table 1. Long description
The table presents the characteristics of participants categorized into four groups: no sarcopenia/no obesity, sarcopenia alone, obesity alone, and sarcopenic obesity. The table has 12 columns and 40 rows, including headers and row labels. The columns are labeled as follows: Characteristics, No sarcopenia, no obesity (n 10 906), Sarcopenia (n 1349), Obesity (n 995), Sarcopenic obesity (n 1566), and P value. The rows include various characteristics such as sex, age, BMI, FFM, FFM/BMI, total energy intake, total protein intake, animal-derived protein intake, plant-derived protein intake, total protein intake as a percentage of energy, alcohol consumption, smoking status, social classes, education levels, physical activity levels, menopausal status, hormone replacement therapy, drug use, and self-reported health conditions. Each row provides data for each group, including median values and interquartile ranges (IQR) where applicable. Notable trends include significant differences in sex distribution, age, BMI, FFM/BMI, dietary intake, and physical activity levels across the groups. For example, women have a higher prevalence of sarcopenic obesity compared to men. Participants with sarcopenic obesity tend to have lower protein intake and higher BMI compared to other groups. The table also highlights differences in education levels, social classes, and smoking status among the groups.
Values are median and interquartile range (IQR1, IQR3) for numerical variables and n and (%) for categorical variables. P values are for differences between the groups reflecting presence/absence of sarcopenic obesity, sarcopenia alone, and obesity alone, using Kruskal-Wallis test for continuous variables and Chi-square for categorical variables. Groups that do not share the same letter are significantly different from others (Bonferroni-adjusted post hoc comparisons, P 0.01). s significantly different between men and women.2HC data from second health check (2HC) between 1997 and 2000.
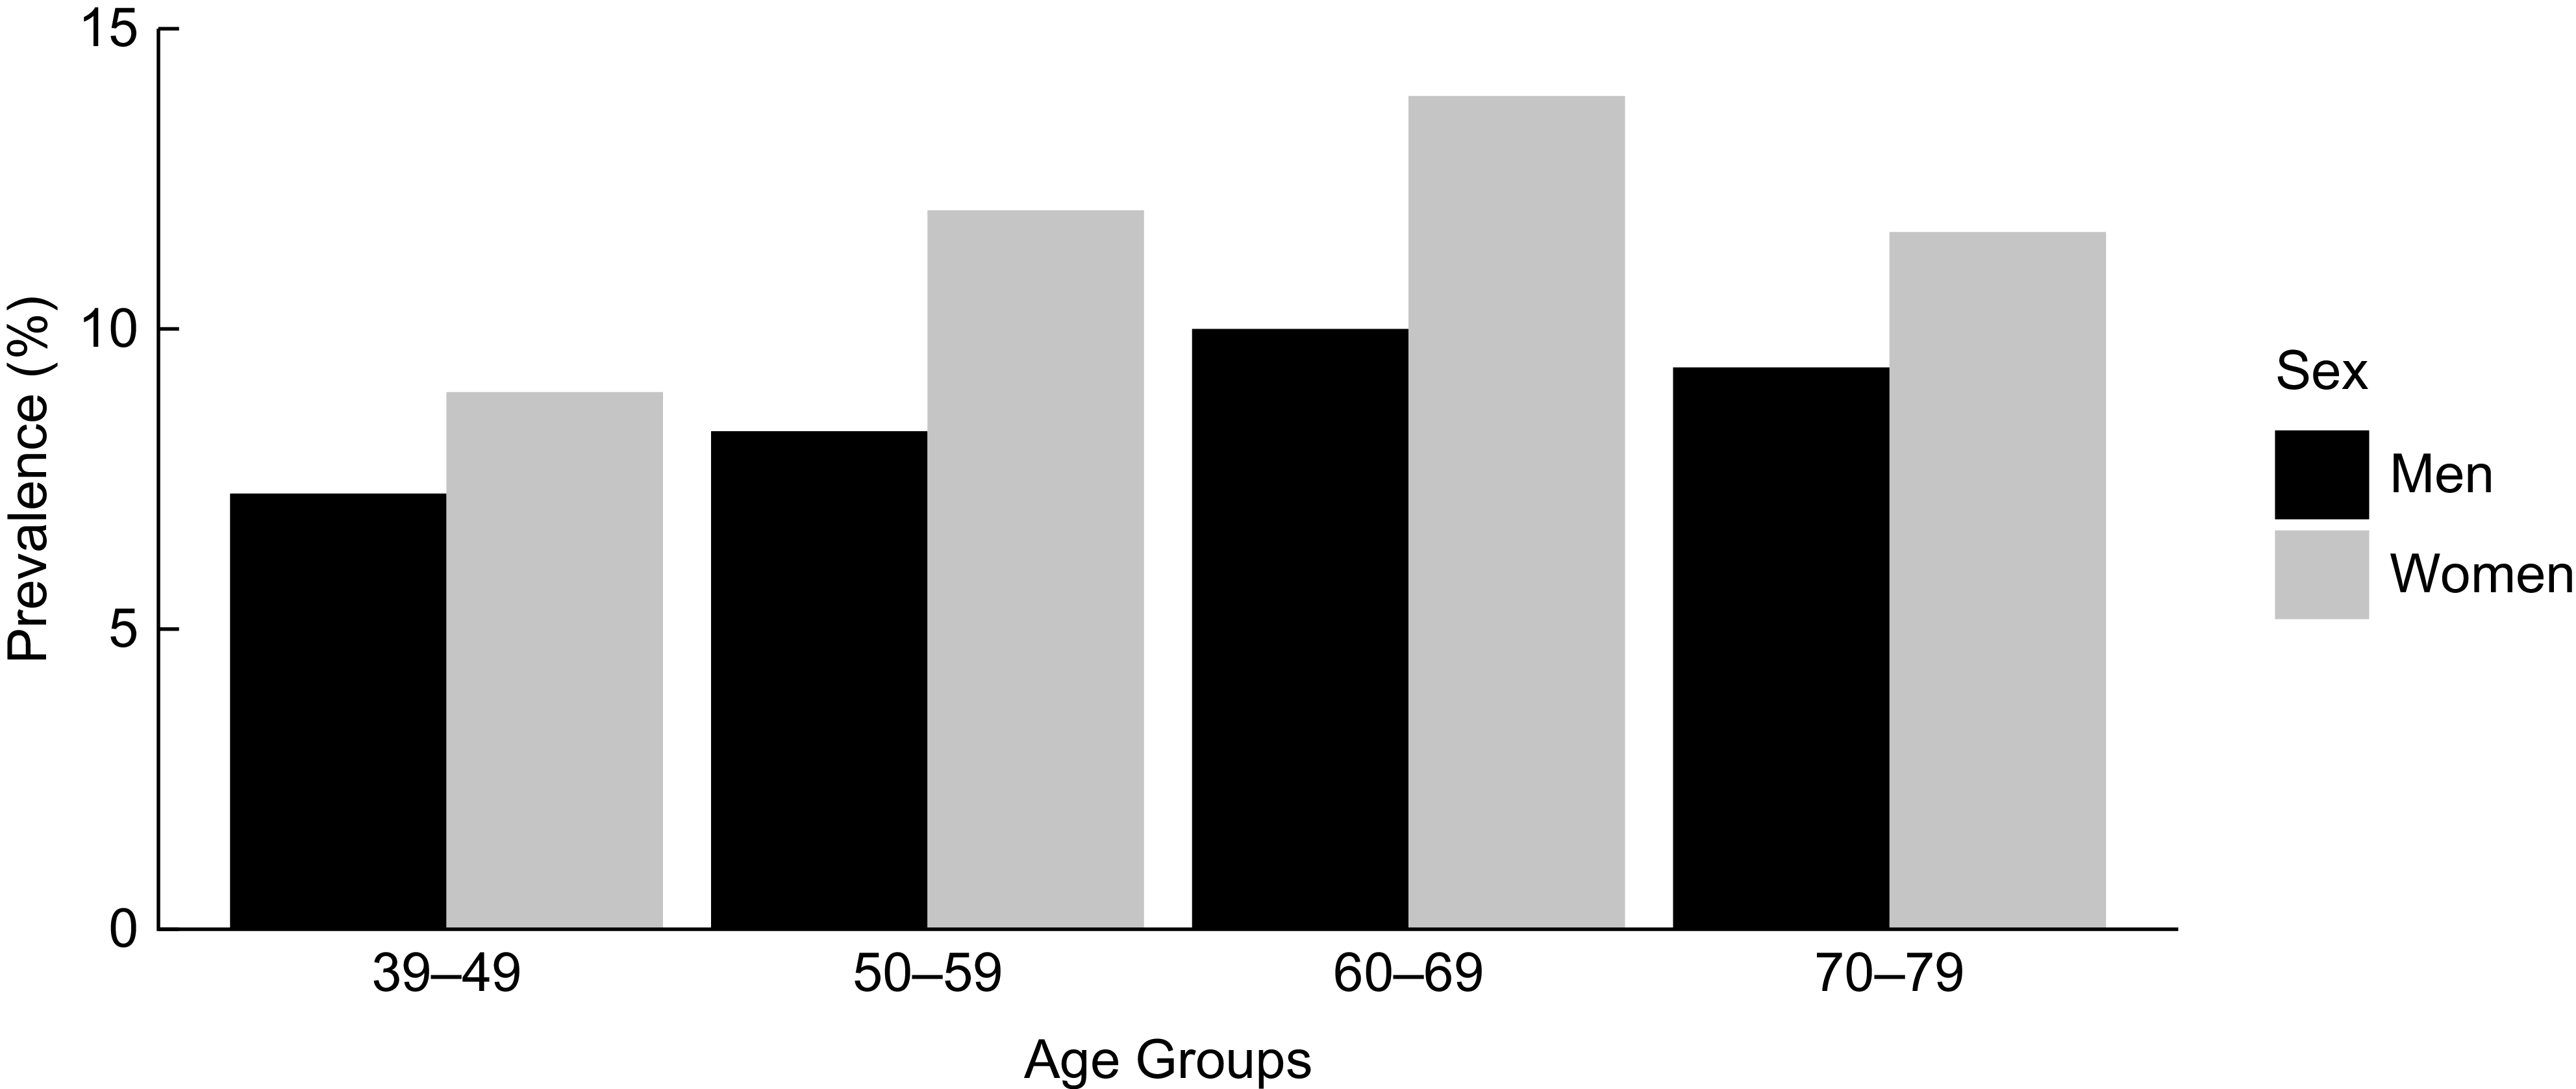
Across age strata, women had a significantly (all P < 0·001) higher prevalence of sarcopenic obesity than men, and the prevalence of sarcopenic obesity was higher for older age groups, although levels appeared to be lower again for the oldest age group (70–79 years) (Figure 2).
Prevalence of having both sarcopenia and obesity, in men and women, in the EPIC Norfolk cohort, calculated per 10-year age groups. n 3001 (39–49), 4953 (50–59), 4860 (60–69) and 2002 (70–79). The cut-off for sarcopenia was defined as the sex-specific 20th percentile of FFMBMI (≤ 2·09 kg/kg/m2 for men and ≤ 1·35 kg/kg/m2 for women). Obesity was defined as BMI ≥ 30 kg/m2 for both men and women. The P value was calculated by χ 2 test, and P < 0·001 was considered statistically significant after the Bonferroni correction.

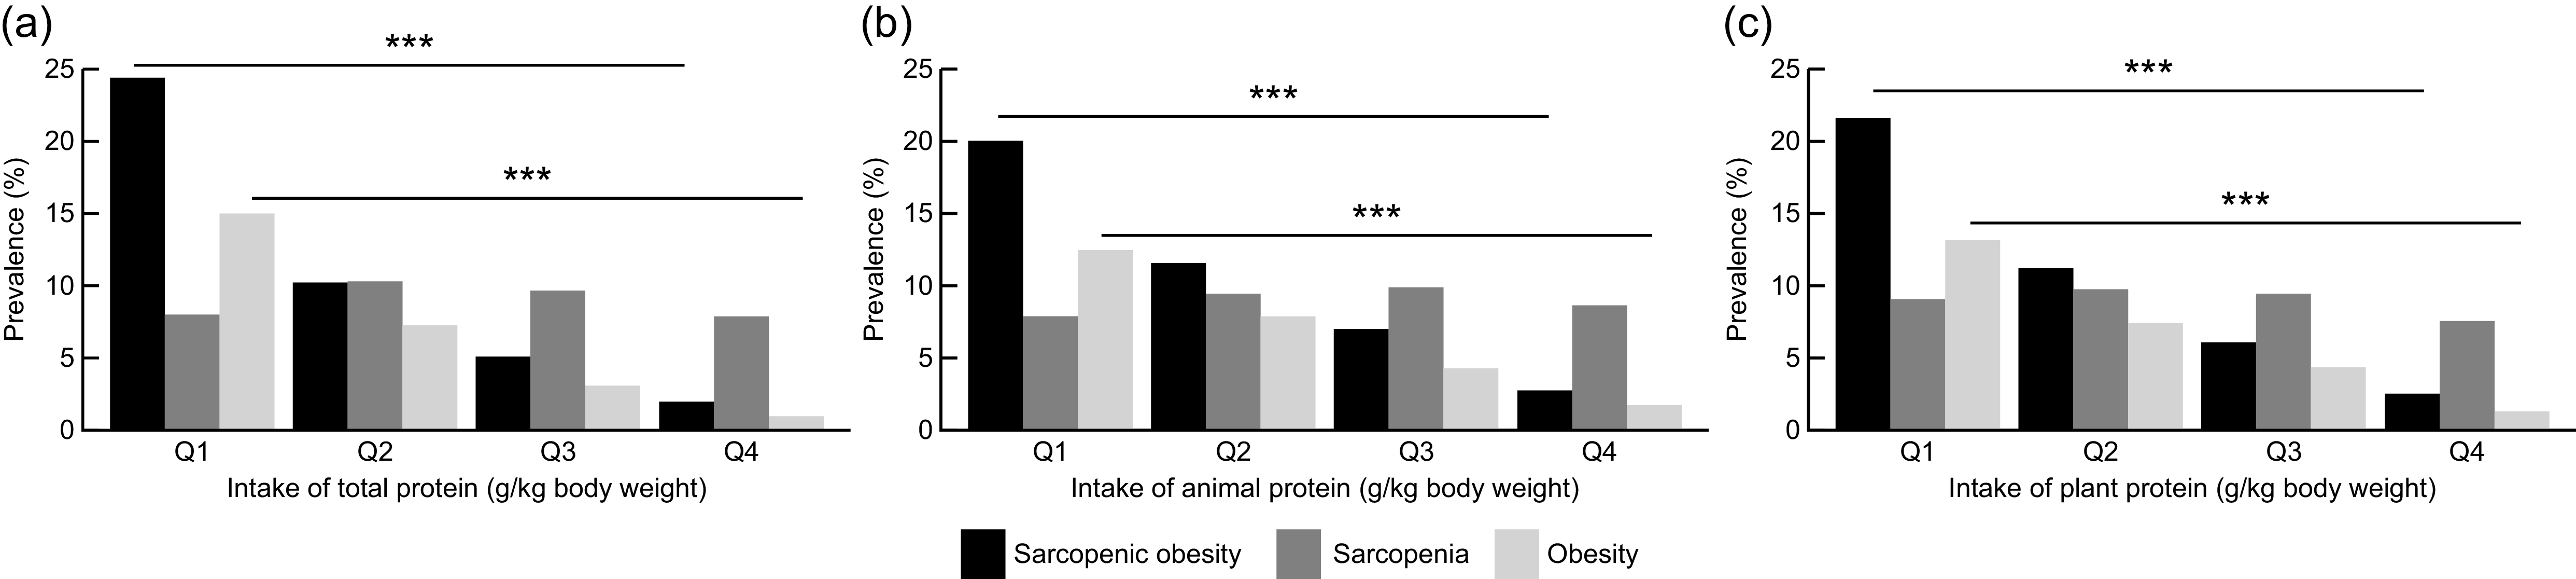
The prevalence of sarcopenic obesity and obesity at follow-up was significantly (P < 0·001) higher in those in the lowest quartile compared with the highest quartile of total-, animal-, and plant protein intake, measured at baseline. The prevalence of sarcopenia did not significantly differ between quartiles of total, animal- and plant protein intake (Figure 3).
Prevalence of sarcopenic obesity, sarcopenia and obesity for quartiles of (a) total protein intake (Q1: ≤ 0·13, Q2: > 0·13–0·84, Q3: > 0·84–0·99, Q4: > 0·99–1·16); (b) animal-derived protein intake (Q1: ≤ 0·001, Q2: > 0·001–0·52, Q3: > 0·52–0·64, Q4: > 0·64–0·76) and (c) plant-derived protein intake (Q1 ≤ 0·03, Q2: > 0·03–0·27, Q3: > 0·27–0·34, Q4: > 0·34–0·43) (all in g/kg body weight). The cut-off for sarcopenia was defined as the sex-specific 20th percentile of FFMBMI (≤ 2·09 kg/ kg/m2 for men and ≤ 1·35 kg/kg/m2 for women). Obesity was defined as BMI ≥ 30 kg/m2 for both men and women. The P value was calculated by χ 2 test; P < 0·001 was considered statistically significant after the Bonferroni correction.

Multivariable logistic regression analysis revealed that a higher dietary intake of total protein (Figure 4(a)), or a higher dietary intake of plant- or animal-based protein, at baseline, (all in gram per kg body weight per a day) (Figure 4(b)), was associated with an 86 %, 42 % and 54 % reduction in the odds of having sarcopenic obesity (P < 0·001 for all), respectively, at follow-up, after adjusting for the other variables. Also, being physically active and having an educational degree significantly decreased the likelihood of having sarcopenic obesity at follow-up (P < 0·001 for all). On the other hand, women had a higher likelihood of having sarcopenic obesity compared with men, and those who currently and formerly smoked, or those who were a manual worker, also had a higher likelihood of having sarcopenic obesity (P < 0·001 for all). Being diagnosed with diabetes and bronchitis/emphysema was associated with a significantly higher likelihood of having sarcopenic obesity at follow-up (P < 0·001 for both) (Figure 4(a) and (b)).
Multivariable logistic regression analysis of the association between the prevalence of sarcopenic obesity and consumption of (a) total protein and (b) animal- and plant-derived protein (all in g/kg body weight) in the EPIC Norfolk cohort. Models were adjusted for energy intake (kcal/d), sex (women), smoking status (never, former and current), social class (manual worker v. non-manual worker), education level (degree, A-level, O-level or below), physical activity level (inactive, moderately inactive, moderately active and active), diabetes (yes/no) and bronchitis/emphysema (yes/no). The cut-off for sarcopenia was defined as the sex-specific 20th percentile of FFMBMI (≤ 2·09 kg/ kg/m2 for men and ≤ 1·35 kg/kg/m2 for women). Obesity was defined as BMI ≥ 30 kg/m2 for both men and women. EPIC, European Prospective Investigation of Cancer; FFM fat-free mass.

Figure 4. Long description
Two vertical scatter plots depict the association between the prevalence of sarcopenic obesity and protein consumption in the EPIC Norfolk cohort. Panel A: The scatter plot shows the odds ratio of sarcopenic obesity in relation to total protein consumption in grams per kilogram of body weight. The x-axis represents the odds ratio, ranging from 0 to 3, while the y-axis lists various variables such as total protein, sex, smoking states, social classes, education level, physical activity, diabetes, and bronchitis/emphysema. Each variable is represented by a dot with error bars indicating the confidence interval. Panel B: This scatter plot illustrates the odds ratio of sarcopenic obesity in relation to animal-derived and plant-derived protein consumption in grams per kilogram of body weight. The x-axis represents the odds ratio, ranging from 0 to 3, while the y-axis lists the same variables as in Panel A. Each variable is represented by a dot with error bars indicating the confidence interval. Both plots are adjusted for energy intake, sex, smoking status, social class, education level, physical activity level, diabetes, and bronchitis/emphysema.
Discussion
In a UK cohort of 14 816 middle- and older-aged adults, and using the proxy of fat free mass standardised for BMI for calculating sarcopenia, just over 10 % of participants had both sarcopenia and obesity, and most of them (63 %) were female. Our analysis indicates that there is an inverse relationship between the consumption of protein and the prevalence of sarcopenic obesity. Total protein intake significantly reduced the odds of having sarcopenic obesity (OR = 0·14). The consumption of both animal and plant proteins was associated with lower odds of sarcopenic obesity; however, the protective impact was more pronounced for plant protein (OR = 0·46) than for animal protein (OR = 0·58). Factors including sex, smoking, a lower social classes, lower education levels, lower physical activity levels, and having diabetes or bronchitis/emphysema, also independently contributed to the likelihood of having sarcopenic obesity, in addition to low dietary protein intake.
There is currently no universally accepted method for measuring sarcopenia, and studies have used different approaches to establish the prevalence of sarcopenia(Reference Cruz-Jentoft, Baeyens and Bauer23), which makes it difficult to compare study outcomes, and as a result, reported rates of sarcopenia and sarcopenic obesity vary widely. Some studies measured sarcopenia using FFM(Reference Castillo, Goodman-Gruen and Kritz-Silverstein24), while others focused specifically on skeletal muscle mass(Reference Brown, Harhay and Harhay5). Some studies calculate the cut-off as two standard deviations below the mean of muscle mass in a reference group of younger adults(Reference Baumgartner, Koehler and Gallagher25,Reference Kim, Baek and Jeong26) , while others adopt cut-off values reported in previous studies(Reference Urzi, Pokorny and Buzan27). Some used measurements from older participants instead, for example, Janssen and colleagues used receiver operator characteristics curve analyses to identify skeletal muscle cut-off points linked to high physical disability(Reference Janssen, Baumgartner and Ross28). In other cases, sarcopenia was defined as the sex-specific 20th percentile of outcomes related to muscle mass(Reference Newman, Kupelian and Visser20,Reference Delmonico, Harris and Lee21) , as it was defined in our study. This method to define low muscle mass in sarcopenia has been found to be especially useful for research studies focusing on older adults(Reference Newman, Kupelian and Visser20,Reference Delmonico, Harris and Lee21,Reference Ge, Du and Feng29) . It has previously been argued that using a 20 % percentile cut-off for sarcopenia, rather than using sd-based thresholds from a younger population, may allow for a more comprehensive screening and intervention approach, and provides a more sensitive alternative to traditional definitions which can underestimate sarcopenia prevalence in older adults(Reference Ge, Du and Feng29). In addition, it has been suggested that using identical cut-off values between populations with different genotypes and phenotypic traits may provide unreliable results, consequently leading to the overestimation or underestimation of the actual prevalence(Reference Moreira, Perez and Lourenço30).
A recent systematic review and meta-analysis showed that both animal and plant-based protein can significantly affect muscle mass or strength, especially when including resistance training(Reference Reid-McCann, Brennan and Ward14), thereby contributing to the prevention and management of sarcopenia. Our findings align with this study, as we found that a higher consumption of total, animal- and plant-based protein was significantly associated with a reduced prevalence of sarcopenic obesity. Whilst this association was not significant for the outcome of sarcopenia alone (Figure 3), protein intake did appear to reduce its prevalence. Animal-derived protein is relatively rich in leucine and other essential amino acids, which stimulate human muscle protein synthesis primarily by activating the mTOR signalling pathway, resetting the basal protein synthesis rate, leading to increase muscle mass(Reference Li, Yin, Tan and Kong31). Plant-based proteins, such as soy and wheat proteins, can also enhance muscle protein synthesis by increasing the availability of essential amino acids, such as leucine, and subsequent activation of mTORC1 signalling(Reference Drummond and Rasmussen32).
Dietary protein intake was also significantly linked to lower obesity prevalence, suggesting that adequate protein may help manage the obesity component of sarcopenic obesity, in addition to preventing loss of muscle mass. Consumption of protein from both animal and plant protein sources could help regulate body weight by promoting satiety and reducing hunger(Reference Paddon-Jones, Westman and Mattes33,Reference Dhillon, Craig and Leidy34) . High-protein diets provide greater satiety compared with low-protein diets, resulting in decreased food consumption even when individuals eat ad libitum (Reference Weigle, Breen and Matthys35). The release of gut hormones including glucagon-like peptide-1 could contribute to the regulation of hunger and energy consumption(Reference De Silva and Bloom36), whilst the release of leucine could also influence appetite control by activation of the cellular energy sensors mTOR and AMP-activated protein kinase(Reference De Silva and Bloom36). A number of observational studies have also shown that protein intake can affect both obesity and body weight, as well as muscle health outcomes. One study in older women reported that a high total protein intake was associated with a significant increase in the muscle mass index and a reduction in BMI and waist circumference(Reference Muscariello, Nasti and Siervo37), whereas Eglseer et al. found that daily protein intake from meat/fish and dairy products was associated with a decreased odds of obesity, coexisting with low handgrip strength(Reference Eglseer, Traxler and Bauer38).
Interestingly, we found that participants with bronchitis and/or emphysema had a significantly higher likelihood of having sarcopenic obesity. A previous retrospective study found that sarcopenia was highly prevalent in patients with chronic obstructive pulmonary disease (COPD), across different BMI categories(Reference van de Bool, Rutten and Franssen39). Wüst and Degens(Reference Wüst and Degens40) indicated in their review that many patients with COPD experienced a loss of skeletal muscle mass, as lung dysfunction symptoms may lead to lower physical activity levels. In patients with COPD, the balance of protein synthesis and degradation favours net protein breakdown, causing muscle atrophy(Reference Mou, Chan and Vlahos41). Drugs used to manage COPD, such as long-term use of corticosteroids, can also contribute to muscle loss(Reference Kim, Mofarrahi and Hussain42). Excessive generation of ROS in patients with COPD can lead to oxidative stress, which may affect skeletal muscle function, and in the long run also cause muscle wasting and dysfunction(Reference Ottenheijm, Heunks and Geraedts43). Patients with severe COPD may also experience a decreased Hb oxygen saturation level, which could result in local tissue hypoxia, leading to muscle wasting and weakness(Reference Kent, Mitchell and McNicholas44). This indicates that patients with impaired lung functionality could benefit from being monitored for muscle loss and increased fat mass.
Strengths of our study include its large size of middle- and older-aged participants in the EPIC-Norfolk study to assess the association of dietary protein intake and protein sources, with the prevalence of sarcopenic obesity, in both men and women. Furthermore, we were able to use 7-d food diaries to robustly assess food intake in this large cohort. However, this study also had limitations. Animal and plant protein intake could not be derived from the food diary data. Therefore, the proportional contributions of animal and plant proteins were estimated using FFQ data and applied to total protein intake. While this combined approach allowed the estimation of protein sources, it may have introduced measurement error as FFQ may not accurately reflect absolute intakes. In addition, approximately 10 % of total protein intake could not be classified as animal or plant, due to the presence of mixed food items, or due to limitations in the food composition database. Also, no information was available on protein supplement intake, albeit that such supplements were not consumed regularly by the general public during the period of data collection. Both could have led to less accurate estimates of total, animal and plant protein, and could have attenuated associations between protein source and outcomes. Furthermore, sarcopenic obesity status was not measured at baseline; thus, it was not possible to determine whether changes in sarcopenic obesity occurred after exposure assessment. Therefore, the temporal sequence between dietary protein intake and sarcopenic obesity could not be fully established. In addition, we did not have information on muscle mass; thus, we used FFMBMI to estimate muscle mass, helping to scale for variations in skeletal muscle mass with increasing body weight(Reference McIntosh, Smale and Vallis45). This approach was used previously in several studies, including the Foundation for the National Institutes of Health Sarcopenia Project, which demonstrated that BMI-adjusted appendicular lean mass was a better predictor of weakness and low lean mass than grip strength(Reference Studenski, Peters and Alley46). BMI-adjusted appendicular lean mass also reliably identified sarcopenia in patients with heart failure, showing stronger correlations with physical function and prognosis than height-adjusted measures(Reference Tinggaard, Skou and Jessen47). Whilst the FFMBMI proxy may not be as robust and accurate as assessing muscle mass using MRI or CT to establish sarcopenia, our approach is arguably preferred over the unstandardised FFM or FFM% proxies that have been used in another study(Reference Gažarová, Bihari and Šoltís48). Indeed, FFM can lead to overestimation of muscle mass in individuals with higher BMI values, especially in those living with obesity(Reference Jensen, Braun and Geisler49). As FFMBMI is an indirect proxy for muscle mass, however, it may introduce misclassification of lean muscle mass, especially in women where obesity have strong modifying effect on the impact of lean mass on functional decline such as gait slowness, suggesting that future criteria may need gender-specific measures if these differences are confirmed(Reference Studenski, Peters and Alley46). Finally, the data used in this analysis were collected more than 30 years ago, and therefore, protein intake patterns may have changed over time. Indeed, more plant-based protein foods have become available recently and are perhaps also more consumed(Reference Abe-Inge, Aidoo and Moncada de la Fuente50). Also, lifestyle behaviours, such as physical activity, smoking and alcohol consumption, as well as diagnostic criteria for sarcopenia, may have evolved over the decades. These temporal changes could introduce potential biases and limit, to some extent, the generalisability of our findings to contemporary populations.
In conclusion, we found an inverse relationship between consumption of total, animal and plant-based protein, and the prevalence of sarcopenic obesity in both men and women of the EPIC-Norfolk cohort. These results suggest that promoting a diet rich in both animal and plant protein may help to prevent age-related loss of skeletal muscle mass, and especially increases in body fat, during the life course, with our data uniquely suggesting the effects on obesity may as important as the effects on sarcopenia. Findings of this study highlight a potential role for dietary protein and physical activity for treating those at risk for sarcopenic obesity, particularly women, smokers or those living with comorbidities such as diabetes and bronchitis.
Supplementary material
For supplementary material accompanying this paper visit https://doi.org/10.1017/S1368980026103267
Acknowledgements
We would like to acknowledge the principal investigators, staff and participants of the EPIC-Norfolk study.
Financial support
The EPIC-Norfolk study (DOI 10.22025/2019.10.105.00004) has received funding from the Medical Research Council (MR/N003284/1, MC-UU-12015/1 and MC-UU-00006/1) and Cancer Research UK (C864/A14136). The research of BdR is funded by the Scottish Government Rural and Environment Science and Analytical Services Division (RESAS), grant number RI-B5-06.
Competing interests
The authors have no conflicts of interest to declare.
Authorship
T.B., P.M. and B.d.R. conceptualised the secondary analysis. T.B. conducted the analysis, with support from M.A-M and G.H. All authors were involved in the interpretation of the results and the writing of the manuscript.
Ethics of human subject participation
The original EPIC study was conducted according to the guidelines laid down in the Declaration of Helsinki, and all procedures involving research study participants were approved by the Norfolk District Health Authority Ethics Committee (98CN01). Written informed consent was obtained from all participants.
Data availability statement: EPIC-Norfolk data are available by request through https://www.epic-norfolk.org.uk/forresearchers/data-sharing/data-requests



 Open access

