Introduction
Relation to previous work
Reference Pohjola and RogersPohjola and Rogers (1997) give an excellent survey of research on the response of glaciers in Scandinavia to meteorological conditions. One of the main findings is that whereas glaciers in most regions have rapidly lost mass over the past decade or two of pronounced global warming, those in Scandinavia have not. The other is that glacier mass balance in Scandinavia is largely controlled by atmospheric circulation over the North Atlantic.
One of the purposes of this study is to investigate the relation between seasonal mass-balance components and meteorological conditions in Scandinavia by applying a model that produces good results for glaciers in western North America. Another is to demonstrate the suitability of a major global database of upper-air conditions for modeling mass-balance processes in Scandinavia. Yet another is to describe changes over the last half-century in mass balance and in upper-air conditions, with particular attention to why glaciers in Scandinavia have not lost mass during the recent period of strong global warming, unlike glaciers elsewhere in the world (Reference Dyurgerov and MeierDyurgerov and Meier, 2000; Reference Arendt, Echelmeyer, Harrison, Lingle and ValentineArendt and others, 2002).
Mass-balance components
The most commonly reported mass-balance information for a glacier is the interannual variation of mass change, which is expressed as the thickness change averaged over the entire glacier area, given in water equivalent meters. Two different time bases are customarily used: (1) the fixed-date method, usually from 1 October to 1 October in the Northern Hemisphere, is termed annual balance; and (2) the change from the time of minimum mass at the end of one summer to the time of minimum mass at the end of the following summer is termed net balance. The two methods give comparable results in northern temperate climates because the date of minimum mass is usually near 1 October and because the rate of mass change then is smaller than in either summer or winter. Published values often do not distinguish between the two time bases of interannual variations. Here they are referred to generically as net balance bn.
Seasonal components are winter balance bw, accounting for mass gain from the beginning of the balance year until the maximum of mass, usually late the following spring, and summer balance bs, accounting for mass loss from then until the end of the balance year. Winter balance is the resultant difference between a large amount of accumulation and a small amount of ablation, whereas summer balance is the resultant difference between a large amount of ablation and a small amount of accumulation. The three components are related simply by

with bs defined to be a negative quantity. All three components are identified by the calendar year in which the balance year ends.
Databases
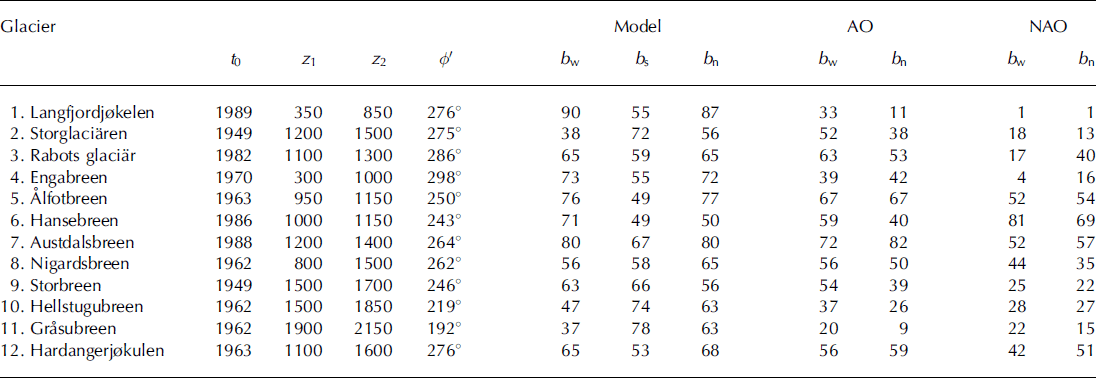
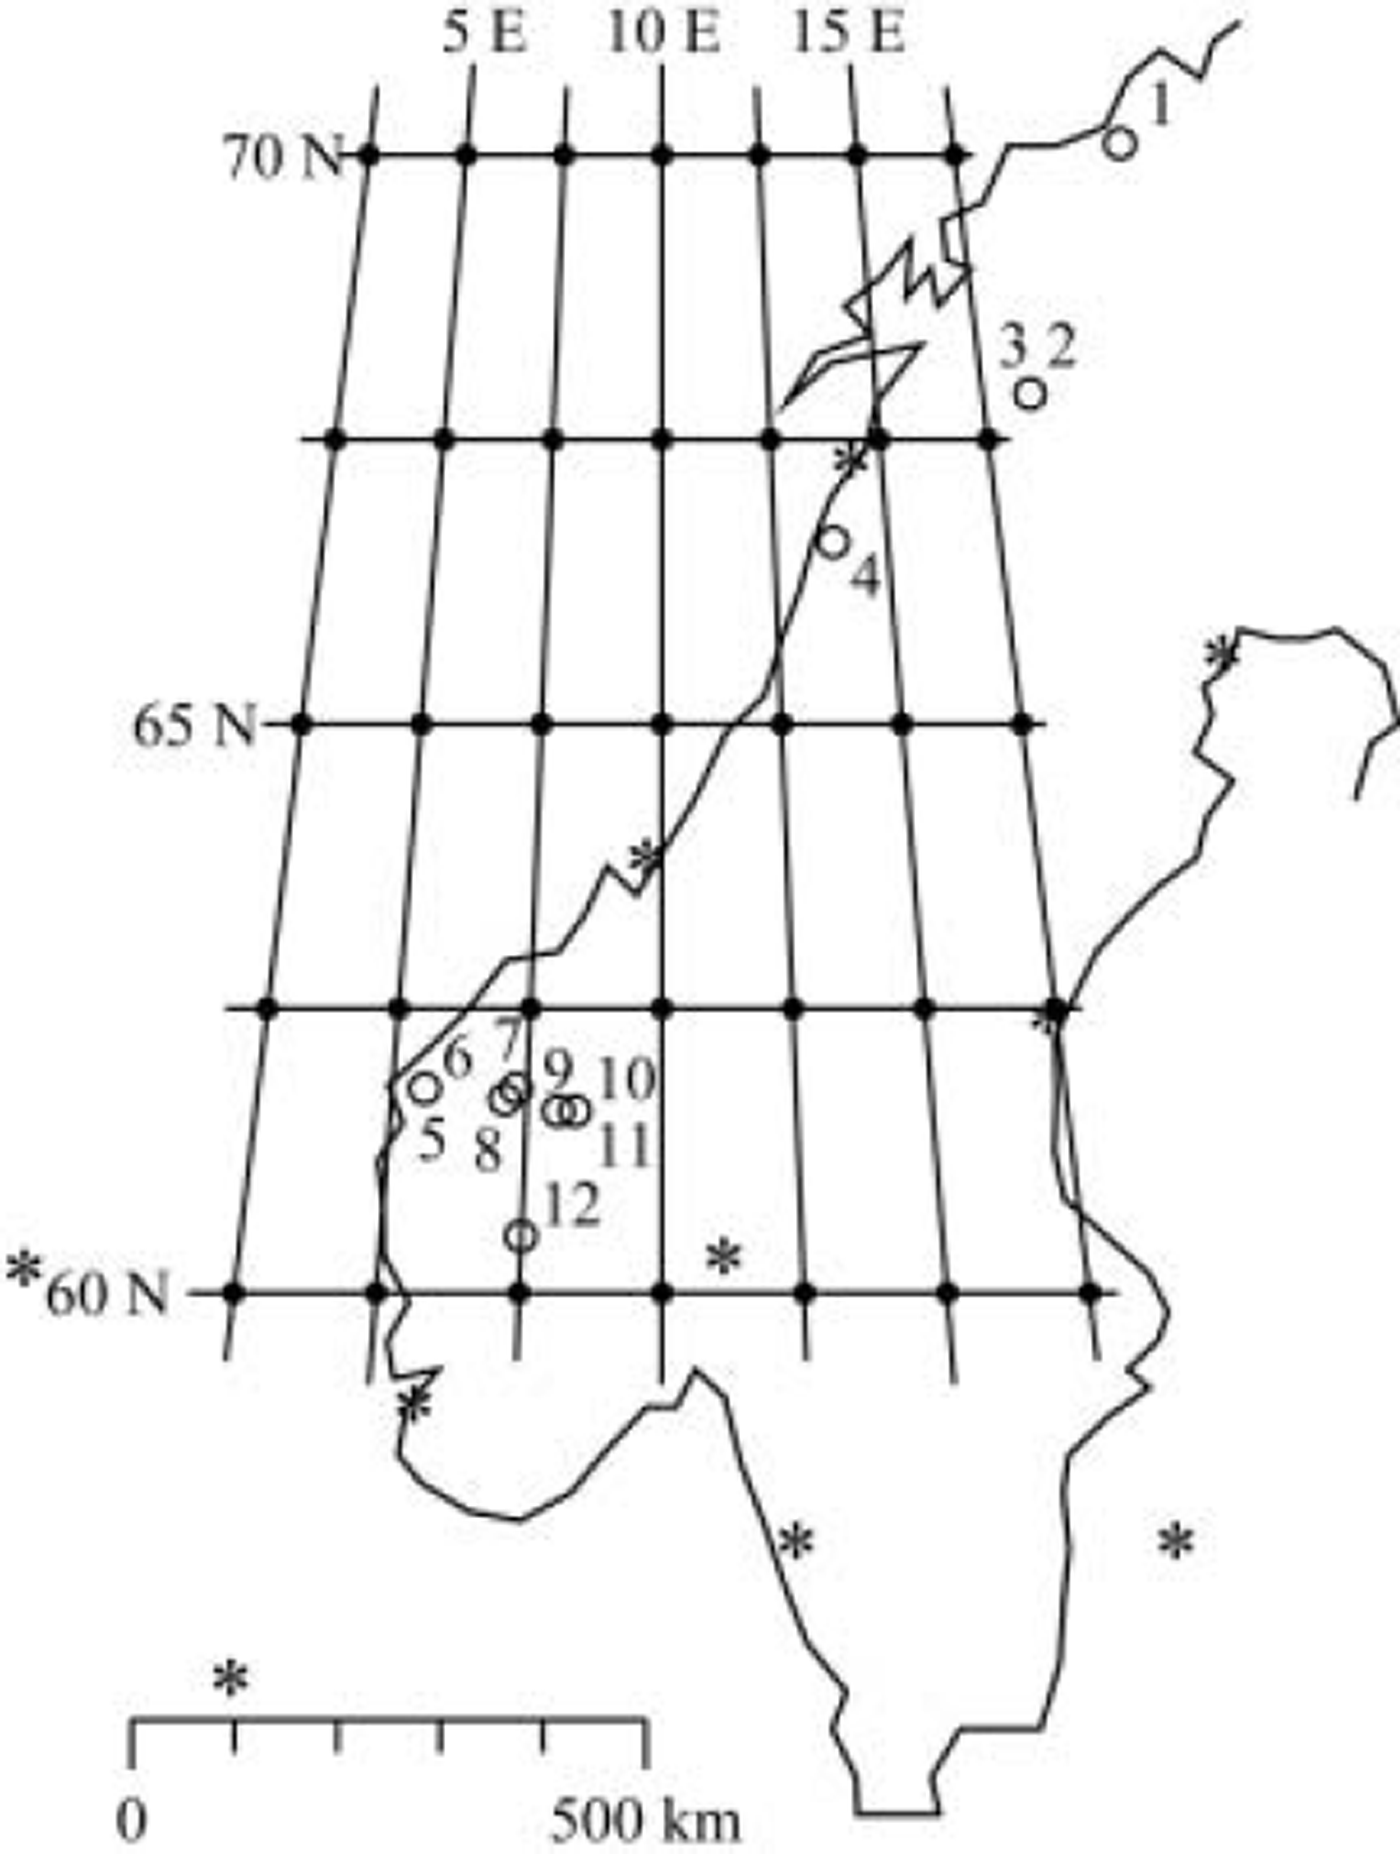
Glaciers in Norway are monitored by the Norwegian Water Resources and Energy Directorate (NVE), and in Sweden by Stockholm University. Seasonal mass balances through 2002 are given by Reference KjøllmoenKjøllmoen (2003). Values for glaciers in Sweden were supplied by P. Jansson (personal communication, 2003). Records that began before 1990 (ten in Norway, two in Sweden) are used in this study (Fig. 1; Table 1).
Glaciers (open circles; see Table 1 for names), NCEP/NCAR re-analysis gridpoints (solid circles) and radiosonde stations (*).
Model results (% r2). Period modeled from t0 through 1999, but excluding 1994 and 1995 at glacier 1. The model (Equations (2) and (3)) uses critical direction φ’ and altitudes z 1 to calculate accumulation, and z2 to calculate ablation. October-May AO and NAO results from linear correlation with indicated balance component. All r 2 significant at 99% except NAO b w for glaciers 1, 3 and 4; NAO bn for glaciers 1, 2 and 4; and AO bn for glacier 11; all significant at 95% except NAO b w for glaciers 1 and 4 and bn for glacier 1

US National Centers for Environmental Prediction/US National Center for Atmospheric Research (NCEP/NCAR) reanalysis data (Reference KalnayKalnay and others, 1996) for the period 1948-99 were obtained from NCAR in June 2002. The International Geophysical Year (1957/58) inspired increases in the quantity and quality of radiosonde data. Observation times changed on 1 June 1957 from 0300 and 1500 UTC, to 0000 and 1200 UTC (Reference AngellAngell, 1988; Reference KistlerKistler and others, 2001). Severe biases in the humidity record prior to about 1975 occurred during the evolution of instrumentation and recording methods (section 4 of Reference Rasmussen, Conway and HayesRasmussen and others, 2001), including some due to changes in sensor design and one due to inadequate shielding from solar radiation, which caused aberrantly low daytime readings. Thus, values at only 0000 UTC, which comes at night in Scandinavia, are used here to lessen the effects of inhomogeneities in the historical humidity record.
The Arctic Oscillation (AO; Reference Thompson and WallaceThompson and Wallace, 2000) is the leading empirical orthogonal function of the sea-level pressure (SLP) field in the Northern Hemisphere. In its warm phase (positive index), there is a negative anomaly in the Arctic, and a positive one at mid-latitudes, producing strong westerlies over the North Atlantic. In its cool phase (negative index), the anomalies are reversed and the westerly regime is much weaker. Monthly values for the period 1899-2001 are tabulated by D. Thompson (www.at-mos.colostate.edu/ao/Data/ao_index.html).
The North Atlantic Oscillation (NAO; Reference HurrellHurrell 1995; Reference Jones, Jónsson and WheelerJones and others 1997) is the normalized SLP gradient between two stations, one in Iceland, the other in the Azores or in Spain. It has positive correlation with the AO. Monthly values for the period 1825-2000 were obtained on 15 December 2003 from www.cru.uea.ac.uk/ftpdata/nao.dat.
Estimating Mass Balance from Ncep/Ncar Data
The method used on Scandinavian glaciers is detailed in Reference Rasmussen and ConwayRasmussen and Conway (2001, Reference Rasmussen and Conway2003). The model uses daily NCEP/NCAR values of wind and humidity at one level in the atmosphere, and temperature at two levels. Precipitation flux F is defined as the product URH, in which 0 ≤ RH ≤ 1 is relative humidity and U is the component of the 850 hPa wind in a specified critical direction φ ’ ; if U≤0, F is taken to be zero. Alternative formulations tested during development of the model (Reference Rasmussen and ConwayRasmussen and Conway 2001; Reference Rasmussen, Conway and HayesRasmussen and others 2001; Reference Hayes, Rasmussen and ConwayHayes and others, 2002) showed that scaling U by RH gave better results than scaling by the absolute humidity.
Snow flux f at a particular site equals F if the temperature interpolated at its altitude z 1 between the 850 and 700 hPa levels is less than + 2 °C, and is zero if greater. Both F and f are in units of meters per second. Winter balance is estimated from

in which
 is the October-May average of f. Summer balance is estimated from

in which the June-September average of f is
 and that of temperature interpolated at altitude z2 between the 850 and 700 hPa levels, considering only T > 0°C, is
 . Altitudes z
1 and z2 are taken to be approximate altitudes of the glacier terminus and equilibrium line. A refined version of the model would use data from additional levels in the atmosphere, so that extrapolation below the 850-700 hPa layer could be avoided. Critical direction φ’ is determined empirically along with the best-fitting linear regression coefficients in Equations (2) and (3). The estimate of net balance is taken to be
 .
Goodness of fit is expressed by the coefficient of determination
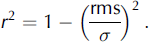
Here rms is the root mean square of the differences between the model estimates b* and the measured values b, and a is the standard deviation of b.
Upper-air conditions are taken from the NCEP/NCAR reanalysis gridpoint nearest the glacier. The gridpoint used and values of the model parameters φ’ , z1 and z2 are given for each glacier in Table 1. Model results are only weakly sensitive to values of the model parameters as well as to the period of days over which the averages are formed. Because upper-air conditions are strongly correlated from gridpoint to gridpoint, the regression coefficients adjust to accommodate most of the differences if another gridpoint is used instead of the nearest one, so the results are not strongly sensitive to which one is used. Development of the model is detailed in Reference Rasmussen and ConwayRasmussen and Conway (2001, Reference Rasmussen and Conway2003).
Results
The model estimates bw, bs and bn at the 12 glaciers in Scandinavia (Table 1) with results comparable to those at four glaciers in western North America over similar periods of record, where r2 ranged between 0.42 and 0.79 (Reference Rasmussen and ConwayRasmussen and Conway, 2004). It generally estimates bw better than bs for more maritime glaciers in Scandinavia, and bs better than b w for more continental glaciers. In 21 of the 24 cases, the model estimates bw and bn better than do correlations with AO, which in turn do better than correlations with NAO in 19 of the 24 cases. Reference Nesje, Lie and DahlNesje and others (2000) found comparable NAO correlations for bw and bn. By contrast, the Pacific Decadal Oscillation, a measure of sea surface temperature (SST) in the North Pacific, has much lower correlation with glacier balances in western North America (Reference Rasmussen and ConwayRasmussen and Conway, 2004) than the AO and NAO have with glacier balances in Scandinavia.
Correlations of bs with both AO and NAO are negligible at all 12 glaciers. Reference Pohjola and RogersPohjola and Rogers (1997) found comparable correlations of NAO with bs at Storglaciären, Rabots, Engabreen and Storbreen. They showed that the Norwegian Sea index they devised (pressure difference between Valentia, Ireland, and Vardø, Norway) correlates better than NAO with both b w and bs at the four glaciers.
Results for Storglaciären b w are disappointing and somewhat enigmatic. Using upper-air data from the gridpoint at 65˚ N, 10˚ E with φ’ = 272˚ gave r2 = 0.60, compared with 0.38 using the nearest gridpoint. Reference HolmlundHolmlund (1987) found that over 1945-86 the correlation of bn with June-August T at Karesuando (170 km northeast of the glacier, at 327 m) was r = -0.80, with September-May precipitation there was r = +0.42, and with both combined was | r| = 0.84.
Reference Lie, Dahl and NesjeLie and others (2003) used May-September temperature and October-April precipitation at weather stations near the glaciers to model net balance bn. They obtained r2 values of 0.64 for Alfotbreen over 1963-96, 0.66 for Grasubreen over 1962-96, 0.67 for Nigardsbreen over 1965-88, and 0.71 for Storbreen over 1960-96. Reference Oerlemans and ReichertOerlemans and Reichert (2000) found for Nigardsbreen bn over 1962-95 that meteorological measurements at Bergen (near the coast 170 km south-southwest) gave r2 = 0.46, and measurements at three stations near the glacier gave 0.58; upper-air data from the European Centre for Medium-Range Weather Forecasts gave 0.72 over 1979-93. Reference Jóhannesson, Sigurdsson, Laumann and KennettJόhannesson and others (1995) using a 13-parameter degree-day model obtained r2 = 0.48 for bw and 0.62 for bs at Nigardsbreen over 1965-81 and 1984-90.
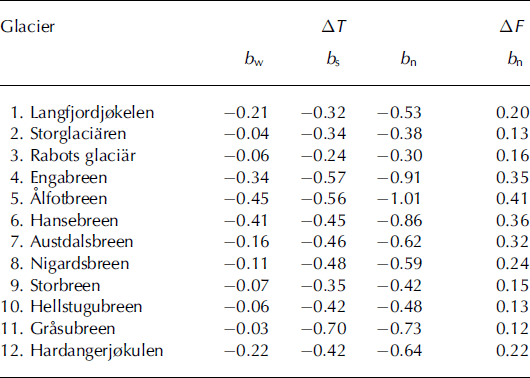
Sensitivity of calculated bw, bs and bn to hypothetical warming or increased precipitation ΔF is shown in Table 2. Sensitivity to both is larger at maritime glaciers (4-6) than at the others, as noted also by Reference Oerlemans and FortuinOerlemans and Fortuin (1992) and Reference Laumann and ReehLaumann and Reeh (1993). The effect of ΔF on bs is small, so the effect on bn is due almost entirely to that on b w.
Sensitivity (mw.e.a-1) of calculated balance to hypothetical 1°C warming ΔT or 10% increase ΔF in precipitation flux, both applied uniformly throughout the year
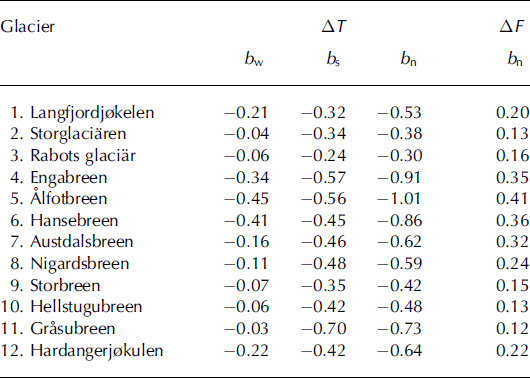
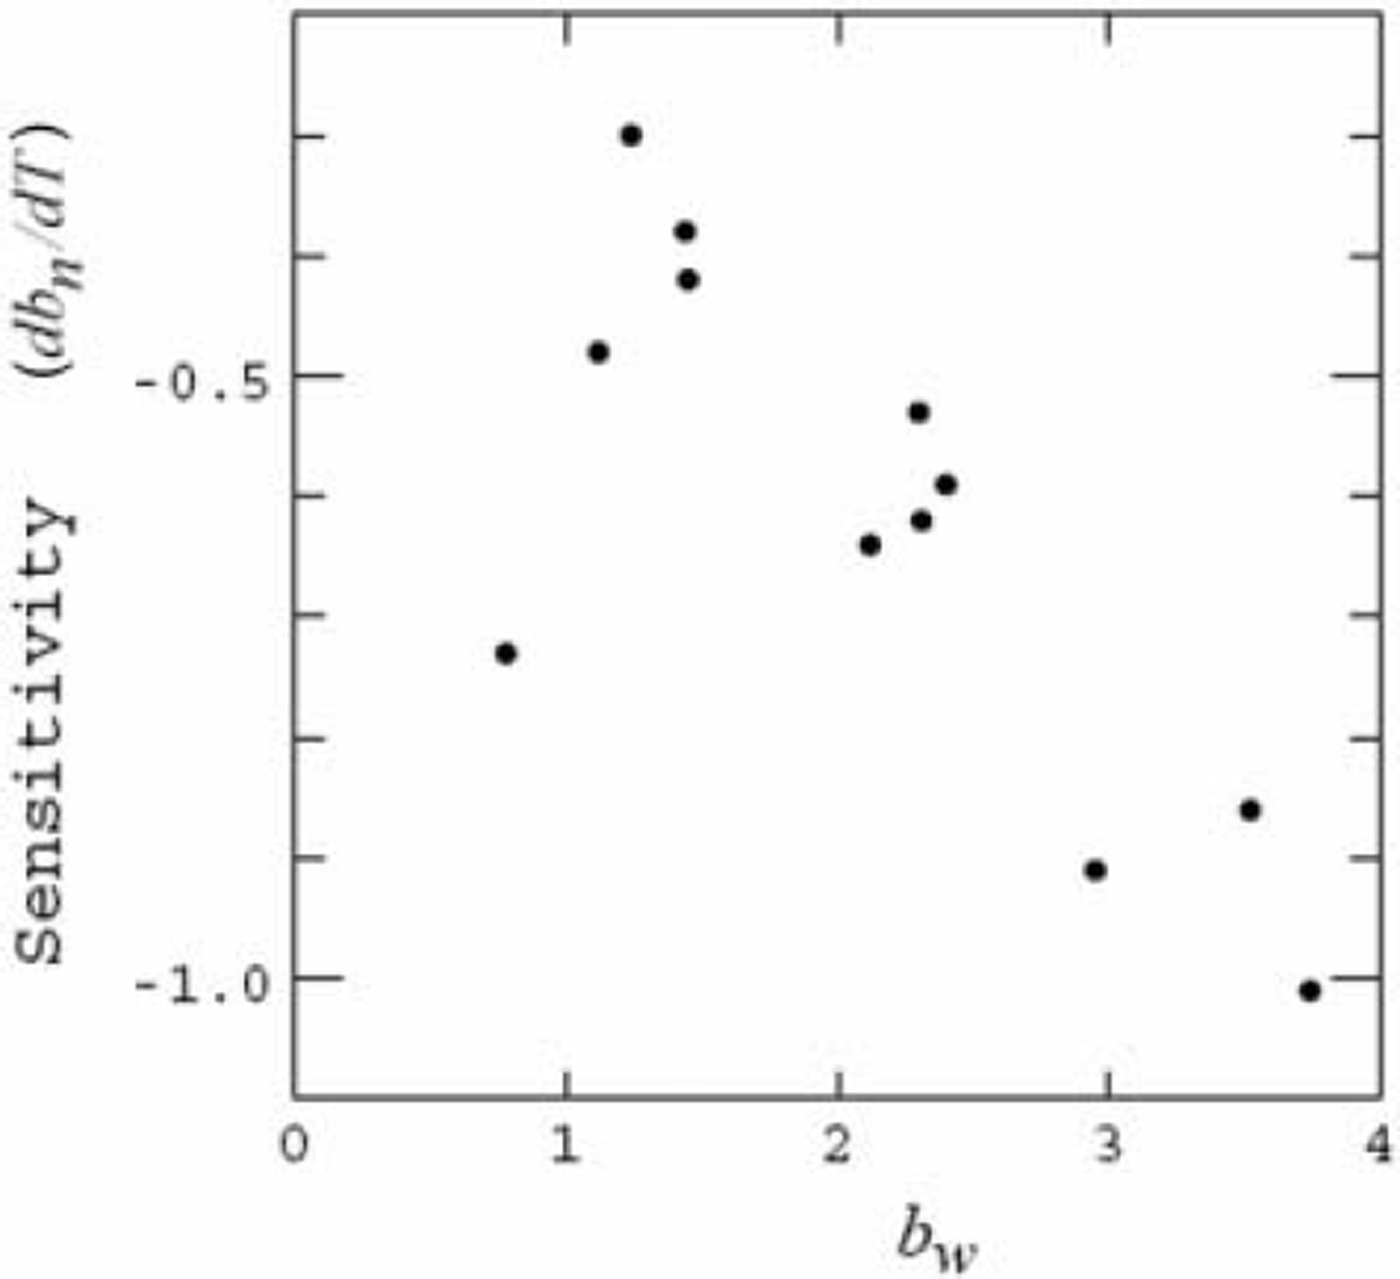
Sensitivities to temperature and precipitation are comparable to those found by other analyses. Reference Holmlund, Karlén and GruddHolmlund and others (1996, fig. 5), using observations at the glacier, found a sensitivity of Storglaciären bs to mean June-August temperature of -0.4m˚C–1. Reference OerlemansOerlemans (1992), using an energy-balance model, found bn sensitivities to annual temperature of -1.11 m˚C–1 for Ålfotbreen, -0.88 m ˚C–1 for Nigardsbreen and -0.72 m ˚C–1 for Hellstugubreen. Using a degree-day model for the same three glaciers, Reference Laumann and ReehLaumann and Reeh (1993, equation (3)) found bn sensitivities of, respectively, -1.10, -0.60 and -0.54 m ˚C–1, and for a 10% increase in annual precipitation +0.39, +0.23 and +0.14 m. At the same three glaciers, Reference Nesje, Lie and DahlNesje and others (2000), using records from nearby weather stations, found values of, respectively, -1.13, -0.68 and -1.11 m˚C–1 and +0.50, +0.26 and +0.02 m, while for Storglaciären, Storbreen and Hardangerjøkulen they found, respectively, -0.88, -1.13 and -0.71 m˚C–1 and +0.14, +0.07 and +0.26m. As found by Reference Oerlemans and FortuinOerlemans and Fortuin (1992) in a study of 12 glaciers in Eurasia and North America, the sensitivity db n /dT increases with mean annual precipitation, which is approximated here (Fig. 2) by mean winter balance b w.
Sensitivity of net balance bn to 1 °C warming as a function of mean precipitation, approximated here by observed mean winter balance b w. The outlier is Grasubreen, the most continental glacier.
Upper-Air Climatology
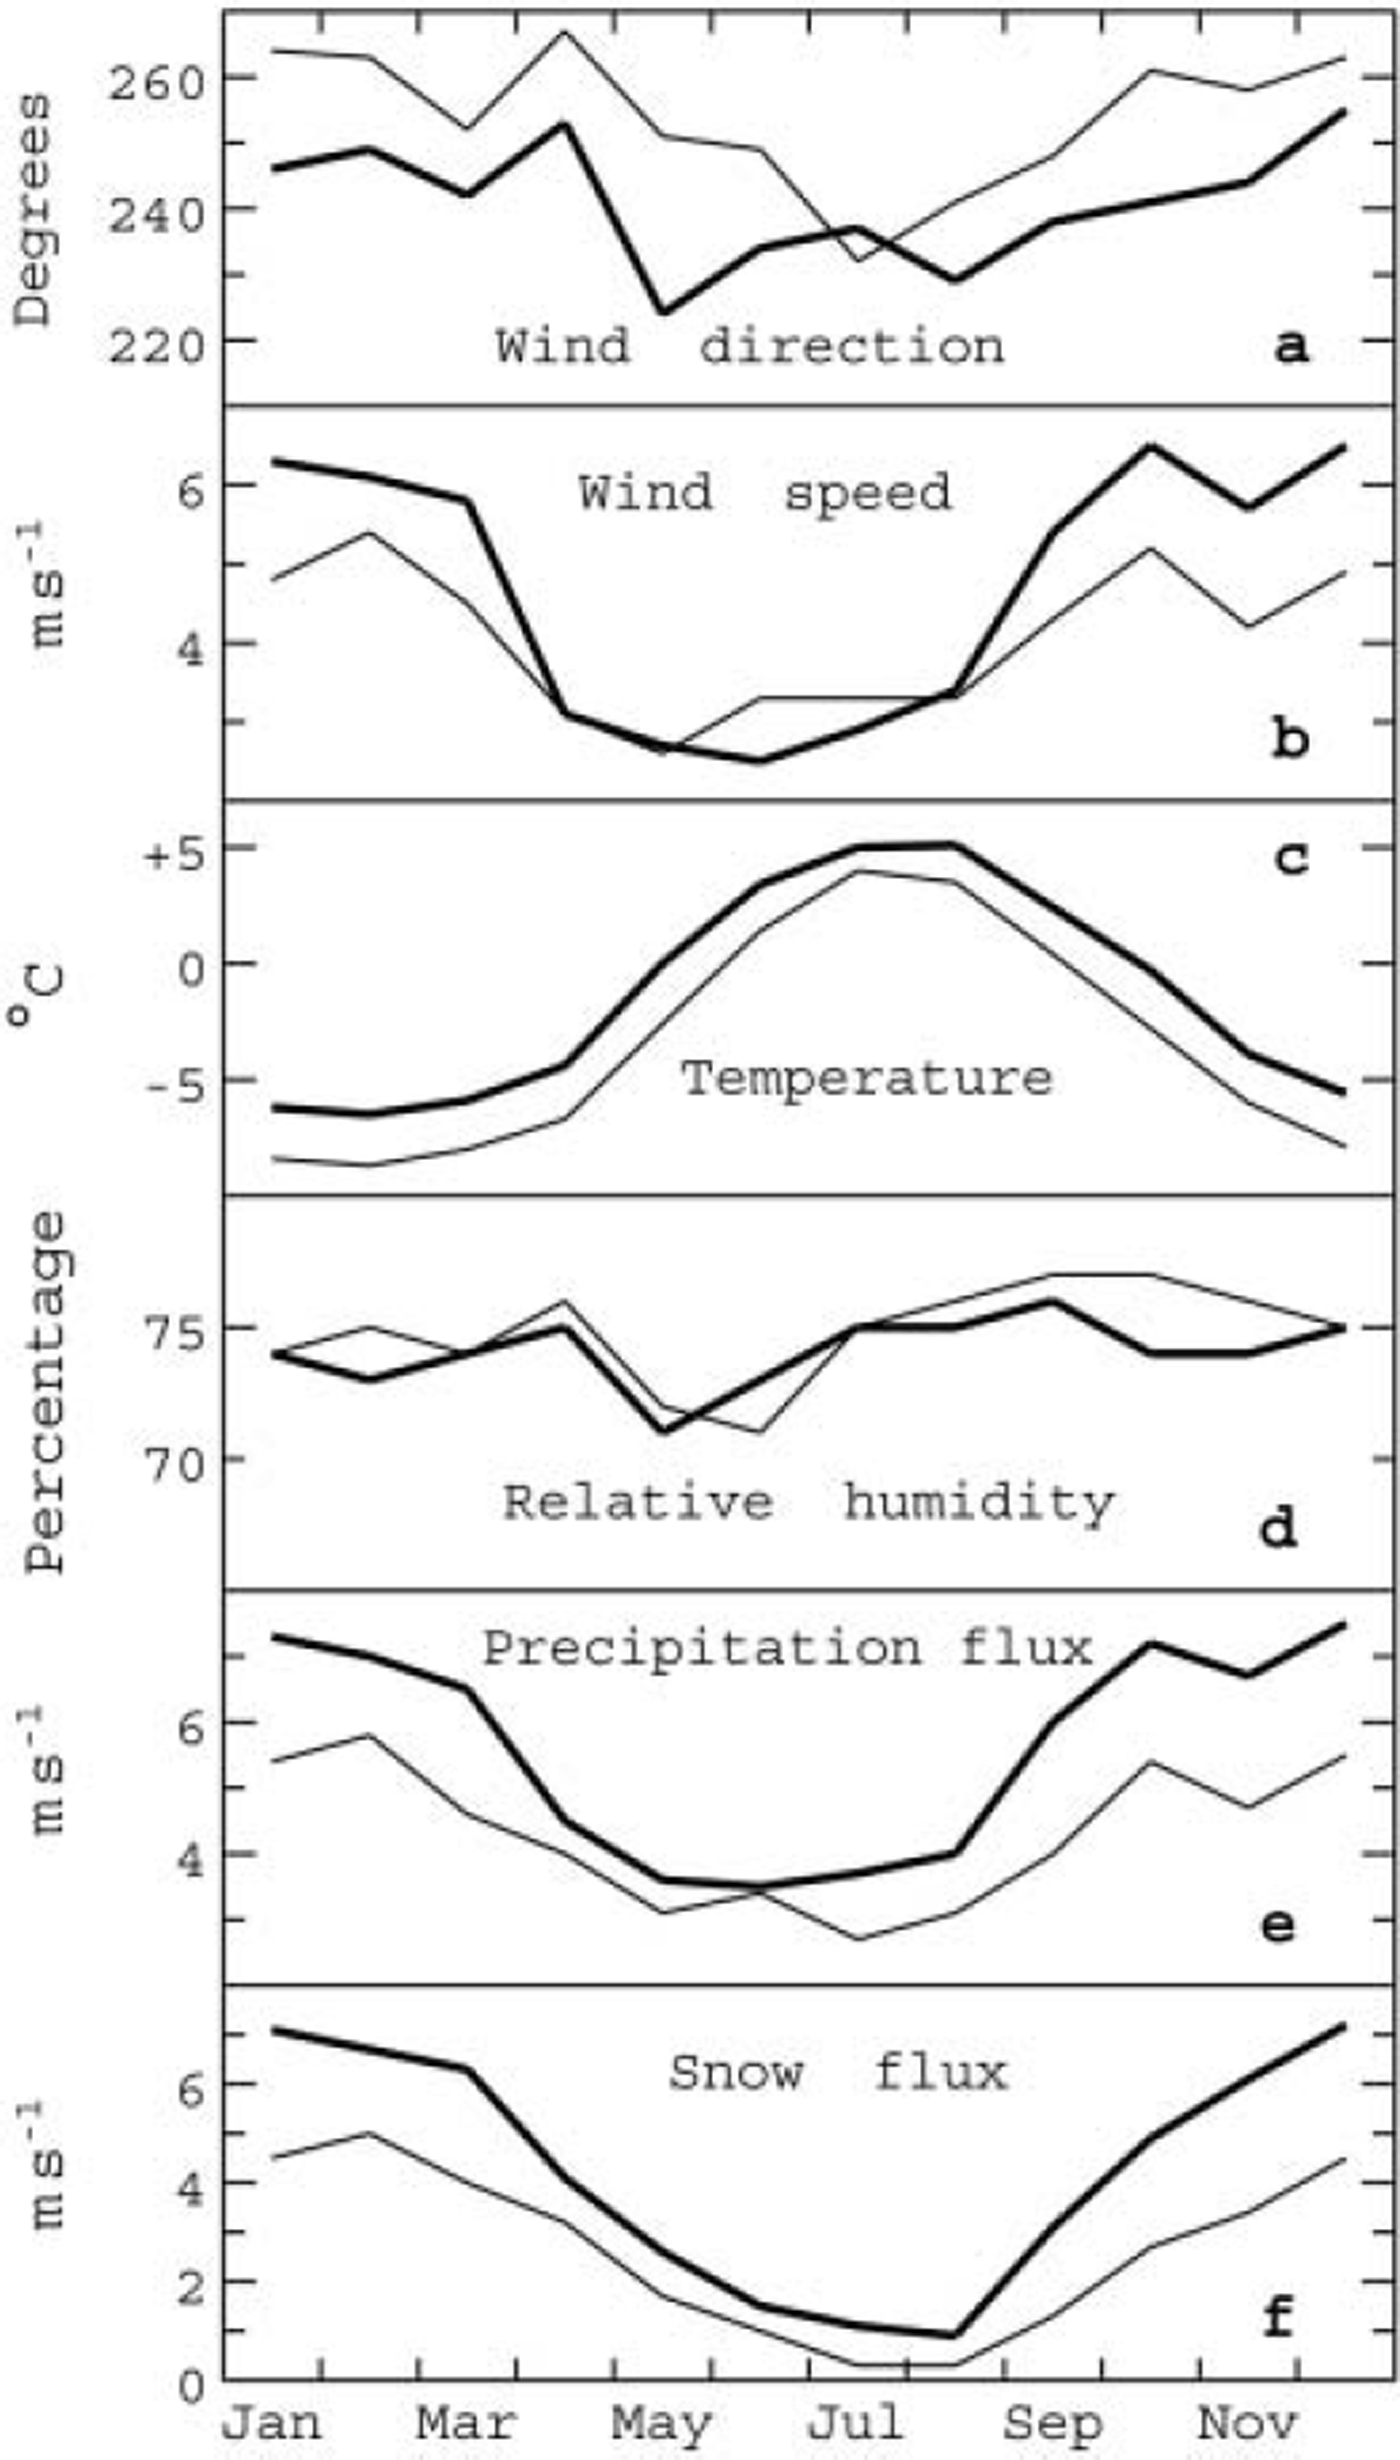
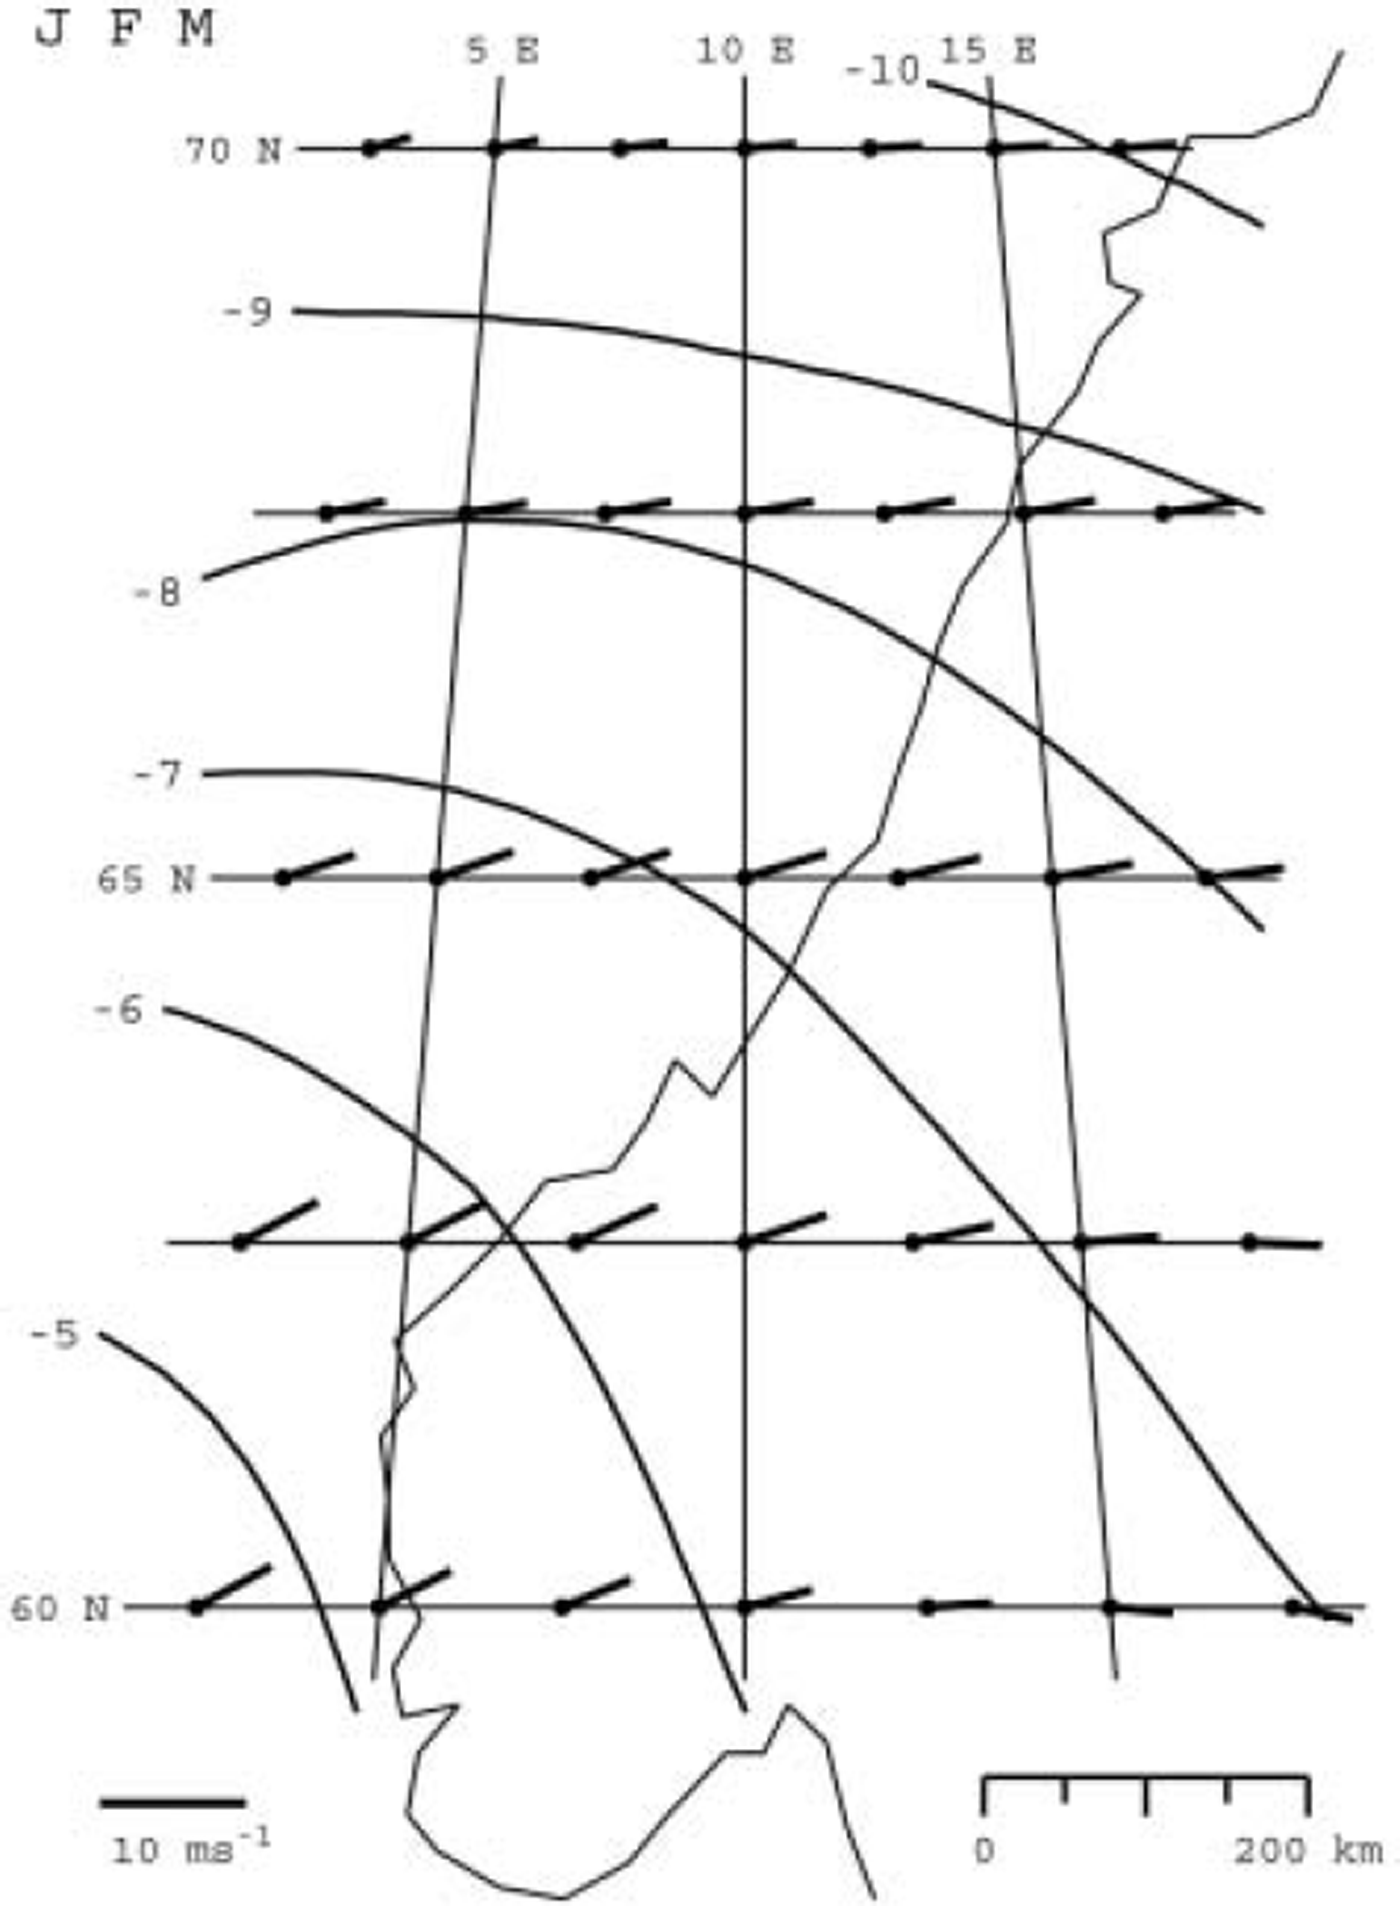
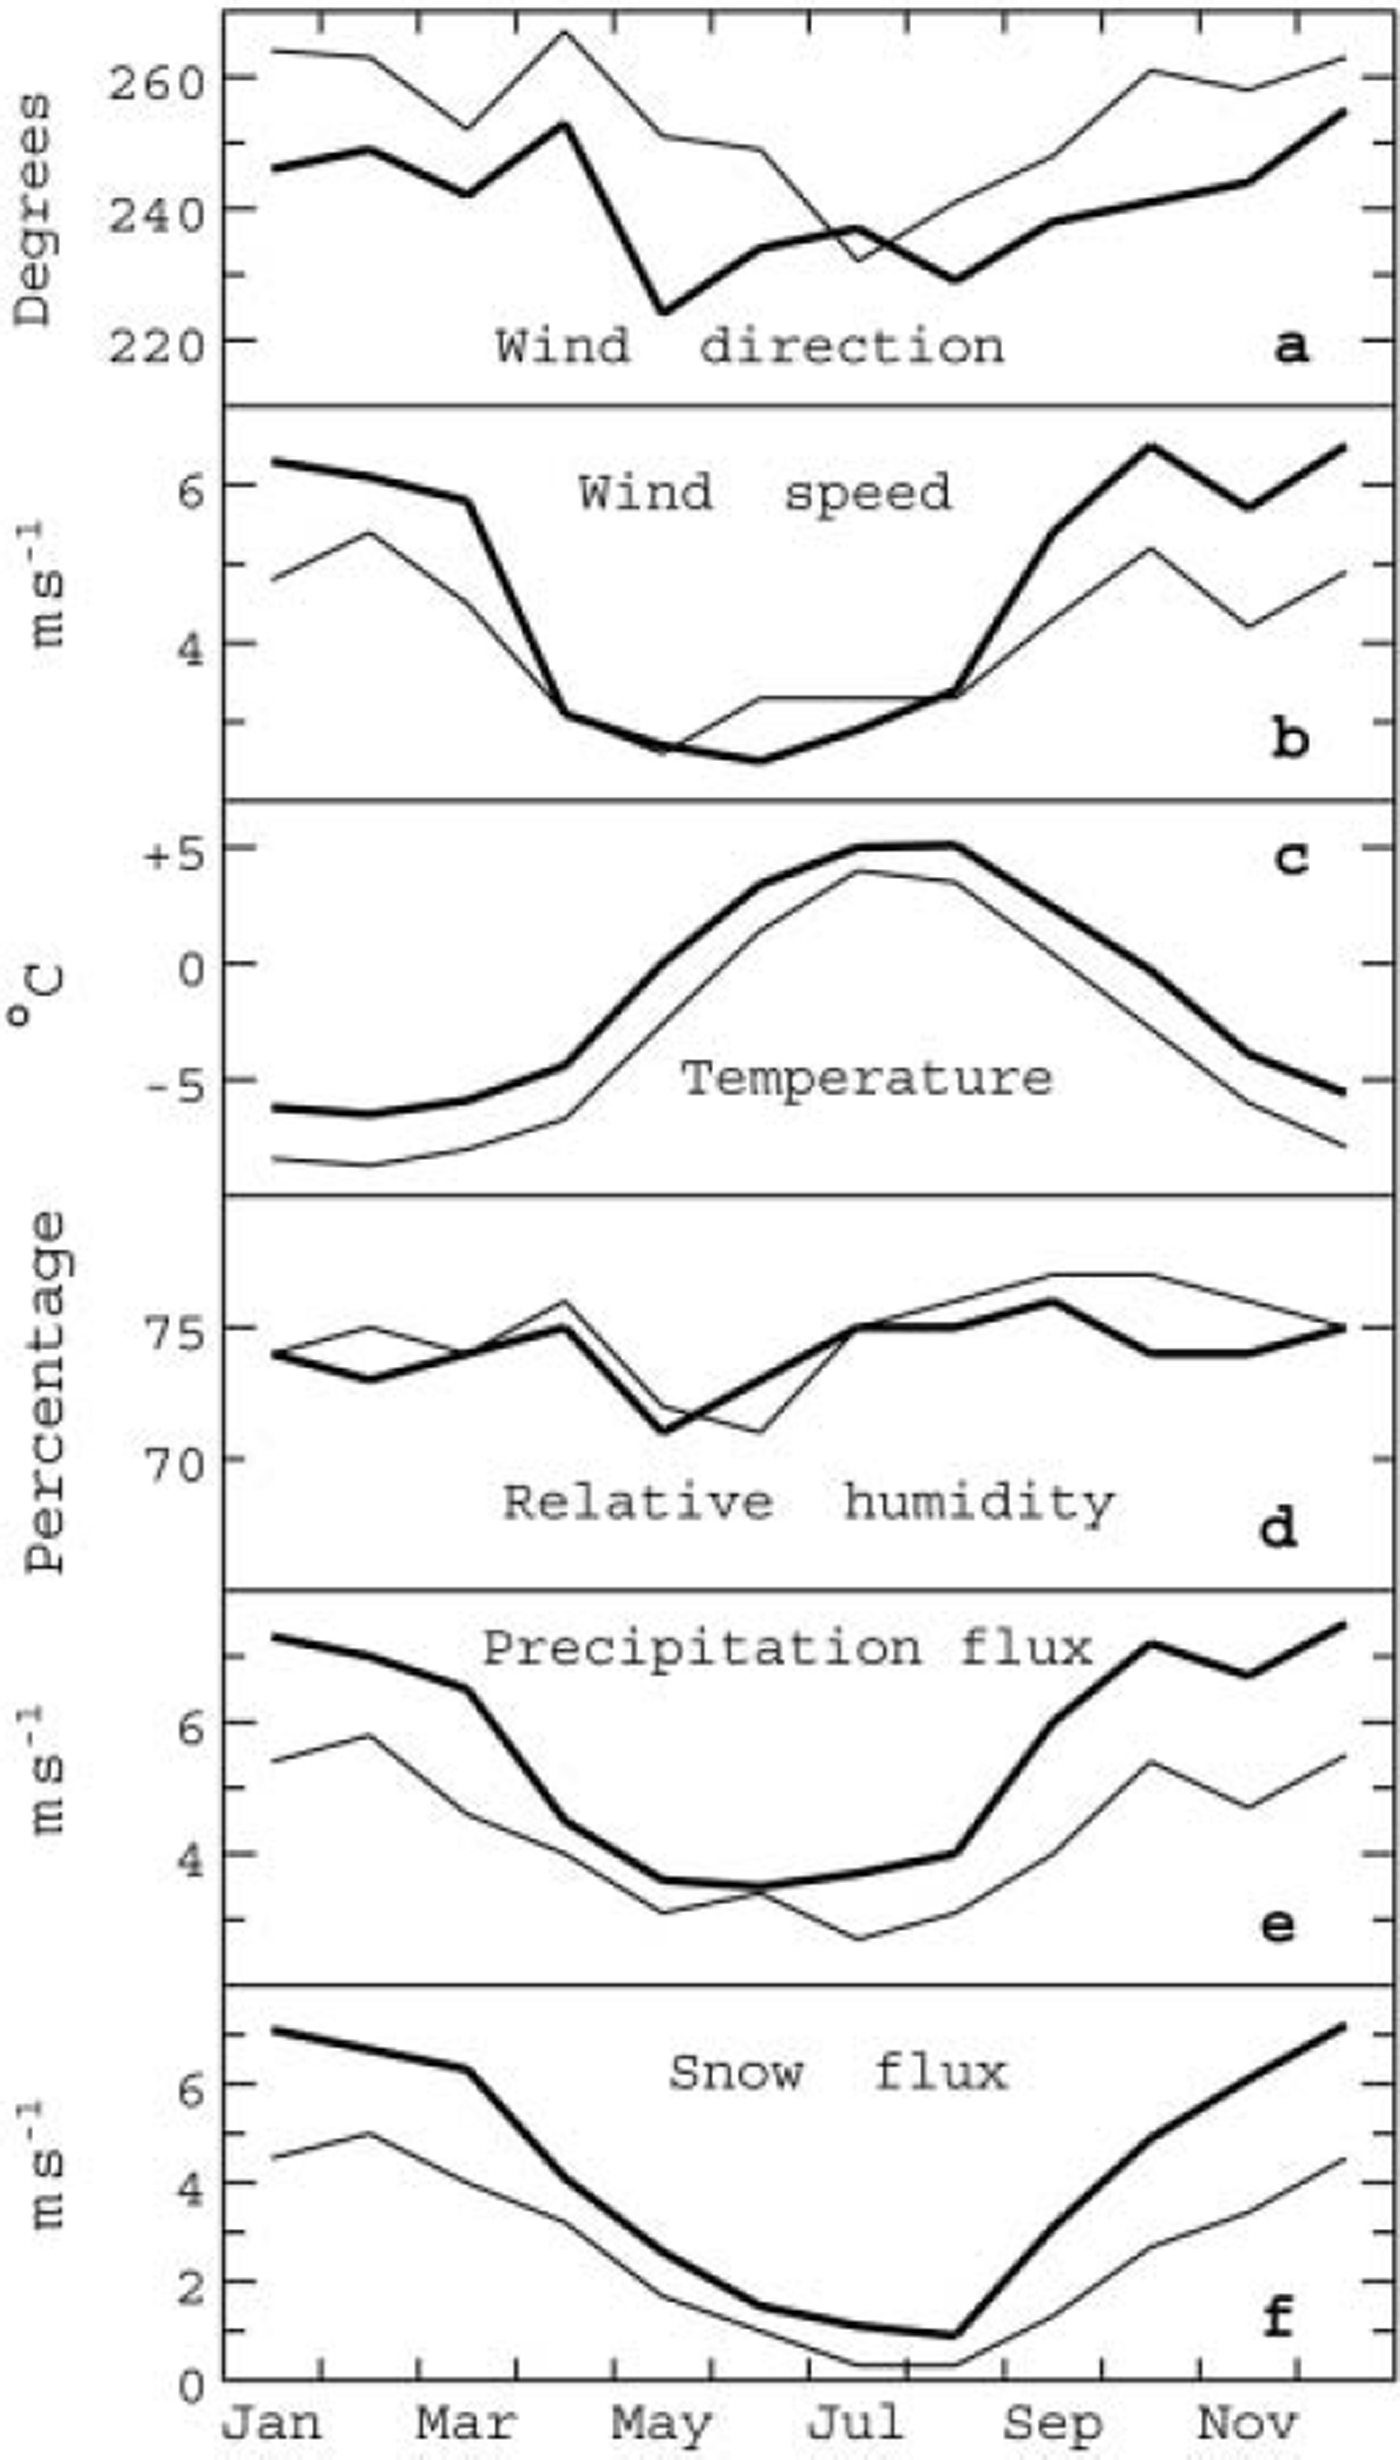
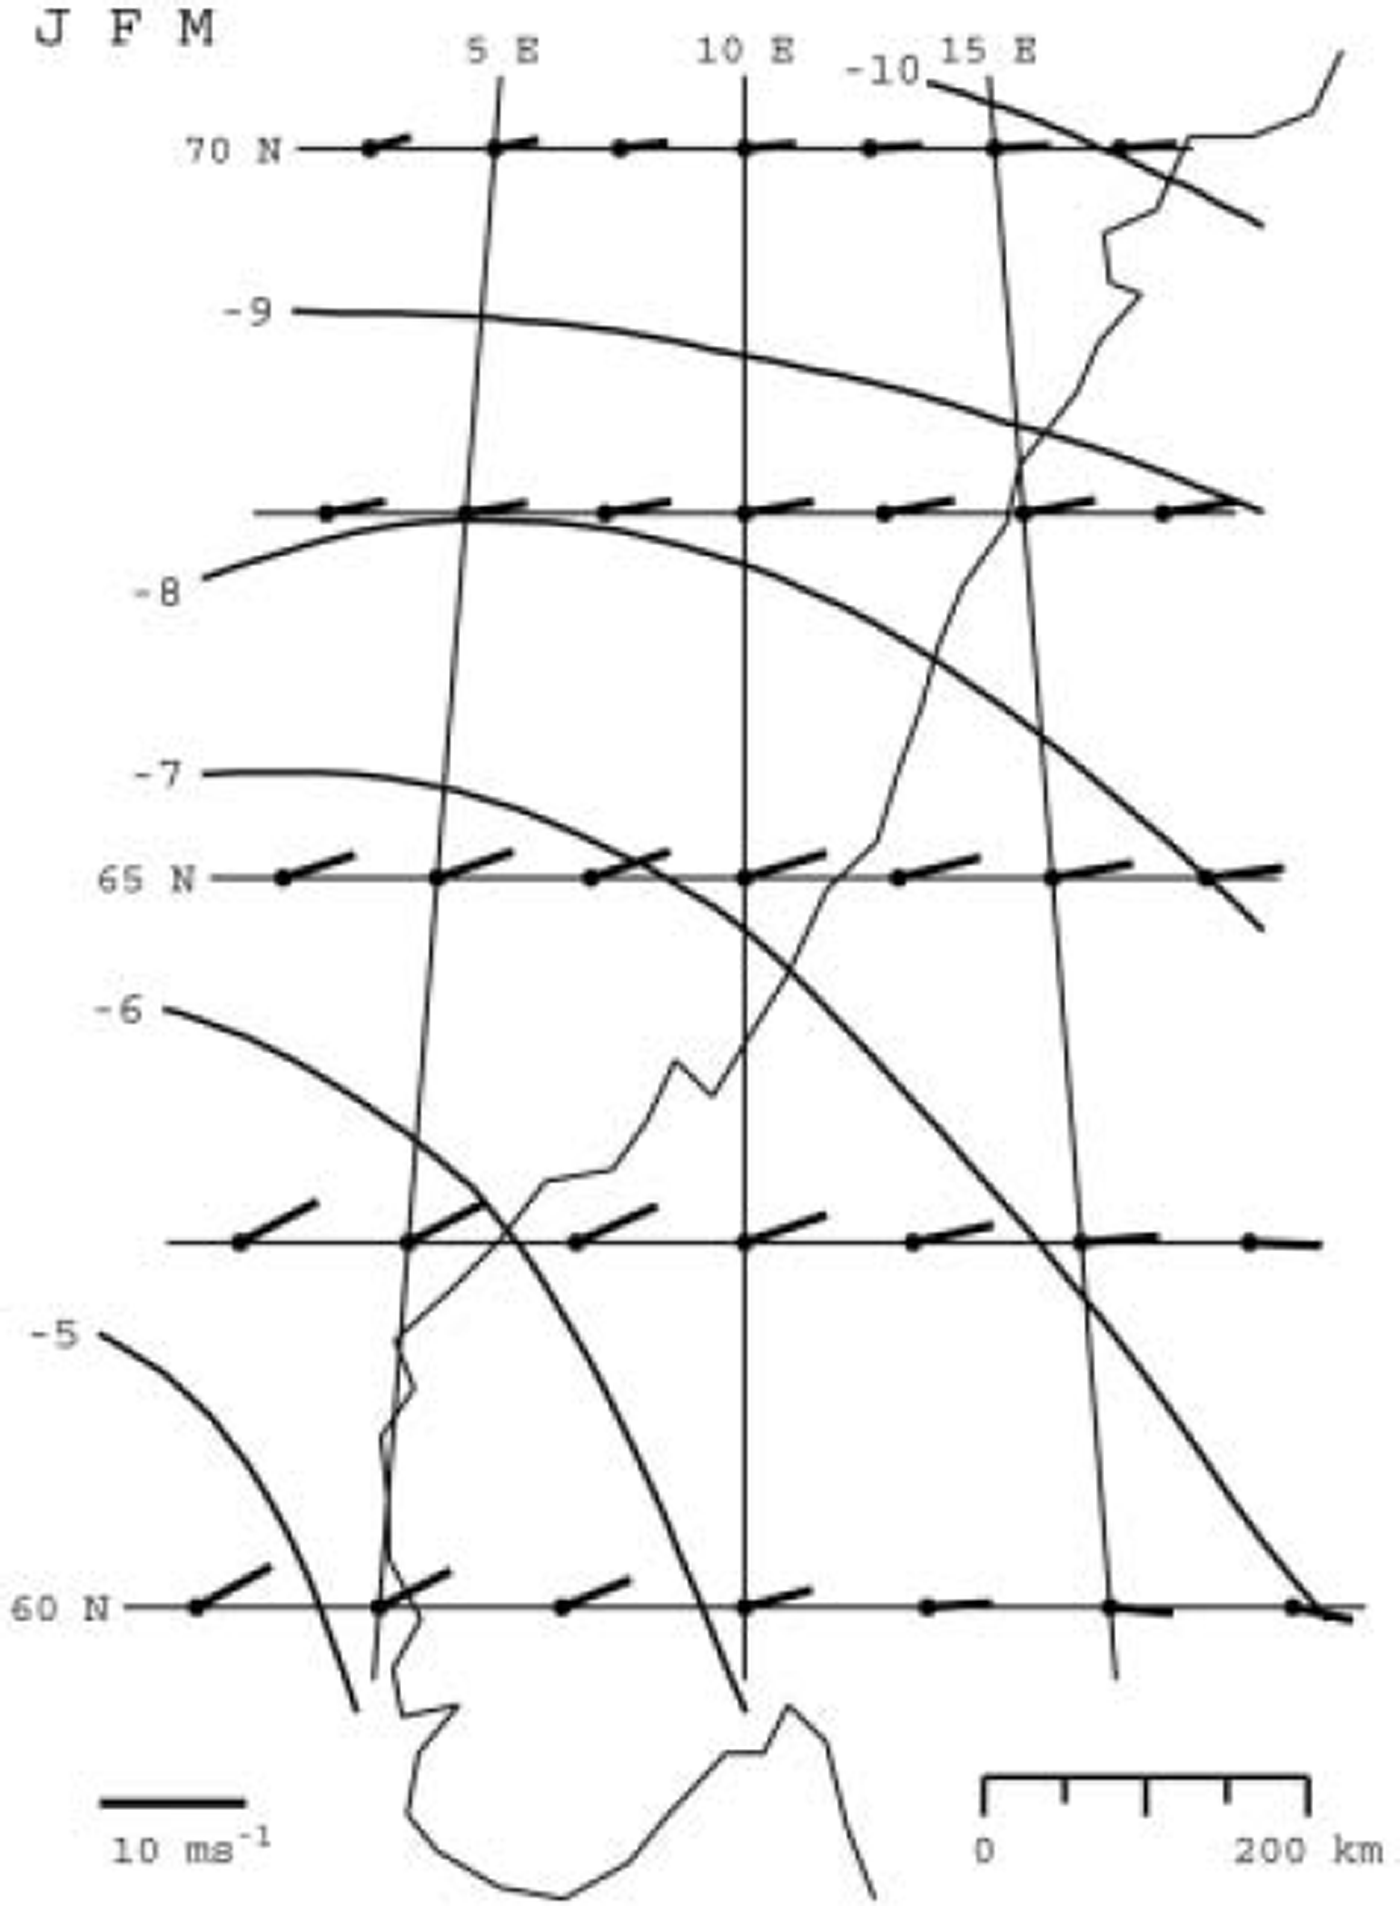
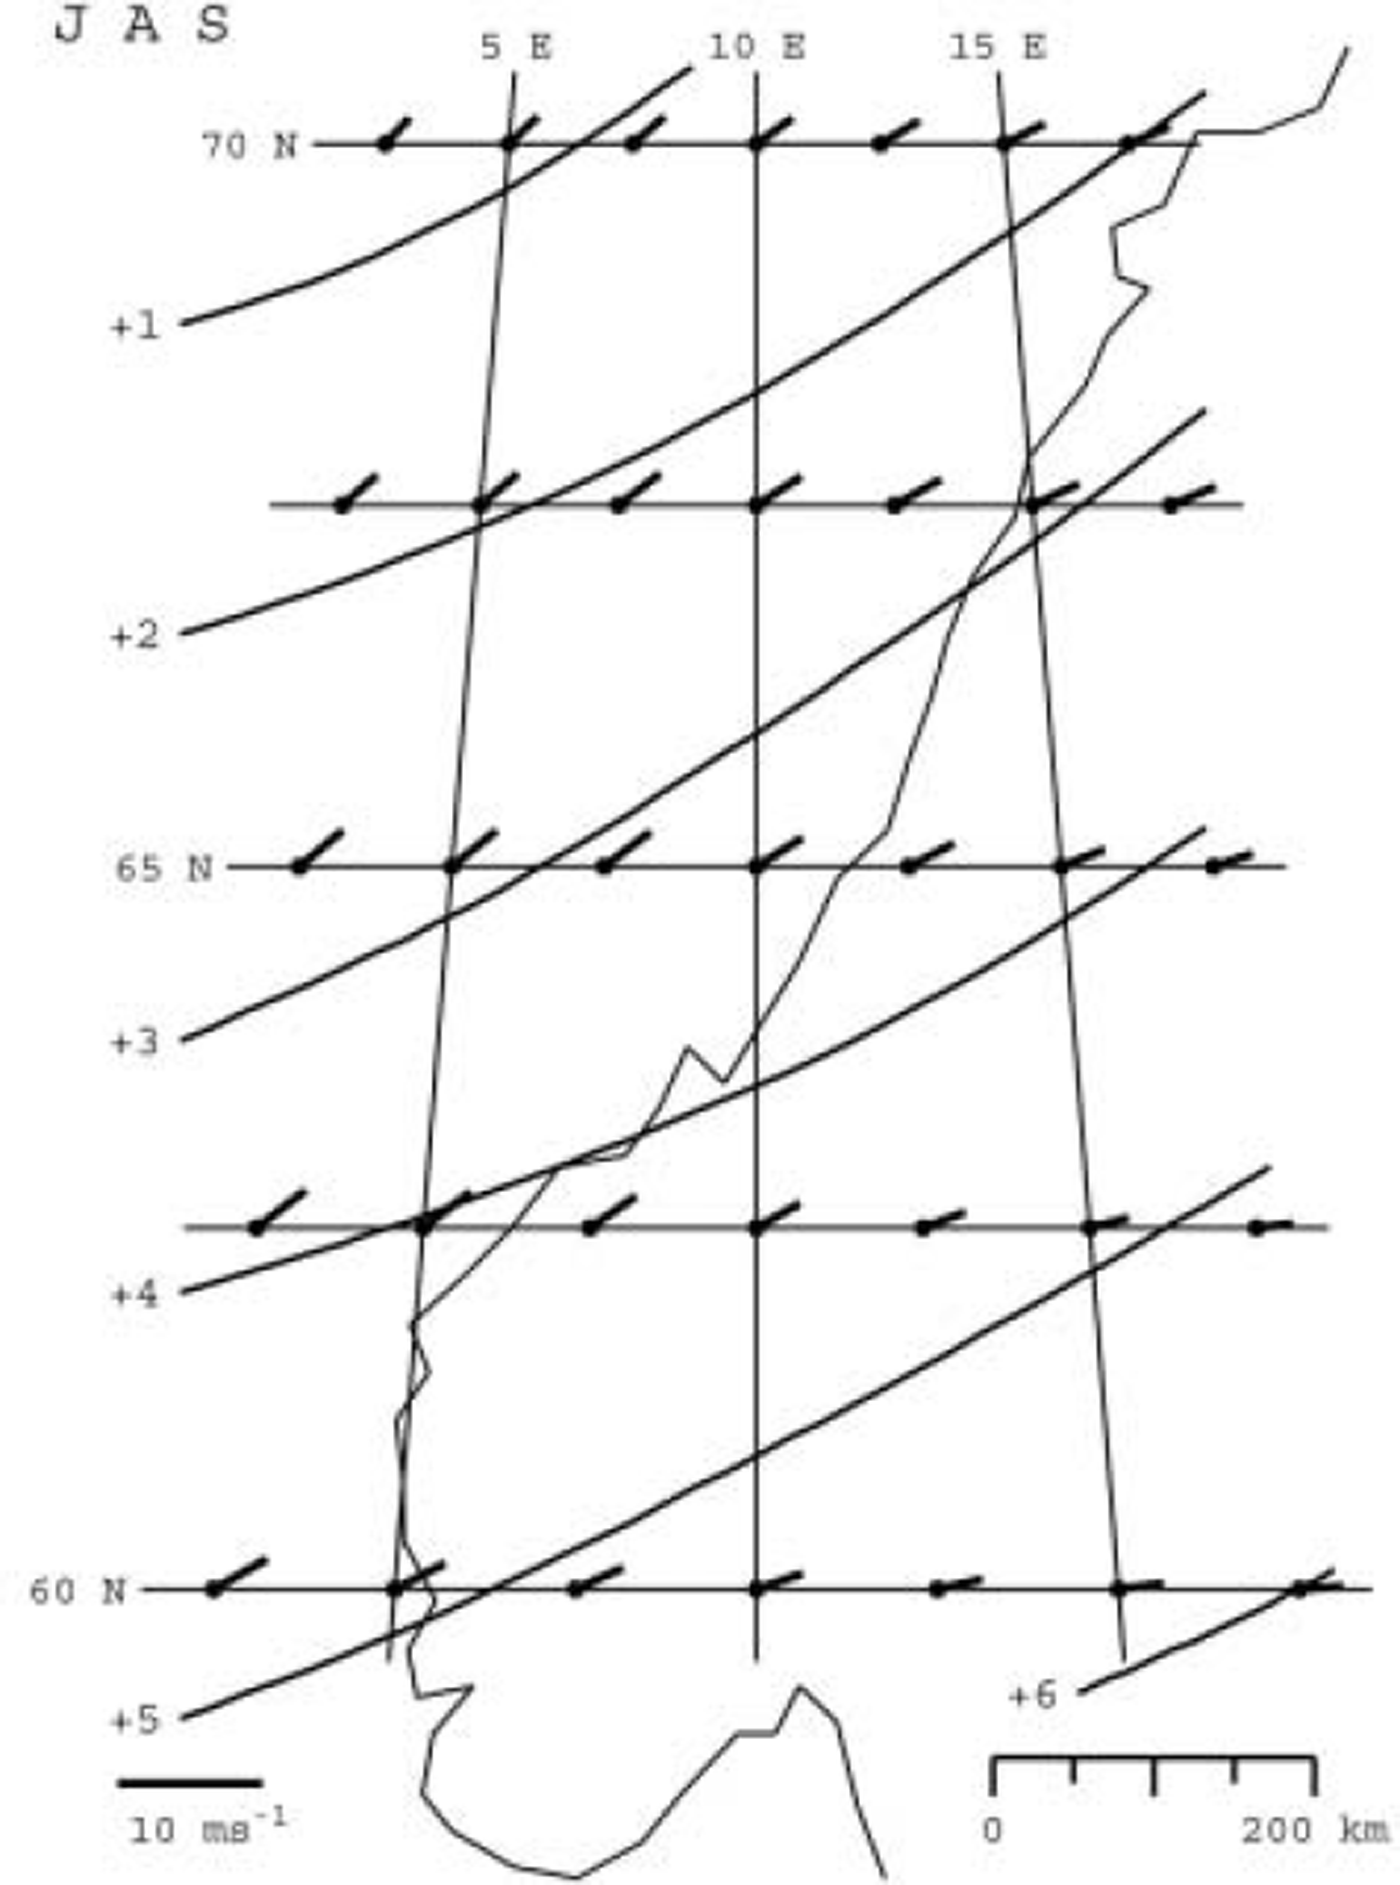
Wind at 850 hPa is generally southwesterly throughout the year, with a pronounced winter maximum of speed (Fig. 3). In winter over Scandinavia the mean 1960–99 direction of the 850 hPa wind is westerly, and the temperature gradient is south-southwestward (Fig. 4). In summer the mean direction is southwesterly, and the temperature gradient is south-southeastward (Fig. 5). In winter, the percentage value of RH varies from the high 70s over the sea to the mid-60s inland, and in summer from the high 70s in the northern part to the low 70s in the southern part.
Seasonal variation of mean 850 hPa conditions, 1960–99, at two NCEP/NCAR re-analysis gridpoints: 67.5˚ N, 12.5˚ E (light curve) and 62.5˚ N, 7.5˚ E (heavy curve). (a) Wind direction; (b) wind speed; (c) temperature; (d) RH; (e) precipitation flux; and (f) snow flux. Snow flux at 67.5˚ N, 12.5˚ E is calculated for altitude 300 m, and snow flux at 62.5˚N, 7.5˚E for 1500 m.
Mean January–March 850 hPa wind and temperature, 1960– 99. The line emanates from the gridpoint in the downstream wind direction with its length proportional to the speed.
Same as Figure 4, but for July–September.
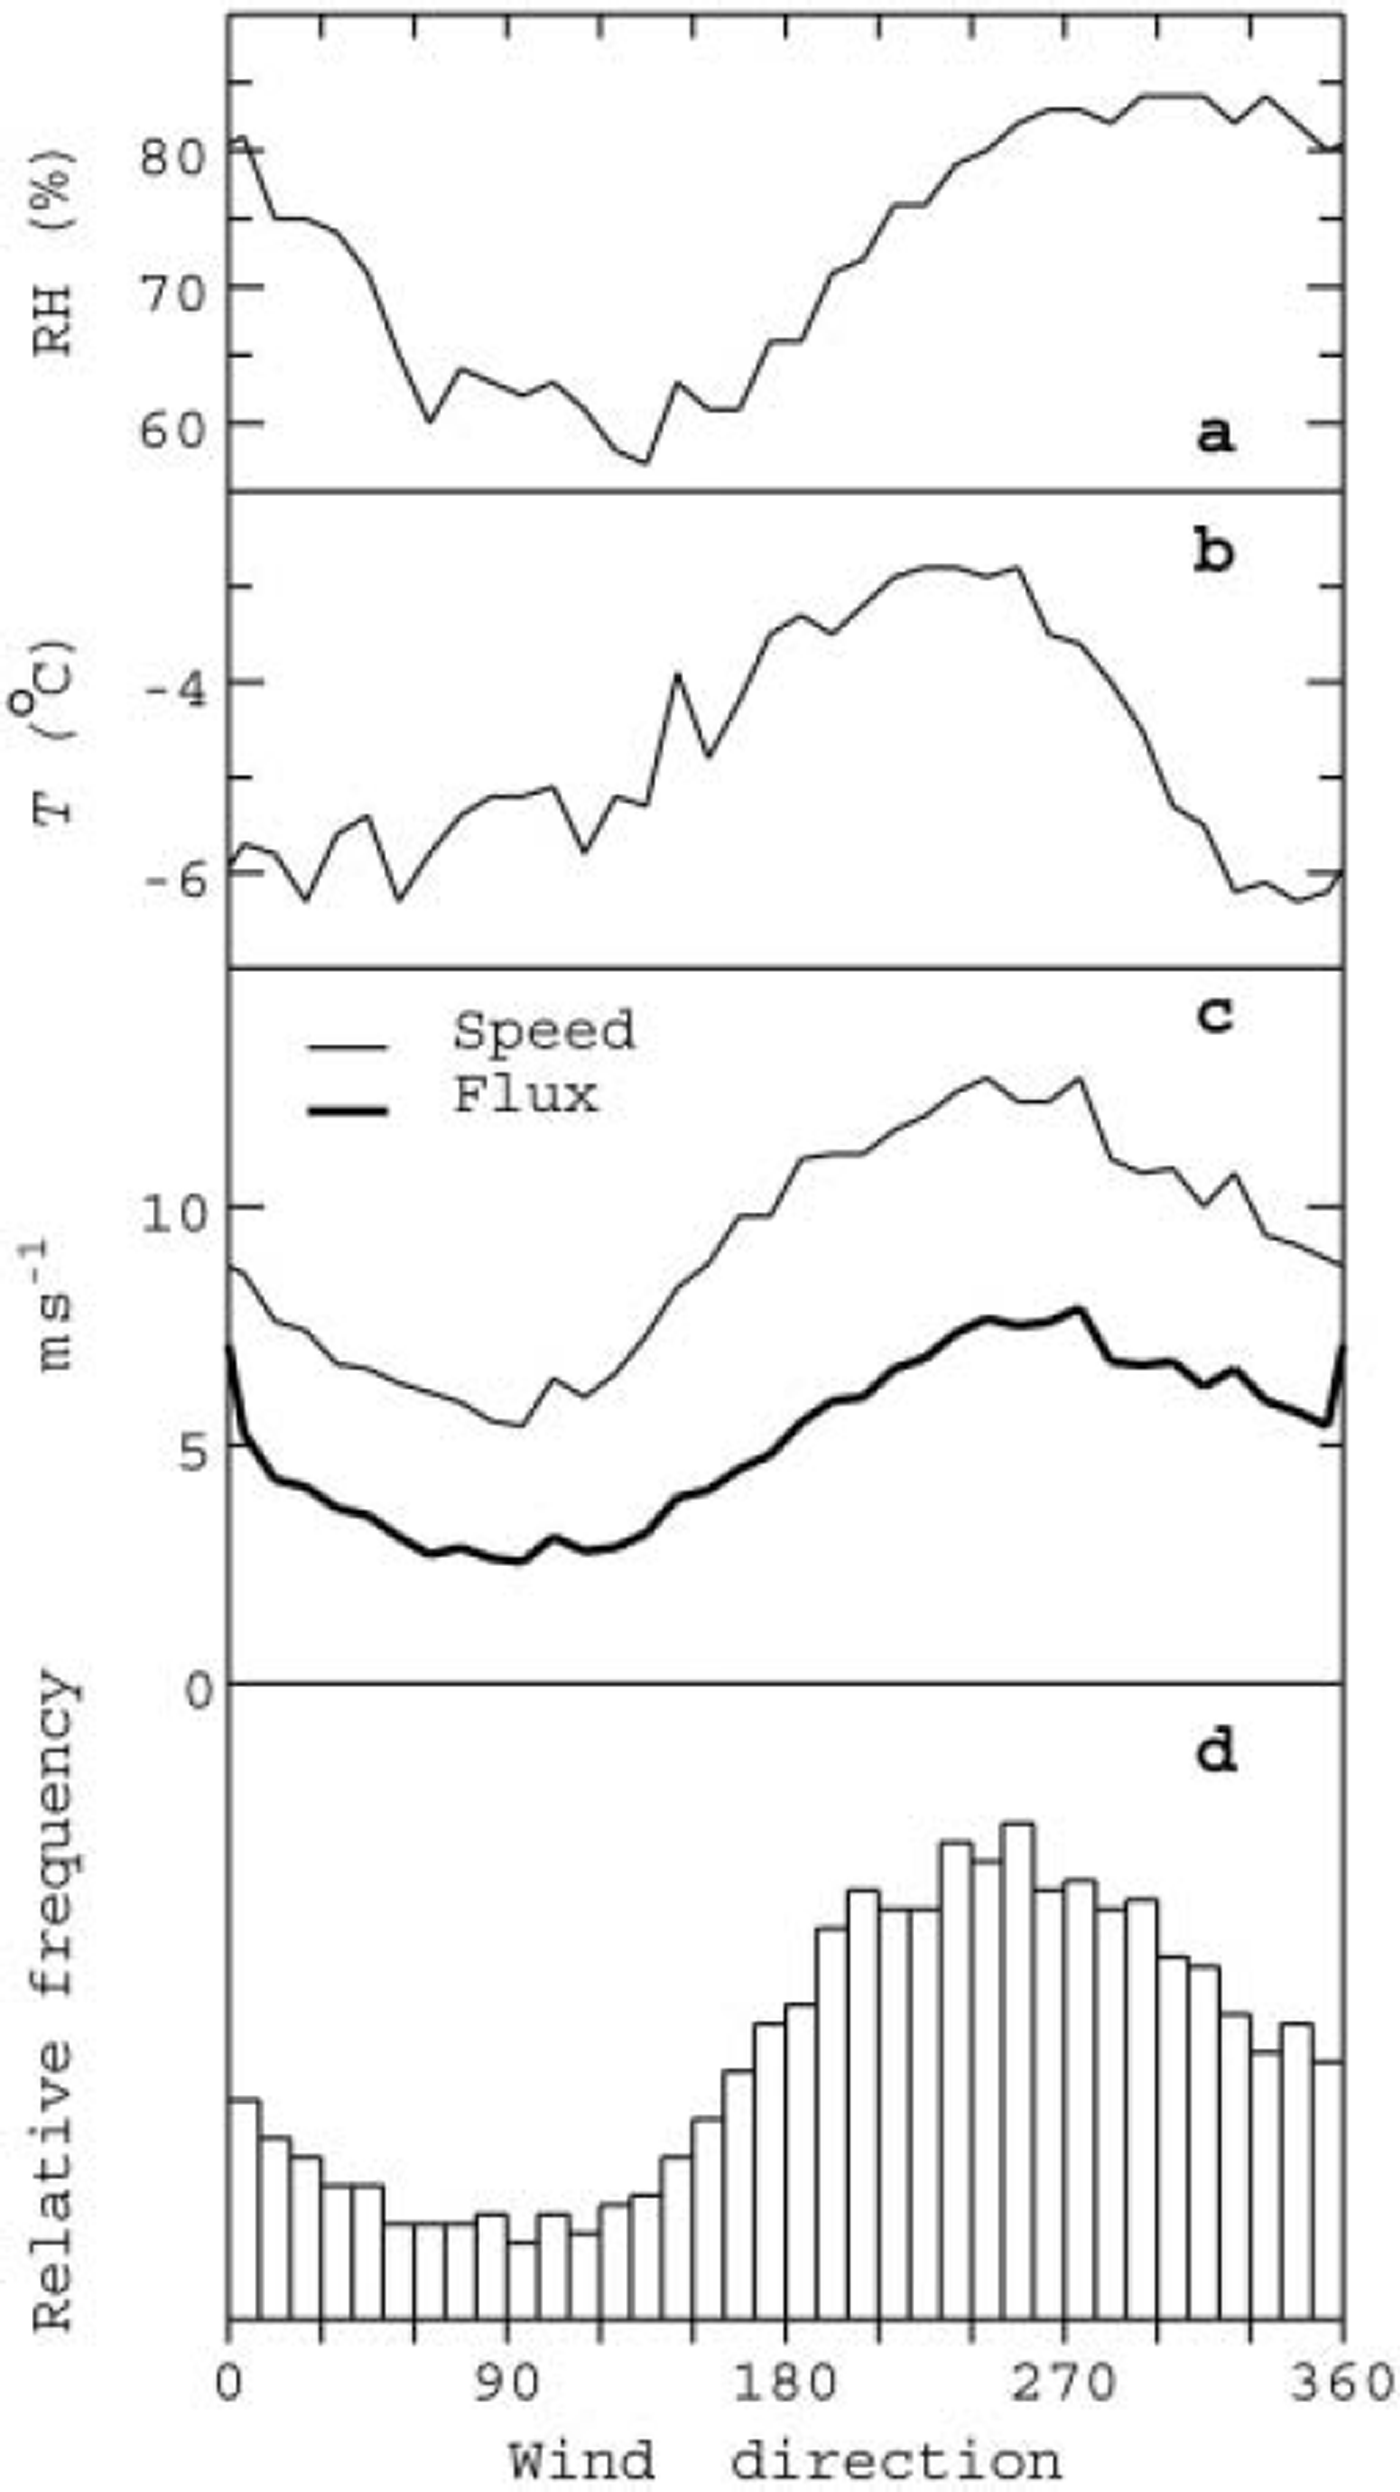
Over the entire year, the prevailing wind direction at 850 hPa is westerly (Fig. 6). The westerly wind is much stronger, warmer and more moist than the easterly wind, and, in combination with nearly uniformly high RH, this produces a winter maximum of precipitation flux F from the prevailing direction. The seasonal variation of temperature accentuates the variation of F to produce an even sharper summer minimum of snow flux f (Fig. 3).
Mean annual 850 hPa values, 1960-99, as a function of wind direction at 62.5˚ N, 7.5˚ E. (a) RH; (b) temperature; (c) wind speed and flux; and (d) relative frequency. The flux is RH times the wind speed when T < +2°C.
Trends
At all ten glaciers with records beginning by 1986 (Table 1), both b n and b w are more positive over 1989–2001 than before. As noted by Reference HagenHagen (1996), bn increased from 1988 to 1993 at Storglaciären and until 1994 at Engabreen and Nigardsbreen. Reference Holmlund, Karlén and GruddHolmlund and others (1996) attribute increased bn at Storglaciären until 1995 mainly to increased winter precipitation. Increases in bn since 1988 were the result of large increases in bw, while bs changed little.
The shift after 1988 is illustrated for Storbreen in Figure 7. Although winter temperature at the altitude of the glacier increased, it did not appreciably rob accumulation by shifting much precipitation from snow to rain, as warming did in western North America (Reference Rasmussen and ConwayRasmussen and Conway, 2004) and over the Patagonia icefields (Rasmussen and others, in press). Winters at Storbreen are so cold that warming did not move much of the temperature distribution to above the critical +2°C. Mean temperature during westerly (U>0 for φ’ = 246 °) flow increased from -4.2 to -3.9°C, and the mean snow ratio f/F only decreased from 0.91 to 0.90. Increase in precipitation amount overwhelmed the slight decline in f/F.
Time series of Storbreen mass balance and relevant meteorological variables, showing mean values for the periods 1949-88 and 1989-99. (a) Winter balance and net balance; (b) 850 hPa precipitation flux F; (c) 1500 m temperature (°C) when F > 0; and (d) AO index. (b) and (c) are from NCEP/NCAR gridpoint 62.5˚ N, 7.5˚ E; (b-d) are October-May averages.
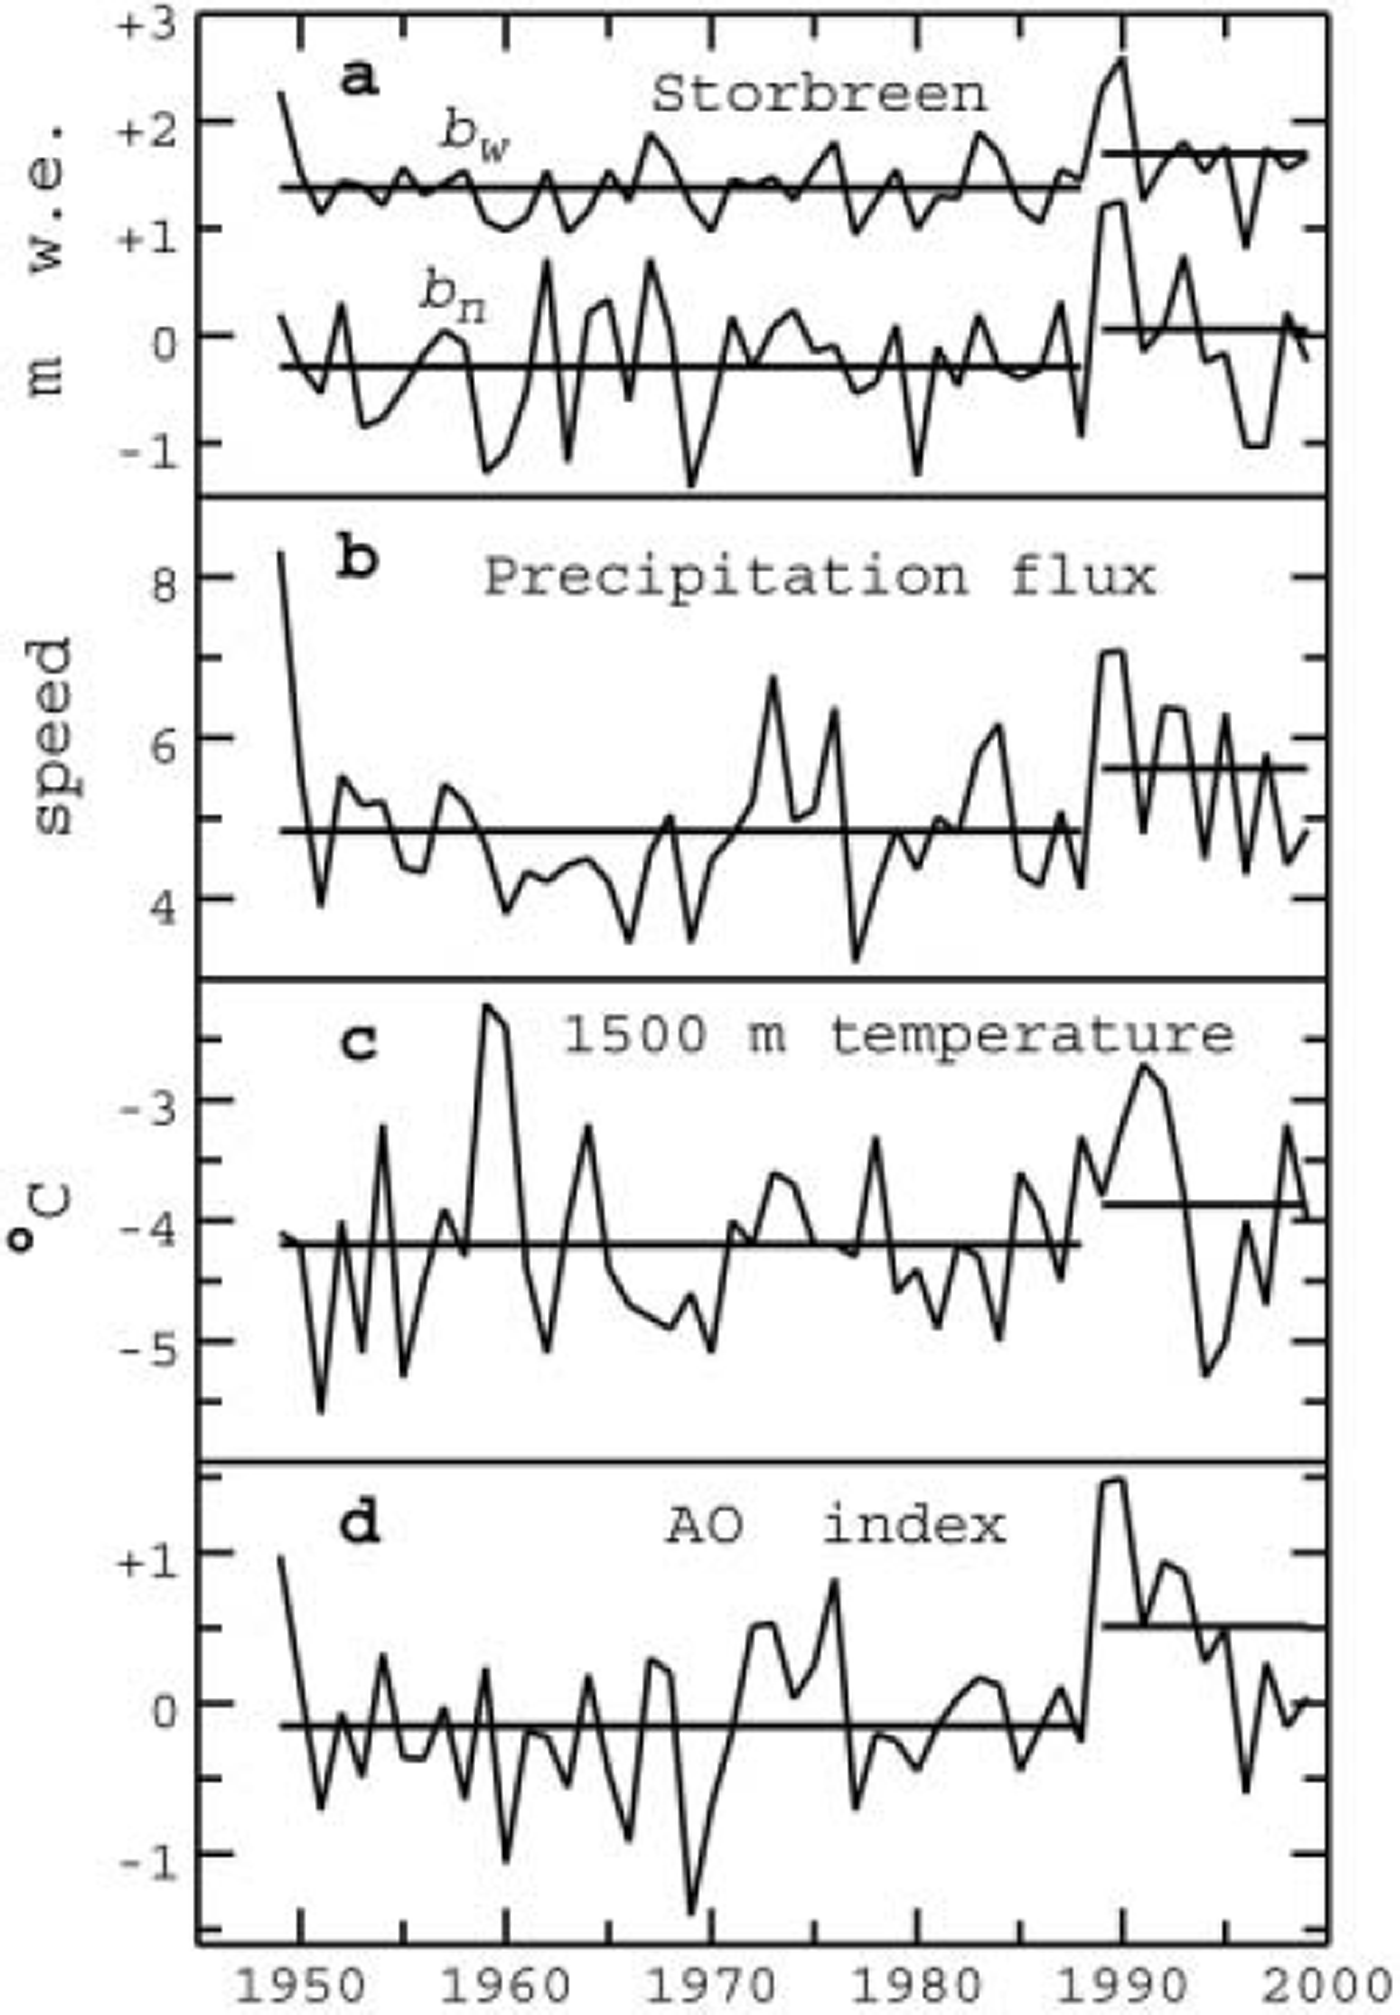
Total 1500 m warming at 62.5 ° N, 7.5 ° E in winter was apparently the result of two effects. One, as reflected by the change in winter AO and NAO, was increase in the incidence of westerly flow, which on average is 2.5 °C warmer than easterly (U≤0) flow (Fig. 6). The other was warming of both westerly flow (0.3 °C) and easterly flow (0.7 °C). The incidence of westerly flow increased after 1988 from 72.5% to 77.5% of winter days. Its strength also increased, resulting in an increase of the mean precipitation flux F from 4.8 to 5.6 ms–1. Mass balance over 2001-03, however, became more negative at both maritime and continental glaciers in Norway owing to drier winters and warmer summers (Reference Andreassen, Elvehøy, Kjøllmoen, Engeset and HaakensenAndreassen and others, 2005).
Conclusions
Mass gain by glaciers in Scandinavia during recent global warming is apparently the result of changes in mean atmospheric circulation over the North Atlantic that accompanied the warming. Unlike other regions, where winter warming shifts an appreciable amount of precipitation from snow to rain, over Scandinavia winter temperatures are so low that the warming shifted only a small amount. Increase in b n is due mainly to increase in b w resulting from increase in winter precipitation produced by the change in atmospheric circulation.
Although seasonal variation of large-scale patterns of SLP is indicative of mean atmospheric circulation, upper-air conditions in the vicinity of a glacier have a more direct and immediate effect. Their temporal variability better matches that of the two mass-balance processes, accumulation and ablation. Principal climatological variables pertinent to mass-balance processes are winter precipitation, winter temperature and summer temperature. The first two control mainly accumulation, the third mainly ablation. Because of non-linearities in the relations between meteorological conditions and the two processes, seasonal averages of large-scale patterns of SLP or SST generally do not correlate as well with seasonal totals of accumulation or ablation or, thus, with mass-balance components bw or bs or their sum bn.
Determining numerical values for regression coefficients in the model (Equations (2) and (3)), as well as critical direction φ’ and altitudes z
1 and z2, requires a mass-balance record. In the absence of a record, rough estimates (φ’ in the onshore direction, z1 low on the glacier, and z2
near the middle of it) permit forming time series of the snow fluxes
 and
 and temperature
 from the meteorological database. Relative changes in these variables will give a qualitative indication of relative changes in mass-balance components.
One of the great advantages of the model is that it uses a database that is global in extent, has daily or better temporal resolution, is free from missing observations and is maintained as an integral part of a major scientific enterprise. Another is that in using upper-air values it avoids situations in which low-altitude weather stations are blanketed by low-lying cloud while glaciers at higher altitude are in clear conditions. The accuracy with which the model estimates glacier mass-balance components is comparable to that of other methods.
Acknowledgements
This work was funded by US National Science Foundation grant OPP-0240861 and NASA grant 1215388. Valuable comments by J. Oerlemans led to a much improved paper. We thank E. Recker for extracting reanalysis data from NCAR and R. Ludwin for supplying coastline coordinates.