




No CrossRef data available.
A closer look at the constraint hierarchy: Order, contrast, and geographical scale
Published online by Cambridge University Press: 25 November 2003
Abstract
Close examination of five constraint hierarchies involved in the vocalization of /l/ in Australian and New Zealand English across five geolinguistic scales (individual, local, regional, national, and supranational) reveals patterns of variation that allow us to distinguish linguistic processes that are universal from those that are particular. Based on 42 goldvarb analyses, we use probability weights to measure the variation in the order and contrast within and across constraint hierarchies. Geolinguistic scale analysis shows that some constraints are scale independent (i.e., they do not vary in order or contrast with changes in geolinguistic scale), whereas others are clearly scale dependent and do vary systematically with changes in geolinguistic scale. We propose a universality continuum in which constraint hierarchies that exhibit near invariance across all geolinguistic scales are at one end of the continuum and constraint hierarchies that vary with geolinguistic scale are at the other end. Scale dependency in constraint hierarchies identifies where social processes can intervene in universal linguistic processes.We would like to thank Sali Tagliamonte for engaging with us in a discussion of the problems associated with comparing goldvarb analyses. We would also like to thank Meriam Meyerhoff for suggesting that we look at the individual scale. In addition, a thoughtful reviewer carefully laid out the potential statistical problems associated with our approach to the comparison of goldvarb analyses. We have attempted to defend the approach taken, but recognize that the discussion of comparative goldvarb analysis warrants further consideration.
Information
- Type
- Research Article
- Information
- Copyright
- © 2003 Cambridge University Press
INTRODUCTION
Comparative sociolinguistics
Comparative sociolinguistics is relatively new to the study of dialect variation, but the field has become increasingly important as the number of quantitative descriptions accumulates. One of the first to appear sought to demonstrate the historical relatedness of dialects (Poplack & Tagliamonte, 1991), and many other cross-dialectal comparisons have followed from these researchers (e.g., Godfrey & Tagliamonte, 1999; Poplack & Tagliamonte, 2001; Tagliamonte & Smith, 2000; a detailed description of this method can be found in Tagliamonte, 2002). A number of projects have the specific aim of comparing dialects, either to establish regional dialects (Labov, Boberg, & Ash, forthcoming), to explore how a vernacular relates to its surrounding dialect (Dubois & Horvath, 2003), or to bring together a large number of independent descriptions of a particular dialect, such as African American Vernacular English (Cukor-Avila, 2001). In this article, we compare dialects across a number of geolinguistic scales based on our analysis of an ongoing language change in progress: the vocalization of /l/ in Australian (AusE) and New Zealand English (NZE). Although we have described the variability of /l/ vocalization in these varieties of English elsewhere, here we expand our description in order to compare a series of 42 independent goldvarb analyses. The goal of the comparison is twofold: to further develop the methodology of comparative sociolinguistics and to examine more closely the sociolinguistic conditioning of the sound change in order to differentiate processes that are general/universal from those that are particular.
The geolinguistic approach we take shares some methodological similarities to Poplack and Tagliamonte (1991) and their colleagues in that independent goldvarb analyses are compared. They investigated the relatedness among dialects and when the variables were conditioned by the same constraints, which in turn were ranked in the same order across varieties, their interpretation was that the dialects share a single underlying grammar (Poplack & Tagliamonte, 1991:318). Order within the constraint hierarchy was important to their approach as was order among the constraint hierarchies (i.e., the factor groups in a goldvarb analysis). Our method takes a somewhat different path and has a different goal. We are primarily interested in a given constraint hierarchy in order to investigate the potential universality—or not—of the conditioning constraints. The aspects of the constraint hierarchy that are relevant to that goal are: consistency of the order of the constraints across the goldvarb analyses; the strength of the favoring and disfavoring constraints; and the degree of contrast between the promoter and the inhibiter.
Geolinguistic scale
Our geolinguistic project has focused on extending the methodology developed for the study of single communities to the study of a single sound change in a number of speech communities. Our approach is to identify a language change in progress, to collect data from a sample of speakers in a number of communities, and to use quantitative methods, particularly goldvarb analysis (Rand & Sankoff, 1990), along with graphs and maps to study the linguistic and social constraints on the variation in the data. Our approach to geography is to view linguistic variation and change through the fundamental categories of the discipline of geography: space, place, and scale. We have shown that current spatial models do not account for the geographical patterns of diffusion we have found for /l/ vocalization (Horvath & Horvath, 2001), but that the effect of place (i.e., geographical locality) does reveal both the geographic and linguistic patterning of /l/ vocalization (Horvath & Horvath, 2002). In this article we consider geolinguistic scale—that is, the nested hierarchical relationships as one moves from the individual member of a speech locality to the speech locality, to the region, to the nation and finally to the supranational scale—in order to examine the nature of the variability.
It is uncontroversial to say that all linguists work with a notion of geographical scale. Even the ideal speaker–hearer must be thought of as an individual who exemplifies the speech of some place: more than likely he or she speaks a mainstream variety of either American or British English and is highly unlikely to speak the English of the Shetland Islands. Geolinguistic scale, however, has not until fairly recently featured as a contested category. When quantitative sociolinguistics began to develop in the 1960s, the scales that dominated linguistic inquiry were—and remain for many linguists—the individual scale and the speech community scale. The criterion set out in Weinreich, Labov, and Herzog (1968:159) for the identification of a speech community was that the variant forms had to be jointly available to all adult members of the speech community. The social network approach introduced in sociolinguistics by Lesley and James Milroy (L. Milroy 1980; J. Milroy & L. Milroy, 1985) boosted dramatically the role of contact among members of the speech community, and their identification of dense or multiplex networks certainly opened up the possibility of partially explaining language change with reference to the amount and type of interaction among speakers in a community. The ethnographic approach taken by Eckert and others (Eckert, 1989; Eckert & McConnell-Genet, 1992) specifically sought out groups that had dense networks (communities of practice) in pursuit of the microstudy of language change. But for many variationists, the practical identification of a speech community is coterminus with a geographical unit, which can vary from large cities (New York City, Detroit, Montreal, Sydney) to small towns (Anniston, Ocracoke, Eunice), and no direct attempt is made to establish the quality or quantity of the interaction among the speakers in a sample. The overriding point remains, however, whether or not social networks are included in the design of the sample of speakers; all sociolinguistic studies are conducted in one or more given geographic locations. Although historical and geographical background is sometimes taken into account in the interpretation of the results of sociolinguistic investigation, rarely does the specific geographic location become a constraint to be analyzed alongside the linguistic and social constraints.
Geolinguistic scale has been important to the work of dialect geographers, who have focused on the identification of regions within a country, usually by attempting to determine the extent of particular linguistic forms. In days past, the features, often words, were directly plotted on a map, and isoglosses were drawn to circumscribe the region. Nowadays more linguistic analysis precedes the mapping of the variability (e.g., Chambers & Trudgill, 1999; Kretschmar, 1996). Geographic scale enters by the back door when we consider a national variety of a language. James Milroy's (2002:8) discussion of the history of English, for example, pointed out that national varieties are usually standardized languages; they are codifications that have more to do with historicism than scientific description. By contrast, Wells' (1982) accounts of national varieties of English attempted to characterize the synchronic varieties of English cross-nationally. At an even more inclusive geographic scale are the supranational varieties such as Australasian English or even Southern Hemisphere English (Gordon & Sudbury, 2002; Sudbury, 2000).
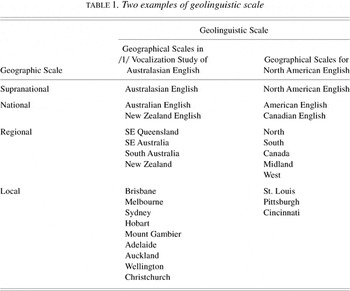
All linguists, then, describe linguistic patterns at some geolinguistic scale, even though scale itself is not included as an analyzed category. In this article we present a geographically scaled analysis of /l/ vocalization in Australia and New Zealand. The type of scale that is relevant to language is called a nested hierarchy and is comprised of the local, the regional, the national, and the supranational. We use the term “geolinguistic scale” to refer to this system of geographically embedded sociolinguistic hierarchies, such as those shown in Table 1.
Two examples of geolinguistic scale

Scale dependency
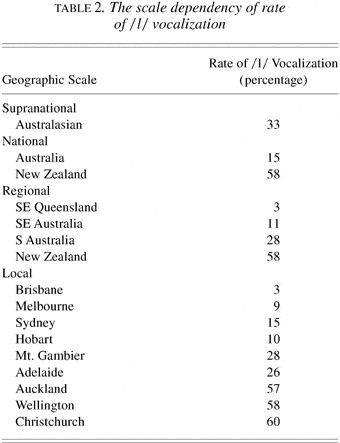
The discussion of scale effects in the natural and social sciences commonly draws a distinction between scale-dependent and scale-independent (or scale free) processes. The primary goal of studying the conditioning of a sound change across geographic scale is to determine whether the conditioning factors remain constant across all geolinguistic scales. In other words, does the structure of the constraints on the variability described for a given speech locality (e.g., Adelaide English) remain the same for all scales (e.g., South Australian English, Australian English, and Australasian English)? If it does, the patterns described are scale-independent, and if it does not, they are scale-dependent. Table 2, a simple example of a scale-dependent phenomenon, illustrates how constructing the data at each scale in this nested hierarchy involves aggregation when moving from the local to the supranational or disaggregation when moving down the hierarchy. The rate of /l/ vocalization changes as one moves from scale to scale. At the supranational scale it is 33%, whereas at the national scale it is 15% for Australia and 58% for New Zealand; at the local scale the percentages range from 3% to 60% across the speech localities. In this sense the rate of /l/ vocalization is clearly scale-dependent. This type of scale dependency can have a number of important implications. It indicates where the language change is most advanced, and it opens the possibility of observing the processes of change at different points on the change curve. When a general account is given of varieties of English around the world, the locality that informs the description of a national or supranational variety can make a difference in the importance given to a variable feature in that dialect. For example, a comparison of key features in Australian English and New Zealand English describes both AusE and NZE as having some /l/ vocalization; although this is certainly true, the differences between the two are extensive at the national scale (Gordon & Sudbury, 2002:83).
The scale dependency of rate of /l/ vocalization

Our approach to geolinguistic scale analysis is to examine the effect of scale on goldvarb results.1
A reviewer suggested that our analysis of geolinguistic scale effects was ad-hoc. Our method of distinguishing scale-independent versus scale-dependent patterns involves triangulating among three approaches: (1) applying goldvarb analysis following the usual procedures for detecting interactions, etc.; (2) using graphing procedures from exploratory data analysis to distinguish scale-dependent and scale-independent patterns; and (3) confirming when possible the interpretation of the patterns in the phonological and phonetic literature. See Paolillo (2002:146–151) for a discussion of ad-hoc model comparisons.
We begin our analysis by taking a closer look at the set of statistically significant constraint hierarchies that resulted from three goldvarb analyses at the supranational scale (i.e., the aggregation of all the speech localities in Australia and New Zealand) (previously reported in Horvath & Horvath, 2001; 2002). Two heuristic devices are introduced to interpret and compare the probability weights from different goldvarb analyses. The first is a qualitative interpretation of the strength of the probability weight associated with a given constraint in the hierarchy, and the second is a qualitative interpretation of the strength of the contrast between constraints in the hierarchy.2
The difficulty in comparing probability weights across goldvarb analyses is that the input probability (corrected mean) can affect the constraint weights. In our analysis, however, we found remarkable consistency in the actual probability weights assigned by goldvarb despite diverse input probabilities:

Order and contrast
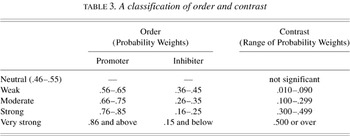
We are particularly interested in two aspects of the output of goldvarb analysis in the investigation of geolinguistic scale: order and contrast. By “order” we mean both the order of the constraints within a single constraint hierarchy as well as the consistency of that order across the geolinguistic scales. An important feature of order that we want to capture is the strength of the probability weights for individual constraints; even though a constraint hierarchy is determined by goldvarb to be statistically significant, the individual constraints within the hierarchy can vary from weak to strong. The index shown in Table 3 is a heuristic device that distributes the probability weights across a continuum from weak to very strong. Contrast is measured by what has been discussed in the quantitative variationist literature as range and is used to indicate which factor group is most important (has the largest range) or least important (smallest range) (Poplack & Tagliamonte, 1991; Tagliamonte, 2002). We prefer the term “contrast” because it takes the notion out of the genre of statistics and exposes the linguistic interpretation of the heuristic device. The size of the contrast also varies considerably, and we have proposed an index to allow us to distinguish qualitatively ranges that are weak, moderate, strong, or very strong. The contrast index is a measure of the relative strength of the contrast between promoter and inhibiter in a constraint hierarchy that has been determined to be statistically significant by goldvarb.
A classification of order and contrast

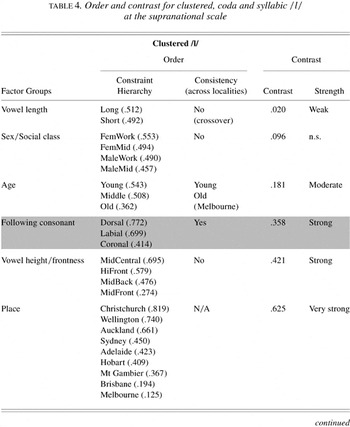
In the analysis of the vocalization of /l/, syllabic /l/ (puddle), coda /l/ (fill), and clustered /l/ (hulk) are always treated separately. Table 4 shows the results from the three goldvarb analyses at the supranational scale. The table lists the factor groups, the constraints ordered from the highest probability weight to the lowest in a factor group, and the consistency of the order across speech localities; also given are the measure and the strength of the contrast between the constraints having the highest and lowest weights. It is worth noting that the general pattern indicates that speech locality is always very strong, linguistic constraint hierarchies are usually moderate, or strong, age is moderate and other social characteristics are weak.
Order and contrast for clustered, coda and syllabic /l/ at the supranational scale

Table 4 continued

Table 4 continued

The list of constraints was used to select constraint hierarchies for geolinguistic scale analysis. Both order and contrast figured in the selection of the five variables (shaded in Table 4) for further analysis. We were looking for factor groups that maintained a consistent order across most or all localities and that made a moderate or strong contribution to the probability of the occurrence of /l/ vocalization. As it turned out, only linguistic variables were high enough on the index to warrant further analysis; sex and social class were ruled out because they were both weak and not consistent across localities. We chose all but two of the moderate or strong linguistic variables that showed consistency of all or of pairs of constraints across all localities for scale analysis.3
We excluded the vowel frontness for coda /l/ because of its strength index and vowel height/frontness for clustered /l/ because of a lack of confidence in the linguistic analysis of this complex variable.
To sum up, in this closer look at the constraint hierarchy, we note five characteristics beyond statistical significance that can be examined: (1) order, (2) strength of the probability weights, (3) contrast, (4) strength of the contrast, and (5) consistency of order and contrast across goldvarb analyses. It is the variation in these five characteristics across geolinguistic scale that we turn to now.
GRAPHIC ANALYSES OF GEOLINGUISTIC SCALE DEPENDENCY
Methodology
In order to study geographic scale dependency, we performed goldvarb analyses of the three types of /l/ vocalization at the surpranational, national, regional, and local scales; this involved 42 (14 scaled places × 3 types of /l/) goldvarb analyses.4
Typically there would be 16 goldvarb analyses for each type of /l/ given the geolinguistic scales shown in Table 1. However, SE Queensland at the regional scale consists of only one speech locality (Brisbane), and New Zealand at the regional and at the national scale consists of the same three speech localities (Christchurch, Wellington, and Auckland). Results of the goldvarb analyses are available from the authors by request (bhorvath@mail.usyd.edu.au).
- graphing the constraint hierarchy order as determined by the goldvarb analyses across all geolinguistic scales (the order graph);
- distinguishing constraints that maintain an invariant order relationship across all scales from constraints that do not (such constraints were labeled as promoters or inhibiters of the change); and
- graphing the degree of contrast between promoter and inhibiter (the contrast graph).
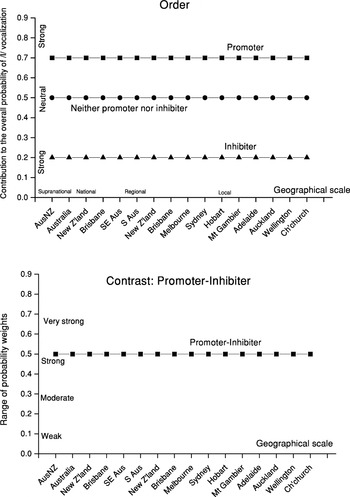
Figure 1 is an example of an order graph and a contrast graph for a hypothetical constraint hierarchy. On the order graph, the y-axis scale is the contribution to the overall probability of /l/ vocalization (the probability weight) made by each constraint in the hierarchy, taken from the separate goldvarb results, and the x-axis is the geolinguistic scale. The probability weight for each constraint is plotted on the order graph for each of the places on the geolinguistic scale. As usual with goldvarb results, probability weights of around .50 neither favor nor disfavor the vocalization of /l/, whereas weights above that figure favor and those below that figure disfavor /l/ vocalization. By comparing the ordering across the geolinguistic scale, we can distinguish invariant patterns of order among the constraints in the hierarchy from variable patterns. We reserve the terms “promoter” and “inhibiter” for constraints that are invariant; in cases where more than two constraints are invariantly ordered, the constraint most favoring is the promoter and the one most disfavoring is the inhibiter. The straight line, on the hypothetical graph indicates that the constraint hierarchy order is scale-independent because no change occurs across the geolinguistic scale.

Scale independent constraint hierarchy: A hypothetical example of order and contrast.
For the contrast graph, we plot the degree of contrast between promoter and inhibiter as measured by the difference in their probability weights. The y-axis is the scale of probability from 0 to 1, and the x-axis is the geolinguistic scale. The contrast is weak if the probability weights of promoter and inhibiter are close, but it becomes stronger as the gap between them increases. Comparison across geographic scale reveals any variation in the consistency of the contrast. Again, the straight line on the hypothetical graph indicates that the contrast is scale-independent because the contrast remains the same at all scales.
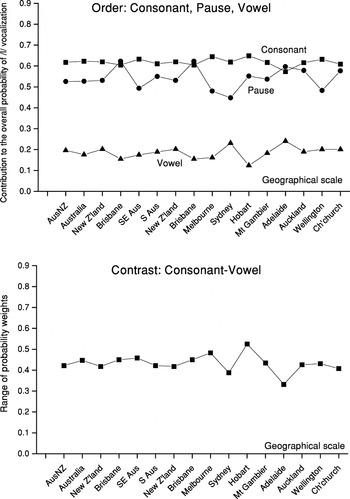
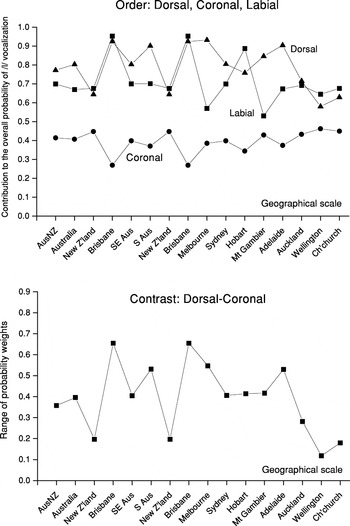
Although Figure 1 shows that both the constraint order and the contrasts among the constraints are invariant, none of the actual scale analysis graphs of constraint hierarchies have such perfectly straight lines. Nevertheless, the order and contrast graphs in Figure 2 show relatively straight lines, and we consider them to be scale-independent patterns. Deviations from a straight line indicate degrees of scale dependence, and there are many possible patterns of scale dependency. Notice that the contrast graph in Figure 2 shows a modest amount of variation at the locality scale, whereas the contrast graph in Figure 6 illustrates a pattern of scale dependence where the national, regional, and local scales operate together in Australia and in New Zealand, but produce different patterns (i.e., the contrast is moderate to strong in Australia and weak in New Zealand). There are two general observations to be kept in mind when examining the graphs for scale dependency. First, the most significant scale dependency is associated with the Australia/New Zealand border, and, second, some localities—especially Brisbane but in separate instances, Melbourne and Hobart—account for the major exceptions to the overall patterns.

Following environment for coda /l/.
Graphic analysis
Figures 2, 3, 4, 5 and 6 show an order and a contrast graph for the five constraint hierarchies. In this section we describe the patterns and provide an initial interpretation. The implications of the patterns are discussed in the final sections.
In Figure 2, the order graph shows a consistent order between a following consonant, which moderately favors, and a following vowel which strongly disfavors, coda /l/ vocalization; pause is neutral. Because the relationship between following consonant (promoter) and following vowel (inhibiter) exhibits a consistent opposition, this pair is plotted on the contrast graph. The contrast is strong between the pair, and both order and contrast graphs show scale-independent patterns of the conditioning of vocalization for the following environment for coda /l/ with a modest amount of variability at the locality scale.
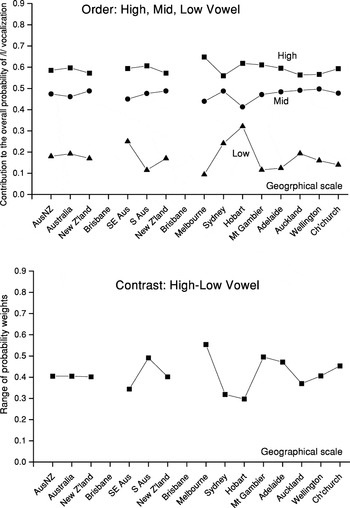
In Figure 3, the order graph for the vowel preceding coda /l/ shows an invariant constraint hierarchy; the same hierarchy found at the supranational scale is maintained across all scales. A high vowel moderately favors vocalization everywhere, and a low vowel disfavors, from moderate to strong, vocalization everywhere except Hobart. Although a mid vowel is always intermediate, it is also always neutral. Brisbane is not on the graph because the constraint hierarchy was not selected by goldvarb. The contrast graph of promoter (high vowel) and inhibiter (low vowel) shows that the supranational, national, and the South Australian region are scale-independent. The greatest variation occurs within the Southeastern Australia region; Melbourne has a very strong promoter–inhibiter contrast (the low vowels strongly disfavor vocalization), and Sydney and Hobart have a moderate contrast between promoter (high vowels) and inhibiter. What we see in Figure 3 is some degree of scale independence, but some scale dependence as well. The constraint hierarchy shows consistent order across all scales and exhibits consistent strength as measured by contrast and scale independence, except for the Southeastern Australia region.

Preceding environment for coda /l/.
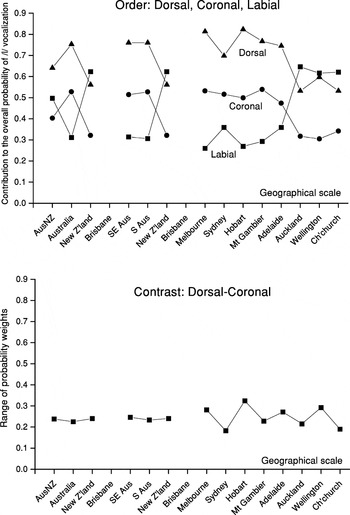
In Figure 4, the order graph for the preceding environment for syllabic /l/ shows that the ordering of a dorsal and a coronal consonant is invariant across all scales. Labial is inconsistently ordered with respect to the other two; we have referred to this elsewhere as a crossover (Horvath & Horvath, 2001, 2002). In Australia, dorsal strongly favors, coronal is neutral, and labial moderately disfavors. In New Zealand, dorsal is neutral, coronal moderately disfavors, and labial crosses over to become the most favoring environment. Although the order graph shows scale dependence because of the crossover of labial, the contrast graph shows a scale-independent relationship between dorsal (promoter) and coronal (inhibiter). The strength of the contrast is moderate.

Preceding environment for syllabic /l/.
The two scale-independent constraint hierarchies considered thus far (Figures 2 and 3) are possible universal constraints on the vocalization of /l/. Figure 4 is another potential universal context for /l/ vocalization, and yet in the order graph we find geographic variation at the Australia/New Zealand border. In other words, we find one constraint hierarchy in Australia at the national, regional, and local scales and another constraint hierarchy in New Zealand at the national and local scales. We refer to this kind of pattern as an example of variability within universality.
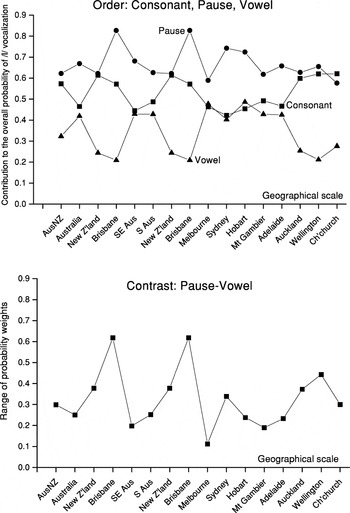
The next two graphs show a greater complexity of variation in both the order and contrast graphs than we have seen so far. Both show clear scale-dependent patterns. In Figure 5, the order graph for the following environment of a syllabic /l/ shows a considerable amount of variability. Although there is a consistent relationship between a following pause and a following vowel, a following consonant is fairly erratic. While pause generally moderately favors vocalization, vowel varies between strongly and weakly disfavoring vocalization. In addition, there are different patterns in Australia and New Zealand. Pause moderately favors vocalization in Australia, and consonant and vowel are neutral; Brisbane is the exception. In New Zealand, vowel becomes strongly disfavoring, and consonant and pause jointly moderately favor. We show pause as the promoter and vowel as the inhibiter on the contrast graph for this constraint hierarchy. Both the order and the contrast graphs show scale-dependent patterns that coincide with the national border. The contrast between consonant as promoter and vowel as inhibiter is more likely to be the phonetically expected universal, with pause less of a controlling constraint. Certainly the consonant/vowel pair does have a pattern that is interesting in both geographic and linguistic terms. The moderate strength of the contrast between consonant and vowel, which obtains at the supranational scale, is markedly different from the other geolinguistic scales. With the exception of Brisbane, which we discuss separately, all of the localities that show a stronger contrast than the supranational scale are in New Zealand; the points weaker than the supranational scale include only Australia at the national, regional, and locality scales. The linguistic pattern is associated with what we have called “clarity of pattern”; the strong contrast found in New Zealand represents the emergence of an unambiguous clarity in the constraint pattern in New Zealand. The weak contrast in Australia shows that such clarity is absent there. Clarity of pattern indicates a strong separation between promoters (here consonant) and inhibiters (vowel) of a linguistic change and is seen in the stronger contrasts for New Zealand and the weaker contrasts for Australia. The Brisbane results show a strong three-way contrast for following environment, and the sound change is at a very early stage. There are a substantial number of tokens (622) for Brisbane, but only 19 (3%) of the syllabic /l/s were vocalized and only the following environment was selected by goldvarb as statistically significant. It may be that stage in the change process accounts for the consonant/vowel contrast pattern, but we are left with the need to explain why an early stage and a late stage of a language change should pattern in similar ways.

Following environment for syllabic /l/.

Following environment for clustered /l/.
In Figure 6, the order graph for following consonant for clustered /l/ shows the moderate to strong effect of dorsal in favoring vocalization (compare the dorsal constraint for syllabic /l/ in Figure 3). Labial is erratic but generally follows the dorsal pattern. Coronal weakly disfavors vocalization, except in Brisbane. There is a sharp and consistent contrast between dorsal as promoter and coronal as inhibiter in both Australia and New Zealand. The contrast graph of the dorsal and coronal pair is another scale-dependent pattern where the national, regional, and local scales operate together but in different ways in the two countries. The contrast is generally strong in Australia and weak in New Zealand.
The individual scale
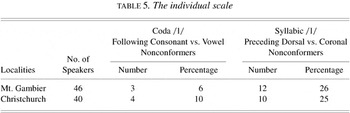
We can find out more about the patterning of variable sound change by looking at the individual scale. Much of linguistic work is done at this scale, and it completes our scale analysis. We do not examine the individual scale in detail but instead use two of the patterns that we have already found at higher geolinguistic scales to determine whether individuals conform to those patterns. We examine all of the individual speakers for two localities, Mount Gambier in Australia, which has 46 speakers in the sample, and Christchurch in New Zealand, which has 40 speakers. These two places were chosen because of the comparable number of speakers and the fact that /l/ vocalization is most advanced in these localities in their respective countries. We examine two pairs of linguistic constraints that are scale-independent because, as we have suggested, they are potential universals and we may expect high rates of conformity among individuals to the patterns identified. We look at following consonant and vowel for coda /l/, which maintains a strong contrastive relationship across all geolinguistic scales, and preceding dorsal and coronal for syllabic /l/, which maintains a weak contrastive relationship across all geolinguistic scales. The method we use is as follows. For each individual, we determine the percentage of /l/ vocalization in each environment; for each pair of contrasts, we find the difference between promoter and inhibiter (i.e., the contrast, but using percentages this time) and note any individuals who do not conform to the expected pattern (i.e., whose vocalization rate is higher in the presence of the inhibiter than in the presence of the promoter). The results are displayed in Table 5.
The individual scale

The results are interesting, given the graphic analyses of these two constraint hierarchies. For the following environment of a coda /l/, we found that the order was consistent across all scales, the contrast was strong, and the patterns were scale-independent. For the preceding dorsal/coronal for syllabic /l/, the order was consistent for this pair of constraints but, when labial was added, the pattern was scale-dependent. The contrast graph showed a moderate strength of the relationship between dorsal and coronal, and the pattern was scale-independent. The individual results show that the pair of constraints with the strongest contrast (consonant/vowel) has the smallest number of nonconforming speakers for each locality; the weaker pair shows that, for both localities, a quarter of the speakers did not conform to the expected pattern. Guy's (1980) often cited discussion of the relationship between the group and the individual is of course relevant here, and this finding may suggest that, given more data, not all constraints would pattern like the locality.
What the individual scale reveals is that this is the scale of greatest variability, and the percentage of nonconforming appears to match the relative strength of the contrast in pairs of constraints. This finding supports the decision to examine the contrast between promoters and inhibiters as a potentially important aspect of the conditioning of language change.
DISCUSSION: VARIATION WITHIN UNIVERSALITY
The form of multiscale analysis we have used treats the five scales in Australia and New Zealand as a nested hierarchy, which in our case is achieved by aggregating the /l/ vocalization data from the lower scale to the higher ones. An advantage of a nested hierarchy approach to multiscale analysis is that the properties of such systems, such as changes in the parameters of statistics as a result of moving up or down the scale, are relatively well known. When the relationship between two variables is measured by such statistics as correlation, regression, or principle components analysis, the strength of the parameters increases with aggregation (Johnston, 2000b:518–519). The disjuncture between the scale of the individual and the locality scale is greatest because the behavior of some individuals will not reflect the findings at the locality or above scales. Errors in predicting the behavior of individuals from aggregated higher scale analysis is called the ecological fallacy, and the reverse—projecting the findings about individuals to the group—is called the individual fallacy (Johnston, 2000a:190–191). Our examination of the individual scale showed the percentage of individuals who did not conform to the order established at the higher scales of analysis.
When natural and social scientists examine the effects of scale on the subjectmatter of their disciplines (e.g., climate, landscape ecology, political geography, etc.), they do so in order to determine whether an observed pattern is the product of local conditions or a local response to conditions present at some other scale, from the regional to the global. When we use the concept of scale for language change, we want to be able to distinguish those patterns of variation in the conditioning of change that are local and those that are not.
Generally speaking, the probability weights of the constraints are the focus of goldvarb analysis since most studies are of a single community and report only a single goldvarb analysis. By contrast, comparative sociolinguistics, exemplified by Poplack and Tagliamonte and their colleagues, has focused on the importance of consistency across independent goldvarb analyses in two aspects of order: the order of the constraints within a factor group and the order of the factor groups with respect to each other. They interpreted consistent order to be evidence of genetic relatedness. We wanted to investigate in detail constraint order and contrast, as defined by the difference between the weight of the promoter and the weight of the inhibiter across a number of speech localities.5
Our intention here is not to establish a relatedness among these dialects, although we do not preclude such an interpretation. We believe that a prior question needs to be investigated before constraint hierarchy can be used in support of relatedness among dialects. If constraint order is an inherent property of a particular sound change (i.e., if the conditioning of a given sound change is universal or even highly likely, whether in one language or in language in general), then constraint order needs to be carefully considered before a genetic interpretation can be made.
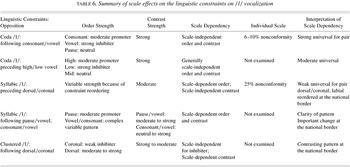
Summary of scale effects on the linguistic constraints on /l/ vocalization

We examined order across all scales to determine whether all of the constraints in a hierarchy maintained the same relative position with respect to probability weights. We found it to be unusual for all constraints to maintain a strict order with respect to one another; more often we found that a pair of constraints was strictly ordered and that a third constraint was not consistently ordered. For instance, the preceding consonant constraint hierarchy for syllabic /l/ exhibits both a scale-dependent constraint (labial favors most for New Zealanders and disfavors most for Australians at all scales except the supranational scale) and a pair of scale-independent constraints (dorsal always favors and coronal always disfavors the vocalization of syllabic /l/ at all geolinguistic scales). It is the latter oppositional pair that is likely to be a universal constraint on syllabic /l/ vocalization. This interpretation received support from phoneticians such as Sproat and Fujimura (1993), who described /l/ as a bi-gestural sound, having both a coronal (consonantal) and a dorsal (vocalic) gesture, and from Borowsky's phonological analysis (Borowsky, 2001; Borowsky & Horvath, 1997), which argued for an assimilation process so that a dorsal gesture (a vocalized /l/ in this case) is favored following a dorsal consonant. Labial is not structurally controlling and is scale-dependent. Even in those cases where all of the constraints maintained order across all geolinguistic scales (e.g., Figures 2 and 3), the third constraint in the group exhibited only a neutral effect. The pairs of constraints turn out to be traditional phonological oppositions, such as consonant/vowel, dorsal/coronal, or high and low vowels.
Whereas order considers only the relative position of constraints with respect to each other, contrast is concerned with the relative distance between (pairs of) constraints. We can determine the degree of distance between the probability weights for the constraints, and by comparing the contrasts across geolinguistic scales we can observe whether the degree of distance is maintained across scales (i.e., scale-independent). A scale-independent contrast is a more difficult criterion to set for determining whether a constraint hierarchy should be considered a universal constraint than is scale-independent order alone. A comparison of order, contrast, and scale dependency yields a variety of possible patterns, as shown in Table 6. Of the five constraint hierarchies we examined, order can be maintained for all constraints, for only a pair, or not be maintained at all; the contrast can be strong, moderate, vary from one geolinguistic scale to another, or even be negative when the constraints do not maintain the same order (i.e., a crossover). In addition, order and contrast can have the same type of scale dependency or they can differ.
The measure of contrast we use can hide some important patterns unless the order strength for the individual constraints is also included in the comparison. The contrast strength could mean that the constraints are equidistant from some point, say the neutral (.50 probability weight), but it could also mean that one constraint is strongly favoring the change whereas the other is only moderately disfavoring it. By labeling the order strength, we can observe the variable patterns of promoters and inhibiters of change. Therefore, in addition to order, contrast, and scale dependency, we need to have more information about promoters and inhibiters. One of the unexpected patterns that emerged from our analysis is the role of the inhibiter. In the two cases where we found a constraint hierarchy that exhibited strong order and strong contrast, it was the inhibiter that was strong. In other words, the role of the constraint hierarchy, or the strongest member of the constraint hierarchy, is to disfavor the change, to stand in the way of the change happening. From the start, variable rules have been written to favor the change (the application of the rule); although this has no grave consequence (the nonapplication of the rule has always been known as well), it may have prevented our appreciation of the importance of disfavoring contexts. Perhaps strong disfavoring constraints are part of the story about why some sound changes do not seem to reach completion.
Given the interplay of order, contrast, scale dependency, and the role of promoters and inhibiters, numerous patterns of variation are possible. If by “universal” linguists mean a consistent ordering of a constraint hierarchy, then all five constraint hierarchies shown on Table 6 qualify because they are either fully consistent or have consistent pairs of promoters and inhibiters. However, because we have recognized both the strength of individual constraints as well as the strength of the relationship between pairs of constraints within a given hierarchy, we have been able to show variability within this universality. There is clearly variation in terms of the strength of the contrast and/or the varying strength of the promoter/inhibiter order. In the case of Figures 2 and 3 these are scale-independent constraint hierarchies with a strong contrast, whereas Figures 4, 5, and 6 show variable strength of contrast and are all scale-dependent in some respect. Furthermore, the scale dependency occurs in all three cases at the border between Australia and New Zealand. Order can be universal, but variation is possible in terms of the varying strength of the contrast and/or the varying strength of the promoter/inhibiter.
CONCLUSION
Because social class and sex, together and in separate factor groups, were weak at the supranational scale and were frequently not selected by goldvarb analyses at the locality scale (Table 4), the importance of the social dimensions of language change may appear to have been lost in our discussion of /l/ vocalization. However, nothing could be further from the truth. We cannot overlook the importance of the place (locality) constraint hierarchy in our studies. As Table 4 shows, place consistently made the most important contribution to the variability of /l/ vocalization for all three goldvarb supranational analyses. In addition, our scale analysis showed that the national border between Australia and New Zealand is the locus of the variability within universality patterns we found. The concept of place, as geographers understand it, is first and foremost a social category. Doreen Massey's description of the category captures the concept of place when she noted that place is constructed “out of the particular constellation of social relations, meeting and weaving together at a particular locus” and that “each place is the focus of a distinct mixture of wider and more local social relations” (Massey, 1997:322–323). (See Horvath & Horvath, 2002 for further discussion of place as a social category.)
What is clear is that the social dimension of the vocalization of /l/ is of paramount importance, but that the analytical categories we have for detailing and measuring “the constellation of social relations” is inadequate. A number of sociolinguists have written about the need to rethink the social dimension of variationist studies (e.g., Eckert [1997]) on the age variable. Alternative approaches that have been used to good effect include Eckert's (1989) study of communities of practice, Milroy's use of social networks, and Dubois and Melancon's (1997) analysis of extensive sociolinguistic questionnaires all of which are examples of approaches that can help us describe and understand how the social intervenes in the process of language change.
We have proposed that the sociolinguistic conditioning of language change can be universal, but we have found variability within that universality. Although it seems contradictory to speak of variability within universality, it is not a new concept for linguists. Comrie (1981) discussed whether it is more appropriate to speak of exceptionless universals or of tendencies. He argued that a universal tendency might best be thought of as a “statistically significant deviation from random patterning” in which case an absolute universal is “just the extreme case of deviation from random patterning.” Although in most sciences “arbitrary exceptions to supposedly general laws” are not permitted, Comrie argued that it is the responsibility of a linguist to account for significant patterns in language, even when counterexamples to universals can be found (Comrie, 1981:19–20). We would argue that many of the exceptions to universals we have found in our study of the vocalization of /l/ were not arbitrary at all but, like discussions about free variation in early variationist literature, were examples of patterns of variation that are explicable in both linguistic and social terms.
Following Comrie, we can conceive of universal conditioning as a continuum of tendencies ranging between some degree of deviation from the general pattern to near categorical evidence of it. By describing variation at the level of the constraint hierarchy as a whole across many speech localities, sociolinguists can begin to discover the potential linguistic and social sources of variability within universality. Our geolinguistic scale analysis of the five constraint hierarchies indicates that they all exhibit universality, although they occupy different positions on the universality continuum. We are now in a position to consider the sociolinguistic mechanisms that produce the continuum of universality.
We have identified four processes for the sound change under consideration. First, there is an oppositional pair of phonological features in which one of the pair has a consistently strong effect on the sound change. Our two examples both show strong inhibiters (following vowel for coda /l/ and preceding low vowel for coda /l/) and both have moderate promoters. This mechanism leaves little room for social intervention and results in a near categorical universal controlled by the linguistic properties alone. However, data from the individual scale indicated that it is still possible to get variation within these universals, although the percentage of individuals was quite small and statistical fluctuation cannot be ruled out. In both examples of this kind of mechanism, there is a third constraint that is neutral: it neither favors nor disfavors the change. We can only speculate that another source of variability may be available given this third constraint. A pause in the following environment of coda /l/, for example, is potentially open to social intervention (in our own study we have an example of a following pause favoring the vocalization of syllabic /l/).
Second, there is an oppositional pair of phonological features in which one of the pair has an inconsistent effect on the sound change, although the pair universally maintain the relative positions with respect to each other. This is the case where the order of the constraints varies because of a third constraint. The strength of opposition between a preceding coronal/dorsal for syllabic /l/ is weak but universal; however, a preceding labial, the third conditioning constraint, is not neutral; it either favors or disfavors the sound change. The weakness of the oppositional pair and the potential to manipulate the effect of a preceding labial allow for social intervention and move this universal away from the categorical end of the continuum.
Third, there is the increased rate of the occurrence of the incoming sound change. We have found that increased rate is associated with a clarity of pattern among the conditioning constraints (e.g., following environment for syllabic /l/). In terms of describing the position on the universality continuum, we would say that the conditioning environment moves toward the categoricality end of the continuum, as the sound change itself moves toward categoricality, and may have to do with phonological restructuring. Whereas the rate of change is clearly open to social intervention (e.g., a change may reach some point at which it is negatively evaluated and is disadopted or becomes stagnant), grammatical restructuring may be a universal linguistic process.
Fourth, there is competition between a strong preceding and a strong following environment. The evidence here is weak because we had only the example of clustered /l/. However, it is worth investigating in future research whether such situations might also be open to social intervention.
Variability within universality is produced by both linguistic and social mechanisms. Universality is primarily a fact about linguistic structure, and variability occurs where linguistic structure permits. Universality is the product of the interaction between the inherent linguistic properties of the changing sound and the inherent linguistic properties of the surrounding context. Deviations from universality arise from two sources. The strength of contextual constraints can create some degree of variability within universality. However, a higher degree of deviation from universality occurs when the linguistic context of the change includes a constraint within a hierarchy that is neutral—not in the statistical sense, but because the linguistic properties of the constraint do not interact with the changing sound in any predictable or controlling way. Social intervention in the sound change process creates variation within universality in at least two ways. The neutral constraints are available for social manipulation and are a source of dialect differentiation. The degree of participation in the linguistic change (i.e., the rate of use of the incoming sound change) is also open to social manipulation. The degree of social participation, as reflected in the rate of occurrence of the incoming sound, is particularly significant if it is the case that a higher rate leads to restructuring.
In sum, the picture that is becoming apparent is that variability within universality is the result of both linguistic and social mechanisms. Not all of the linguistic features in the context of a sound change have a controlling role in the change, and the features that are less controlling open up the possibility of social intervention. This accounts for why the same sound change may take different paths in different dialects even though the constraints conditioning the change are by and large universal.
References
REFERENCES
Borowsky, T.
(2001).
The vocalization of dark l in Australian English. In
P. Collins &
D. Blair (eds.),
English in Australia.
Amsterdam:
Benjamins.
Borowsky, T., &
Horvath, B. M.
(1997).
L-vocalization in Australian English. In
F. Hinskens,
R. van Hout, &
W. L. Wetzels (eds.),
Variation, change and phonological theory.
Amsterdam:
Benjamins.
101–123.
Chambers, J. K., &
Trudgill, P.
(1999).
Dialectology.
Cambridge:
Cambridge University Press.
Comrie, B.
(1981).
Language universals and linguistic typology.
Oxford:
Blackwell.
Cukor-Avila, Patricia.
(2001).
Co-existing grammars: The relationship between the evolution of
African American and White Vernacular English in the South. In
Sonja L. Lanehart (ed.),
Sociocultural and historical contexts of African American English.
Philadelphia:
Benjamins.
93–127.
Dubois, S., &
Horvath, B.
(2003).
Verbal morphology in Cajun Vernacular English: A comparison with
other varieties of Southern English.
Journal of English Linguistics. pp.
34–59.
Dubois, S., &
Melancon, M.
(1997).
Cajun is dead—long live Cajun: Shifting from a linguistic to
a cultural community.
Journal of Sociolinguistics
1:63–93.Google Scholar
Eckert, P.
(1989).
Jocks and burnouts.
New York:
Teachers College Press.
Eckert, P.
(1997).
Age as a sociolinguistic variable. In
F. Coulmas (ed.),
The handbook of sociolinguistics.
Oxford:
Blackwell.
151–167.
Eckert, P.
(2000).
Linguistic variation as social practice.
Malden, MA:
Blackwell.
Eckert, P., &
McConnell-Genet, S.
(1992).
Think practically and look locally: Language and gender as
community based practice.
Annual Review of Anthropology
21:461–490.Google Scholar
Godfrey, E., &
Tagliamonte, S.
(1999).
Another piece for the verbal -s story: Evidence from Devon in
southwest England.
Language Variation and Change
11:87–121.Google Scholar
Gordon, E., &
Sudbury, A.
(2002).
The history of southern hemisphere Englishes. In
R. Watts &
P. Trudgill (eds.),
Alternative histories of English.
London:
Routledge.
67–86.
Guy, G. R.
(1980).
Variation in the group and the individual: The case of final stop
deletion. In
W. Labov (ed.),
Locating language in time and space.
New York:
Academic.
1–36.
Horvath, B. M., &
Horvath, R. J.
(2001).
A multilocality study of a sound change in progress: The case of
/l/ vocalization in New Zealand and Australian English.
Language Variation and Change
13:37–57.Google Scholar
Horvath, B. M., &
Horvath, R. J.
(2002).
The geolinguistics of /l/ vocalization in Australia and New
Zealand.
Journal of Sociolinguistics
6:319–346.Google Scholar
Johnston, R. J.
(2000a).
Ecological fallacy. In
R. J. Johnston et al. (eds.),
The dictionary of human geography (
4th ed.).
Oxford:
Blackwell.
190–191.
Johnston, R. J.
(2000b).
Modifiable areal unit problem. In
R. J. Johnston et al. (eds.),
The dictionary of human geography (
4th ed.).
Oxford:
Blackwell.
518–519.
Kretschmar Jr., W. A.
(1996).
Quantitative areal analysis of dialect features.
Language Variation and Change
8:13–39.Google Scholar
Labov, W.,
Boberg, C., &
Ash, S.
(forthcoming).
The atlas of North American English.
The Hague:
Mouton/DeGruyter.
Massey, D.
(1997).
A global sense of place. In
T. Barnes &
D. Gregory (eds.),
Reading human geography.
London:
Arnold.
315–323.
Massey, D.
(2002).
The legitimate language: Giving a history to English. In
R. Watts &
P. Trudgill (eds.),
Alternative histories of English.
London:
Routledge.
7–25.
Milroy, J., &
Milroy, L.
(1985).
Linguistic change, social network, and speaker innovation.
Journal of Linguistics
21:339–384.Google Scholar
Milroy, J.
(1980).
Language and social networks.
Oxford:
Blackwell.
Paolillo, J. C.
(2002).
Analyzing linguistic variation: Statistical models and methods.
Stanford:
CSLI.
Poplack, S., &
Tagliamonte, S.
(1991).
African American English in the diaspora: Evidence from old-line
Nova Scotians.
Language Variation and Change
3:301–339.Google Scholar
Poplack, S., &
Tagliamonte, S.
(2001).
African American English in the diaspora.
Oxford:
Blackwell.
Rand, D., &
Sankoff, D.
(1990).
Goldvarb.
Montreal:
Centre de recherches mathematiques, University of Montreal.
Sproat, R., &
Fujimura, O.
(1993).
Allophonic variation in English /l/ and its implications
for phonetic implementation.
Journal of Phonetics
21:291–311.Google Scholar
Sudbury, A.
(2000).
Dialect contact and koineisation in the Falkland Islands: The
development of a Southern Hemisphere English.
Doctoral dissertation,
University of Essex.
Tagliamonte, S. A.
(2002).
Comparative sociolinguistics. In
J. Chambers,
P. Trudgill, &
N. Schilling-Estes (eds.),
The handbook of language variation and change.
Oxford:
Blackwell.
729–763.
Tagliamonte, S., &
Smith, J.
(2000).
Old was, new ecology: Viewing English through the
sociolinguistic filter. In
S. Poplack (ed.),
The English history of African American English.
Oxford:
Blackwell.
141–171.
Weinreich, U.,
Labov, W., &
Herzog, M.
(1968).
Empirical foundations for a theory of language change. In
W. P. Lehmann &
Y. Malkiel (eds.),
Directions for historical linguistics.
Austin:
University of Texas.
95–188.
Wells, J. C.
(1982).
Accents of English.
Cambridge:
Cambridge University Press.
Two examples of geolinguistic scale
The scale dependency of rate of /l/ vocalization
A classification of order and contrast
Order and contrast for clustered, coda and syllabic /l/ at the supranational scale
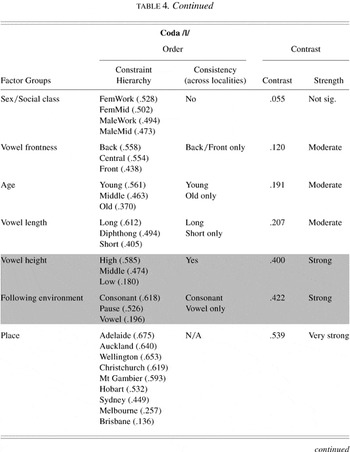
Table 4 continued
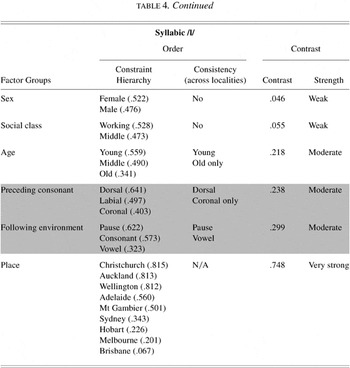
Table 4 continued
Scale independent constraint hierarchy: A hypothetical example of order and contrast.
Following environment for coda /l/.
Preceding environment for coda /l/.
Preceding environment for syllabic /l/.
Following environment for syllabic /l/.
Following environment for clustered /l/.
The individual scale
Summary of scale effects on the linguistic constraints on /l/ vocalization
 You have
Access
- 11
- Cited by