Introduction
Kaolinite is considered to be the most abundant clay mineral in the world (Murray, Reference Murray2000; Schroeder & Erickson, Reference Schroeder and Erickson2014). Unfortunately, this 1:1 dioctahedral clay mineral displays poor reactivity due to its structure (high cohesive energy that holds adjacent layers together) (Cruz et al., Reference Cruz, Jacobs and Fripiat1972; Dedzo & Detellier, Reference Dedzo and Detellier2016; Giese, Reference Giese1978). Consequently, it is difficult to modify this mineral by intercalation of guest compounds in the interlayer space, as is the case for 2:1 swelling clay minerals such as smectites (Deng et al., Reference Deng, Dixon and White2003; Gallo et al., Reference Gallo, Rizzo and Guerra2019; Ogawa et al., Reference Ogawa, Kanaoka and Kuroda1998). The intercalation of some compounds has been reported (Duer et al., Reference Duer, Rocha and Klinowski1992; Elbokl & Detellier, Reference Elbokl and Detellier2008; Ledoux & White, Reference Ledoux and White1966; Letaief & Detellier, Reference Letaief and Detellier2008; Olejnik et al., Reference Olejnik, Posner and Quirk1971; Sugahara et al., Reference Sugahara, Kitano, Satokawa, Kuroda and Kato1986), but with limited applications due to poor stability in polar solvents such as water. This limitation was overcome when the grafting of organic compounds (alcohols, ionic liquids, alkoxysilanes, etc.) in the interlayer space of kaolinite was achieved (Dedzo et al., Reference Dedzo, Nguelo, Tonle, Ngameni and Detellier2017; Janek et al., Reference Janek, Emmerich, Heissler and Nüesch2007; Tonlé et al., Reference Tonlé, Diaco, Ngameni and Detellier2007; Tunney & Detellier, Reference Tunney and Detellier1996).
Methoxykaolinite obtained by the grafting of methanol into the interlayer space is certainly the most popular kaolinite hybrid obtained by a grafting reaction. This material is very attractive because of its ease of synthesis using available chemicals. Moreover, compared to other grafted derivatives of kaolinite, methoxykaolinite is synthesized at ambient temperature. The methoxylated interlayer space of methoxykaolinite showed more swelling properties than the pristine clay mineral (Komori et al., Reference Komori, Sugahara and Kuroda1999; Wang et al., Reference Wang, Liu, Cheng, Zhang and Zuo2017). Despite these advantages, the application domain of methoxykaolinite is still restricted to nanocomposite preparation and synthesis of tubular kaolinite (Detellier & Letaief, Reference Detellier and Letaief2013; Kuroda et al., Reference Kuroda, Ito, Itabashi and Kuroda2011; Matusik et al., Reference Matusik, Gaweł, Bielańska, Osuch and Bahranowski2009). Recent investigations have shown that this material can be used for pesticide sequestration and slow release (Tan et al., Reference Tan, Yuan, Annabi-Bergaya, Dong, Liu and He2015a, Reference Tan, Yuan, Annabi-Bergaya, Liu and He2015b). In a recent study, the electrochemical detection of the organic cation methyl viologen at glassy carbon electrodes covered by a thin film of methoxykaolinite was reported (Tchoumene et al., Reference Tchoumene, Dedzo and Ngameni2018). This was the first application of methoxykaolinite as an electrode modifier, for the electrochemical detection of a target analyte. The interesting results obtained during that study suggest that this material has great potential as an electrode modifier, especially to target cationic compounds. As an electrode modifier, kaolinite and clay minerals more generally present several advantages including good chemical stability over a wide pH range and their availability. Clay minerals can also be functionalized to improve selectivity toward target analytes (Fitch, Reference Fitch1990; Mousty, Reference Mousty2004).
Among heavy metals, lead is one of the most frequently used (batteries, paints, pigments, etc.) and is known for its significant environmental toxicity, even at trace levels, and its common presence in drinking water at concentrations exceeding authorized limits (Ellis & Mirza, Reference Ellis and Mirza2010; Levallois et al., Reference Levallois, Barn, Valcke, Gauvin and Kosatsky2018; O'Connor et al., Reference O'Connor, Hou, Ye, Zhang, Ok, Song, Coulon, Peng and Tian2018). This explains numerous studies related to the detection of this metal at trace levels in water (Maciel et al., Reference Maciel, Bindewald, Bergamini and Marcolino-Junior2022; Wang et al., Reference Wang, Ji, Huang, Guo and Wang2019; Xiong et al., Reference Xiong, Wang, Cai, Li, Gu and Wu2013; Zazoua et al., Reference Zazoua, Khedimallah and Jaffrezic-Renault2018). Some recent studies have reported the application of pristine or functionalized kaolinite as an electrode modifier for Pb(II) detection in aqueous solution (Akanji et al., Reference Akanji, Arotiba and Nkosi2019; El Mhammedi et al., Reference El Mhammedi, Achak, Bakasse and Chtaini2009; Gómez et al., Reference Gómez, Fernández, Borrás, Mostany and Scharifker2011; Tonlé et al., Reference Tonlé, Letaief, Ngameni, Walcarius and Detellier2011). These sensors showed interesting performances, indicating a good affinity between this clay mineral and Pb(II).
In the current study, the application of methoxykaolinite as an electrode modifier for the purpose of cation electroanalysis was evaluated rigorously. The tendency of methoxykaolinite to accumulate cationic compounds in the interlayer space or onto external surfaces was exploited for this purpose. Another key objective of the present study was the application of the modified electrode in the electrochemical detection of Pb(II) in aqueous media (synthetic aqueous solution, surface water, and human urine).
Experimental
Chemicals
DMSO (99.7%) was obtained from Fisher (Pittsburgh, Pennsylvania, USA), lead nitrate (99.5%) from Riedel-De Haen (Hannover, Germany), and potassium chloride (99%) from Labsynth (Diadema, Brazil). Methanol (99.9%) and hexaamine ruthenium(III) chloride (99.5%) were purchased from Sigma-Aldrich (St. Louis, Missouri, USA). All other reagents (hydrochloric acid, sodium hydroxide, sodium chloride, calcium chloride, zinc chloride, manganese chloride, and magnesium nitrate) were of analytical grade. All solutions and suspensions were prepared using deionized water (18 MΩ cm).
Modification of Kaolinite
Well-crystallized reference kaolinite (KGa-1b, Georgia, USA) was obtained from the Source Clays Repository of The Clay Minerals Society. The intercalation of DMSO in the interlayer space of kaolinite fine particles (<2 μm) to obtain Kao-DMSO followed a procedure described in the literature (Tonle et al., Reference Tonle, Letaief, Ngameni and Detellier2009). The grafting of methanol to obtain methoxykaolinite (Kao-Me) was adapted from the procedures already described in the literature (Komori et al., Reference Komori, Enoto, Takenawa, Hayashi, Sugahara and Kuroda2000). In practice, 1 g of Kao-DMSO was dispersed in 20 mL of methanol and stirred vigorously for 24 h at room temperature. The solid was recovered by centrifugation and re-dispersed in 20 mL of methanol for 24 h. This process was repeated for 10 days to ensure a complete replacement of DMSO molecules by methanol in the interlayer space of kaolinite. The solid was finally dried overnight in an oven at 80°C and stored in a tightly closed vial.
Physicochemical Characterization
Powder XRD analyses were performed using a Rigaku Ultima IV diffractometer (Tokyo, Japan) operating with CuKα radiation (λ = 1.54056 Å) using a generator with a voltage of 45 kV and a current of 40 mA.
Solid state 13C NMR CP/MAS spectra of modified kaolinite samples were recorded using a Bruker AVANCE 200 spectrometer (Karlsruhe, Germany), at a spinning rate of 4.5 kHz.
Fourier-transform infrared spectra were recorded using an Alpha spectrometer from Bruker (Karlsruhe, Germany) with a resolution of 4 cm–1. Attenuated total reflectance mode on a diamond crystal was used for the analysis.
Preparation of Modified Electrodes and Electrochemical Analysis
10 μL of aqueous suspensions prepared by dispersion of 4 mg of raw or methoxykaolinite in 2 mL of deionized water were deposited by drop coating onto the surface of freshly polished, glassy carbon or gold electrodes. The film was dried at room temperature for ~1 h and used without any pre-treatment.
Electrochemical experiments were performed in a standard three-electrodes electrochemical cell, with Ag/AgCl as a reference electrode and a platinum wire as auxiliary electrode. Depending on the experiment to be performed, the working electrode was a bare or modified glassy carbon electrode (diameter = 3 mm) or gold electrode (diameter = 2 mm). The three electrodes were connected to a μ-Autolab potentiostat from Metrohm (Utrecht, Netherlands) controlled by the GPES (General Purpose Electrochemical System) software.
Multisweep cyclic voltammetry was used for electrochemical characterization of materials (at glassy carbon electrodes) and anodic stripping differential pulse voltammetry for Pb(II) detection at gold electrodes. Pb(II) signals were recorded with a modulation time of 0.05 s, an interval time of 0.1 s, a step potential of 3 mV, and a modulation amplitude of 50 mV.
Results and Discussion
Physicochemical Characterization
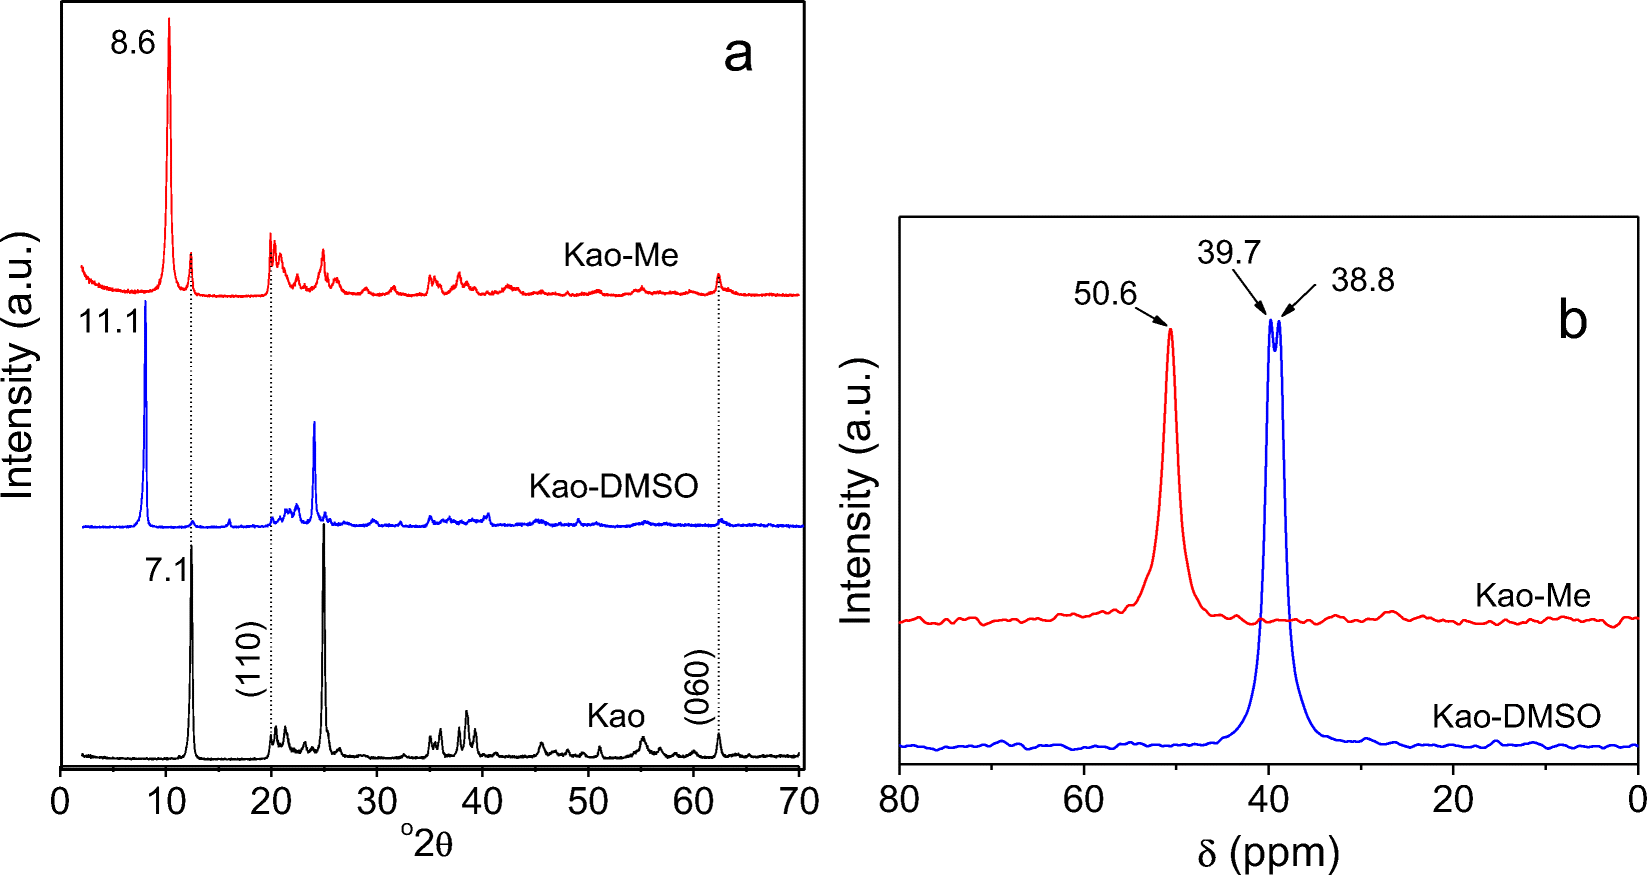
The XRD patterns of kaolinite at various steps of its modification (Fig. 1a) revealed that pristine kaolinite presents well defined and characteristic peaks, with the most intense attributed to the 001 (d 001 = 7.1 Å) and 002 (d 002 = 3.5 Å) reflections. The XRD pattern of Kao-DMSO showed a d 001 increase from 7.1 to 11.1 Å due to the intercalation of DMSO molecules in the interlayer space of kaolinite (Dedzo et al., Reference Dedzo, Letaief and Detellier2012; Tchoumene et al., Reference Tchoumene, Dedzo and Ngameni2018; Tunney & Detellier, Reference Tunney and Detellier1996). Kao-Me revealed a d 001 value of 8.6 Å, characteristic of the presence of methoxy groups grafted in the interlayer space, in agreement with previous studies (Komori et al., Reference Komori, Enoto, Takenawa, Hayashi, Sugahara and Kuroda2000; Tunney & Detellier, Reference Tunney and Detellier1996).
a Powder XRD patterns of kaolinite, Kao-DMSO, and Kao-Me and b 13C NMR CP/MAS spectra of Kao-DMSO and Kao-Me

The 13C NMR CP/MAS spectrum of Kao-DMSO (Fig. 1b) showed the characteristic doublet at 39.7 and 38.8 ppm assigned to the two carbon atoms of DMSO (Tchoumene et al., Reference Tchoumene, Dedzo and Ngameni2018; Tunney & Detellier, Reference Tunney and Detellier1996). The spectrum of Kao-Me (Fig. 1b) showed a single peak at 50.6 ppm assigned to the carbon of the methoxy group (CH3-O-Al) (Tchoumene et al., Reference Tchoumene, Dedzo and Ngameni2018). The absence of the DMSO signals was evidence that the DMSO molecules were displaced completely by methanol in the interlayer space of kaolinite.
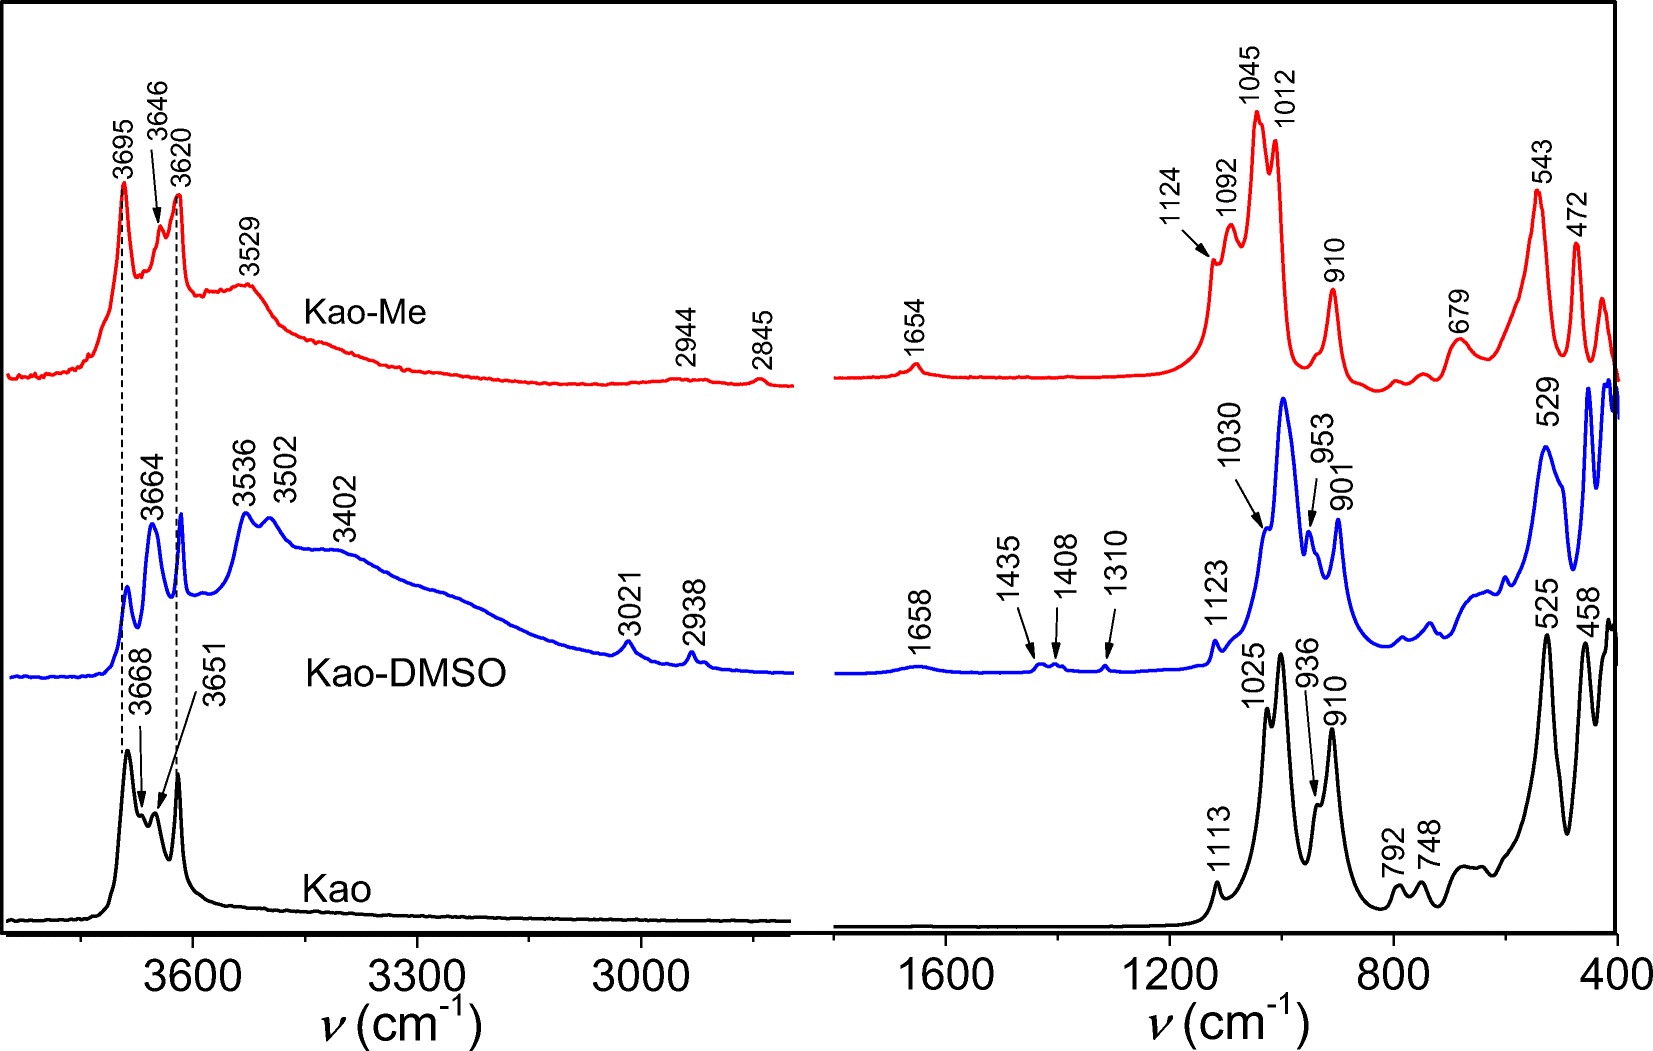
The FTIR spectra of kaolinite at various stages of the modification in the wave number range 4000–2800 cm–1 and 1800–400 cm–1 are shown in Fig. 2.
FTIR spectra of Kao, Kao-DMSO, and Kao-Me

The less intense bands at 3668 and 3651 cm–1, assigned to interlayer O–H hydrogen-bonded to oxygen of the siloxane surface, were affected significantly by the modification. The spectrum of Kao-DMSO showed new bands at 3021, 2938, 1435, 1408, and 1310 cm–1, corresponding to stretching and bending vibrations of the methyl groups (CH3) of DMSO molecules, and a band at 1123 cm–1 assigned to stretching vibrations of S=O (Olejnik et al., Reference Olejnik, Aylmore, Posner and Quirk1968; Xu et al., Reference Xu, Jin, Chen, Shao, Wang, Chen, Lu and Zhang2015). These bands were not present in the spectrum of Kao-Me, confirming once again the complete displacement of DMSO by methanol. On the spectrum of Kao-Me, the stretching vibrations of CH3 of the methoxy group were displayed as two bands at 2944 and 2845 cm–1 (Tchoumene et al., Reference Tchoumene, Dedzo and Ngameni2018; Tchoumene et al., Reference Tchoumene, Dedzo and Ngameni2022). The increased intensity of the band at 1124 cm–1 was due to an overlap of the bands corresponding to the stretching vibrations of Si–O and C–O–Al bonds.
Electrochemical Characterization using Ru(NH3)6 3+
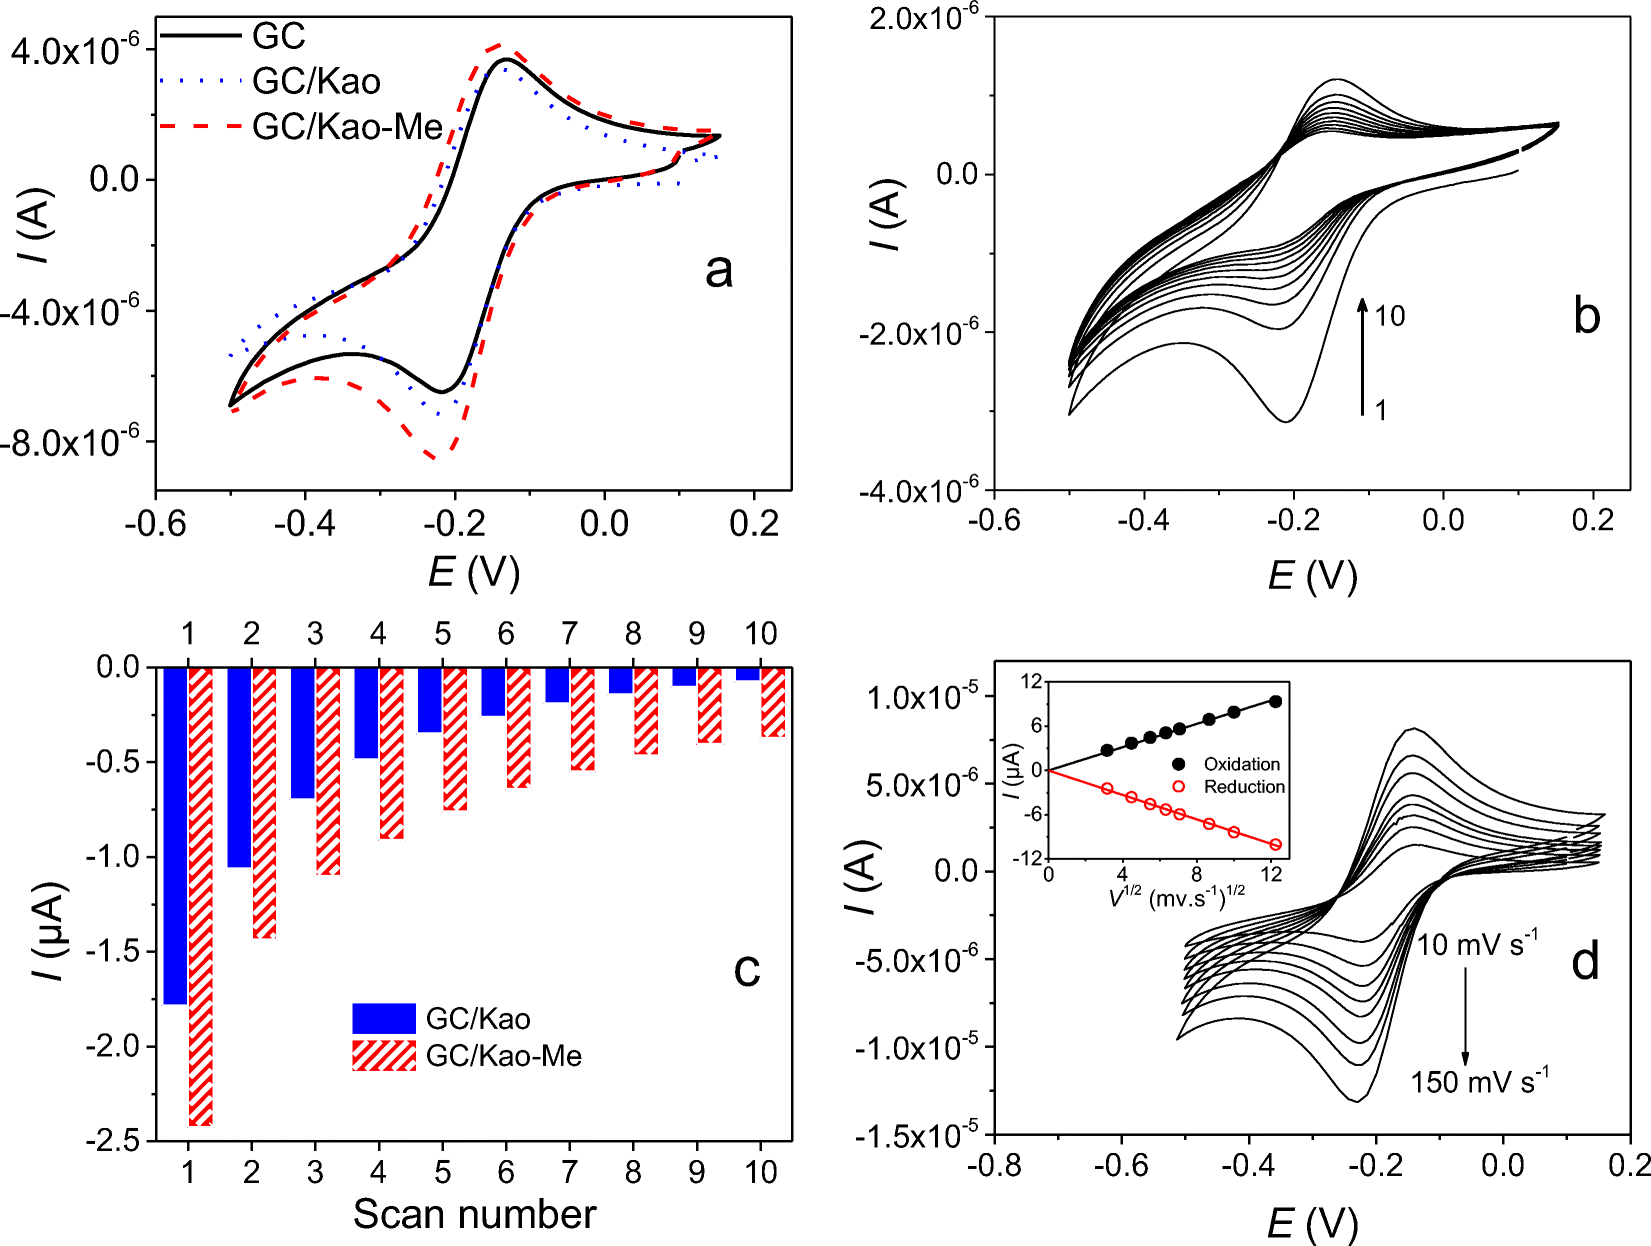
As stated above, methoxykaolinite was used recently as an electrode modifier to quantify the cationic pesticide paraquat in aqueous solution (Tchoumene et al., Reference Tchoumene, Dedzo and Ngameni2018). Electrochemical characterization with Ru(NH3)6 3+, a well known cationic electrochemical probe, was used to evaluate the ability of methoxykaolinite-modified glassy carbon electrode (GC/Kao-Me) to accumulate cations. For comparison purposes, similar experiments were also performed on a pristine kaolinite-modified electrode (GC/Kao) and a bare glassy carbon electrode (GC). The cyclic voltammograms at equilibrium recorded on GC, GC/Kao, and GC/Kao-Me in a solution of 0.1 M KCl containing 0.5 mM [Ru(NH3)6]3+ (Fig. 3a) showed reduction and oxidation peaks attributed to the mono-electronic and reversible transformation of the couple [Ru(NH3)6]3+/[Ru(NH3)6]2+. The value of ΔE P (78 mV), as well as the ratio of peak currents (close to 1), indicated a fast and reversible monoelectronic transformation (Elgrishi et al., Reference Elgrishi, Rountree, McCarthy, Rountree, Eisenhart and Dempsey2018).
a Cyclic voltammograms at equilibrium for various electrodes immersed in 0.1 M KCl containing 5×10⁻⁴ M Ru(NH3)6 3+. b Multicyclic voltammograms recorded at 50 mV s–1 at GC/Kao-Me in 0.1 M KCl after 5 min open-circuit pre-concentration in a 0.1 mM Ru(NH3)6 3+ aqueous solution. c Variation of the reduction current intensities as a function of the scan number extracted in b and in signals recorded at GC/Kao. d Cyclic voltammograms at equilibrium recorded at GC/Kao-Me in a 0.1 M KCl and 0.5 M Ru(NH3)6 3+ solution at various scan rates. Inset: variation of the peak currents vs. the square root of the scan rate

On a kaolinite-modified electrode, the signal intensity increased slightly compared to GC. This slight increase reflected the poor accumulation of the cationic complex by the electrode material, due to the limited cationic exchange capacity of kaolinite (15 meq/100 g) (Ma & Eggleton, Reference Ma and Eggleton1999) and the competition between the cation of the electrolytic solution (K+) and [Ru(NH3)6]3+ for the adsorption sites present on kaolinite. For GC/Kao-Me, the signal was more intense than that recorded on GC/Kao. This indicated the more important affinity of the adsorption sites of Kao-Me for the cationic complex. The increase in signal intensity, however, remained less important suggesting a quantitative intercalation of the complex in the interlayer space of Kao-Me. This could be due both to the competitive adsorption of water molecules (solvent) and potassium ions in the interlayer space. Such behavior was reported recently during the intercalation of methylviologen in the interlayer space of methoxykaolinite (Tchoumene et al., Reference Tchoumene, Dedzo and Ngameni2018).
In order to investigate the ability of the modified electrodes to accumulate Ru(NH3)6 3+, the signals were recorded while reducing the concentration of interfering species in the medium. This also allowed evaluation of the strength of the interaction between the cationic complex and the clay materials. Ru(NH3)6 3+ accumulation at clay-modified electrodes was thus performed using an accumulation-detection strategy. Open circuit accumulation for 5 min was first applied. During this step, the modified electrode (GC/Kao-Me) was immersed in a 10–4 M aqueous solution of Ru(NH3)6 3+. The electrode was then rinsed in deionized water and ten consecutive cyclic voltammograms recorded in the electrolytic solution (0.1 M KCl) (Fig. 3b). The first scan displayed the characteristic one-electron reversible signal of Ru(NH3)6 3+, followed by a gradual decrease due to the cation exchange with the K+ ions present in the electrolytic solution. Even after 10 cycles, the signal for Ru(NH3)6 3+ was still present and well defined. The variation of Ru(NH3)6 3+ reduction current intensity on GC/Kao-Me and GC/Kao as a function of the scan number is plotted in Fig. 3c. On GC/Kao, the intensity of the signal decreased with the number of scans until a flat signal was obtained after only seven cycles (Fig. 3c). In the case of GC/Kao-Me, the first signal was more intense and the decrease in peak intensities was slower than for GC/Kao.
These experiments confirmed that Kao and Kao-Me films accumulate Ru(NH3)6 3+ through a cation-exchange mechanism. Kao-Me exhibits a greater accumulation capacity, however. The rapid decrease of the Ru(NH3)6 3+ signal on GC/Kao indicates that the cation was poorly adsorbed on the basal and edge surfaces of the clay mineral. The slower signal decrease in the case of GC/Kao-Me was proof of the greater adsorption of Ru(NH3)6 3+. This may be a result of a partial intercalation of the cation in the interlayer space of Kao-Me. Similar behavior was reported recently during the adsorption of methylviologen onto methoxykaolinite (Tchoumene et al., Reference Tchoumene, Dedzo and Ngameni2018). This organic cation was found to be only partially intercalated in methoxykaolinite because of the competition with water molecules which prevented more substantial intercalation.
The mechanism of the Ru(NH3)6 3+ electrochemical reaction at GC/Kao-Me was investigated by studying the effect of the scan rate on the signal. From the signals recorded for scan rates ranging between 10 and 150 mV s–1 (Fig. 3d), the peak current increased with the scan rate as expected, driven by the increasingly important concentration gradient. The plot of the peak currents against the square root of the scan rate yielded straight lines (R2 > 0.99) passing through the origin. According to the Randel-Sevcik equation, this indicates a diffusion-controlled mechanism (Bard et al., Reference Bard, Faulkner and Brisset1983).
Application of GC/Kao-Me for Pb(II) Detection
Anodic stripping differential pulse voltammetry (ASDPV) was used for the detection of Pb(II). In order to avoid interference of the cations of the electrolytic solution, an accumulation step at open-circuit was carried out in a solution containing only Pb(II) before the detection step in the electrolytic solution. A gold electrode was used for Pb(II) detection because of the more defined and intense lead electrochemical signal at this electrode.
Comparison of Signals of Pb(II) on the Modified Electrodes
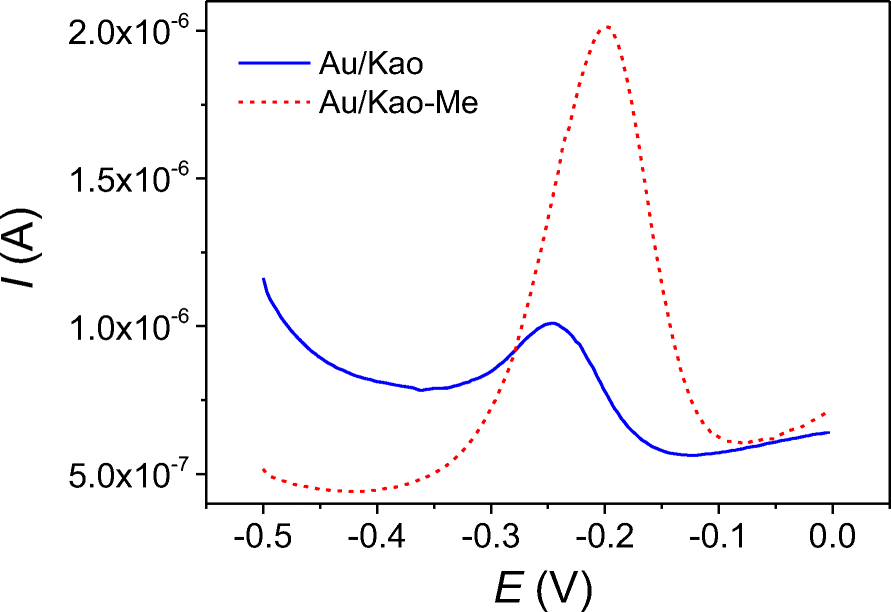
The performances of the gold electrodes modified by kaolinite and Kao-Me were compared to elucidate the contribution of each material to Pb(II) detection. The superposition of the voltammograms recorded by ASDPV on Au/Kao and Au/Kao-Me after 3 min of accumulation in a 0.5 μM Pb(NO3)2 solution and detection in electrolytic solution (containing 0.1 M KCl and 0.01 M HCl) is shown in Fig. 4.
Voltammograms obtained after 3 min of accumulation in 0.5 μM Pb(NO3)2, followed by detection at a Au-modified electrode using ASDPV in 0.1 M KCl containing 0.01 M HCl

Both electrodes showed well defined signals assigned to Pb(0) oxidation. The presence of a peak on Au/Kao is evidence that kaolinite accumulates Pb(II). This result is in agreement with numerous works in the literature which report the use of kaolinite as an adsorbent for the removal of Pb(II) in waste water (Gupta & Bhattacharyya, Reference Gupta and Bhattacharyya2012).
On Au/Kao-Me, the intensity of the signal (1.48 μA) was four times greater than that recorded on Au/Kao, evidence that, compared to kaolinite, methoxykaolinite exhibits a greater ability to accumulate Pb(II). This trend cannot be explained by the cation exchange mechanism alone, as methanol grafting was not expected, theoretically, to modify the surface charge of kaolinite. Previous work on methoxykaolinite has shown that this material was able to accumulate ionic compounds within its interlayer space in the form of ion pairs (Tchoumene et al., Reference Tchoumene, Dedzo and Ngameni2018). On the other hand, clay particle delamination during Kao-Me synthesis (Tchoumene et al., Reference Tchoumene, Dedzo and Ngameni2018) increased the surface area available for Pb(II) accumulation. The different values of peak potential of the signals (–246 mV for Au/Kao and –200 mV for Au/Kao-Me) also indicated the participation of different Pb(II) adsorption sites in kaolinite and methoxykaolinite. For further experiments, only Au/Kao-Me was used for Pb(II) detection because of its more interesting performance.
Optimization of Key Parameters for Pb(II) Detection
Four key parameters (accumulation time, pH of the accumulation solution, Pb(II) electrolysis time, and Pb(II) electrolysis potential) were optimized in order to determine the best experimental conditions.
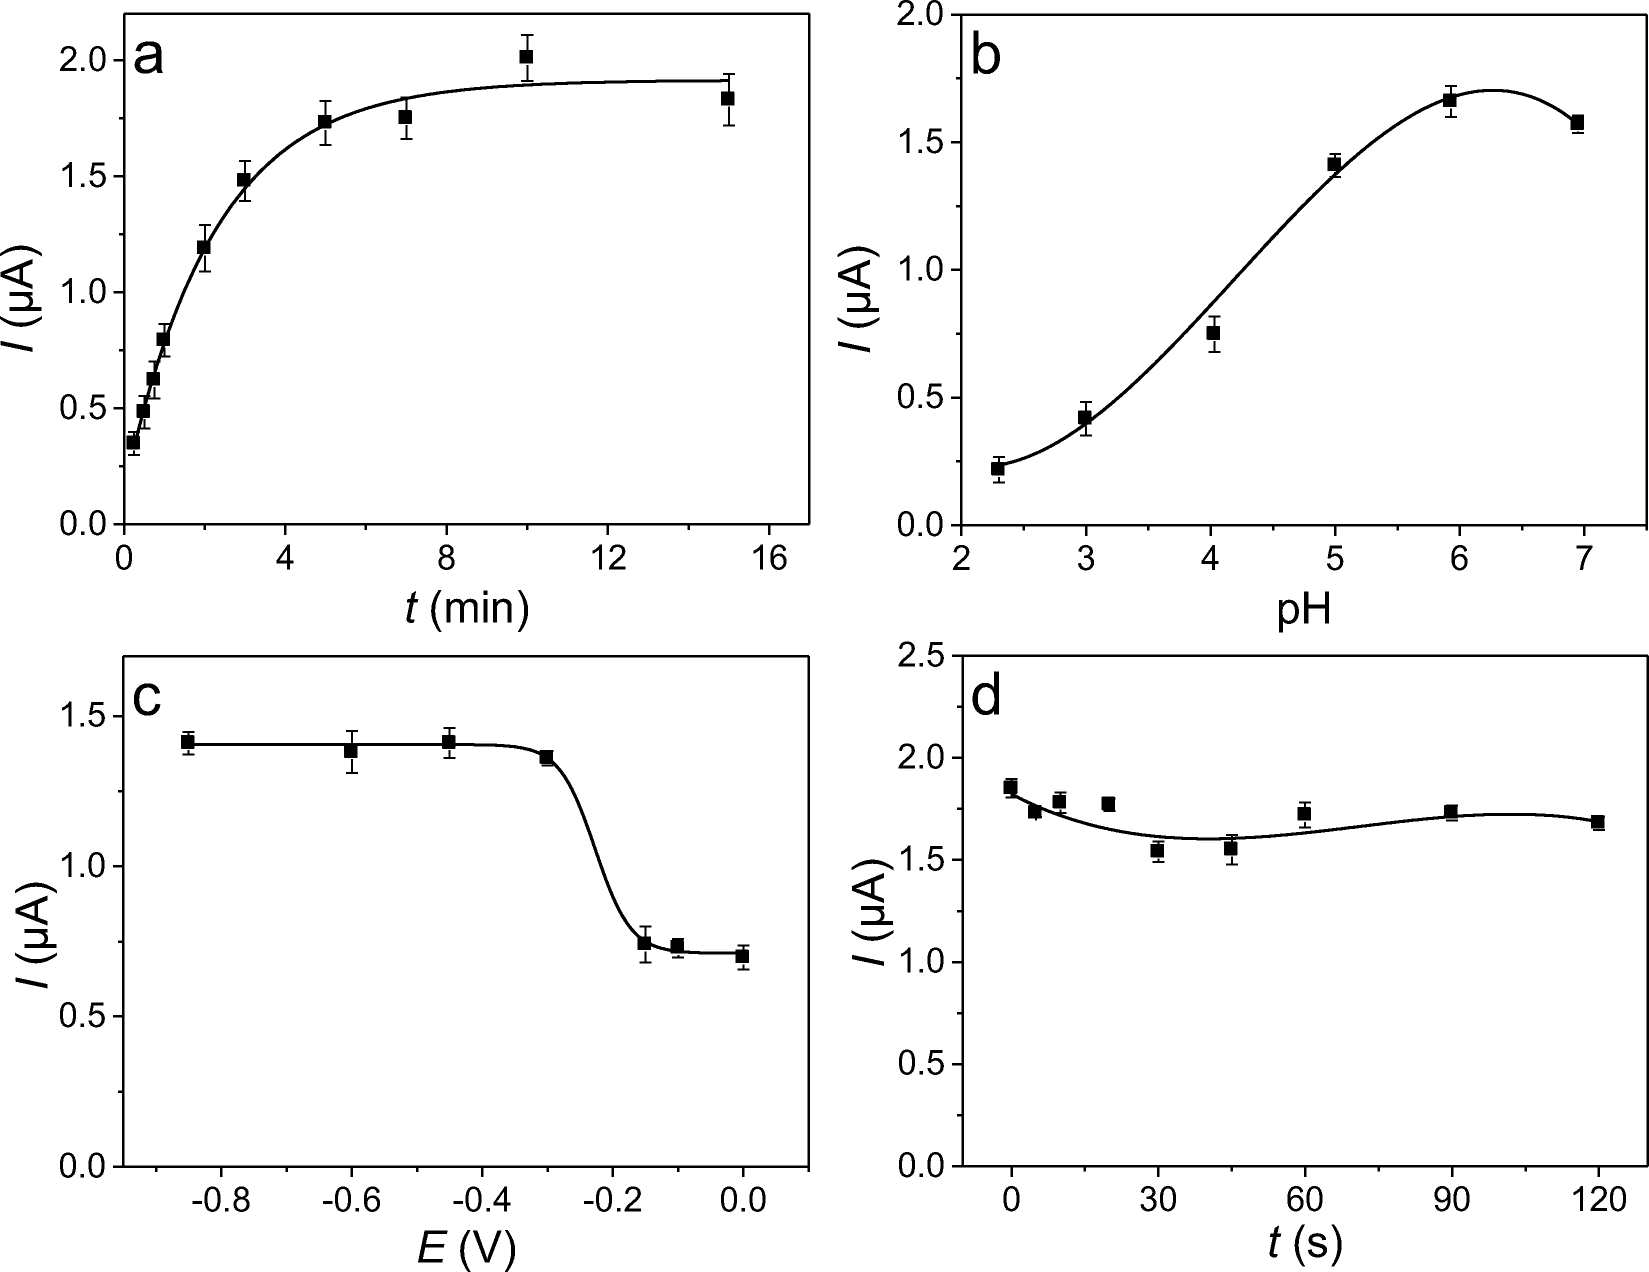
The effect of the accumulation time (ranging between 0.5 min and 15 min) was determined using a 0.5 μM Pb(II) solution. The current peaks plotted against the accumulation time (Fig. 5a) revealed a rapid increase in the current during the first 3 min of accumulation, indicating a very dynamic process in this time interval because of the active adsorption of Pb(II). This was followed by a plateau assigned to the saturation of adsorption sites of Kao-Me. For subsequent experiments, the optimal accumulation time was thus set at 3 min.
Variations of the peak current with a the accumulation time, b the pH of the accumulation solution, c the electrolysis potential, and d the electrolysis time. The error bars represent the standard deviation of three measurements

The speciation of a metal ion in aqueous solution determines its charge and, thereby, can affect its immobilization onto an adsorbent. The pH of the accumulation solution investigated was varied in the range 2.30 to 6.95. Higher pH values would allow the formation of neutral and even negative Pb(II) species (Jiokeng et al., Reference Jiokeng, Dongmo, Ymélé, Ngameni and Tonlé2017). Variations in the current peaks as a function of the pH of the accumulation solution are shown in Fig. 5.
The general trend was an increase in the current intensities with increasing pH of the accumulation solution. The poor signal recorded at pH 2.3 indicated the poor efficiency of Kao-Me at this pH to accumulate the Pb(II) cations because of competition with abundant protons at this pH. Moreover, at this pH, the methoxykaolinite particles became positively charged as a consequence of acid–base exchanges involving the sites present on the edges of the clay particles (Wang & Siu, Reference Wang and Siu2006). This resulted in an electrostatic repulsion between the clay particles and the cationic analyte present in solution. For higher pH values, a rapid increase in the peak current was observed, resulting from the gradual decrease of concentration of protons in solution. After pH 5.93, a decrease in peak current was observed, due certainly to the decrease in the amount of cationic Pb(II) in solution, resulting from speciation (Tunney & Detellier, Reference Tunney and Detellier1996). For subsequent experiments, the pH of the accumulation solution was set at 5.93.
The electrolysis potential applied to convert Pb(II) into Pb(0) before the anodic stripping step is of critical importance as it has a direct effect on the signal intensity. The variation of the intensities of the signals recorded as a function of the applied electrolysis potential (in the range 0 to –0.85 V) (Fig. 5c) showed that between 0 and –0.2 V the electrolysis potential had no effect on the current. In this domain, the potential was not negative enough to allow Pb(II) reduction to yield Pb(0) during the electrolysis step. The relatively high currents recorded were assigned to the potential range used when recording the signals (from –0.5 to 0 V). Indeed, some adsorbed Pb(II) was reduced during the potential scan. For higher electrolysis potentials applied, the signal intensities increased with the formation of a plateau starting at –0.4 V. For subsequent experiments, the electrolysis potential chosen was –0.6 V.
The duration of the electrolysis process preceding the signal recording can also have a significant effect on the amount of Pb(0) deposited at the electrode surface. Therefore, this parameter is likely to affect the sensitivity of the sensor. The variation of the peak currents of the signals recorded for electrolysis times ranging between 5 and 120 s (Fig. 5d) showed a negligible effect of electrolysis time on the peak current. Indeed, the signal intensities remain comparable regardless of the electrolysis time applied. This suggests that adsorbed Pb(II) was easily displaced by the cations of the electrolysis solution during the electrolysis step. This behavior is advantageous for the sensor as the adsorbed analyte is expected to be completely displaced during the signal recording. The sensor can thus be reused several times without loss of performance because of the occlusion of adsorption sites. For subsequent experiments, the electrolysis time was set at 30 s.
Calibration Curve
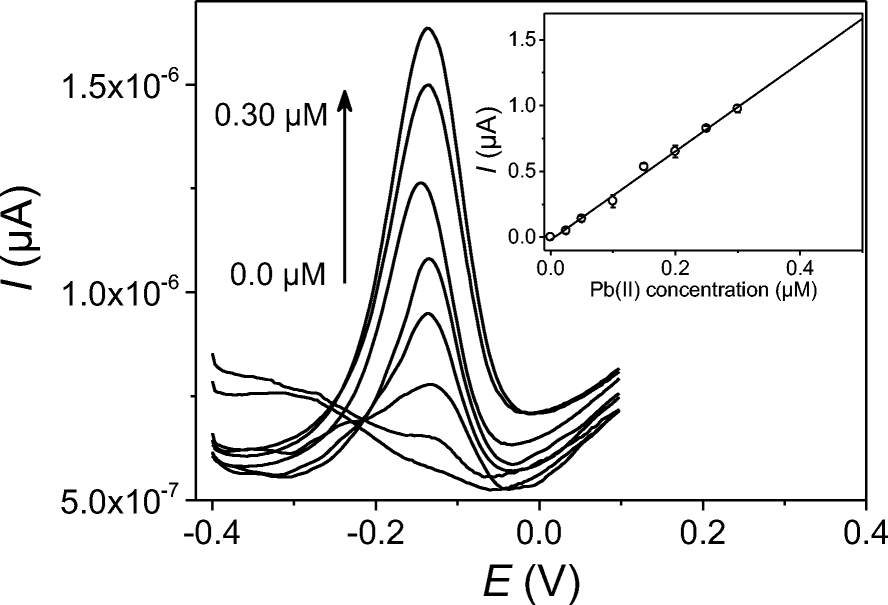
The optimum experimental conditions (accumulation time 3 min, pH of the accumulation solution 5.93, electrolysis potential –0.6 V, and electrolysis time 30 s) were applied and a series of signals was recorded from the Au/Kao-Me while varying Pb(II) concentration in the range 0.025 to 0.3 μM (Fig. 6).
Calibration curve obtained for an accumulation time of 3 min, electrolysis potential of –0.6 V, and electrolysis time of 30 s. The calibration curve presented in the inset was plotted with error bars representing the standard deviation of three measurements

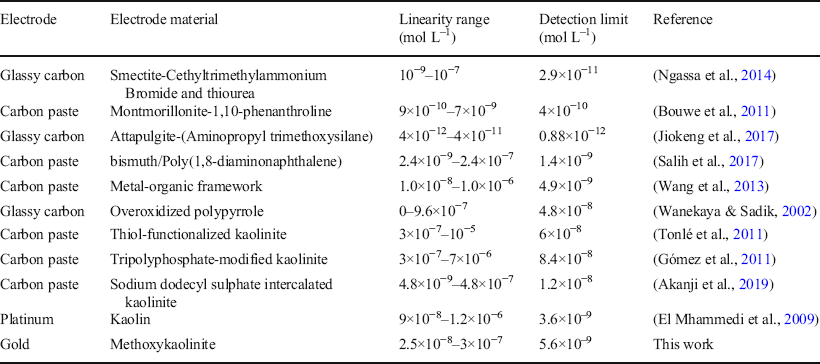
The current increased gradually with the concentration of Pb(II), due to the increasingly large amount of metal ion adsorbed onto Kao-Me. By plotting the peak current as a function of the Pb(II) concentration, a calibration curve (inset in Fig. 6) exhibiting excellent linearity (R2 > 0.99) was obtained. The sensitivity of the sensor (3.36 μA μM–1) was obtained from the equation of the calibration curve and the value of the background noise (6.25 nA) was measured on the blank signals. From these data, a detection limit of 5.6 nM was determined based on a signal-to-noise ratio of 3. Table 1 compares the performance of the electrochemical sensor developed in this work to some results reported in the literature during the electrochemical detection of Pb(II).
Comparison of the performances of various sensors for the detection of Pb(II) in aqueous solution

The performance of this sensor evidently is in the range of most of sensors, including kaolinite-based sensors. This is proof that methoxykaolinite is also suitable as an electrode material for the detection of Pb(II) (see comparison in presented in Table 1). However, some of the electrochemical sensors reported for Pb(II) detection displayed very low detection limits compared to the present sensor. The very low cost of Kao-Me (easy synthesis using available starting materials and reusable chemicals) represents a valuable advantage. In addition, the detection limit obtained was a tenth of the minimum concentration of Pb(II) (4.82×10⁻⁸ M) authorized in drinking water by the World Health Organization (Watt et al., Reference Watt, Britton, Gilmour, Moore, Murray and Robertson2000).
Repeatability of Signal and Effect of Interfering Ions
The repeatability of a sensor is a fundamental characteristic for the validity of its measurements. In order to evaluate this parameter, Au/Kao-Me was used to record eight consecutive signals in a 0.5 μM Pb(II) solution under optimal conditions. The signals obtained showed an average current of 1.25±0.03 μA. This corresponds to a signal variation of 2.4% (determined from the error associated with the eight consecutive measurements). In other words, the repeatability of the signal at this electrode was 97.6%. This confirms the reliability of the electrochemical sensor developed.
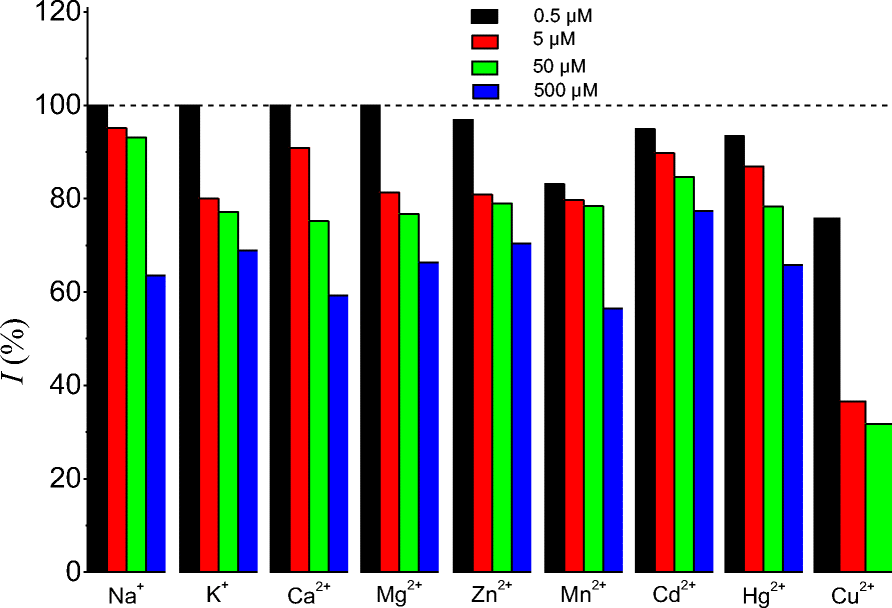
Natural water samples contain ions that can interfere with the detection of the target analyte. In order to apply the sensor for the detection of Pb(II) in such water samples, the effects of some interfering ions (Na+, K+, Ca2+, Mg2+, Zn2+, and Mn2+) that may be present in these samples were studied. Controlled amounts (0.5, 5, 50, or 500 μM) of interfering compounds were added in a 0.5 μM Pb(II) accumulation solution. The signal intensities obtained were compared with the control experiment determined without interfering compound. The current intensity recovered as a function of the concentration of the interfering compound (Fig. 7) revealed that for all the cations studied, the interfering effect was weak for a concentration up to 100 times greater than that of Pb(II). Indeed, the intensity of the signal lost was <25% of its value. However, the interfering effect became significant when the concentration of the interfering ion was 1000 times greater than that of Pb(II) (40% of current was lost).
Effect of some interfering ions on the peak current. Accumulation for 3 min in 0.5 μM Pb(II) in the presence of interfering ions at various concentrations, followed by the detection in 0.1 M KCl and 0.01 M HCl

Interference by some electroactive metal cations (Cu2+, Cd2+, and Hg2+) was also checked (Fig. 7). Strong interference with the signal of Pb(II) was observed due to the presence of Cu(II). 65% of signal loss was obtained when Cu(II) concentrations were 10 times greater than that of Pb(II). This result suggests that Pb(II) and Cu(II) compete for the same adsorption sites. A less important effect was observed for Cd(II) and Hg(II). Indeed, <25% of signal loss was observed for Cd(II) and Hg(II) concentrations 100 times greater than that of Pb(II).
Quantification of Pb(II) in Water Samples
Pb(II) ions were quantified in tap, well, and river water samples using the developed sensor. No pretreatment was applied to these samples before analysis and the standard addition method was used.
Excellent linearity was obtained for all the samples (R2 > 0.99). This confirmed that, in spite the presence of interfering ions, the precision of the sensor was not compromised. A decrease in the sensitivity was noted, however (from 3.36 μA μM–1 in deionized water to 2.06, 1.55, and 1.41 μA μM–1 in tap, river, and well water, respectively). These decreases in sensitivity were due to the presence of interfering ions, consistent with the conductivities of the analyzed water samples (92, 117, and 390 μS cm–1 for tap, river, and well water, respectively). The recovery percentages (Table 2) in the range 90±5 to 110±4% suggest that the sensor may be used for Pb(II) recovery in real water samples.
Determination of Pb(II) in water samples

Quantification of Pb(II) in Human Urine
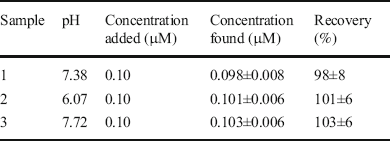
Accurate quantification of several compounds in biological samples is of great interest because of the matrix effect caused by these complex media. The electrochemical sensor developed was subsequently applied for the quantification of Pb(II) ions in human urine samples. For this to be achieved, urine samples were collected early in the morning from three volunteers. The pH of the samples was in the range 6.07 and 7.72. These samples were analyzed without pretreatment or dilution, using the standard addition method. The excellent recovery percentages (Table 3) in the range 98±8 to 103±6% suggest that the electrochemical sensor developed in this work is suitable for the quantification of Pb(II) in human urine samples.
Determination of Pb(II) in human urine

Conclusions
Methoxykaolinite was synthesized and used as an electrode modifier for electroanalysis purposes. Electrochemical characterization showed that methoxykaolinite accumulates cations and can thus be used for the electrochemical detection of cationic compounds of interest. This result was confirmed through the successful use of a methoxykaolinite-modified gold electrode for the detection of Pb(II) in aqueous solution. The sensor showed a detection limit of 5.6 nM, a tenth of the minimum concentration of Pb(II) authorized in drinking water by the WHO. The sensor was also applied successfully in the determination of Pb(II) in tap, river, and well water samples with only minor loss of sensitivity. Interesting results (recoveries close to 100%) were also obtained when using the developed sensor for Pb(II) ion detection in human urine samples. These results showed the interesting potential of methoxykaolinite as an electrode modifier for the quantification of cations. The easy synthesis of methoxykaolinite using cheap and available chemicals and its biocompatibility represent another advantage related to the application of this sensor
Acknowledgments
The authors acknowledge the International Science Program (ISP) – Sweden through funding provided to the African Network of Electroanalytical Chemists (ANEC).
Authors' Contributions
Bruno Boniface Nguelo: Formal analysis, Investigation, Writing - Original Draft Preparation, Writing – Review & Editing, Nganji Sandjon Urtrich: Formal analysis, Investigation, Yami Kamgue Yvana Rusca: Formal analysis, Investigation, Gustave Kenne Dedzo: Conceptualization, Formal analysis, Investigation, Writing – Original Draft Preparation, Writing – Review & Editing, Emmanuel Ngameni: Writing – Review & Editing
Funding
The work was partially supported by the African Network of Electroanalytical Chemists (ANEC) through the grant offered by the International Science Program (ISP) – Sweden.
Data Availability
All data generated or analysed during this study are included in this published article and its supplementary information file.
Code Availability
Not applicable.
Declarations
Conflicts of Interest/Competing Interests
The authors have no conflicts of interest to declare that are relevant to the content of this article.