I. INTRODUCTION
Cryogenic treatment has been used for several decades to improve the mechanical properties of tool steels. CollinsReference Collins1 describes two categories of cryogenic treatment characterized by the minimum temperature reached during the treatment cycle: cold treatment (also called subzero treatment) which is performed at −60 to −80 °C and deep cryogenic treatment which is carried out in the range of −125 to −196 °C. It has been reported that deep cryogenic treatment results in improved wear resistance and toughness beyond that obtained by cold treatment.Reference Collins1–Reference Mohan Lal, Renganarayanan and Kalanidhi4
Deep cryogenic treatment results in the complete transformation of retained austenite to martensiteReference Collins1, Reference Moore and Collins5 with a corresponding increase in hardness. However, in addition sustained cooling of martensite at well below its formation temperature (Ms) promotes the formation of large numbers of fine carbide particles on tempering with a resulting improvement in wear resistance and toughness.Reference Collins1
Rhyim et al.Reference Rhyim, Han, Na and Lee6 observed the majority of the carbides in deep cryogenically treated and tempered (>520 °C) AISI D2 cold work tool steel to be M7C3 and M23C6 with a small concentration of M6C η-carbide also present. The symbol “M” stands for a mixture of transition metals; Cr, Fe, Mn, Nb, Mo, V etc. and is used throughout this paper to signify a mixture of metals within the structure of carbides. Huang et al.,Reference Huang, Zhu, Liao, Beyerlein, Bourke and Mitchell7 Pellizzari et al.,Reference Pellizzari, Molinari, Gialanella and Straffelini8 Firouzdor et al.,Reference Firouzdor, Nejati and Khomamizadeh9 Akhbarizadeh et al.,Reference Akhbarizadeh, Shafyei and Golozar10 Bensely et al.,Reference Bensely, Prabhakaran, Mohan Lal and Nagarajan11 Das et al.Reference Das, Dutta and Ray12 and Stratton and GrafReference Stratton and Graf13 investigated the effect of deep cryogenic treatment on wear resistance and tool life of AISI M2 tool steel, AISI H13 hot work tool steel, M2 HSS drill, AISI D6 tool steel, case carburized steel En353, AISI D2 tool steel and carburizing steel 20MnCr5 respectively. They all observed that a finer and more homogeneous carbide precipitate was found after tempering of the deep cryogenically treated steels and concluded that this is responsible for the observed improvement in wear resistance.
AISI H13 is a chromium hot work tool steel which is designed to withstand the temperature, pressure, abrasion, and thermal cycling associated with various hot working operations, including plastic injection moulding, die casting, forging, and extrusion.Reference Krauss14 AISI H13 has a small carbon content (0.4 wt.%) to promote toughness, medium chromium content (5 wt.%) to provide good resistance to high temperature softening, 1 wt.% Si to improve high temperature oxidation resistance, and molybdenum and vanadium additions (about 1 wt.%), that form stable carbides, to increase resistance to erosive wear.Reference Krauss14–Reference Llewellyn16
Using synchrotron microdiffraction analysis we have found, that on tempering, the martensite phase became crystallographically more homogeneous, as evaluated by variation on the micrometer spatial scale of the unit cell parameter and diffraction peaks full width half maximum height values, compared with the same samples prior to tempering.Reference Xu, Cavallaro and Gerson17 For cryogenically treated samples, the effect was most pronounced for the rapidly cooled sample, which was the least homogeneous sample prior to tempering but was the most homogeneous sample after tempering. This suggests that the considerable degree of disorder resulting from rapid cryogenic cooling results in beneficial release of microstresses on tempering thus possibly resulting in the improved wear resistance and durability observed for cryogenically treated tool steels. We also observed that the martensite unit cell of AISI H13 tool steel shrinks on tempering and that this shrinkage is caused by the diffusion of excess carbon out of the martensitic phase. These carbon atoms then form the carbides, which are deemed by many researchers to be critical to the wear resistance of tool steels.
It has been reported that during tempering of H13 steel, subsequent to conventional quenching, the main carbide phases precipitated are MC [vanadium (V)-rich carbide], M6C or M2C [molybdenum (Mo)-rich carbide] and M23C6 or M7C3 [chromium (Cr)-rich carbide].Reference Krauss14, Reference Hu, Zhang, Wu and Li18 However, to our knowledge, the characteristics of the fine carbides, formed on tempering, subsequent to different cryogenic treatments of AISI H13 steel have not been clearly specified.Reference Pellizzari, Molinari, Gialanella and Straffelini8 This study describes the use of different microanalytical techniques [scanning electron microscopy (SEM), energy-dispersive x-ray spectroscopy (EDX), and synchrotron microdiffraction] to determine the influence of different cryogenic treatments on the nature of the carbides present and the impact on their microstructure and homogeneity.
II. EXPERIMENTAL METHODS
A. AISI H13 samples preparation
Four samples were initially heated to the austenitizing temperature of 1000 °C, held for 1 h, and then quenched to 80 °C in water. Immediately after quenching, the samples were treated using different cooling rates, and cryogenic holding times, and then subjected to two tempering cycles at 560 °C and then 580 °C, each for 1 h. For the fast cooling rate, the samples were immersed into liquid N2 and held for 24 h (Fast-24-T). The slow cooling rate specimens were cooled to −196 °C over 3 h, and subsequently held in liquid N2 for 1 h (Slow-1-T) or 24 h (Slow-24-T). The sample Control-T was not cryogenically treated but was subjected to the same tempering cycles as the other three samples. After treatment the surfaces of the samples were ground (a series of 120, 320, 600 and 1000 grit silicon carbide abrasive papers were utilized with water as the lubricant), polished with 8 μm, 3 μm and 1 μm diamond paste and then etched in 5% nital (5 mL of nitric acid added to ethanol to make 100 mL of etchant). The surface layer was removed by this treatment to reduce the surface macro-stress and any oxidation.
B. Laboratory x-ray diffraction (XRD)
A laboratory-based powder Debye-Scherrer XRD facility with a Co anode (λ 1.7902 Ǻ) was used to examine the four samples. The beam size was approximately 1.5 × 1.5 mm. Diffraction data was recorded from 45 ° to 120 ° 2θ, which covers the Q-range [defined in Eq. (1)] of 26.9–63.6 nm−1, with an angle step size of 0.02 ° and speed of 0.2 ° 2θ/min. The attenuation length through steel (i.e., the distance after which only 0.37 of the original x-ray intensity remains, assuming the density is 7.8 g/cm3) is 23.2 μm, so the effective penetration depth into the samples ranges from 4.4 to 10.0 μm as the angle between the incident x-ray beam and sample surface changes from 22.5 ° to 60 ° (corresponding to 45° 2θ and 120° 2θ respectively).
C. Synchrotron microdiffraction
The four samples were examined, at ambient temperature, at end-station 34-ID-E at the Advanced Photon Source (APS), Argonne National Laboratory using a 0.5 μm full width at half maximum (FWHM) monochromatic x-ray beam of 7 keV energy (1.7711 Å) with 7 × 10⁹ photons/s flux and 1 × 10⁻⁴ energy resolution (ΔE/E). At 7 keV the effective penetration depth into the sample (at 45 ° to the incident beam) is approximately 8.4 μm. This relatively low energy was chosen to minimize penetration and hence maximize spatial resolution. Calibration of the instrument was carried out before measurements were commenced using a Si (111) standard sample. The charge-coupled device (CCD) camera was oriented at 90 ° 2θ at sample-to-detector distance of 30 mm. The powder diffraction images were measured using 2084 × 2084 pixels (1 pixel binning, 24 μm pixels). A 51 × 51 μm powder diffraction map was scanned for each sample using a step size of 1 μm.
D. SEM
A Helios Nanolab DualBeam 433 microscope (Adelaide Microscopy, University of Adelaide) was utilized to prepare a foil sample from Fast-24-T, using a finely focused gallium beam. The dimensions of the foil were 5 μm × 8 μm × 80 nm with the largest plane being perpendicular to the surface of the sample. The foil sample was examined using SEM in secondary electron imaging mode at 25 kV using the same facility. EDX analysis of the foil was carried out on a Philips CM 200 TEM with resolution of 0.2 nm and magnification 2,000,000×. Elemental analysis was performed in ‘spot mode’.
III. RESULTS AND DISCUSSION
We present the diffraction data as a function of the scattering vector Q to enable direct comparisons regardless of incident x-ray energy. Q is defined as:

where λ is the wavelength of incident x-ray radiation (nm), d is the lattice spacing between the planes in the atomic lattice, and θ is the angle between the incident x-ray beam and the scattering planes.
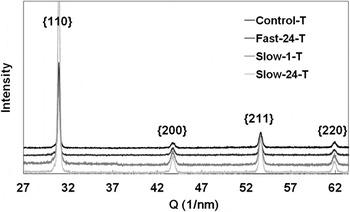
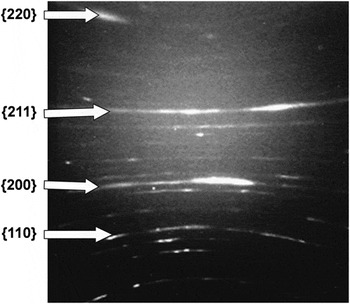
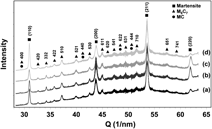
The XRD patterns resulting from laboratory analyses of the four samples (Control-T, Fast-24-T, Slow-1-T and Slow-24-T) did not indicate the presence of carbide phases with only martensite appearing to be present (Fig. 1). However, this was not the case for the synchrotron microdiffraction data. An example of a single typical CCD diffraction image, in this instance from Slow-24-T, is provided (Fig. 2).
Laboratory XRD patterns of the four samples. {110} indicates the composite peak of overlapped martensitic peaks 110 and 011; the other three composite peaks {200}, {211} and {220} composed of 200 and 002, 211 and 112, and 220 and 022 respectively. The diffraction patterns are displaced by arbitrarily in the y-axis for clarity.

An example of a typical microdiffraction diffraction image, from Slow-24-T. Martensitic diffraction rings are indicated.

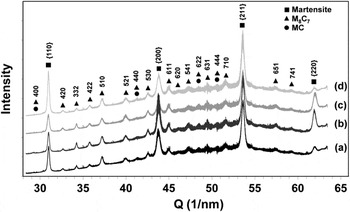
The software “WJL_PowderDiff” developed by Dr. Wenjun Liu at the APS and modified by the author (N. Xu) has been used to analyze the synchrotron microdiffraction data. The synchrotron diffraction images were processed to provide data similar in form to laboratory PXRD data by integrating the diffraction intensity around the hyperbolic rings as a function of Q. The averages of the 2601 powder diffraction patterns measured for each map are shown in Fig. 3.
Averaged integrated synchrotron microdiffraction x-ray powder diffraction patterns from the tempered samples: (a) Control-T, (b) Fast-24-T, (c) Slow-1-T and (d) Slow-24-T. The diffraction indices for martensite and the carbide phase, M8C7, are shown.

The V-rich M8C7 carbide (space group P4332 or P4132) was identified as being present in all samples. It is possible that a small amount of the V-rich carbide MC (space group Fm3m) is also present as the diffraction peaks of MC are overlapped by the diffraction peaks of M8C7.Reference Xu, Cavallaro and Gerson17 M8C7 is a substoichiometric metallic carbide compared with MC. M8C7 and MC carbides both have cubic unit cells with the M8C7 unit cell being approximately double the size of unit cell of the MC structure when the former contains ordered carbon vacancies. The lattice parameter of the vanadium carbide V8C7 has been reported to be 0.8334 nm (PDF 35-0786) and 0.8340 nm (PDF 89-1096). The lattice parameter of the vanadium carbide VC has been reported to be 0.4166 nm (PDF 73-0476) and 0.4300 nm (PDF 02-1063 and PDF 74-1220).Reference Lipatnikov, Gusev, Ettmayer and Lengauer19, Reference Tsakalakos, Ovid’ko and Vasudevan20 However, the intensities of the possible overlapped peaks of MC and M8C7 are relatively weak compared with the other carbide peaks (Fig. 3) indicating that if the MC carbide is present it occurs in small concentration.
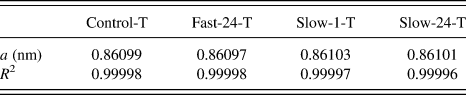
The refined lattice parameter of the M8C7 carbide for all four samples was calculated from the indexed carbide peaks (Fig. 3) by the linear least squares method assuming a cubic unit cell with the unit cell parameter calculated using:

where d is the lattice spacing and hkl are Miller indices. R 2 is used to evaluate the goodness of fit and is defined as:
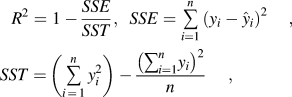
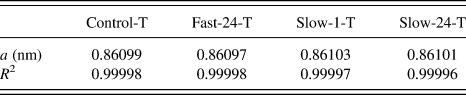
where n is the number of data points included in the fit, yi is the i th observed response value and  is the i th fitted response value. The closer the R 2 value to 1 the better the fit of the least squares calculated lattice parameter to the observed data. The calculated M8C7 unit cell parameter and the corresponding R 2 of the linear least squares fit are provided in Table I. The lattice parameters of M8C7 for the four samples are very similar with the average value being 0.8610 nm with standard deviation of only 2.58 × 10⁻⁵ nm. This value is larger than the literature value for V8C7 and may result from the replacement of vanadium atoms with iron atoms. However, to our knowledge, while some researchers have reported the presence of the V-rich carbide MC in tempered H13,Reference Krauss14, Reference Hu, Zhang, Wu and Li18 no one has reported the presence of the carbide M8C7 in conventionally treated (or cryogenically treated) and tempered AISI H13 tool steel. This may be due to the appearance and the composition of the carbides MC and M8C7 being very similar and the difficulty in differentiating between them using SEM, transmission electron microscopy (TEM) or EDX.
Lattice parameter (a) of the refined cubic unit cell and the corresponding R 2 value of each fit.
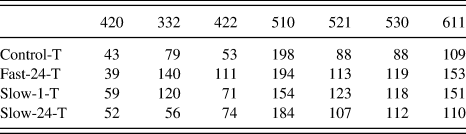
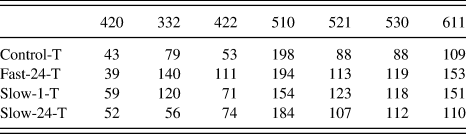
The integrated intensity of the seven strongest M8C7 carbide peaks has been calculated from the averaged integrated synchrotron microdiffraction x-ray powder diffraction patterns for the four samples (Fig. 3) using Gaussian fitting and the results are shown in Table II. The intensities of the 332, 422, 530, and 611 peaks for Fast-24-T are the largest of the four samples. Although Fast-24-T does not display the greatest intensity for the other three peaks, 420, 510, and 521, the difference between the intensities for Fast-24-T and the sample with the most intense peak in each case is not great. The sum of the peaks intensities are in the order of Fast-24-T (869) > Slow-1-T (796) > Slow-24-T (695) > Control-T (658). These analyses, even though approximate, indicate that cryogenic treatment results in a greater concentration of carbides within the tempered material and that the Fast-24-T sample contained the greatest concentration of carbide of the four samples.
Relative intensities of seven M8C7 carbide peaks for the four samples.
Three of the strongest diffraction peaks, (332, 510 and 521), from the carbide M8C7 phase have been analyzed in more detail. A Gaussian functionReference Dinnebier and Billinge21 was used to fit the peaks in the integrated x-ray synchrotron powder diffraction patterns for each of the 2601 steps within each map to enable the calculation of the lattice parameter and FWHM(Q). The resolution of FWHM(Q), as determined by the spatial resolution of the pixels of the CCD camera, is 0.024 nm−1, which is equivalent to 0.046° 2θ, with only very slight change as function of Q. The thin foil sample prepared for SEM analysis, of dimensions 5 μm × 8 μm × 80 nm, covered approximately 25 carbide grains. The illuminated volume of the synchrotron beam at each point of intersection with the sample is 0.5 μm × 0.5 μm × ≈8.4 μm with the estimated number of carbide grains being sampled for each measurement being on average 3. Hence, approximately 1 × 10⁴ carbide grains have been examined over the entire analyzed volume of dimensions of 51 × 51 × 8.4 μm. Therefore, sufficient carbide grains have been examined for each sample to ensure representative statistical analysis.
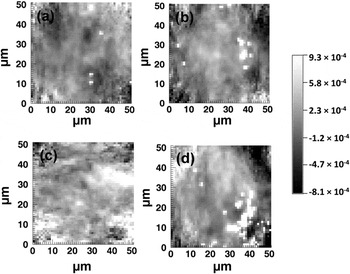
The lattice parameter for the cubic unit cell of the M8C7 carbide was calculated from the lattice spacings of the 332, 510, and 521 M8C7 peaks using Eq. (2). To understand the effect of different cryogenic treatment conditions on unit cell inhomogeneity and strain distributions within the carbide phase,  for each of the 2601 diffraction patterns comprising each map was calculated and statistical analyses were conducted. The average value of the refined lattice parameters across the four samples, 0.8610 nm, was taken as a 0. For example, Fig. 4 shows the maps for
 calculated from the lattice spacing of the 510 diffraction peak, at Q of 37.2 nm−1, for the four tempered samples, over the 51 × 51 μm area. The variation in gray scale indicates the first order of strain along the normal to the 510 plane within the M8C7 carbides. The negative values suggest compressed strain whereas the positive values suggest tensile strain.
 calculated from the 510 diffraction peak of the M8C7 carbide for Control-T (a), Fast-24-T (b), Slow-1-T (c) and Slow-24-T (d) over a 51 × 51 μm area. A common scale for (a) to (d) is provided.

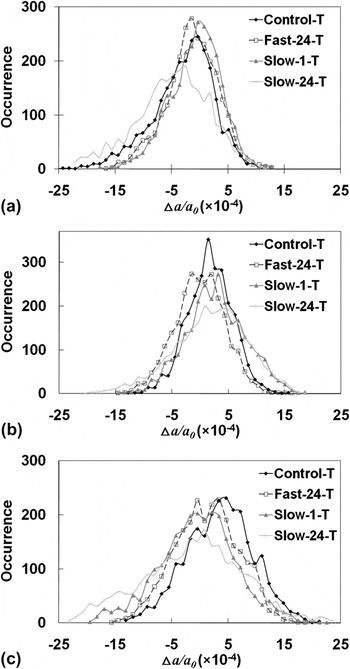
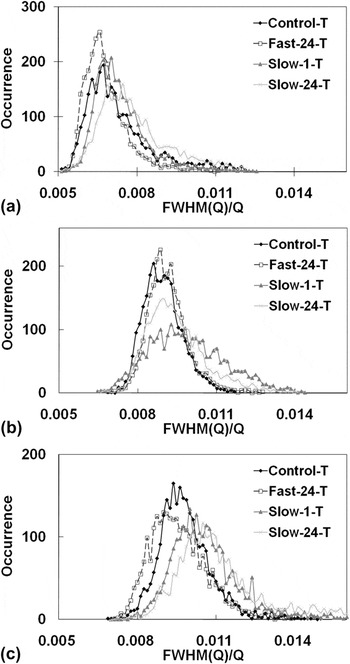
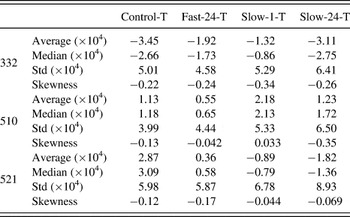
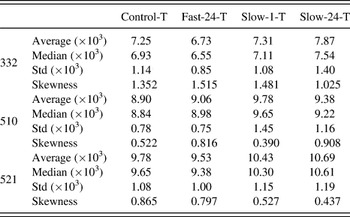
Figure 5 shows the distribution of  calculated from the lattice spacing of the 332, 510, and 521 M8C7 peaks for the four samples. Figure 6 shows the distributions of FWHM(Q)/Q for these same peaks. The standard deviation and skewness of the distributions are provided in Tables III and IV. Skewness indicates the asymmetry of the probability distribution of a real-valued random variable and for a sample of n values it is defined as:

Distributions of the  calculated from the 332, 510 and 521 M8C7 carbide peaks for the four tempered samples.

Distributions of the FWHM(Q)/Q values for the 332, 510 and 521 M8C7 carbide diffraction peaks for the four tempered samples.

Statistical data of  (converted from lattice spacing) for the M8C7 carbide unit cell calculated from the different Miller indices for the four tempered samples examined by synchrotron microdiffraction.

Std—standard deviation.
Statistical data of FWHM(Q)/Q for the four tempered samples examined by synchrotron microdiffraction.

Std—standard deviation.
where xi is the i th value,  is the sample mean, and s is the standard deviation. Negative skewness, that is having a left tail, so called left-skewed, suggests that the mass of distribution is concentrated on the right of the Figure.
 for a given Bragg peak indicates the first order of lattice strain along the normal to the corresponding plane. The negative values of the average and median of
 for the 332 M8C7 diffraction peak and positive values of average and median of
 for the 510 M8C7 diffraction peak for all the four samples suggest predominantly, respectively, compression and tensile strain along the normals of these planes. For the 521 M8C7 diffraction peak mainly tensile strain occurs along the plane normal of sample Control-T and Fast-24-T and compressive strain along the plane normal in samples Slow-1-T and Slow-24-T. The strain along the normal of the 510 and 521 planes in sample Fast-24-T were the smallest with the average of
 being 5.5 × 10⁻⁵ and 3.6 × 10⁻⁵, respectively, as compared to the other three samples Control-T, Slow-1-T and Slow-24-T with the averages of
 being 1.13 × 10⁻⁴, 2.18 × 10⁻⁴, and 1.23 × 10⁻⁴ respectively along the 510 plane normal and 2.87 × 10⁻⁴, 8.9 × 10⁻⁵, and 1.82 × 10⁻⁴ along the 521 plane normal. For the 332 M8C7 diffraction peak, the strain for Fast-24-T was the second smallest of those determined with the absolute value of the average of
 being 1.92 × 10⁻⁴ with Slow-1-T being the smallest with the absolute value of the average of
 being 1.32 × 10⁻⁴. This result indicates the smallest first-order strain in the rapidly cooled cryogenically treated sample as compared with the other two slowly cooled cryogenically treated samples.
The standard deviations of the distributions of  for the 332 and 521 M8C7 carbide diffraction peaks vary as Fast-24-T < Control-T < Slow-1-T < Slow-24-T whereas the standard deviations of the distributions of
 for the 510 M8C7 carbide peak vary as Control-T < Fast-24-T < Slow-1-T < Slow-24-T. This trend is similar to that observed for the standard deviations of the distributions of the unit cell parameters derived from all the martensitic peaksReference Xu, Cavallaro and Gerson17; Control-T < Fast-24-T < Slow-24-T < Slow-1-T. The crystallographic homogeneity of both the carbide and martensite phases is comparable for the tempered control sample and the tempered rapidly cooled cryogenically treated sample. It can be concluded that the crystallographic homogeneity of both the carbide and martensite phases is greatest, after tempering, for the sample that was rapidly cryogenically cooled as compared with the two other cryogenically treated samples. Interestingly, the values of the skewness of
 were all negative except that for sample Slow-1-T for the 510 M8C7 diffraction peak.
The average of the FWHM(Q)/Q of the 332 and 521 M8C7 peaks were the smallest for the Fast-24-T sample with the values being 6.73 × 10⁻³ and 9.53 × 10⁻³ respectively, followed by the Control-T, then Slow-1-T and Slow-24-T. The average of FWHM(Q)/Q of the 510 M8C7 diffraction peak for the Control-T sample was the smallest at 8.90 × 10⁻³, followed by Fast-24-T with a very similar value of 9.06 × 10⁻³, then Slow-24-T and Slow-1-T. The average FWHM(Q)/Q of all the martensitic peaks for Fast-24-T was the smallest of the four tempered samples.Reference Xu, Cavallaro and Gerson17 The average and median of FWHM(Q)/Q increased with increasing Q. For example, the average FWHM(Q)/Q for sample Control-T was 7.25 × 10⁻³ for diffraction peak 332 (Q = 34.2 nm−1), increasing to 8.90 × 10⁻³ at the 510 diffraction peak (Q = 37.2 nm−1) and 9.78 × 10⁻³ at the 521 diffraction peak (Q = 40.0 nm−1). The median FWHM(Q)/Q and the standard deviation of the distribution of FWHM(Q)/Q for the M8C7 carbide diffraction peaks examined followed the same trend as for the average FWHM(Q)/Q.
The standard deviations of the distribution of FWHM(Q)/Q for all the M8C7 peaks for Fast-24-T were the smallest of the four samples. For example, the standard deviation of the distribution of FWHM(Q)/Q for the 332 M8C7 peak for Fast-24-T was the smallest with the value being 8.5 × 10⁻⁴, compared to Control-T, Slow-1-T and Slow-24-T with the values being 1.14 × 10⁻³, 1.08 × 10⁻³, and 1.40 × 10⁻³ respectively. These results are consistent with the trend for the standard deviations of the distributions of the unit cell parameter indicating that the carbide phase in the tempered rapidly cryogenically cooled sample has the greatest crystallographic homogeneity.
A Williamson–Hall analysisReference Ungár22 has been used to extract information with respect to microstrain and crystallite size in the M8C7 carbide phase. This function can be written as:

where FWHM(Q)corr can be calculated using Eq. (6), t is the particle size and η is the microstrain.

θ is the angle between the incident x-ray beam and the scattering planes, λ is the wavelength, FWHM(θ)exp is the measured FWHM of the peak and FWHM(θ)inst is the peak broadening effect contributed from the instrumental optics. A 0.5 μm focused incident beam with 0.5 mrad beam divergence in the 2θ direction was used for our synchrotron microdiffraction measurements. Beam divergence is the main contribution to the instrumental peak broadening and regardless of other geometrical broadening effects, the 0.5 μm beam will diverge to around 15 μm in size at the CCD at 90° 2θ. As the x-ray beam is focused and small in size, geometrical broadening caused by geometrical defocusing has only minor impact with the peak broadening of the diffracted beam size, regardless of other broadening effects, being 0.12–0.39 μm over the Bragg angular range from the smallest angle 54.7° 2θ (420 carbide diffraction peak) to the greatest angle 78.6° 2θ (611 carbide diffraction peak) of the seven carbide peaks examined. Therefore, the effect of geometrical defocusing has been neglected.
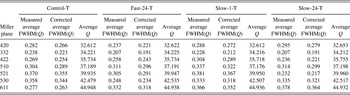
Table V shows the average measured FWHM(Q)exp for each sample and the corrected average FWHM(Q)corr, resulting from the subtraction of beam divergence from average measured FWHM(Q)exp for each carbide peak, and their corresponding scattering angles. The nonmonotonic variation of peak broadening with crystal indices hkl suggests a strong microstrain anisotropy along the normal of the hkl plane in the carbide phases.Reference Rzychoñ and Rodak23 However, on comparing peak broadening variations across the different samples, there is no regularity for the different crystal indices hkl. For instance, FWHM(Q)corr for the 420 carbide peak has the order of Slow-24-T > Slow-1-T > Control-T > Fast-24-T whereas for the 332 carbide diffraction peak the order is Control-T > Slow-1-T > Fast-24-T = Slow-24-T. Strain (η) values of 5 (±4, one standard deviation) × 10−3, 7 (±3) × 10−3, 9 (±3) × 10−3, and 9 (±5) × 10−3 for Control-T, Fast-24-T, Slow-1-T and Slow-24-T, respectively, were calculated using Eq. (5). The large standard deviations result from this irregular variation in peak width as a function of Q and suggest no strain variation, of statistical significance, across the samples. Negative values of crystallite size (t) resulting for Fast-24-T, Slow-1-T, and Slow-24-T could be due to the average crystallite size of the carbides within the illuminated volume being larger than 100 nm in diameter, which does not fulfill the condition of application for Eq. (5) for crystal size determination.Reference Langford and Wilson24 The crystallite size determined for Control was 70 ± 30 nm.
Measured and corrected average FWHM(Q) and average Q of the M8C7 carbide peaks for four samples.

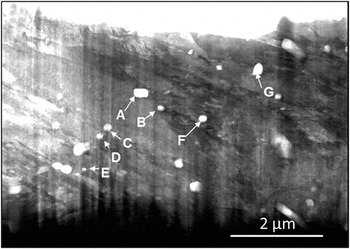
Sample Fast-24-T was chosen for further investigation due to its relatively homogeneous microstructure in both the martensiteReference Xu, Cavallaro and Gerson17 and carbide phases. The bright-field SEM micrograph shown in Fig. 7 of the thin foil shows both the lath martensite and carbides. The vertical stripes over the SEM image are due to the cutting direction of the ion beam. The area of the largest carbide (the rod-like carbide at point A) in the foil sample is about 6 × 10⁻² μm2, which is approximately 12 times larger than the smallest carbide (the spherical carbide at point E) at 4.8 × 10⁻³ μm2. The average area of the visible carbides in Fig. 7 is around 2.5 × 10⁻² μm2.
SEM micrograph of the thin foil for the sample Fast-24-T.

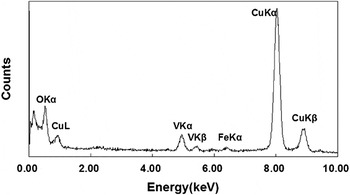
EDX microanalysis was carried out to determine chemical composition of the seven labeled carbides (points A to G) in Fig. 7. An example of the EDX spectrum for point F is given in Fig. 8 and reveals that the composition of the carbide is rich in vanadium, in agreement with the XRD phase assignment. The very high counts for copper were from the copper sample holder. The other six carbides gave rise to similar EDX spectra to the carbide at point F, also with high vanadium content.
Characteristic EDX spectrum of the carbide inclusion at point F.

IV. CONCLUSION
Synchrotron microdiffraction has been demonstrated to be an ideal method for the structural and strain analyses of the small concentrations of carbides precipitated on tempering of AISI H13 tool steel. In contrast, laboratory x-ray powder diffraction was unable to discern the presence of carbide within the tempered samples.
The fine carbide in the tempered AISI H13 steel samples was identified to be cubic vanadium-rich M8C7 with an average lattice parameter of 0.8610 nm across the four samples. From micrometer-scale synchrotron microdiffraction analysis of cryogenically treated and tempered samples, we conclude that the crystallographic homogeneity of both the carbide and martensiteReference Xu, Cavallaro and Gerson17 phases is greatest for the sample that was rapidly cryogenically cooled (Fast-24-T). The first-order strain along the normal of the planes examined for the carbide phase for the rapidly cooled sample is the smallest as compared with the other two slowly cooled samples. These observations together, suggest that this treatment results in the least stressed structure for both carbide phase and martensite phase in AISI H13 as compared with the other two slow cooling cryogenic treatments.
Interestingly, the crystallographic homogeneity of both the carbide and martensite phases is comparable for the tempered control sample (quenched to 80 °C prior to tempering) Control-T and Fast-24-T. However, significant differences arise on examination of the concentration of the carbide phase with all cryogenic treatments resulting in a greater concentration, subsequent to tempering, as compared with the quenched sample. Of the cryogenic treatments examined rapid cooling gave rise to the greatest concentration of carbides.
ACKNOWLEDGMENTS
The authors gratefully acknowledge Dr. Wenjun Liu, XOR/UNI-CAT, APS and Steve Heald, PNC-CAT, APS for their advice. The use of the APS was supported by the U.S. Department of Energy, Office of Science, Office of Basic Energy Sciences, under Contract No. DE-AC02-06CH11357. We acknowledge travel funding provided by the Australian Synchrotron Research Program. The authors appreciate the financial support provided by the University of South Australia in the form of a University President Scholarship (UPS) and the Applied Centre for Structural and Synchrotron Studies in a form of an ACeSSS scholarship. Also the authors express their gratitude to Tijun Lu, Applied Centre for Structure and Synchrotron Studies, University of South Australia for the help with implementation of IDL software. The participation of ARG in this research was supported under the Australian Research Council’s Linkage Project funding scheme (Project No. LP0562210) which was sponsored by Rio Tinto and the Department of Innovation, Industry and Regional Development, State Government of Victoria.