Implications
Dry-Mediterranean herbaceous grasslands are resilient to high animal densities. However, 3-year monitoring of cattle nutrition under such conditions shows that the depletion of vegetation at the onset of the dry season is associated with high contents of dietary ash, most probably from soil, that could result in higher tooth wear. Our results also suggest that faecal ash contents, a reliable estimate of soil ingestion, may be a simple way to monitor the effects of animal density. Cows try to mitigate seasonal changes in forage quality by feeding selectively. Poultry litter (PL), given as feed supplement, greatly contributes to the provision of dietary protein. When supplied ad libitum, it represents a higher proportion of the diet when animal density is high. Consumption of PL in excess, associated with low intake of roughage, could jeopardize cattle health and welfare.
The primary implication is that a high animal density that may be sustainable from the point of view of the vegetation could be detrimental to animal health and welfare.
Introduction
Defining the carrying capacity of dry Mediterranean rangelands is controversial, as objectives differ between ecologists, who are interested in bio-diversity and landscape enhancement, fire-fighting agencies, that try to minimize fire hazard, and cattlemen, who seek maximal return on investment. The weight gain of cattle per hectare is greatest at the high animal densities that result in heavy use of the pasture (e.g. Vavra et al., Reference Vavra, Rice and Bement1973; Henkin et al., Reference Henkin, Ungar, Perevolotsky, Gutman, Yehuda, Dolev, Landau, Sternberg and Seligman2015).
Working in dry Mediterranean rangeland, Henkin et al. (Reference Henkin, Ungar, Perevolotsky, Gutman, Yehuda, Dolev, Landau, Sternberg and Seligman2015) showed that, following an initial period of grazing deferment after emergence each year, continuous grazing at a high animal density of 1.1 cows/ha for 17 consecutive years had no detectable effect on range productivity, compared with continuous grazing at a low animal density of 0.55 cows/ha (Henkin et al., Reference Henkin, Ungar, Perevolotsky, Gutman, Yehuda, Dolev, Landau, Sternberg and Seligman2015). A reduction in tall grass cover at higher animal density was correlated with increased cover of less palatable groups such as annual and perennial thistles, but species diversity and equitability were remarkably stable across all grazing treatments (Sternberg et al., Reference Sternberg, Golodets, Gutman, Perevolotsky, Ungar, Kigel and Henkin2015), supporting the idea that Mediterranean grasslands are very resistant to high animal densities. However, the high animal density reduced the standing biomass in the paddock at the end of the growing season by 43% and grazing duration during the subsequent dry season by 38% (Henkin et al., Reference Henkin, Ungar, Perevolotsky, Gutman, Yehuda, Dolev, Landau, Sternberg and Seligman2015), and resulted in lower body condition score (Aharoni et al., Reference Aharoni, Brosh, Orlov, Shargal and Gutman2004) and intake of metabolizable energy (ME) (Brosh et al., Reference Brosh, Aharoni, Shargal, Sharir, Gutman and Choshniak2004). As protein content is too low to sustain maintenance during the dry season (Henkin et al., Reference Henkin, Ungar, Dvash, Perevolotsky, Yehuda, Sternberg, Voet and Landau2011), cows need to be supplemented with dried or ensiled PL, the cheapest protein-rich feed. High animal density can be associated with increased consumption of PL (Henkin et al., Reference Henkin, Ungar, Perevolotsky, Gutman, Yehuda, Dolev, Landau, Sternberg and Seligman2015), known to be toxic if consumed in excess (Silanikove and Tiomkin, Reference Silanikove and Gutman1992).
In a dry environment, combinations of animal density and rotational management modify the preference of cattle for plant communities (Walker et al.,Reference Walker, Heitschmidt, De Moraes, Kothmann and Dowhower1989a), hence affecting the botanical composition and nutrient contents of selected diets (Walker et al., Reference Walker, Heitschmidt and Dowhower1989b). Therefore, it can be reasonably hypothesized that animal density will affect cattle nutrition in the nutrient-limited conditions prevailing in dry Mediterranean rangelands. We have recently adapted faecal near-IR spectroscopy, a methodology that predicts nutritional attributes from the chemical characteristics of faeces in the near IR region, to predicting the nutrition of beef cattle on dry Mediterranean and semi-arid grasslands (Landau et al., Reference Landau, Dvash, Roudman, Muklada, Barkai, Yehuda and Ungar2016).
Having established that East-Mediterranean plant communities were resilient to high animal densities, the aims of the present study were: (i) to check the hypothesis that such high animal densities may be deleterious to cattle nutrition and welfare and (ii) to demonstrate the usefulness of faecal NIRS in identifying nutritional and welfare issues in grazing beef cattle.
Material and methods
Study site
The experiment was carried out at the Karei Deshe experiment farm located above the Upper Jordan Valley in the north-east of the Galilee region of Israel (32°55'N, 35°35'E; altitude 60 to 250 m a.s.l.). The farm is populated by a commercial, mixed-breeds beef cattle herd of ~650 adult cows. Grazing experiments are conducted with animals drawn from this herd in dedicated plots. The topography is hilly, with slopes generally <20° covered with basaltic rock with an average cover of 30%. The soil is a fertile, brown, basaltic protogrumosol of variable depth that seldom exceeds 60 cm. The area has a Mediterranean climate, characterized by mild, wet winters with mean minimum and maximum temperatures of 7°C and 14°C, respectively, and hot, dry summers with mean minimum and maximum temperatures of 19°C and 32°C, respectively. The potential rainy season extends from October to April and the average annual rainfall between 1963 and 2010 was 557 mm.
The vegetation is a hemicryptophytic grassland dominated by Hordeum bulbosum L., Avena sterilis L., Alopecurus utriculatus Sol., Echinops viscosus DC and Bituminaria bituminosa L. which, together with a diverse mix of annual herbaceous species, account for a large proportion of plant production (Sternberg et al., Reference Sternberg, Golodets, Gutman, Perevolotsky, Ungar, Kigel and Henkin2015). In terms of plant functional groups, the vegetation includes tall perennial grasses, tall annual grasses, short grasses (mostly annuals), annual forbs (including crucifers, annual legumes and thistles and other annual species) and perennial forbs (including geophytes, perennial legumes and thistles and other perennial species) (Sternberg et al., Reference Sternberg, Golodets, Gutman, Perevolotsky, Ungar, Kigel and Henkin2015). Primary production is positively related to total rainfall (Golodets et al., Reference Golodets, Sternberg, Kigel, Boeken, Henkin, Seligman and Ungar2013). In the 3 years of the study a relatively wet year was followed by 2 relatively dry years (2012/2013: 648 mm; 2013/2014: 374 mm; 2014/2015: 476 mm; Supplementary Figure S1).
Experimental plots, grazing management and animal management
Welfare regulations of the Israel Council on Animal Care Guidelines (1994) were followed throughout. The experiment was conducted in four plots ranging from 21.3 to 31.3 ha in size (Supplementary Table S1). Grazing deferment was practiced whereby plots were not grazed from the time of plant emergence until standing biomass had exceeded 600 kg dry matter (DM)/ha ~70 days later, between mid-January and mid-February. Animal density treatments were 0.56 (L) and 1.11 (H) cows ha (corresponding to 1.8 and 0.9 ha/head). Treatments were replicated twice at the plot level. Most cows were pregnant when turned to pasture in the spring, but some cows were not pregnant or had already calved. Calves were weaned at the end of the green pasture season, between late April and early May. Poultry litter supplementation commenced on 20, 22, and 11 June in 2013, 2014 and 2015, respectively, and continued until the cows were removed from the plots. Total PL consumption at the plot level was determined by weighing the amounts of PL loaded into the feeding troughs in June and the amounts remaining in them at the end of the grazing season. The composition of PL was, on DM basis: ash, 156±7.8 g/kg; NDF, 388±13 g/kg; ADF, 207±9.6 g/kg; ADL, 88±2.0 g/kg; CP, 304±11 g/kg. Cows were weighed thrice yearly: when first introduced to the plots in the spring, at weaning and when removed from the plots in the autumn (Supplementary Table S1). Calves were weighed at weaning, but not at birth: their average daily gain to weaning was calculated assuming 35 kg as birth weight. In each plot, cows were exposed to a fertile bull throughout the grazing season and withdrawn ~50 days before cows were ultra-sound-tested for pregnancy at the end of July.
Sampling of herbage, faeces and poultry litter
Samples of herbage and faeces were collected six (2014, 2015) or seven times (2013) during the grazing period. Herbage was sampled in each of the four plots at five random positions along a fixed transect (Henkin et al., Reference Henkin, Ungar, Perevolotsky, Gutman, Yehuda, Dolev, Landau, Sternberg and Seligman2015). At each position all above-ground biomass within a (25×25)-cm quadrat was clipped and bagged, and later dried and weighed. As the short-term impact of grazing on the vegetation structure is small in the range of animal densities examined here, the clipped samples are a reasonable representation of the herbage on offer during the preceding few days. On the same dates, five faecal samples were collected from each plot. Samples were collected from the ground taking care to select fresh dung pats sourcing from cows and not calves, and from different animals – distinctions that can be made on the basis of appearance. For each sample, ~200 g fresh weight of faeces were scooped from the uppermost part of the dung pat (to avoid soil contamination) and deposited into a plastic bag. Samples were then transferred into individual aluminium baking moulds – that do not imprint on NIR spectra – and dried in a ventilated oven at 65°C. On sampling dates that fell during the periods of PL supplementation, two samples of PL were also collected from the feeder in each plot and likewise dried in a ventilated oven at 65°C.
Near-IR spectroscopy analysis
Herbage samples were analysed by NIRS as described by Henkin et al. (Reference Henkin, Ungar, Dvash, Perevolotsky, Yehuda, Sternberg, Voet and Landau2011), and PL samples were analysed with the same technology. Calibration equations (Supplementary Table S2) were applied to the spectra obtained from herbage samples in order to estimate: (a) ash content (ASHherb), (b) in vitro dry matter digestibility (IVDMDherb; according to Tilley and Terry, Reference Tilley and Terry1963), (c) CP content (CPherb); (d) NDF content (NDFherb; with α-amylase); and (e) ADF content (ADFherb). We used calibration equations yielding good estimates of linearity and high accuracy, as estimated by the standard error of cross-validation (SEcv; Supplementary Table S2). The content of ME was derived from IVDMDherb by assuming gross energy to be 18.39 MJ/kg DM for all grass samples (Goley, Reference Goley1961) and the ratio of MEherb to IVDMDherb to be 0.82 (INRA, 1989; NRC, 1996).
For the purposes of faecal NIRS analysis, each faecal sample was re-dried at 50°C for one hour, placed inside a desiccator for 20 min, packed into a sample cell with a near-IR transparent quartz cover glass, and scanned in 2 nm increments over the range 1104 to 2492 nm using a Foss NIR Systems model 5000 monochromator spectrometer (Foss Tecator, Hoganas, Sweden). Two sets of previously described NIRS calibration equations (Supplementary Table S3; from Landau et al., Reference Landau, Dvash, Roudman, Muklada, Barkai, Yehuda and Ungar2016) were applied to the faecal spectra; one to predict faecal composition (ASHfec, CPfec and NDFfec) and the other to predict dietary quality (ASHdiet, CPdiet, NDFdiet, IVDMDdiet and MEdiet).
Estimation of dietary percentage of poultry litter
A new calibration equation was constructed to estimate the proportion of PL in the diet (PLdiet) from the faecal NIRS spectra. In all, 64 diet-faeces pairs were drawn from a previously described database (Figure 1 in Landau et al., Reference Landau, Dvash, Roudman, Muklada, Barkai, Yehuda and Ungar2016). The diets included wheat hay and PL given at different ratios ranging from 70:30 to 20:80, as well as three combinations of senescent natural pasture, barley grain and PL (87:0:13, 65:6:29 and 46:0:54, on DM basis). All procedures relating to sample collection and preparation, NIRS scanning and chemometric procedures were as described in Landau et al. (Reference Landau, Dvash, Roudman, Muklada, Barkai, Yehuda and Ungar2016). Performance of the calibration equations is shown in the Supplementary Table S3. An external validation was carried out on a total of 170 faecal samples collected in the summers of 2013, 2014 and 2015 and encompassing 22 different plots in the vicinity of Tel Juhader in the Golan Heights. In all, 35 samples were from cows with no access to PL, and the rest from cows with access to PL. Predicted PLdiet was 0.032 and 355 g/kg DM ingested for cows without and with access to PL, respectively. The former value did not differ from 0 and the latter value was well-correlated (R 2=0.85) to the amounts of PL made available to the cows.
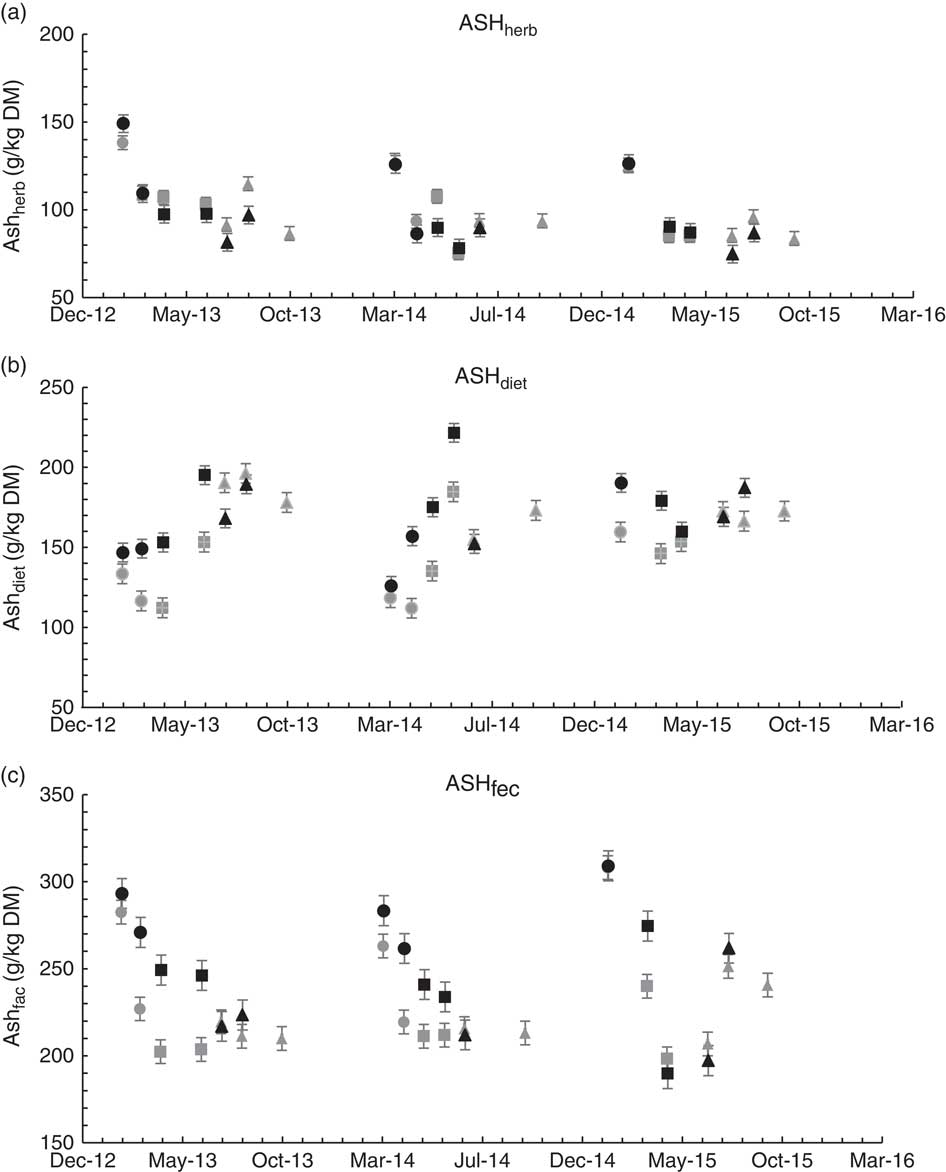
Ash contents of: (a) sampled herbage (ASHherb), (b) faecal near-IR spectroscopy-predicted diet (ASHdiet) and (c) faeces (ASHfec). Animal density treatments were L (grey; 0.56 cows/ha) and H (black; 1.11 cows/ha). Points (averages and standard errors) represent green (circles) and dry pasture seasons before (squares) and after (triangles) poultry litter supplementation was initiated. DM=dry matter.

Statistical analysis
Near-IR spectroscopy calibration equations were applied to all herbage and faeces samples gathered until cows from treatment H were removed from the plots (Supplementary Table S1). Predicted values (including PLdiet) were averaged over the five herbage or faeces samples collected in each plot at each sampling date. Samples were classified into three seasonal categories: green pasture (February and/or March), dry pasture without PL (April to June) and dry pasture with PL (July to October).
Statistical analyses were performed using SAS 9.2 (SAS Institute Inc., Cary, NC, USA). Comparison of treatments was performed using PROC MIXED. For the analysis of the four herbage properties (ASHherb, IVDMDherb, CPherb and NDFherb), three faecal composition properties (ASHfec, CPfec and NDFfec), and six diet composition properties (ASHdiet, CPdiet, NDFdiet, IVDMDdiet, MEdiet, PLdiet) a repeated measures ANOVA was used with a first-order autoregressive covariance structure. The factors in the model were treatment (L or H), year (2013, 2014 or 2015), season (green, dry-PLno, dry-PLyes) and their interactions. The experimental unit was plot nested within animal density, and sampling date was the repeated measure. Regarding variables for which interaction terms with year were found to be significant, separate analyses were conducted for each year.
Because the grazing season was short in the H treatment in 2014, only one synchronous measurement – in July – could be made for the two treatments. After it was established that the month effect was not significant for the other years, PLdiet values for July and August were averaged within a year and compared by ANOVA: the factors in the model were treatment (L or H), year (2013, 2014 or 2015) and their interaction, with plot nested within animal density as the experimental unit.
A t test was conducted to ascertain whether estimates of PLdiet before PL supplementation differed from 0. We examined the relationship between nutritional constituents in the herbage and in the diet selected (based on faecal samples) in relation to x=y curves and by coefficient of determination (R 2).
Results
Herbage mass
Herbage mass per unit area (Supplementary Figure S2) differed between years (P<0.05) and was overall higher in treatment L than in treatment H (P<0.05). The difference between treatments was highest (P<0.01) in the dry season before PL supplementation was implemented.
Animal performance
Body weight gain of cows from turning into pasture till weaning calves did not differ between cows of the L and H in 2013 (Supplementary Table S1), but L cows tended to gain more in 2014 (60.1±6.5 v. 35.9±10.3, P=0.10) and gained more weight in 2015 (86.0±9.6 v. 55.0±7.3, P<0.01). Calves from the L treatment gained (P<0.05) more weight to weaning than counterparts from H in the propitious year 2013 and the average year 2015, but not in the drought year 2014. No difference was noted between treatments in pregnancy rate subsequent to treatments (73.0% and 76.9% for H and L, respectively, over 3 years), as measured yearly by ultra-sound testing at the end of experiment.
Ash content
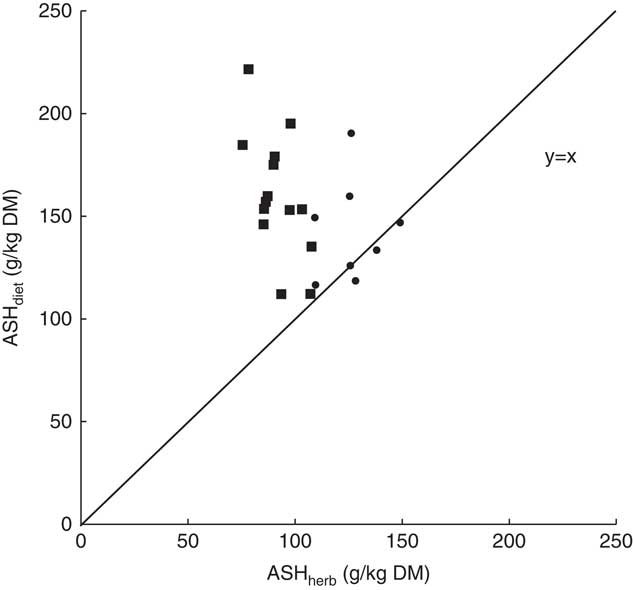
ASHherb decreased (P<0.001) from 143 g/kg DM in February to 102 g/kg DM in April, and was affected (P<0.05) by animal density only in August (Figure 1a). In contrast, ASHdiet was greater in treatment H than in treatment L over the period February to May, which was before PL supplementation (Figure 1b, P<0.01). A similar result was obtained for ASHfec (Figure 1c, P<0.01). However these treatment contrasts were no longer evident during the period of PL supplementation. ASHherb and ASHdiet were not correlated and ash content was generally higher in the diet than in the herbage (Figure 2). ASHfec and ASHherb values were correlated: for the H treatment, ASHfec=1.32×ASHherb+94 (R 2=0.51) and for L, ASHfec=1.10×ASHherb+146 (R 2=0.54), that is, with similar slopes but different intersects.
The relationship between the ash contents, averaged by treatment, and determined for the diet (ASHdiet) and for the herbage (ASHherb). Circles: green season; squares: dry season, no concurrent poultry litter supplementation. DM=dry matter.

Crude protein
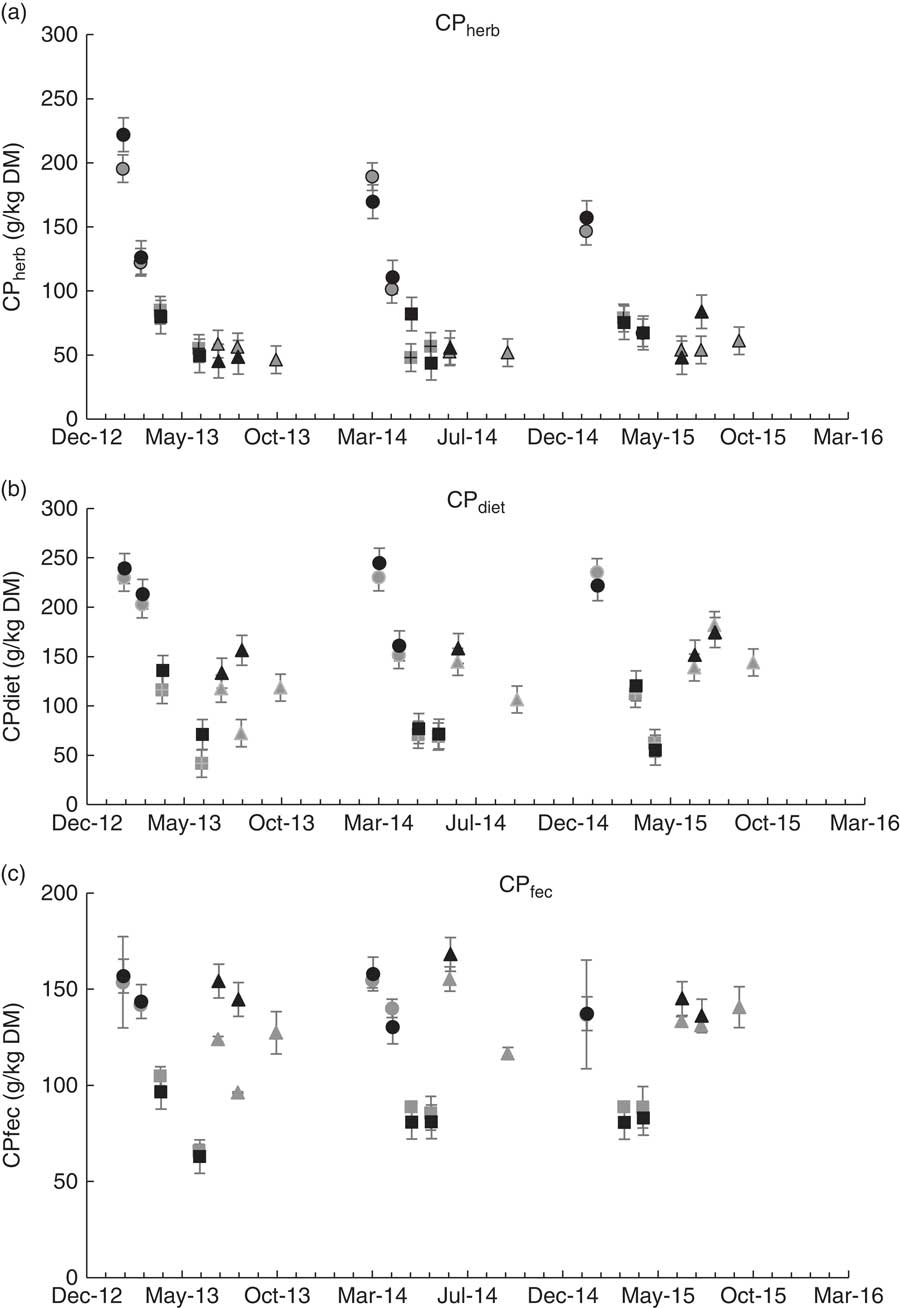
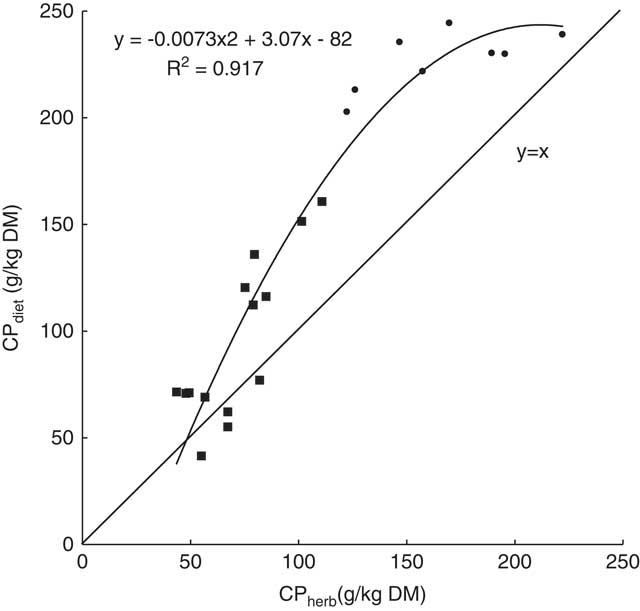
CPherb tended to vary with year (P=0.07), with higher green-season values in 2013 (Figure 3a). The effect of Season on CPherb was highly significant (P<0.0001) and large: values decreased from 169 g/kg DM in the green season to 69 g/kg DM in the dry-PLno season and to 54 g/kg DM in the dry-PLyes season. The corresponding values for CPdiet showed also a strong response to the progression of the seasons – 244, 91, 135 g/kg DM, with no effect found for animal density (P=0.77). The year×season interaction also tended to be significant (P=0.08). Poultry litter supplementation was associated with a marked increase (P<0.01) in CPdiet (Figure 3b) and CPfec (Figure 3c). During the PL supplementation period, treatment H had higher (P<0.05) CPfec, and tended to have higher CPdiet (P=0.08), than treatment L. A strong quadratic relationship was found between CPherb and CPdiet (R 2=0.92, P<0.0001; Figure 4), with most CPdiet values being greater than the corresponding values for CPherb, implying positive selection for protein-rich plants or plant organs in the middle of grazing period.
Crude protein contents of: (a) sampled herbage (CPherb), (b) faecal near-IR spectroscopy-predicted diet (CPdiet) and (c) faeces (CPfec). Animal density treatments were L (grey; 0.56 cows/ha) and H (black; 1.11 cows/ha). Points (averages and standard errors) represent green (circles) and dry pasture seasons before (squares) and after (triangles) poultry litter supplementation was initiated. DM=dry matter.

The relationship between dietary CP content (CPdiet) averaged by treatment, and herbage CP content (CPherb). Circles: green season; squares: dry season, no concurrent poultry litter supplementation. DM=dry matter.

Neutral detergent fibre
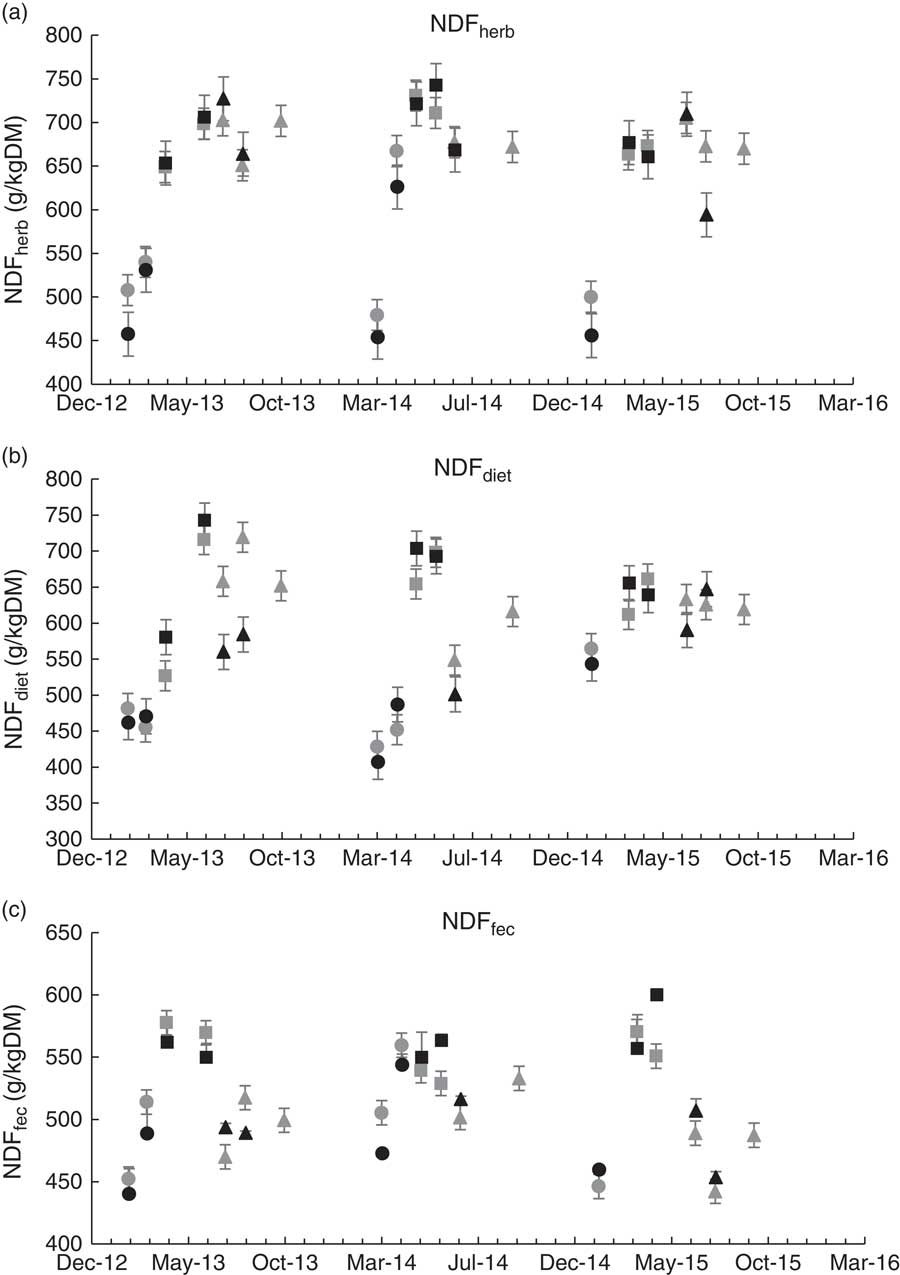
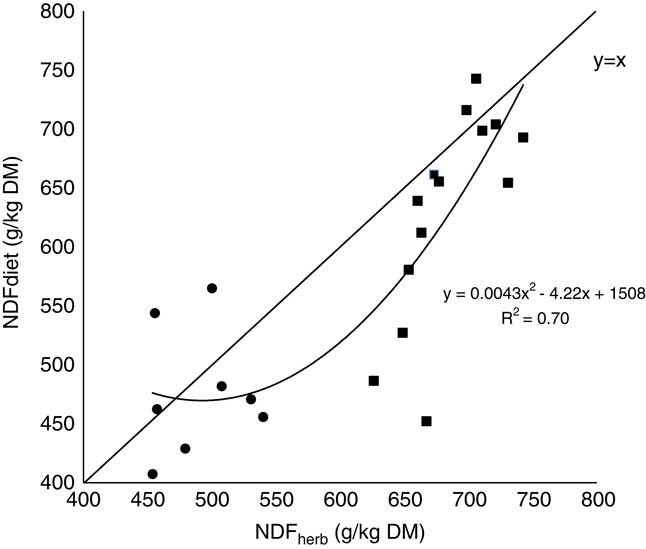
NDFherb and NDFdiet varied with season (P<0.01), increasing greatly over the course of the year (Figure 5a and b). During the dry-PLno season (except for 2013), cows of treatment H had higher NDFfec than those of treatment L (P<0.05; Figure 5c). In contrast, when supplemented, cows of treatment H tended to show lower (P=0.10) NDFfec than those of treatment L, and NDFdiet also tended to be lower in this treatment (P=0.10). Overall, the relationship between NDFdiet and NDFherb was quadratic (R 2=0.70, P<0.01). The within-season correlation between NDFdiet and NDFherb was significant in the dry-PLno season only (R 2=0.54, P=0.05), whereas NDFdiet was constant during the green season. During the dry season, NDFdiet was mostly lower than NDFherb (beneath the y=x line in Figure 6) indicating negative selectivity for NDF in mature herbage.
Neutral detergent fibre contents of: (a) sampled herbage (NDFherb), (b) faecal near-IR spectroscopy-predicted diet (NDFdiet) and (c) faeces (NDFfec). Animal density treatments were L (grey; 0.56 cows/ha) and H (black; 1.11 cows/ha). Points (averages and standard errors) represent green (circles) and dry pasture seasons before (squares) and after (triangles) poultry litter supplementation was initiated. DM=dry matter.

The relationship between dietary NDF content (NDFdiet) averaged by treatment, and herbage NDF content (NDFherb). Circles: green season; squares: dry season, no concurrent poultry litter supplementation. DM=dry matter.

Dry matter digestibility and metabolizable energy
Estimates of IVDMD in herbage and diet were not affected by year (Supplementary Figure S3), but the seasonal effect was very strong (P<0.001). During the dry-PLno season, IVDMDherb was similar between treatments but IVDMDdiet was higher in treatment L than in treatment H (P<0.05). IVDMDdiet hence MEdiet were not influenced by PL supplementation. The relationship between MEdiet and MEherb (not shown) suggests that during the green season cattle selected diets whose energy concentration was lower than that of the herbage, whereas they did the reverse in the dry seasons, irrespective of supplementation.
Poultry litter in diet
Based on weighings of the initial and residual quantities of PL offered, cows consumed more (P<0.05) PL in 2014 (which received 374 mm of rainfall) than in 2013 (648 mm) or 2015 (476 mm); intake of PL in 2013 and 2015 did not differ. In the 1st, 2nd and 3rd years of the experiment, cows of treatment L consumed 3.4, 6.8 and 5.1 kg/d DM of PL, compared with 6.8, 8.9, 5.3 kg/d DM for cows of treatment H, respectively (P<0.05).
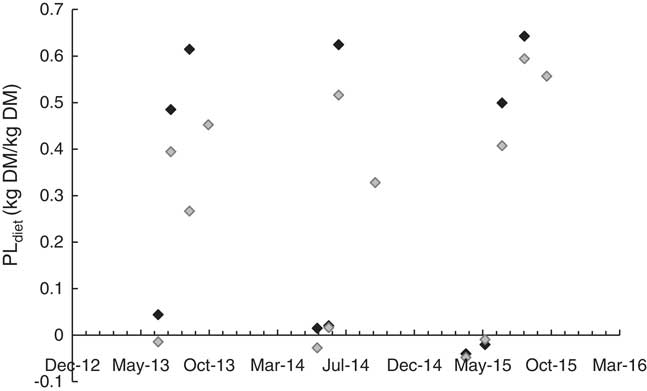
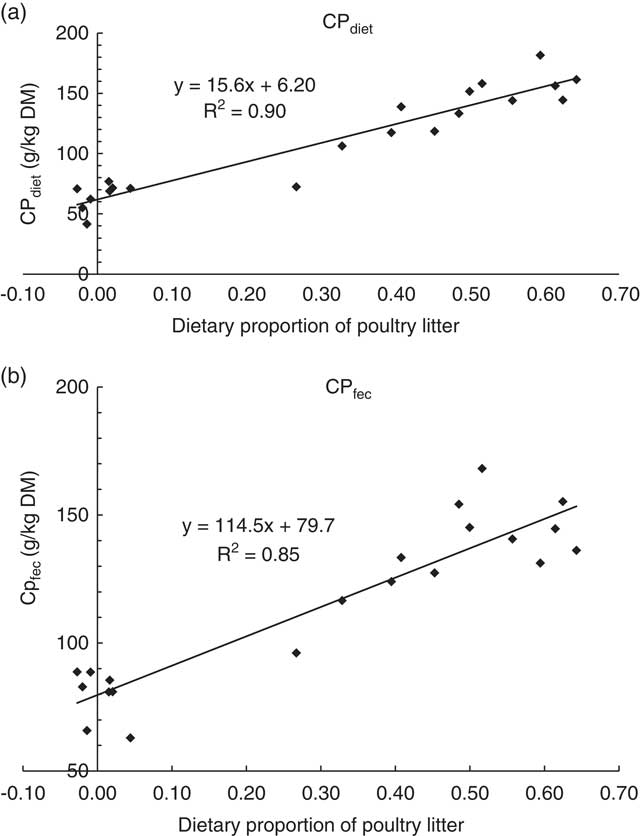
The data presented here represent the first estimate of PL percentage in the individual diets selected by freely grazing cows (PLdiet) in herbaceous rangeland: as would be expected, PLdiet (as determined by faecal NIRS) in the dry-PLno season did not differ from 0 (0.003, P=0.70), in contrast with the dry-PLyes season (Figure 7). Significant year (P<0.05) and animal density (P<0.03) effects were found: PLdiet (during the dry-PLyes season) was 0.44, 0.58 and 0.54 in 2013, 2014 and 2015, respectively, that is, lowest in 2013, but 2014 and 2015 did not differ. PLdiet was greater for cows of treatment H (0.592±0.025) than for those of treatment L (0.448±0.024). Strong positive correlations were found between PLdiet and CPdiet and CPfec (Figure 8: R 2=0.90 and 0.85, P<0.001); negative correlations were obtained between PLdiet and NDFdiet and NDFfec (R 2=0.48 and 0.73, P<0.05).
The dietary proportion of poultry litter as predicted by faecal near-IR spectroscopy (PLdiet). Animal density treatments were L (grey; 0.56 cows/ha) and H (black; 1.11 cows/ha). DM=dry matter.

The relationship between the proportion of poultry litter (PL) in the diet (PLdiet) averaged by treatment, and: (a) dietary contents of CP (CPfec), (b) faecal contents of NDF (NDFfec).

Discussion
Herbage quality
The sharp decrease in CP concentration and IVDMD of clipped herbage that accompanied the transition from green to dry season (Figure 3a and Supplementary Figure S3), as well as the concomitant sharp increase in NDF (Figure 5a), are in agreement with the findings of Henkin et al. (Reference Henkin, Ungar, Dvash, Perevolotsky, Yehuda, Sternberg, Voet and Landau2011). However, they reported that treatment H was associated with higher herbage CP content during the green season and lower herbage NDF content in the dry season, which was not apparent during the 3 years of the present study.
Dietary quality and feeding behaviour
Inferring dietary quality from analysis of clipped samples is liable to yield biased estimates: cows consumed diets higher in protein (Figure 3b) and lower in NDF (Figure 5b), when compared with herbage clipped samples. The relationship between dietary and herbage contents of CP was polynomial (Figure 4: R 2=0.92, P<0.001). In most CPdiet−CPherb pairs, most (>80%) values were greater for CPdiet. A similar, but inverse trend was found for NDF (Figure 6). Values were close to the y=x line when the herbage was of relatively high (green season) or low (end of dry season) quality. This is probably because animals can improve their diets by selective grazing only when the herbage is heterogeneous in terms of palatable/unpalatable species and leaf:stem ratios. Early in the green season, pasture is lush green and all the herbaceous species are highly nutritious featuring high protein and low NDF contents, that is, the herbage is relatively homogeneous. Likewise late in the dry season, palatable species have been consumed, much leafy material has been collected by cattle (and other herbivores including ants), and cows can no longer ‘take the best and leave the rest’. Indeed, selectivity peaks early in the dry season, when some plants are still green and flowering while others have already set seed and are senescing, making for heterogeneous pasture. In other words, selectivity is at its highest when both CP and NDF are in the medium range of quality.
Animal density and dietary quality before supplementation
Our hypothesis was that H and L treatments would elicit differences in dietary quality because of the differential competition for forage resources between them. However the only significant differences found before the supplementation period were in dietary and faecal ash (Figure 1b and c) and in dietary IVDMD (or ME concentration; Supplementary Figure S3). The development of differences during the green season was probably mitigated by the abundance of forage at the two animal densities. However, when there was no herbage growth and competition came into effect, treatment L cows ingested diets that were more digestible (i.e. higher in energy) than treatment H cows (Supplementary Figure S3). This is consistent with the finding of Brosh et al. (Reference Brosh, Aharoni, Shargal, Sharir, Gutman and Choshniak2004) from the same study site that cows in treatment H had lower energy expenditure, implying lower energy intake. Not unexpectedly, high animal density results in diets of lesser quality, as estimated by energy content.
Animal density, dietary ash and geophagy
The largest difference between the composition of herbage and diets (Figure 1) was obtained for ash, with differences reaching 150 g/kg and averaging 70 g/kg DM. Detailed information regarding the ash contents of temperate and tropical roughages can be found in INRA (1989) which shows that the ash content decreases as plants mature, as found in the present study (Figure 1a). In contrast, dietary ash increased from February to May in 2013 and 2014 (Figure 1b). The method of choice to identify the source of ash in faeces would be by conducting an analysis of acid insoluble residue – assuming that it derives from soil, with a small correction for plant silica – and subtracting this value from total ash in faeces (Ludwig et al., Reference Ludwig, Healy and Cutress1966). This was not done, but, by plotting ASHfec v. ASHherb, we found approximately parallel lines with greater value for the intersect in the H group (146 v. 94 g/kg DM): in other words, faecal ash content was higher in H, independent of ASHherb. The only possible explanation for such elevated contents of dietary ash and for faecal ash independent of the ash contents of herbage is the ingestion of soil (geophagy). This has relevance to animal welfare, as soil ingestion causes abrasive tooth wear (Healy et al., Reference Healy, Cutress and Michie1967).
The difference in dietary ash contents between treatments H and L peaks at 50 g/kg DM (Figure 1b). Assuming daily intake of 16 kg during lactation and 10 kg during periods of maintenance (Aharoni et al., Reference Aharoni, Brosh, Orlov, Shargal and Gutman2004), soil intake is 500 to 800 g/d higher in treatment H than in treatment L; and assuming an average of 70 g/kg DM intake (DMI) for the difference between dietary and herbage ash, soil intake ranged from 0.7 to 1.5 kg/d in the present study. In Eastern USA, Fries et al. (Reference Fries, Marrow and Snow1982) estimated soil intake to be 1.38±.33% to 2.43±.50% of total DMI for cattle on pasture that also received supplemental feed, which is equivalent to 190 to 275 g/d of soil. A detailed study of soil ingestion by dairy cows in New Zealand (Healy, Reference Healy1968) showed that soil averaged 7.5% of DM ingested, and that the annual soil consumption per animal of 180 to 320 kg was correlative to animal density. Mayland et al. (Reference Mayland, Florence, Rosenau, Lazar and Turner1975) also reported that the source of most of the 500 g soil ingested daily by cows in the USA was from ingestion of roots and the base of stems, or from direct soil ingestion, which increased as forage availability decreased. So there appears to be consensus about the positively related effect of animal density on soil intake. This can have a severe implication: Healy et al. (Reference Healy, Cutress and Michie1967) reported that supplementing sheep with hay for 8 to 10 weeks ‘when pasture growth is low and animal appetite high’ reduced soil intake by 75% and tooth wear by 50%. We are not aware of a quantitative estimate of the effect of ingested soil on tooth abrasion in cattle, but it is surely an issue worth investigating. Geophagy may also result from a mineral deficiency (Suttle Reference Suttle2010). We are not aware of such deficiencies for the last 20 years on this experimental site, but the issue also merits further enquiry.
We can offer another interpretation to the relationship between soil ingestion and animal density: based on examples of elephant, ape and other wildlife behaviour, Villalba and Provenza (2007) contended that ingesting soil is related to the detoxication of plant secondary compounds. As the frequency of unpalatable plants – and in particular, tannin-rich Psoralea bituminosa and nitrate-rich thistles – increases under very high animal density, geophagy may indeed be a self-medication response.
A major implication of our finding that high animal density triggers geophagy is that measurement of faecal ash, which requires only a weighing scale and 450°C oven, could be used to monitor the impact of animal density on the nutrition and welfare of grazing animals. As faecal and dietary ash are closely correlated during the green period (Faecal ash (g/kg)=Dietary ash×1.098+125, R 2=0.78), this would be a good period to monitor the impact of animal density.
Animal density, the intake of poultry litter and animal health and welfare
Poultry litter is richer in protein and poorer in NDF than mature pasture. It was therefore expected that PL consumption would be associated with increased dietary protein and decreased dietary NDF contents, as indeed found in this study (Figures 3b and 5b). The very good correlations shown in Figure 8 confirm this hypothesis. A major concern when cattle have free access to PL is over-eating of PL at the expense of dry pasture. In treatment L, approximately one-third of DM ingested consisted of PL, compared with 0.55 in treatment H. As the available biomass was higher in treatment L at the onset of supplementation, our results suggest that when dry pasture is available, cattle will avoid excess dietary PL, and will not overeat PL. Silanikove and Gutman (Reference Silanikove and Tiomkin1992) proposed that over-eating PL in summer corresponds to an effort to reduce internal heat load. This is achieved by avoiding grazing and preferring food of lower heat increment from ingestion and digestion. If this theory is true, cows in treatment L did not suffer greatly from heat load. By choosing to consume PL moderately, they refrained from maximizing CP and minimizing NDF intake, and may also have reduced their total DMI, as CP and NDF are positively and negatively associated with DMI, respectively (Ketelaars and Tolkamp, 1992).
The present study presents the first published values of dietary PL percentages in cows free-ranging in herbaceous rangelands, in the range 0.44 to 0.58, that is, much higher than the present maximum of 0.30 recommended by the Extension Service of Israel (Gabrieli R., personal communication). The high animal density of treatment H was associated with very elevated proportion of dietary PL (Figure 7). Over-eating PL impairs liver function (Silanikove and Tiomkin, Reference Silanikove and Gutman1992) and reproductive performance in beef cows (Silanikove and Gutman, Reference Silanikove and Tiomkin1992). As half the nitrogen in PL consists of uric acid (Eiteman et al., Reference Eiteman, Gordillo and Cabrera1994), feeding PL without supplementation of rumen-degradable energy could be associated with ruminal ammonia and higher plasma urea, which are conducive to lower first-service conception in dairy cows (Canfield et al., Reference Canfield, Sniffen and Butler1990). As CPfec is very strongly related to PLdiet, implementing seasonal analysis of faecal CP by NIRS or by one of the widespread Kjeldahl systems could be a simple way of monitoring the ingestion of PL by cattle at the farm level.
Finally, our data shows that ingesting PL is also associated with reduced NDF intake, hence probably, with less rumination time. As rumination is a ‘normal’ behaviour of cattle (Kilgour Reference Kilgour2012), this in itself can be considered deleterious to animal welfare.
Conclusion
Raising cattle on dry Mediterranean rangelands is a marginally profitable endeavour and herd owners aim to raise production by increasing animal density. When cattle nutrition was monitored for 3 years by faecal NIRS it appeared that high animal density was associated with over-ingestion of soil and of PL, with probable negative consequences for animal health and welfare. In such environments, faecal NIRS could be instrumental in determining the animal density that balances the goal of productivity with the concerns for animal health and welfare.
Acknowledgement
Funding by the Chief scientist of the Ministry of Agriculture (program no. 277-042) is acknowledged.
Supplementary Material
To view supplementary material for this article, please visit https://doi.org/10.1017/S1751731117001422