1. Introduction
Recent advances in automation and digitization have significantly transformed industrial mass production. However, the technological landscape presents significant challenges, including increased costs and operational complexity. Future organizations will need technologies to meet their needs to thrive in this ever-changing environment. Medium-sized self-driving vehicles operating in factories, assembly lines, and warehouses require an Internet of Things (IoT)-enabled hybrid navigation system. The ability of these automated vehicles to accelerate the transport of supplies from their source to designated workstations can enhance overall operational efficiency. A self-driving automated guided vehicle (AGV) needs to be furnished with a wide range of sensors, including light detection and ranging (LiDAR) [Reference Singholi, Mittal and Bhargava1], GPS [Reference Yousuf and Kadri2], vision [Reference Mary Joans, Gomathi and Ponsudha3], ultrasonic [Reference Alkhawaja, Jaradat and Romdhane4], infrared [Reference Xiong, Huang, Yin, Zhang and Song5], and radar [Reference Bhargava, Suhaib and Singholi6], for it to be able to guide itself through new and tricky situations in real time. A complex control system is essential for processing sensor data to estimate navigation paths and detect obstacles. This enables the design of a safe and effective route to the destination or station. Integrating software with mechanical and electrical hardware, supported by robust local and remote communication networks, can reduce congestion and minimize collisions [Reference Khan, Haleem and Javaid7]. Furthermore, the system must be robust against external disturbances and capable of recovering from faults. This will ensure that there is not much need for outside interference during the system’s long operational life. An AGV requires information from various sensors to accurately sense its environment. These sensors differ in terms of expense, capability, and data collection capacity [Reference Singholi8]. A medium-sized AGV employs visual recognition [Reference Huang, Zhu, Song, Zhao and Jiang9], deep learning [Reference Bhargava, Suhaib and Singholi10], artificial neural networks [Reference Singh and Khatait11], and perceptual intelligence [Reference Agarwal and Bharti12] for autonomous driving. It is, therefore, a potent tool in the automation landscape. While existing navigational autonomy techniques are helpful in specific situations, they have numerous limitations in complex and dynamic industrial settings [Reference Agarwal and Bharti13]. Although widely used for global path planning, the conventional A* method often produces inefficient paths with excessive turns, resulting in longer routes and higher runtimes [Reference Singholi and Sharma14]. Due to local minima problems, the vehicle may become stuck in confined spaces or crowded areas using the artificial potential field (APF) technique [Reference Ding, Zheng, Liu, Guo and Guo15]. The dynamic window approach (DWA) leads to many diversions since it performs poorly in long-range path planning but well in short-range dynamic obstacle avoidance [Reference Zhou, Yi, Zhang, Chen, Yang, Han and Zhang16]. There are further drawbacks to the rapidly exploring random tree (RRT) [Reference Bircher, Alexis, Schwesinger, Omari, Burri and Siegwart18], Boolean, Bayesian [Reference Post17], and probabilistic roadmap (PRM) fusion approaches. In scenarios with numerous obstacles, PRM is ineffective, whereas RRT’s randomization may result in suboptimal and unpredictable paths [Reference Lonklang and Botzheim19]. Utilizing such approaches can escalate difficulty without strengthening the ease of navigation. Given these weaknesses and increasing operational complexity, alternative strategies such as the modified A* and DWA hybrid optimization (ADWA-HO) system should be adopted to address evolving industrial processes and real-time control requirements.
This article is formatted as follows: Section 2 provides an in-depth outline of the methods employed in this study, including a literature review, and highlights areas that require further research. Section 3 delves into the kinematic and dynamic modeling. Section 4 details the ADWA-HO algorithm employed in this research, while Section 5 discusses the hardware and software implementation. Finally, Section 6 presents the experimental validation, and the study’s outcomes and conclusions are presented in Section 7.
2. Literature review
In the 1950s, Barrett Electronics Corporation pioneered the development of AGVs for industrial applications. AGVs have become a widely adopted transportation technology to perform diverse tasks with efficiency, safety, and precision. Extensive research has been conducted in transportation, AGVs, and mobile robotics, covering static and dynamic environments. Connectivity advancements have further solidified the trend toward the now-necessary integration of intelligence into these systems. The emergence of IoT-enabled smart devices and the creation of smart vehicles have made major contributions to advancements in this field. Intelligent uncrewed vehicles are increasingly essential for modern companies to perform tasks such as loading and unloading. These vehicles enhance productivity in complex environments by continuously adapting to their surroundings. They update maps, recalculate paths, and maintain route accuracy to optimize material handling and shipment. These methods also show strong potential for adoption across other industries. According to research by Zheyi et al. [Reference Zheyi and Bing20], AGVs can function well in directed and unguided situations. The AGV uses a “potential function” to navigate in unguided environments. In guided environments, it utilizes radio frequency identification (RFID) tags as nodes to guide its travel from origin to destination, selecting the most optimal route among a range of feasible options. Achieving high precision and accuracy in robotics and autonomous vehicles is essential, as highlighted by Jans et al. [Reference Jans, Green and Koerner21]. This can be achieved using three primary approaches: mechanical, programmable, and sensor-based techniques. Sensor-based techniques leverage a variety of sensors, including RGB vision cameras, 9-axis IMU sensors, 3-axis infrared and sonar sensors, gyroscopes, magnetometers or compasses, accelerometers, and more. Optical shaft encoders measure the motor’s angular position and provide digital output. The system achieves significantly improved motion precision by integrating this data with gyro sensor measurements in a PID controller. Caitité et al. [Reference Caitité, dos Santos, Gregório, da Silva and Mendes22] developed a line-follower AGV capable of identifying colored lines to restrict operator authorization and distinguish between courses. The system’s microcontroller utilizes fuzzy logic with the Mamdani inference method to accurately detect lines and control AGV movement smoothly. The AGV utilizes RFID-based identity and authorization, as well as LDR (light-dependent resistor)-based color sensors, to detect lines. To ensure smooth and precise stopping, some systems also incorporate a fuzzy AGV control mathematical model, which adjusts the electric motor’s power based on speed and the distance to obstacles [Reference Setiawan, Rusdinar, Rizal, Mardiati, Wasik and Hamidi23]. Gu et al. [Reference Gu, Liu, Li, Yuan and Bao24] propose a hybrid path planning technique for inspection robots on coal mine roads that combines the DWA with an enhanced A* algorithm and the Floyd method. B-spline slopes are utilized to optimize the route, eliminate duplicated nodes, and incorporate a target-weighted heuristic function into the A* algorithm. Findings show that this hybrid technique enhances safety, efficiency, and path smoothness, making it suitable for inspection robots in complex coal mine environments. Lazreg et al. [Reference Lazreg and Benamrane25] proposed a fusion-based path planning technique that combines particle swarm optimization (PSO) with an adaptive neuro-fuzzy inference system (ANFIS). While ANFIS has limited speed optimization capabilities, it enables learning-based control for accurate target reaching. PSO enhances the hybrid controller by optimizing speed and position adjustments, improving overall navigation performance. Simulation results indicate that the hybrid ANFIS-PSO approach outperforms conventional methods in movement efficiency and reduces travel distance. This method is particularly effective for mobile robotics, improving collision avoidance and enabling smoother, faster navigation. Jiang et al. [Reference Jiang and Yan26] described AGVs that follow guided lines, select optimal pathways, and transmit their positions via a wireless sensor network. However, their approach may face limitations when sensors encounter black-and-white line patterns. Logistics automation and real-time data for informed decision-making are greatly enhanced by RFID technology, an integral part of Industry 4.0. Using a camera and a microcontroller, A.M. et al. developed a system for tracking lines and objects [Reference A., K., k. and N.27]. Meanwhile, Bhargava et al. developed a real-time mobile AGV control method that utilizes a Microsoft Kinect sensor connected to a laptop or PC, along with a mobile AGV equipped with LiDAR [Reference Bhargava, Singholi and Suhaib28]. Their system uses microcontroller programming to control a wireless AGV via hand gestures detected by the Kinect sensor. Gestures such as start, progress, right, left, and backward are recognized, and MATLAB is used to generate movement commands, which are then transmitted to the AGV. Kokot et al. [Reference Kokot, Miklić and Petrović29] implemented AGVs powered by the robot operating system (ROS) on assembly lines, employing two sets of LiDAR for autonomous navigation, mapping, and localization. An RGB-D camera was used to understand the workspace and detect workers, with YOLO V3’s AI deep learning employed for this purpose. The AGV robot manipulator was tasked with pick-and-place operations. The proposed AGV demonstrated effective performance in SLAM, autonomous navigation, and collision avoidance in typical indoor settings. Ajeil et al. [Reference Ajeil, Ibraheem, Sahib and Humaidi30] addressed the route planning problem for autonomous robots in static and dynamic environments, aiming to generate short, smooth, and collision-free paths. They proposed a hybrid PSO-modified Firefly algorithm (MFB) to maximize path efficiency and smoothness. A local search (LS) algorithm identifies and corrects impractical path segments. An obstacle detection and avoidance module enable the AGV to respond dynamically to its environment. Simulation results demonstrate that this hybrid approach produces more feasible and optimized routes than conventional path planning methods. J. Zheng et al. highlighted that AGVs often operate in confined layouts, where dynamic interactions can lead to collisions and deadlocks. Although numerous solutions have been proposed, many fail to prevent dynamic collisions and deadlocks effectively. To address this, their research recommends scheduling multiple AGVs using dynamic resource reservations to minimize collisions. The layout is divided into uniform square blocks, representing points in an undirected graph. Vehicle trajectories are dynamically managed to resolve collision and deadlock issues by identifying shared resource locations [Reference Koyama, Katsumata and Kimura31–Reference Zheng and Zhang32]. AGV guidance technologies are rapidly evolving, with applications in smart delivery, automated pickup, and intelligent storage systems. The visual perception capabilities of AGVs have been significantly improved through advanced image processing techniques, enabling accurate and reliable interpretation of complex environments. Before these advancements, pixel interference was common due to variable lighting, inconsistent road surfaces, poor marking reflectivity, uneven marker widths, and other environmental inconsistencies. Qin et al. [Reference Qin, Jian, Chen and Jian33] presented a gray barycentric approach to reliably determine path marker centerlines and address these issues. This concept uses traditional methods to produce a normal vector at each array location. An integrated image-capturing card installed on a specially designed cart prototype was used to test the system, allowing real-time visual data capture for performance assessment. The improved approach decreases pixel interference, improving image durability and extraction accuracy. A storage AGV with optical navigation uses fast and flexible image processing. Visual feedback controls motors and servos in hybrid, position-based, or image-based systems. Visual serving systems typically use either an “eye-in-hand” or “hand-in-eye” camera configuration. In the eye-in-hand setup, the AGV’s camera faces the target directly, while the hand-in-eye setup uses an external camera to monitor the AGV and the target object. These systems guide AGVs in industrial settings, frequently following norms. Despite their robustness, these systems can be disrupted by AGV paths or surrounding obstacles. Global vehicle monitoring enables dynamic route adaptation, thereby reducing the risk of collisions and facilitating more flexible navigation. Although these systems can be expensive for simple obstacle avoidance tasks, the AGV platform remains essential for industrial automation, smart warehouses, and intelligent logistics. This platform facilitates controlled loading and unloading, making it essential for research on AGV automated positioning and navigation [Reference Wang and Mao34]. The growing demand for AGVs in smart manufacturing emphasizes their increasing role in transporting machinery and supplies. In this regard, Wang et al. [Reference Li, Ho and Huang35] investigated AGV path planning for a single manufacturing line in a workshop. They developed a computational model designed to minimize transit time and proposed an enhanced PSO method for path planning and optimization.
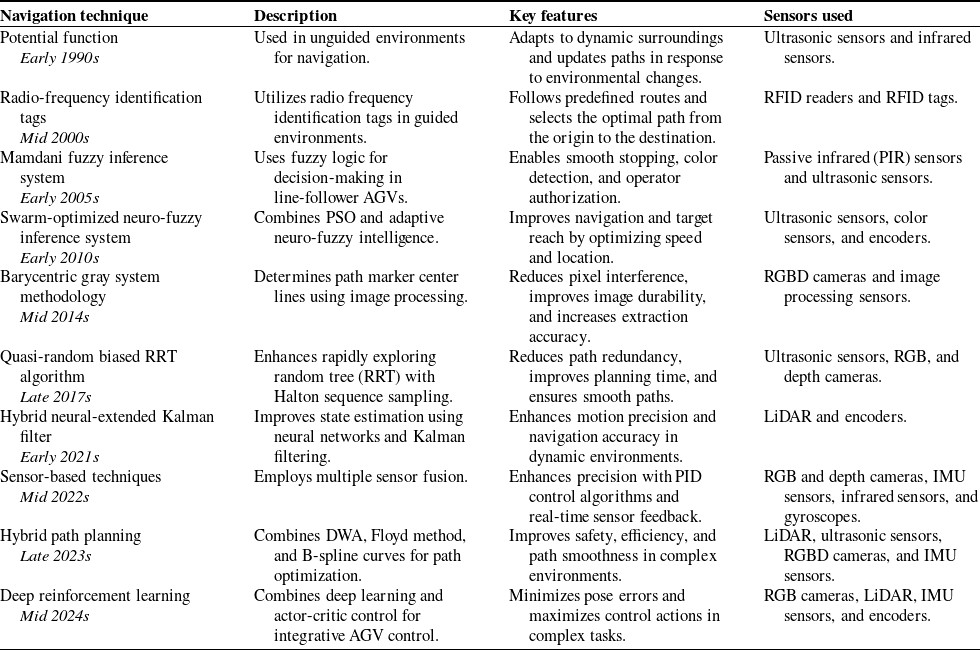
Evolution of AGV navigation techniques: descriptions and key features.

Science and technology influence all aspects of human activity, and modern industrial practices are increasingly outsourcing human tasks to machines and automation. Automation frees people from repetitive activities, which are typically governed by rigid formulas. Kim et al. [Reference Kim, Suh and Han36] describe a path planning and control module for an omni-wheeled mobile robot (OWMR). To improve robustness and adaptation speed in OWMR motion control, a brain limbic system (BLS)-based regulation technique was developed. The A* algorithm and the fuzzy analytic hierarchy process (FAHP) create the most effective route planning module for effective navigation. Simulations validate the proposed motion control and path planning framework for dynamic target tracking, circular path tracking, and point-to-point motion. The A*-FAHP algorithm guarantees collision-free, optimal path planning in various settings, including warehouses and automated valet parking, and the findings show that the BLS-based controller outperforms conventional PID controllers. The Halton-biased RRT algorithm for efficient robotic route planning is described in this study by Zhong et al. [Reference Yan, Liu, Zhang and Zhang37]. Using uniform sampling based on the Halton sequence guarantees consistent search space coverage and successfully addresses the uneven node distribution issue in conventional RRT. Both candidate sampling pool techniques and a mouse-inspired goal-oriented strategy optimize sampling quality and memory economy. Path redundancy is removed using a multi-level planning technique, and the final path is smoothed using a B-spline technique. Regarding planning time, path length, and path quality, HB-RRT outperforms RRT, Bionic Target Bias-RRT, and Informed-RRT* in simulations and real-world tests. To overcome the constraints in the spatial localization of AGV LiDAR data in the industrial sector, Yan et al. [Reference Habermann, Hata, Wolf and Osorio38] examined the application of machine learning methods. Their research explores the application of bagging and boosting techniques to decision trees and the k-nearest neighbor method. They evaluated various algorithms using different criteria and hyperparameter adjustments, with multiple regression used for comparative analysis. For automated vehicles, 3D point cloud data is essential for environmental assessment. Miljkovic et al. [Reference Miljković, Vuković, Mitić and Babić39] presented a hybrid AGV control system that utilizes image-based visual serving (IBVS) for precise movements near loading/unloading points and position-based control (PBC) for global navigation. Unlike conventional AGV navigation, monocular SLAM eliminates the requirement for precise environmental maps or markers. The neural extended Kalman filter (NEKF) model uses a feedforward neural network to improve state estimations. The hybrid control system and NEKF-based position estimate were tested in a laboratory setting with a mobile robot equipped with a simple camera. Experimental results demonstrate improved motion precision and navigation accuracy, confirming the viability of the proposed AGV hybrid control system. Gao et al. [Reference Gao, Gao, Liang, Zhang, Deng and Zhu40] combine deep reinforcement learning and actor-critic control to create an integrative control system. The Lyapunov method creates a kinematics control law that minimizes pose errors as an initial control input. In a finite Markov decision process tracking control problem, deep deterministic policy gradient (DDPG) maximizes control actions. Table I presents a chronological and comparative overview of the primary navigation techniques developed for AGVs.
Comparative analysis of advanced algorithms.

Table II presents a detailed comparative analysis of the advanced algorithms, including the author, method, objective, contribution, and advantages of the proposed ADWA-HO algorithm.
-
• Many studies focus on static or regulated industrial settings, whereas dynamic contexts with unexpected problems are understudied. Most AGV systems are designed for controlled, predictable environments, and little is known about how they can adapt to dynamic situations, such as crowded rooms or rapidly changing industrial floors. To address these dynamic challenges, the ADWA-HO algorithm optimizes real-time obstacle avoidance and routing in dynamic indoor and outdoor environments.
-
• Studies have employed LiDAR, vision systems, and global navigation satellite system (GNSS) for navigation, but few have explored combining sensing modalities to enhance AGV navigation and control in complex scenarios. These sensors have not yet been incorporated into an indoor and outdoor system. The AGV can better perceive and react to its environment with the ADWA-HO and multi-sensor data fusion, including LiDAR, vision sensors, IMUs, and ultrasonic sensors.
-
• Potential functions, improved particle swarm optimization (IPSO), and visual-SLAM are path planning approaches. However, real-time algorithms that quickly compute the best pathways while considering static and dynamic barriers are needed. Complex conditions can make A* or DWA rigid or inefficient. However, the A* and DWA combination enables the real-time scheduling of routes, facilitating quick decision-making in changing circumstances.
-
• AGVs often use traditional systems for line-following, obstacle avoidance, and other warehouse operations. The flexible, high-performance AGVs for numerous applications and settings are understudied. The customized omnidirectional AGV, as shown in Figure 1, equipped with an ADWA-HO algorithm, may be suitable for various applications in busy industrial and public locations.
-
• Many methods fail to prevent dynamic collisions or are oversimplified despite deadlock and collision avoidance challenges. Few dynamic solutions to these problems have been studied, particularly in the context of AGVs operating in external or outdoor environments. By establishing a stable foundation, ADWA-HO’s dynamic performance can minimize collisions and deadlocks in real-time environments.
-
• Prior research has stressed the need for quick processing to control the AGV, but it has rarely examined the most efficient methods under computing constraints. Dynamic real-time decision-making is complex for traditional algorithms. The modified A*-DWA fusion may enhance AGV decision-making by integrating real-time sensor data processing with efficient path planning and obstacle avoidance. The ADWA-HO, with an omnidirectional AGV control system, may fill these gaps. To advance industrial and AGV technology, this research focuses on scalability, real-time path planning, multi-sensor integration, and dynamic settings.
The automated guided vehicle labeled diagrams.

The automated guided vehicle free body diagrams.

Advanced methods for thorough comparison are presented in this research, such as dynamic A* (D*), APF, DWA, PRM, PRM & RRT fusion, and PRM & DWA fusion. This comprehensive analysis should help us understand the merits and demerits of each algorithm in various situations. This comparison assesses the performance of each technique and suggests future research directions, including the development of robust collision avoidance algorithms for highly dynamic environments and the creation of hybrid algorithms that can operate effectively in both structured and unstructured settings. Ultimately, path planning and obstacle avoidance enhance the intelligence and success of industrial AGVs.
3. Locomotion of the AGV
Four-wheeled AGVs with mecanum wheels provide remarkable maneuverability and agility. The omnidirectional mobility made possible by the 45-degree rollers on these wheels enables the AGV to move forward, backward, sideways, and diagonally without changing its orientation. Mecanum wheel AGVs are well suited for maneuvering in confined spaces and complex environments due to their ability to maintain accuracy and a variety of movements in industrial applications [Reference Bisht, Pathak and Panigrahi41]. The AGV can perform precise movements, such as spinning on the spot, by controlling the speed and direction of each wheel, increasing its operational efficiency in various scenarios.
Figures 1 and 2 depict the four-wheel omnidirectional mobile AGV, which consists of four mecanum wheels. The rollers positioned around the edges of the wheel are consistently oriented at an angle ψ. In this specific case, with ψ set to 45 degrees, the wheel can move smoothly at a 45-degree angle relative to the direction of the applied motion. Each wheel has a permanent magnet-brushed motor, as described in ref. [Reference Tarvirdilu-Asl, Zeinali and Ertan42], which delivers the necessary torque to drive the AGV’s movement. The center of gravity of the AGV, denoted as Or in Figure 2, is considered the reference point for motion analysis. The AGV is thought to travel on a flat, evenly spaced surface, with all its components, including the wheels, treated as rigid bodies to simplify the equation of motion. The kinematic and dynamic modeling is as follows:
3.1. The kinematics and dynamics of AGV
The fixed coordinate frame is denoted as Oq, while Or represents the mobile coordinate frame attached to the AGV. Each wheel has its wheel coordinate frame, represented as Owi (where i = 1 to 4). As described in ref. [Reference Khan, Khatoon and Gaur43], we express the wheel position vector in its respective coordinate frame, Owi, as Pwi. The corresponding equation is given by:
 \begin{equation}\textrm{P}_{\textrm{wi}}(\rm{where}\textrm{i} = 1\textrm{to}4) = [\textrm{x}_{\textrm{wi}}\textrm{y}_{\textrm{wi}}\varphi_{\textrm{wi}}]^{\textrm{T}}\end{equation}
The rotational speed of each wheel around its hub is represented by
 $\begin{array}{c} .\\ \theta \textrm{ix} \end{array}$
, while the roller’s angular velocity is denoted by
 $\begin{array}{c} .\\ \theta \textrm{ir} \end{array}$
, and the angular velocity of the wheel at the point of contact with the ground is given by
 $\begin{array}{c} .\\ \theta \textrm{iz} \end{array}$
. Additionally, the wheel radius is represented by Ri, and the roller slope angle for each wheel is denoted by ψi (i = 1 to 4). The radius of the roller is symbolized by ref. [Reference Adamov and Saypulaev44]. Based on these parameters, the motion vector of the AGV can be formulated as described in ref. [Reference Abdelrahim, Hassan, Ojo, Hosny, Ammar and El-Samanty45].
 \begin{equation}\dot{\mathbf{P}}_{wi}=\left[\begin{array}{c} \dot{x}_{wi}\\ \dot{y}_{wi}\\ \dot{\phi }_{wi} \end{array}\right]=\left[\begin{array}{c@{\quad}c@{\quad}c} 0 & r\!\sin\!\left(\psi _{i}\right) & 0\\ R_{i} & -r\!\cos\!\left(\psi _{i}\right) & 0\\ 0 & 0 & 1 \end{array}\right]\left[\begin{array}{c} \dot{\theta }_{ix}\\ \dot{\theta }_{ir}\\ \dot{\theta }_{iz} \end{array}\right]\end{equation}
 \begin{equation}\mathbf{T}_{\mathbf{wi}}^{\mathbf{r}}=\left[\begin{array}{c@{\quad}c@{\quad}c} \cos\!(\phi _{wi}^{r}) & -\sin\!(\phi _{wi}^{r}) & d_{wiy}^{r}\\ \sin\!(\phi _{wi}^{r}) & \cos\!(\phi _{wi}^{r}) & d_{wix}^{r}\\ 0 & 0 & 1 \end{array}\right]\end{equation}
Equations show the rotational angle of Owi w.r.t. Or and is represented by
 $\phi _{wi}^{r}$
(i = 1 to 4). Additionally, the translational distance between the two coordinate frames is denoted by
 $d_{wix}^{r}$
and
 $d_{wiy}^{r}$
, which define the displacement along the x and y axes, respectively. Suppose the position vector of the AGV in the Or coordinate frame is given by Pr = [xr yr φr]T. In this case, the equation connecting Pr and Pwi can be given as Pr =
 $T_{wi}^{r}$
.Pwi. Additionally, as shown in Figure 2, it is evident that
 $\phi _{w1}^{r} = \phi _{w2}^{r}=\phi _{w3}^{r}=\phi _{w4}^{r}=0$
. Based on these conditions, the AGV’s vector of velocity is presented as follows:
 \begin{equation}\left[\begin{array}{c} \dot{x}_{r}\\ \dot{y}_{r}\\ \dot{\phi }_{r} \end{array}\right]=\left[\begin{array}{c@{\quad}c@{\quad}c} 1 & 0 & d_{wiy}^{r}\\ 0 & 1 & d_{wix}^{r}\\ 0 & 0 & 1 \end{array}\right]\left[\begin{array}{c} \dot{x}_{wi}\\ \dot{y}_{wi}\\ \dot{\phi }_{wi} \end{array}\right]\end{equation}
From (3.1b) and (3.1d), we get,
 \begin{equation}\dot{\mathbf{P}}_{\mathbf{r}}=\mathbf{J}_{\mathbf{i}}\dot{\mathbf{q}}_{\mathbf{i}}\end{equation}
where
 \begin{equation*} \mathbf{J}_{\mathbf{i}}\in R^{3\times 3}=\left[\begin{array}{c@{\quad}c@{\quad}c} 0 & r\!\sin\!\left(\psi _{i}\right) & d_{\text{wiy }}^{r}\\ R_{i} & -r\!\cos\!\left(\psi _{i}\right) & d_{\text{wix }}^{r}\\ 0 & 0 & 1 \end{array}\right] \end{equation*}
The ith wheel’s Jacobian matrix is represented as
 $\mathbf{J}_{\mathbf{i}}$
and,
 $\dot{q}_{i}=[\begin{array}{c@{\quad}c@{\quad}c} \theta _{ix} & \theta _{ir} & \theta _{iz} \end{array}]$
.
AGV dynamics on a flat surface can be calculated using the Newton–Euler method. To simplify the computation of the equation of motion, the coordinate frame Or is assumed to lie at the AGV’s center of gravity, as this optimizes computational efficiency. The AGV’s mass matrix is denoted by Mm.
 \begin{equation}\textrm{S}_{\textrm{q}}=\left[\begin{array}{c@{\quad}c} x_{q} & y_{q} \end{array}\right]^{T}\end{equation}
 $\textrm{S}_{\textrm{q}}$
is the vector showing the position in a frame with fixed coordinate “Oq” as in ref. [Reference Chaichumporn, Ketthong, Thi Mai, Hashikura, Kamal and Murakami46].
 \begin{equation}\textrm{F}_{\textrm{q}}=\left[\begin{array}{c@{\quad}c} F_{qx} & F_{qy} \end{array}\right]^{T}\end{equation}
 $\textrm{F}_{\textrm{q}}$
is the vector showing the force in a frame with fixed coordinate “Oq” as in ref. [Reference Chaichumporn, Ketthong, Thi Mai, Hashikura, Kamal and Murakami46].
When the second law of Newton is applied, the equation of motion of the AGV (shown in Figure 2) in the coordinate frame Oq can be represented as in ref. [Reference Xu, Yu, Wang, Qi and Lu47]:
 \begin{equation}\textrm{F}_{\textrm{q}}=\textrm{M}_{m}\ddot{\textrm{S}}_{q}\end{equation}
 \begin{equation}\left[\begin{array}{c} F_{qx}\\ F_{qy} \end{array}\right]=\left[\begin{array}{c@{\quad}c} M & 0\\ 0 & M \end{array}\right]\left[\begin{array}{c} \ddot{x}_{q}\\ \ddot{y}_{q} \end{array}\right]\end{equation}
 \begin{equation}\textrm{if},{}^{\textrm{q}}{\textrm{R}_{\textrm{r}}}\left( \varphi \right) = \left[ {\begin{array}{*{20}{c}} {\cos\!\left( \phi \right)}&{ -\!\sin\!\left( \phi \right)} \\ {\sin\!\left( \phi \right)}&{\cos\!\left( \phi \right)} \end{array}} \right]\end{equation}
where
 $^{\textrm{q}}\textrm{R}_{\textrm{r}}(\varphi )$
is the matrix that represents the transformation of Or w.r.t Oq; therefore,
 \begin{equation}{\dot{\textrm{S}}_{\textrm{q}}}{ = ^{\textrm{q}}}{\textrm{R}_{\textrm{r}}}\left( \varphi \right){\dot{\textrm{S}}_{\textrm{r}}}\textrm{and}{\textrm{F}_{\textrm{q}}}{ = ^{\textrm{q}}}{\textrm{R}_{\textrm{r}}}\left( \varphi \right){\textrm{F}_{\textrm{r}}} \end{equation}
Eq. (3.1h) can be simplified by using the transformation matrix as follows:
 \begin{equation}\textrm{M}_{\textrm{m}}\left({}^{\textrm{q}}\textrm{R}_{\textrm{r}}\left(\varphi \right)\ddot{\textrm{S}}_{\textrm{r}}+^{\textrm{q}}\textrm{R}_{\textrm{r}}\left(\dot{\varphi }\right)\dot{\textrm{S}}_{\textrm{r}}\right)=^{\textrm{q}}\textrm{R}_{\textrm{r}}\left(\varphi \right)\textrm{F}_{\textrm{r}}\end{equation}
Multiply both sides by
 $^{\textrm{q}}\textrm{R}_{\textrm{r}}(\varphi)^{-1}$
gives,
 \begin{equation}\textrm{M}_{\textrm{m}}({}^{\textrm{q}}\textrm{R}_{\textrm{r}}(\varphi)^{-1}\, {}^{\textrm{q}}\textrm{R}_{\textrm{r}}(\varphi)\ddot{\textrm{S}}_{\textrm{r}}+{}^{\textrm{q}}\textrm{R}_{\textrm{r}}(\varphi)^{-1}{}^{\textrm{q}}\textrm{R}_{\textrm{r}}(\dot{\varphi})\dot{\textrm{S}}_{\textrm{r}}) = {}^{\textrm{q}}\textrm{R}_{\textrm{r}}(\varphi)^{-1}{}^{\textrm{q}}\textrm{R}_{\textrm{r}}(\varphi)\textrm{F}_{\textrm{r}}\end{equation}
Since
 ${}^{\textrm{q}}\textrm{R}_{\textrm{r}}(\varphi) = {}^{\textrm{q}}\textrm{R}_{\textrm{r}}(\varphi)^{\textrm{T}}, {}^{\textrm{q}}\textrm{R}_{\textrm{r}}(\varphi)^{-1}\,{}^{\textrm{q}}\textrm{R}_{\textrm{r}}(\dot{\varphi}) = \dot{\varphi}\left[\begin{array}{c@{\quad}c} 0 & -1 \\ 1 & 0\end{array} \right]$
. Therefore,
 \begin{equation}\left[\begin{array}{c@{\quad}c} M & 0\\ 0 & M \end{array}\right]\left[\begin{array}{c} \ddot{x}_{r}-\dot{\phi }\dot{y}_{r}\\ \ddot{y}_{r}+\dot{\phi }\dot{x}_{r} \end{array}\right]=\left[\begin{array}{c} F_{xr}\\ F_{yr} \end{array}\right]-\left[\begin{array}{c} \beta _{x}\dot{x}_{r}\\ \beta _{y}\dot{y}_{r} \end{array}\right]+\left[\begin{array}{c} -F_{ex}\cos\!\left(\psi _{ex}\right)\\ F_{ex}\sin\!\left(\psi _{ex}\right) \end{array}\right]\end{equation}
In the context of this equation, the symbol Fxr is used to represent the total force that is doing its work in the x direction, and the symbol Fyr is used to represent the total force that is doing its work in the y direction. The βx is the coefficient of linear friction along the x-axis, and βy is the coefficient of linear friction along the y-axis. The body of the AGV is being subjected to the influence of an external force at a distance (h) from the upper edge of the AGV, as in Figure 2. In this context, the symbol Fex is used to denote this force. The force Fex is situated at an angle of ψex w.r.t. yr. Consider that τ, Iq, and βz represent the AGV’s center of gravity moment, inertia moment, and linear friction coefficient in the z-direction, as described in ref. [Reference Chang and Lin48]. The Euler equation can be represented in the following fashion by making use of the free body model, which is depicted in Figure 2.
 \begin{equation}I_{q}\ddot{\phi }=\tau -\beta _{z}\dot{\phi }+F_{ex}\cos\!\left(\psi _{ex}\right)a-F_{ex}\sin\!\left(\psi _{ex}\right)\left(b-h\right)\end{equation}
If the dynamics of the motor that is coupled to each wheel are taken into consideration, the driving force Fdi (where i = 1 to 4) that is produced by the DC motor can be stated in the following manner, as in ref. [Reference Atlantis, Bechlioulis, Karras, Fourlas and Kyriakopoulos49]:
 \begin{equation}F_{di}\left(\textrm{where}i=1||4\right)=\alpha u_{i}-\beta R\dot{\theta }_{i}\end{equation}
The input voltage that is applied to each motor is denoted by ui (where i = 1 to 4). The motor coefficients, denoted by α and β, are computed by employing the following formulas as in ref. [Reference Atlantis, Bechlioulis, Karras, Fourlas and Kyriakopoulos49]:
 \begin{equation}\alpha =\frac{k_{\tau }}{RR_{a}}\end{equation}
 \begin{equation}\beta =\frac{k_{\tau }k_{e}n}{R^{2}R_{a}}\end{equation}
The torque coefficient of the motor is shown by the symbol kτ, the gear ratio is indicated by n, the armature resistance is indicated by Ra, and the back emf coefficient is indicated by ke in Eqs. (3.1q) and (3.1r).
Based on the free body diagram (FBD) in Figure 2, the elements Fxr, Fyr, and τ are represented in terms of driving force, respectively, as in ref. [Reference Zhang and Liu-Henke50].
 \begin{equation}F_{xr}=\frac{1}{2}\left(-F_{d1}+F_{d2}-F_{d3}+F_{d4}\right)\end{equation}
 \begin{equation}F_{yr}=\frac{1}{2}\left(F_{d1}+F_{d2}+F_{d3}+F_{d4}\right)\end{equation}
 \begin{equation}\tau =\frac{a}{2}\left(F_{d1}-F_{d2}-F_{d3}+F_{d4}\right)+\frac{b}{2}\left(F_{d1}-F_{d2}-F_{d3}+F_{d4}\right)\end{equation}
For efficient route planning and real-time obstacle avoidance, a mecanum wheel AGV must precisely manage its revolutions per minute (rpm) and wheel velocities to perform linear and angular motions in varied surroundings, as determined by the above equations. These movements enable the AGV to avoid obstacles and navigate complex terrains with precision. Omnidirectional mobility requires wheel speed control to allow the AGV to travel forward, backward, sideways, and diagonally without changing orientation. Static and dynamic control equations optimize AGV performance by ensuring efficient motion planning, stability, and responsiveness in both organized and unstructured situations. To validate the kinematic and dynamic equations governing the motion of the mecanum wheel AGV, we conducted MATLAB-based simulations to generate and analyze various trajectories, including circular, elliptical, triangular, tetragonal, lemniscate, and five-petal rose curves. These trajectories serve as benchmarks to assess the AGV’s ability to execute precise path-following while maintaining stable motion control. Figure 3 shows the AGV testing simulations based on the equations.
AGV testing simulations based on the equations: a) circular trajectory, b) elliptical trajectory, c) triangular trajectory, d) tetragonal trajectory, e) lemniscate trajectory, and f) five-petal rose curve.

An illustration of the MA* algorithm.

Simulation results of the MA* algorithm.

4. Modified A* and dynamic window approach evolutionary algorithms
4.1. Modified A* algorithm
The modified A* (MA*) method enhances the traditional A* algorithm by optimizing path searching in dynamic environments. MA* is ideal for real-world settings with constant changes because it incorporates dynamic obstacles, real-time updates, and grid structures, whereas A* utilizes heuristics to determine the shortest path. For reliable and effective AGV path planning, MA* combines BFS with Dijkstra’s global search [Reference Bhargava, Singholi and Suhaib51]. It evaluates nodes one after the other, choosing the next node based on the lowest f(n) as f(n) = g(n) + h(n), where n is the number of nodes, g(n) is the starting cost, and h(n) is the goal heuristic cost [Reference Le, Prabakaran, Sivanantham and Mohan52–Reference Xiang, Lin, Ouyang and Huang54]:
 \begin{equation}\left.\begin{array}{c} g\left(n\right)=\sqrt{\left(y_{s}-y_{n}\right)^{2}+\left(z_{s}-z_{n}\right)^{2}}\\ h\left(n\right)=\sqrt{\left(y_{n}-y_{t}\right)^{2}+\left(z_{n}-z_{t}\right)^{2}} \end{array}\right\}\end{equation}
The start, current, and target node positions are shown by (ys, zs), (yn, zn), and (yt, zt), respectively. In complex scenarios, the MA* algorithm employs an eight-directional analysis on a raster map to ensure accurate and collision-free route planning. Figure 4 shows the illustration of the MA* algorithm. Figure 5 shows the Simulation results of the MA* algorithm.
4.2. Dynamic window approach
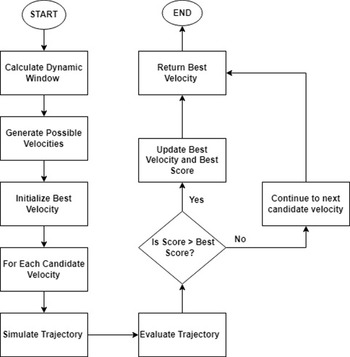
The DWA is a well-liked method for AGVs to use when navigating locally and overcoming obstacles. Analyzing and selecting the appropriate motion commands allows real-time navigation in changing environments. The DWA calculates a dynamic window to estimate linear and angular velocities based on the AGV’s physical limits and current state. The AGV trajectory is simulated for each conceivable velocity generated inside this window for a short time [Reference Bhargava, Suhaib and Singholi55–Reference Ju, Luo and Yan57]. A scoring system that balances safety and efficiency evaluates these trajectories, considering target proximity and obstacle avoidance variables. The trajectory with the highest rating is chosen by the velocity that best achieves the goal without colliding. The operation is repeated once the AGV moves at the set velocity [Reference Xinyi, Yichen, Liang and Linlin58]. Rapid velocity optimization ensures safe and agile navigation in complex and dynamic locations in the DWA.
The initial nodes on the DWA model result in “Calculate Dynamic Window.” A time step, the vehicle’s present condition, and limitations are used to calculate a range of possible velocities. “Generate Possible Velocities” generates a list of potential velocities inside the dynamic window. The approach creates candidate velocities before initializing the best velocity to set optimal velocity and score starting points [Reference Guo, Zhang, Zhao, Liu and Liu59]. The program simulates the trajectory and predicts the AGV’s path for each candidate velocity and time step. After trajectory simulation, the algorithm scores each trajectory based on how successfully it avoids obstacles and approaches the goal [Reference Xinyi, Yichen, Liang and Linlin58]. The system evaluates whether the current score surpasses the best-recorded score at each decision point. If it does, the best velocity and score are updated accordingly; otherwise, the system assesses the next candidate’s velocity. After evaluating all candidate velocities, the algorithm returns the best velocity and reaches the end node, completing DWA [Reference Li, Hao, Zhao, Lu and Ghadiri Nejad60]. The flowchart in Figure 6 shows how DWA chooses an AGV’s ideal velocity based on its dynamic environment and goal. Figure 7 shows the MATLAB simulation results of the DWA algorithm.
Flowchart for DWA.

MATLAB simulation results of the DWA algorithm in a 10 by 10 (in decimeters) raster map.

4.3. Modified A*-DWA hybrid optimization algorithm
The modified A*-DWA hybrid optimization algorithm (ADWA-HO) algorithm, which avoids local barriers in real-time while utilizing global routing, is one of the highly successful control methods for mecanum wheel AGVs. Using the AGV’s omnidirectional movement capabilities to their fullest, A* and DWA algorithms enable efficient, safe, and smooth navigation in complex and dynamic settings. The ADWA-HO methodology has several benefits over other algorithms.
By employing a MA* algorithm that eliminates unnecessary nodes and smooths trajectories, the ADWA-HO algorithm provides an optimized approach to global path planning, generating smoother paths than D* [Reference Piemngam, Nilkhamhang and Bunnun61]. To ensure a more adaptable response to dynamic situations, ADWA-HO integrates DWA for real-time obstacle avoidance, rather than relying on APF or alternative algorithms that are susceptible to local minima [Reference Chivarov, Yovkov, Chivarov, Stoev and Chikurtev62]. ADWA-HO balances global efficiency and local responsiveness, unlike DWA, which merely focuses on local obstacle avoidance [Reference Gao, Han, Feng, Wang, Meng and Yang63]. Compared to PRM & RRT, which have difficulty making real-time adjustments in highly variable environments, its flexible path refinement achieved via the combination of MA* and DWA offers better adaptability [Reference Xu, Tian, He and Huang64]. In contrast to D* and PRM & DWA fusion, which frequently generate jerky pathways, the algorithm improves smoothness and stability by preventing sudden directional shifts, making it more suitable for mecanum wheel AGVs [Reference Xu, Tian, He and Huang64]. Furthermore, in complex situations where PRM & RRT fusion, as well as PRM & DWA fusion, were unable to handle dynamic changes successfully, ADWA-HO exhibits higher flexibility [Reference Xu, Tian, He and Huang64]. Compared to techniques like D*, APF, DWA, PRM & RRT fusion, as well as PRM & DWA fusion, ADWA-HO guarantees more accurate and effective navigation by harnessing the full omnidirectional capability of mecanum wheels. The algorithm provides durable and trustworthy solutions for comprehensive AGV control systems while avoiding common failures, such as RRT’s inefficiency in high-dimensional environments and APF’s local minima issues [Reference Fu65]. The MA* technique avoids fixed barriers and finds a relatively straightforward route from the starting point to the end point for global route planning. The DWA optimizes local routes and dynamically adjusts the AGV’s trajectory in real time to steer clear of shifting obstructions and follow kinematic limits [Reference Liang, Tan, Wei, Zhang, Wang and Huang66]. MA* produces a globally optimal strategy, while DWA ensures obstacle avoidance and local adaptability. If the DWA hits a significant barrier not in the initial MA* path, the system replans the global path from the AGV’s location [Reference Bhargava, Suhaib and Singholi67]. This hybrid technique gives the AGV the durability and flexibility to navigate complex environments. Figure 8 illustrates the flowchart of the hybrid algorithm.
Modified A* and DWA hybrid optimization algorithm (ADWA-HO).

The ADWA-HO combines global path planning with local trajectory optimization for AGVs. The process begins with the initialization of the AGV’s state, including its position (x0,y0), velocity v0, and heading θ0, along with the current node position (xn,yn), and the goal position (xgoal,ygoal). The key parameters, such as maximum velocity (vmax), maximum acceleration (amax), and heading change limits, are set, and the heuristic for the A* algorithm is defined as the Euclidean distance:
 \begin{equation}h\left(n\right)=\sqrt{\left(x_{\textrm{goal }}-x_{n}\right)^{2}+\left(y_{\textrm{goal}}-y_{n}\right)^{2}}\end{equation}
The MA* algorithm then utilizes open and closed lists to determine the optimal route from the start to the end, where the total cost, f(n) = g(n) + h (n), is minimized. Algorithmically, the node with the smallest “f(n)” is selected from the open list and expanded by assessing its neighbors. For each neighbor, the tentative cost “gtentative” is calculated as in ref. [Reference Zhou, Yi, Zhang, Chen, Yang, Han and Zhang16]:
 \begin{equation}g_{\text{tentative }}=g\left(\textrm{current}\right)+\textrm{cost}\left(\textrm{current},\textrm{neighbor}\right)\end{equation}
MATLAB simulation testing results of the ADWA-HO algorithm in 21 × 21 raster Map 1 (in decimeters).

Global and local path planning of simulation in a 21 × 21 raster Map 1 (in decimeters).

Variation in linear velocity (m/s) and angular velocity (rad/s) of the simulation in raster Map 1.

Variation in posture angle (rad) of simulation in raster Map 1.

Real-time testing environment of 21 × 21 Map 1 (in decimeters), that is, 210 cm × 210 cm.

Posture angle (rad) variation in Map 1.

The variation in linear velocity (m/s) and angular velocity (rad/s) in Map 1.

Here, g(current) is the cost from the start node to the current node, and cost (current, neighbor) is the cost to move from the current node to the neighbor. If “gtentative” is less than “g(neighbor),” update the neighbor’s cost and include it in the open list. Parent pointers are used to trace backward from the target to the beginning or start node once the path has reached the goal node. Once the goal is accomplished, parent pointers are traced to recreate the path. The A* path is divided into intermediate waypoints, which serve as sub-goals for the DWA. The DWA optimizes the local trajectory by calculating a dynamic window of feasible velocities Vd =[vmin,vmax] and headings ωd=[ωmin,ωmax] as in ref. [Reference Wani, Nasiruddin, Khatoon, Shahid, Malik, Mishra, Sood, García Márquez and Ustun68], where
 \begin{equation}\left.\begin{array}{c} v_{\textrm{min}}=v_{\text{current }}-a_{\textrm{max}}\times \Delta t\\ v_{\textrm{max}}=v_{\text{current }}+a_{\textrm{max}}\times \Delta t\\ \omega _{\textrm{min}}=\omega _{\text{current }}-\alpha _{\textrm{max}}\times \Delta t\\ \omega _{\textrm{max}}=\omega _{\text{current }}+\alpha _{\textrm{max}}\times \Delta t \end{array}\right\}\end{equation}
The minimum and maximum feasible linear velocities are denoted by vmin and vmax. The
 $v_{\text{current }}$
is the current linear velocity of the AGV and
 $a$
max is the maximum linear acceleration/deceleration of the AGV. The term Δt is the time step over which the velocity change is computed. These limits ensure that the AGV’s velocity changes are within its physical capabilities. The minimum and maximum feasible angular velocities are denoted by ωmin and ωmax. The ωcurrent is the current angular velocity of the AGV. The αmax is the maximum angular acceleration/deceleration of the AGV. For each pair of velocity v and angular velocity ω, the trajectory is predicted over a short time horizon T as in ref. [Reference Pfeiffer69]:
 \begin{equation}\left.\begin{array}{c} x\left(t\right)=x_{0}+\int _{0}^{T}v\cdot \cos\!\left(\theta \left(t\right)\right)dt\\ y\left(t\right)=y_{0}+\int _{0}^{T}v\cdot \sin\!\left(\theta \left(t\right)\right)dt\\ \theta \left(t\right)=\theta _{0}+\int _{0}^{T}\omega dt \end{array}\right\}\end{equation}
The x(t) and y(t) are the predicted positions of the AGV at time t; x
0 and y
0 are the initial positions of the AGV at time t = 0; v is the linear velocity of the AGV; θ(t) is the heading angle of the AGV at time t; and cos(θ(t)) and sin(θ(t)) are the directional components of the velocity. These equations predict the AGV’s position over time based on its velocity and heading. θ0 is the initial heading angle of the AGV at time t = 0; the AGV’s angular velocity is denoted by ω. This equation predicts the AGV’s heading over time based on its angular velocity. These limits ensure that the AGV’s heading changes are within its physical capabilities. Given the AGV’s present velocity (v) and angular velocity (ω), these equations forecast its future trajectory (position and heading) over a brief time horizon (T). The trajectory is evaluated using a cost function that includes goal-oriented cost (
 $g_{\text{cost}}$
), obstacle avoidance cost (
 $o_{\text{cost}}$
), and speed cost (
 $v_{\text{cost}}$
), as in refs. [Reference Houshyari and Sezer70,Reference Hasan, Khan, Khatoon and Sajid71]:
 \begin{equation}g_{\text{cost }}=\textrm{distance}\left(x\left(T\right),y\left(T\right),\textrm{waypoint}\right)\end{equation}
Here, g cost is the cost associated with reaching the goal or sub-goal (waypoint); x(T) and y(T) are the expected location of the time T for AGV based on the current velocity and heading; the A* algorithm’s global path is used to determine the waypoint, which is the intermediate target point (sub-goal); distance (x(T), y(T), waypoint) is the distance measured in Euclidean terms between the waypoint and the expected position (x(T) and y(T). This cost encourages the AGV to move toward the goal or sub-goal. A smaller value suggests that the predicted trajectory brings the AGV closer to the target.
 \begin{equation}o_{\text{cost }}=\sum _{\text{obstacles }}\frac{1}{\text{ distance }(x\left(t\right),y\left(t\right),\textrm{obstacle}}\end{equation}
The term o cost represents the cost associated with avoiding obstacles; the projected positions of the AGV at time t along the trajectory are denoted by x(t) and y(t); the location of an obstacle in the surroundings is referred to as an obstacle; the Euclidean distance between the obstacle and the predicted position (x(t),y(t)) is represented by the expression distance (x(t), y(t), obstacle); and ∑obstacles denotes the sum is taken over all obstacles in the environment. This cost penalizes trajectories that approach obstacles too closely. The inverse distance ensures that trajectories passing near obstacles have a higher cost, while those farther away have a lower price.
 \begin{equation}v_{\text{cost }}=v_{\textrm{max}}-v\end{equation}
vcost represents the cost associated with the AGV’s speed, vmax is the maximum allowable velocity for the AGV, and v is the current velocity of the AGV along the trajectory. This cost encourages the AGV to move at higher velocities. A lower value indicates that the AGV is moving closer to its maximum speed, which is desirable for efficiency.
The total cost is computed as:
 \begin{equation}\textrm{TotalCost}\lambda _{1}\cdot g_{\text{cost }}+\lambda _{2}\cdot 0_{\text{cost }}+\lambda _{3}\cdot v_{\text{cost }}\end{equation}
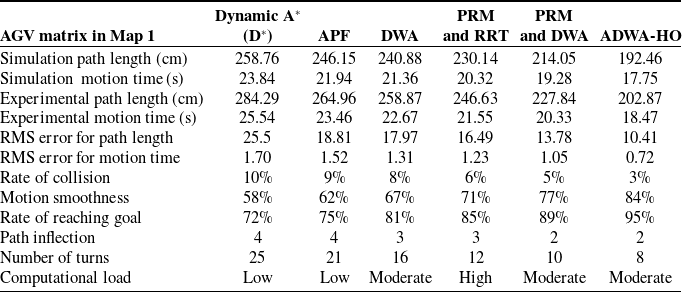
where λ1, λ2, and λ3 are weighting factors for the goal-oriented, obstacle avoidance, and speed costs, respectively. The AGV advances to the next waypoint after selecting the trajectory with the lowest overall cost. The total cost function balances the three objectives, that is, reaching the goal, avoiding obstacles, and maintaining high speed. The weights λ1, λ2, and λ3 allow the algorithm to be tuned to prioritize specific behaviors (e.g., safety over speed or vice versa). This procedure is repeated for every waypoint until the objective is accomplished or there are no more feasible routes. The A*-DWA hybrid optimization algorithm leverages the global optimality of A* and the dynamic adaptability of DWA, facilitating safe and effective navigation in complex environments. The results of the ADWA-HO algorithm’s simulation in Map 1 are displayed in Figures 9, 10, 11, and 12, while the outcomes of the experiments are shown in Figures 13, 14, and 15. Tables III–VI display the results of the simulations and experiments, respectively.
Simulation and experimental performance of each algorithm in Map 1.

Percentage deviation between experimental and simulated path lengths in Map 1.

Percentage deviation between experimental and simulated motion time in Map 1.

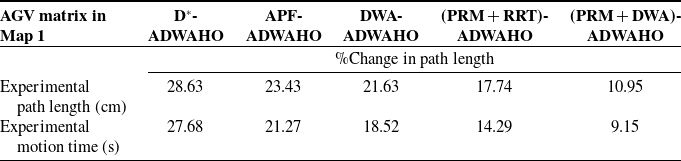
Percentage difference in experimental path length and motion time between ADWA-HO and other algorithms in Map 1.

D* works the least well. At the same time, ADWA-HO surpasses other algorithms, achieving the quickest motion time (17.75 s in simulation and 18.47 s in experiments) and shortest route (192.46 cm in simulation and 202.87 cm in experiments). In addition, ADWA-HO provides the best motion smoothness (84%), the best success rate (95%), and the smallest collision rate (3%). It also has fewer turns (8) and path inflections (2) than D*, which has more turns (4 inflections, 25 turns). These outcomes show ADWA-HO’s exceptional reliability and effectiveness in autonomously navigating. The most efficient and reliable algorithm is ADWA-HO, which reduces path inflections and turns while achieving outstanding outcomes in terms of path length, motion duration, collision rate, smoothness, and goal-reaching rate. On the other hand, D* performs the worst, exhibiting slower motion, longer paths, greater collisions, and a lower success rate. While other algorithms, such as APF, DWA, PRM & RRT fusion, and PRM & DWA fusion, perform effectively in reducing turns and inflections compared to D*, they are still moderately less effective than ADWA-HO.
Figure 16 represents the algorithms comparison based on path length and motion time in map 1 with RMS error. Figures 17 and 18 illustrate the algorithm comparison based on standard deviation and percentage deviation in path length and motion time in Map 1.
Algorithms comparison based on path length and motion time in Map 1 with RMS error.

Algorithms comparison according to standard deviation and % deviation in path length in Map 1.

Comparison of algorithms according to standard deviation and % deviation in motion time in Map 1.

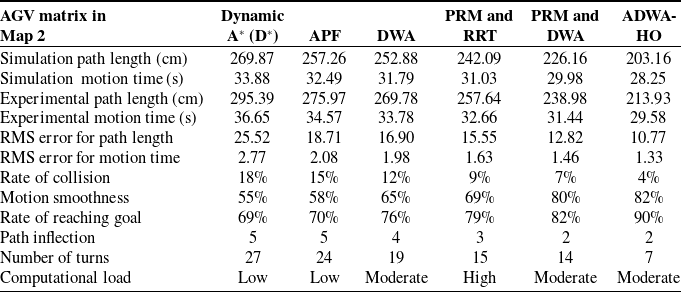
The results of the ADWA-HO algorithm’s simulation in Map 2 are presented in Figures 19, 20, 21, and 22, while Figures 23, 24, and 25 display the experimental results. Tables VII, VIII, IX, and X display the results of the simulations and experiments, respectively.
MATLAB simulation testing results of the ADWA-HO algorithm in 21 × 21 raster Map 2 (in decimeters).

Global and local path planning of simulation in 21 × 21 raster Map 2 (in decimeters).

Variation in linear velocity (m/s) and angular velocity (rad/s) of the simulation in raster Map 2.

Variation in posture angle (rad) of simulation in raster Map 2.

Real-time testing environment of 21 × 21 Map 2 (in decimeters), that is, 210 cm × 210 cm.

Posture angle (rad) variation in Map 2.

Linear velocity (m/s) and angular velocity (rad/s) variation in Map 2.

While D* shows the longest paths (269.87 cm in simulation and 295.39 cm in experiment) and the slowest times (33.88 s in simulation and 36.65 s in experiment), ADWA-HO executes better across each of the significant metrics, attaining the shortest route length (203.16 cm in simulation and 213.93 cm in experiments) and its quickest motion time (28.25 s in simulation and 29.58 s in experiments). D* has the largest collision rate (18%) and the lowest smoothness (55%), while ADWA-HO has the least collision rate (4%) and the finest motion smoothness (82%). ADWA-HO has the most successful goal-reach success rate (90%), and D* offers the lowest (69%). Furthermore, D* and APF have the greatest path inflections (5), while ADWA-HO and PRM-DWA fusion have the fewest (2). In addition, D* needs the most turns (27), whereas ADWA-HO needs the fewest (7). These outcomes demonstrate the effectiveness, precision, and reliability of ADWA-HO in autonomous navigation. The most reliable algorithm is ADWA-HO, which minimizes path inflections and turns while achieving outstanding outcomes in terms of path length, motion time, collision rate, motion smoothness, and goal-reaching rate. D* performs the worst, exhibiting slower motion, longer pathways, more collisions, and a lower success rate. Both the fusion of PRM & RRT and PRM & DWA demonstrate strong performance, particularly in minimizing path inflections and reducing the number of turns. However, they remain less efficient compared to the ADWA-HO approach.
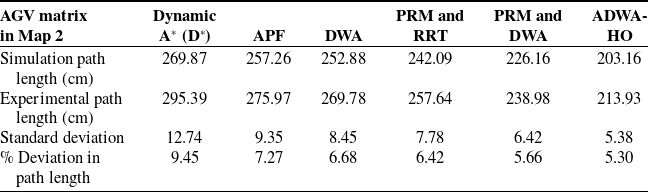
Figure 26 represents the algorithms comparison based on path length and motion time in map 2 with RMS error. Figures 27 and 28 illustrate the algorithm comparison based on standard deviation and percentage deviation in path length and motion time in Map 2.
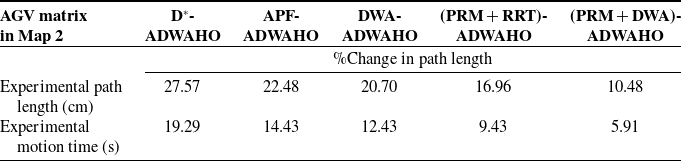
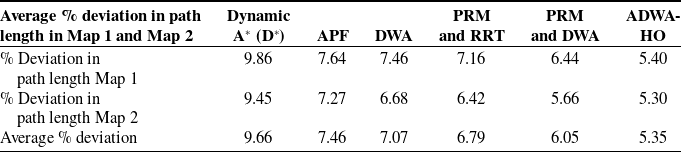
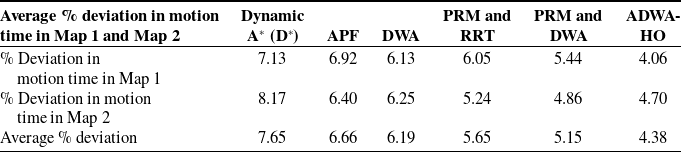
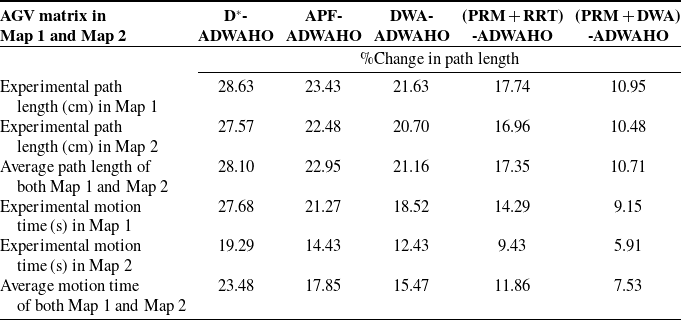
The average percentage variance in path length for Map 1 is presented in Table XI, while for Map 2, it is presented in Table XII. Table XIII compares ADWA-HO to other algorithms in Maps 1 and 2 in terms of experimental path length and percentage difference in motion time.
Simulation and experimental performance of each algorithm in Map 2.

Percentage deviation between experimental and simulated path lengths in Map 2.

Percentage deviation between experimental and simulated motion time in Map 2.

Percentage difference in experimental path length and motion time between ADWA-HO and other algorithms in Map 2.

Algorithms comparison based on path length and motion time in Map 2 with RMS error.

Algorithms comparison according to standard deviation and % deviation in path length in Map 2.

Comparison of algorithms according to standard deviation and % deviation in motion time in Map 2.

Percentage change in AGV algorithms, path length, and motion time in Maps 1 and 2.

Figure 29 represents the percentage change in AGV algorithms, path length, and motion time in map 1 and map 2. Figure 30 represents the algorithm comparison based on average percentage change in map 1 and map 2. Comparing ADWA-HO to various algorithms (D*, APF, DWA, PRM & RRT fusion, and PRM & DWA fusion) on two distinct maps, Table XIII compares the path’s length and motion period of time between ADWA-HO and other algorithms. The greatest improvement in percentage difference between ADWA-HO and other algorithms in experimental path length is seen in D* (28.63% in Map 1 and 27.57% in Map 2), while the least improvement is noted against PRM & DWA fusion (10.95% in Map 1 and 10.48% in Map 2). The greatest improvement in percentage difference between ADWA-HO and other algorithms in experimental motion time is seen in D* (27.68% in Map 1 and 19.29 % in Map 2), while the least improvement is noted against PRM & DWA fusion (9.15% in Map 1 and 5.91% in Map 2). ADWA-HO outperforms D*, APF, DWA, PRM & RRT, as well as PRM & DWA, by 28.10%, 22.95%, 21.16%, 17.35%, and 10.71% in the average path length of both maps. ADWA-HO outperforms D*, APF, DWA, PRM & RRT, and PRM & DWA by 23.48%, 17.85%, 15.47%, 11.86%, and 7.53% in the average motion time of both maps. These outcomes demonstrate how successfully ADWA-HO improved the variation in motion time and path length, making it a stronger and more well-suited navigation technique compared with alternative strategies. According to Tables III and VII, due to their simpler formulations, the D* and APF approaches require less computing power; however, they are more prone to path inflections and collisions, thereby reducing efficiency. The DWA optimizes short-range obstacle avoidance but not global path planning due to its moderate processing load from real-time velocity sample evaluation. Sample-based approaches, such as PRM and RRT, require more processing due to graph formation and random tree expansion, but they enhance path smoothness and collision avoidance. By combining global and local planning, the hybrid PRM and DWA algorithm optimizes performance and computing demand. Finally, hybrid optimization makes the suggested ADWA-HO technique more computationally intensive during startup, but once the trajectory is defined, it executes efficiently continuously. ADWA-HO outperforms other approaches in terms of path length, motion duration, smoothness, and goal-reaching rate, while maintaining an acceptable computational complexity for real-time AGV navigation.
Average % deviation in path length in Map 1 and Map 2.

Average % deviation in motion time in Map 1 and Map 2.

Comparing the experimental path length and motion time difference percentage between ADWA-HO and other algorithms in Maps 1 and 2.

5. Hardware and software structure
5.1. Hardware structure
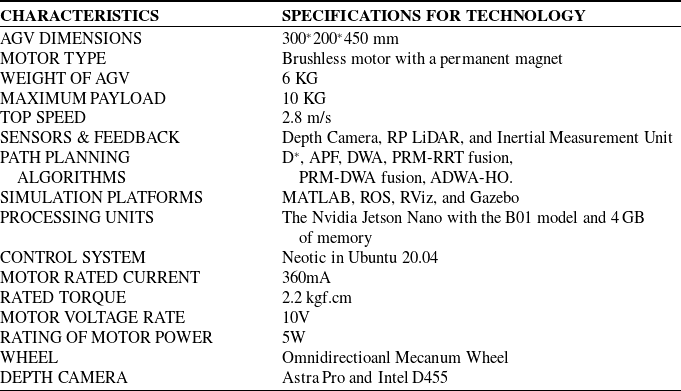
The AGV is designed using SolidWorks software and developed from a laser-cut aluminum sheet and 3D-printed mecanum wheels, as shown in Figures A1 and A2 in the appendix. An embedded computer, specifically an NVIDIA Jetson Nano board with 4 GB of LPDDR4 RAM, a quad-core ARM Cortex-A57 CPU, and a 128-core NVIDIA Maxwell GPU, powers the system within the ROS environment. It also features a 40-pin general-purpose input/output (GPIO) header, which connects to sensors, motors, and other equipment. For 360-degree detection, the AGV is equipped with a set of LiDAR sensors connected via USB, enabling it to receive laser data essential for localization and map generation [Reference Tiozzo Fasiolo, Scalera and Maset72]. An STM32 microcontroller is utilized to control the permanent magnet-brushed motors, ensuring precise movement. Additionally, depth cameras facilitate deep learning, system image recognition, and point cloud data collection, thereby enhancing the overall functionality and performance of the AGV [Reference Kang, Zhang, Ge, Liao, Huang, Wu, Yan and Chen73]. The table AI in the appendix shows the overview of software and hardware. The AGV features two LiDAR sensors, YD LiDAR TG-15 and YD LiDAR X4, for obstacle detection and distance measurement, as well as two vision sensors, an Intel depth camera D455 and an Astra Pro Plus depth camera, for object recognition and ambient awareness. Acceleration, angular velocity, and even direction are among the motion-related data that an IMU measures. By utilizing sound waves, the ultrasonic sensor determines the distance to an object to avoid it.
Algorithm comparison based on average percentage change in Maps 1 and 2.

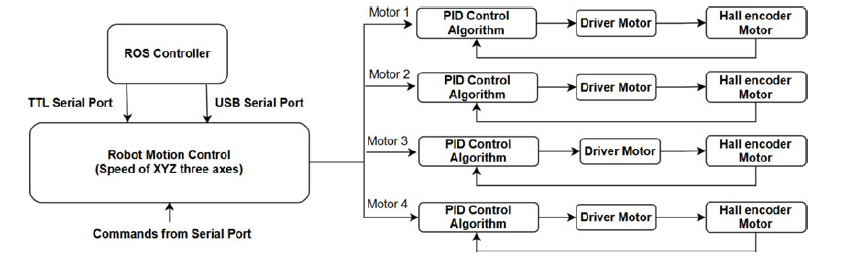
The NVIDIA Jetson Nano CPU performs complex calculations, including fusing sensor data and processing the ADWA-HO algorithm. Ultrasonic sensors provide proximity data for obstacle avoidance and safety in complex environments, while an STM32 motor controller controls mecanum wheel rotations accurately [Reference Waseem, Reddy, Rao, Suhaib and Khan74]. Vision sensors deliver high-resolution video feeds over Camera Serial Interface (CSI) ports for object detection and mapping, while LiDAR sensors transfer real-time data via specialized ports to the Jetson Nano. For close-range obstacle detection, ultrasonic sensors utilize GPIO pins, whereas the Jetson Nano employs a universal asynchronous receiver/transmitter (UART) to operate and provide feedback to the STM32 motor controller. The hardware system wiring diagram and flowchart of the motor control process are shown in Figures A3 and A4 in the appendix, respectively. The AGV’s integrated design enables it to navigate, locate, and avoid collisions accurately in various experimental settings due to its omnidirectional capabilities. The concept emphasizes indoor, well-lit workplaces for human–AGV collaboration. Outdoor applications present distinct challenges, but the technology has considerable potential for extension and use in human–AGV collaborative scenarios beyond interior environments to enhance data quality. Today, humans and AGVs must cooperate closely together to fulfill industrial activities, such as when a machine operator needs the AGV to collect a piece of work [Reference Hasan, Khan, Khatoon and Sajid71]. The AGV needs geometric (location), semantic (description), and search-related activities (contextual logic and algorithmic decision-making). A created map efficiently provides object-specific geometric and semantic information for contextual understanding and decision-making. This work presents a semantic and geometric map-building strategy for improving real-time human–AGV operations in industrial environments. Experimental scenarios I and II demonstrate how this method might avoid unforeseen impediments in a cooperative activity case study where the AGV switches between starting and goal positions. Experimental scenarios III test dynamic outdoor settings. Future industrial workspaces will benefit from combining this map-creation approach with human workers and AGVs for collaborative working. Figure 31 depicts the AGV control structure block diagram.
Block diagram of the AGV control structure.

5.2. Software structure
The software structure of the AGV, which operates on Ubuntu with ROS, is designed to integrate various sensors and controllers, enabling precise navigation, localization, and obstacle avoidance in both dynamic and static environments [Reference Tang, Zhou, Zhang, Liu, Liu and Ding75].
5.2.1. ROS Framework on Ubuntu
The entire software stack is powered by Ubuntu, with ROS serving as the middleware and providing crucial functions such as package management, low-level device control, device abstraction, and message passing. All hardware and algorithms are contained within ROS nodes, which exchange messages, services, and topics with one another.
Robot operating system (ROS)-based real-time environment simulation.

5.2.2 Sensor integration and data processing
ROS drivers for the LiDAR sensors publish laser scan data to topics like /scan or /lidar_points. This data is processed in real time for obstacle detection and distance measurement, which are then fed into the navigation stack for path planning and obstacle avoidance. The vision sensor’s ROS nodes stream high-resolution video feeds via the CSI ports to the Jetson Nano. These feeds are utilized for object detection and ambient mapping using deep learning models, such as YOLOv3, integrated within ROS. The processed data is published to topics such as /camera/rgb/image_raw for further use in navigation and decision-making. The ultrasonic sensors communicate with the Jetson Nano via GPIO pins, with data being processed and published on topics like /ultrasonic_data. These sensors provide close-range obstacle detection, enhancing the safety and responsiveness of the AGV in complex environments [Reference Nfaileh, Alipour, Tarvirdizadeh and Hadi76]. The ROS-based simulation is shown in Figure 32.
5.2.3 Navigation and Control
The Jetson Nano executes the ADWA-HO algorithm, as well as other algorithms, all of which are implemented as ROS nodes. The program optimizes route planning, navigation, and dynamic obstacle avoidance by combining data from LiDAR, vision, inertial measurement unit, and ultrasonic sensors. It publishes navigation commands on topics such as/cmd_vel and subscribes to topics for sensor data [Reference Javaid, Haleem, Bhardwaj, Khurana and Bhardwaj77]. Dedicated ROS nodes control the STM32 motor controller using UART. This node receives velocity commands from the Jetson Nano and then controls the mecanum wheels with the necessary motor signals. Posting motor feedback to topics like /motor feedback lets the system fine-tune commands spontaneously for accurate and smooth movement [Reference Waseem, Lakshmi, Ahmad and Suhaib78].
5.2.4 System Integration and Functionality
To process sensor data in real time and execute control orders precisely, the ROS master coordinates the communication between all ROS nodes. Using inputs from LiDAR, vision, IMU, and ultrasonic sensors, the sensor data fusion is performed by the ROS nodes on the Jetson Nano. The ADWA-HO algorithm, like other algorithms, relies on this fusion to construct a consistent map of its surroundings. With the help of ROS action servers and clients, the AGV’s navigation goals can be adjusted autonomously to adapt to new conditions. Logging and monitoring the system’s performance are made easier with ROS’s features. To ensure the AGV operates successfully in various environments, nodes can post diagnostic data that is recorded and tracked [Reference Bhargava and Kumar79–Reference Khan, Khatoon, Gaur, Abbas, Saleel and Khan80].
6. Experimental validation
AGVs with mecanum wheels utilize slanted rollers to enable omnidirectional movement (rotating, sideways, or diagonal) without requiring steering. In contrast to traditional wheels, this increases maneuverability in confined spaces. Sophisticated algorithms for intricate path planning, navigation, localization, and collision avoidance are needed to properly utilize this capability. To ensure accurate and smooth movement, navigation algorithms must be developed for optimal trajectory planning. However, to maintain efficiency and safety, path design must take into account dynamic boundaries, such as speed and acceleration limits. Motion modeling and sensors, such as wheel encoders and odometers, can be combined to provide real-time positional data, giving accurate localization. When combined, these systems enable intelligent and efficient operation in changing conditions. AGV collision avoidance algorithms must be tuned to the movement patterns and dynamics of the AGVs for safe operation. This guarantees the safety and efficiency of operations by detecting and responding to obstacles in real time. The hardware and software configuration of the AGV is described in Table AI in the appendix. The tests are conducted in an unfamiliar setting with potential static or dynamic obstacles to verify the efficacy of the recommended approach. All controlled situations are tested in a workplace, corridor, and outdoors, offering a realistic and practical setting to evaluate system performance and functionality. To illustrate the discrepancy between the reference path generated by the global path planner and the actual trajectory attained by the suggested approach, it is noteworthy that we continue to utilize the global path planner. On the other hand, the reference path did not play any part in the navigation of the AGV.
6.1 Experiment scenario I
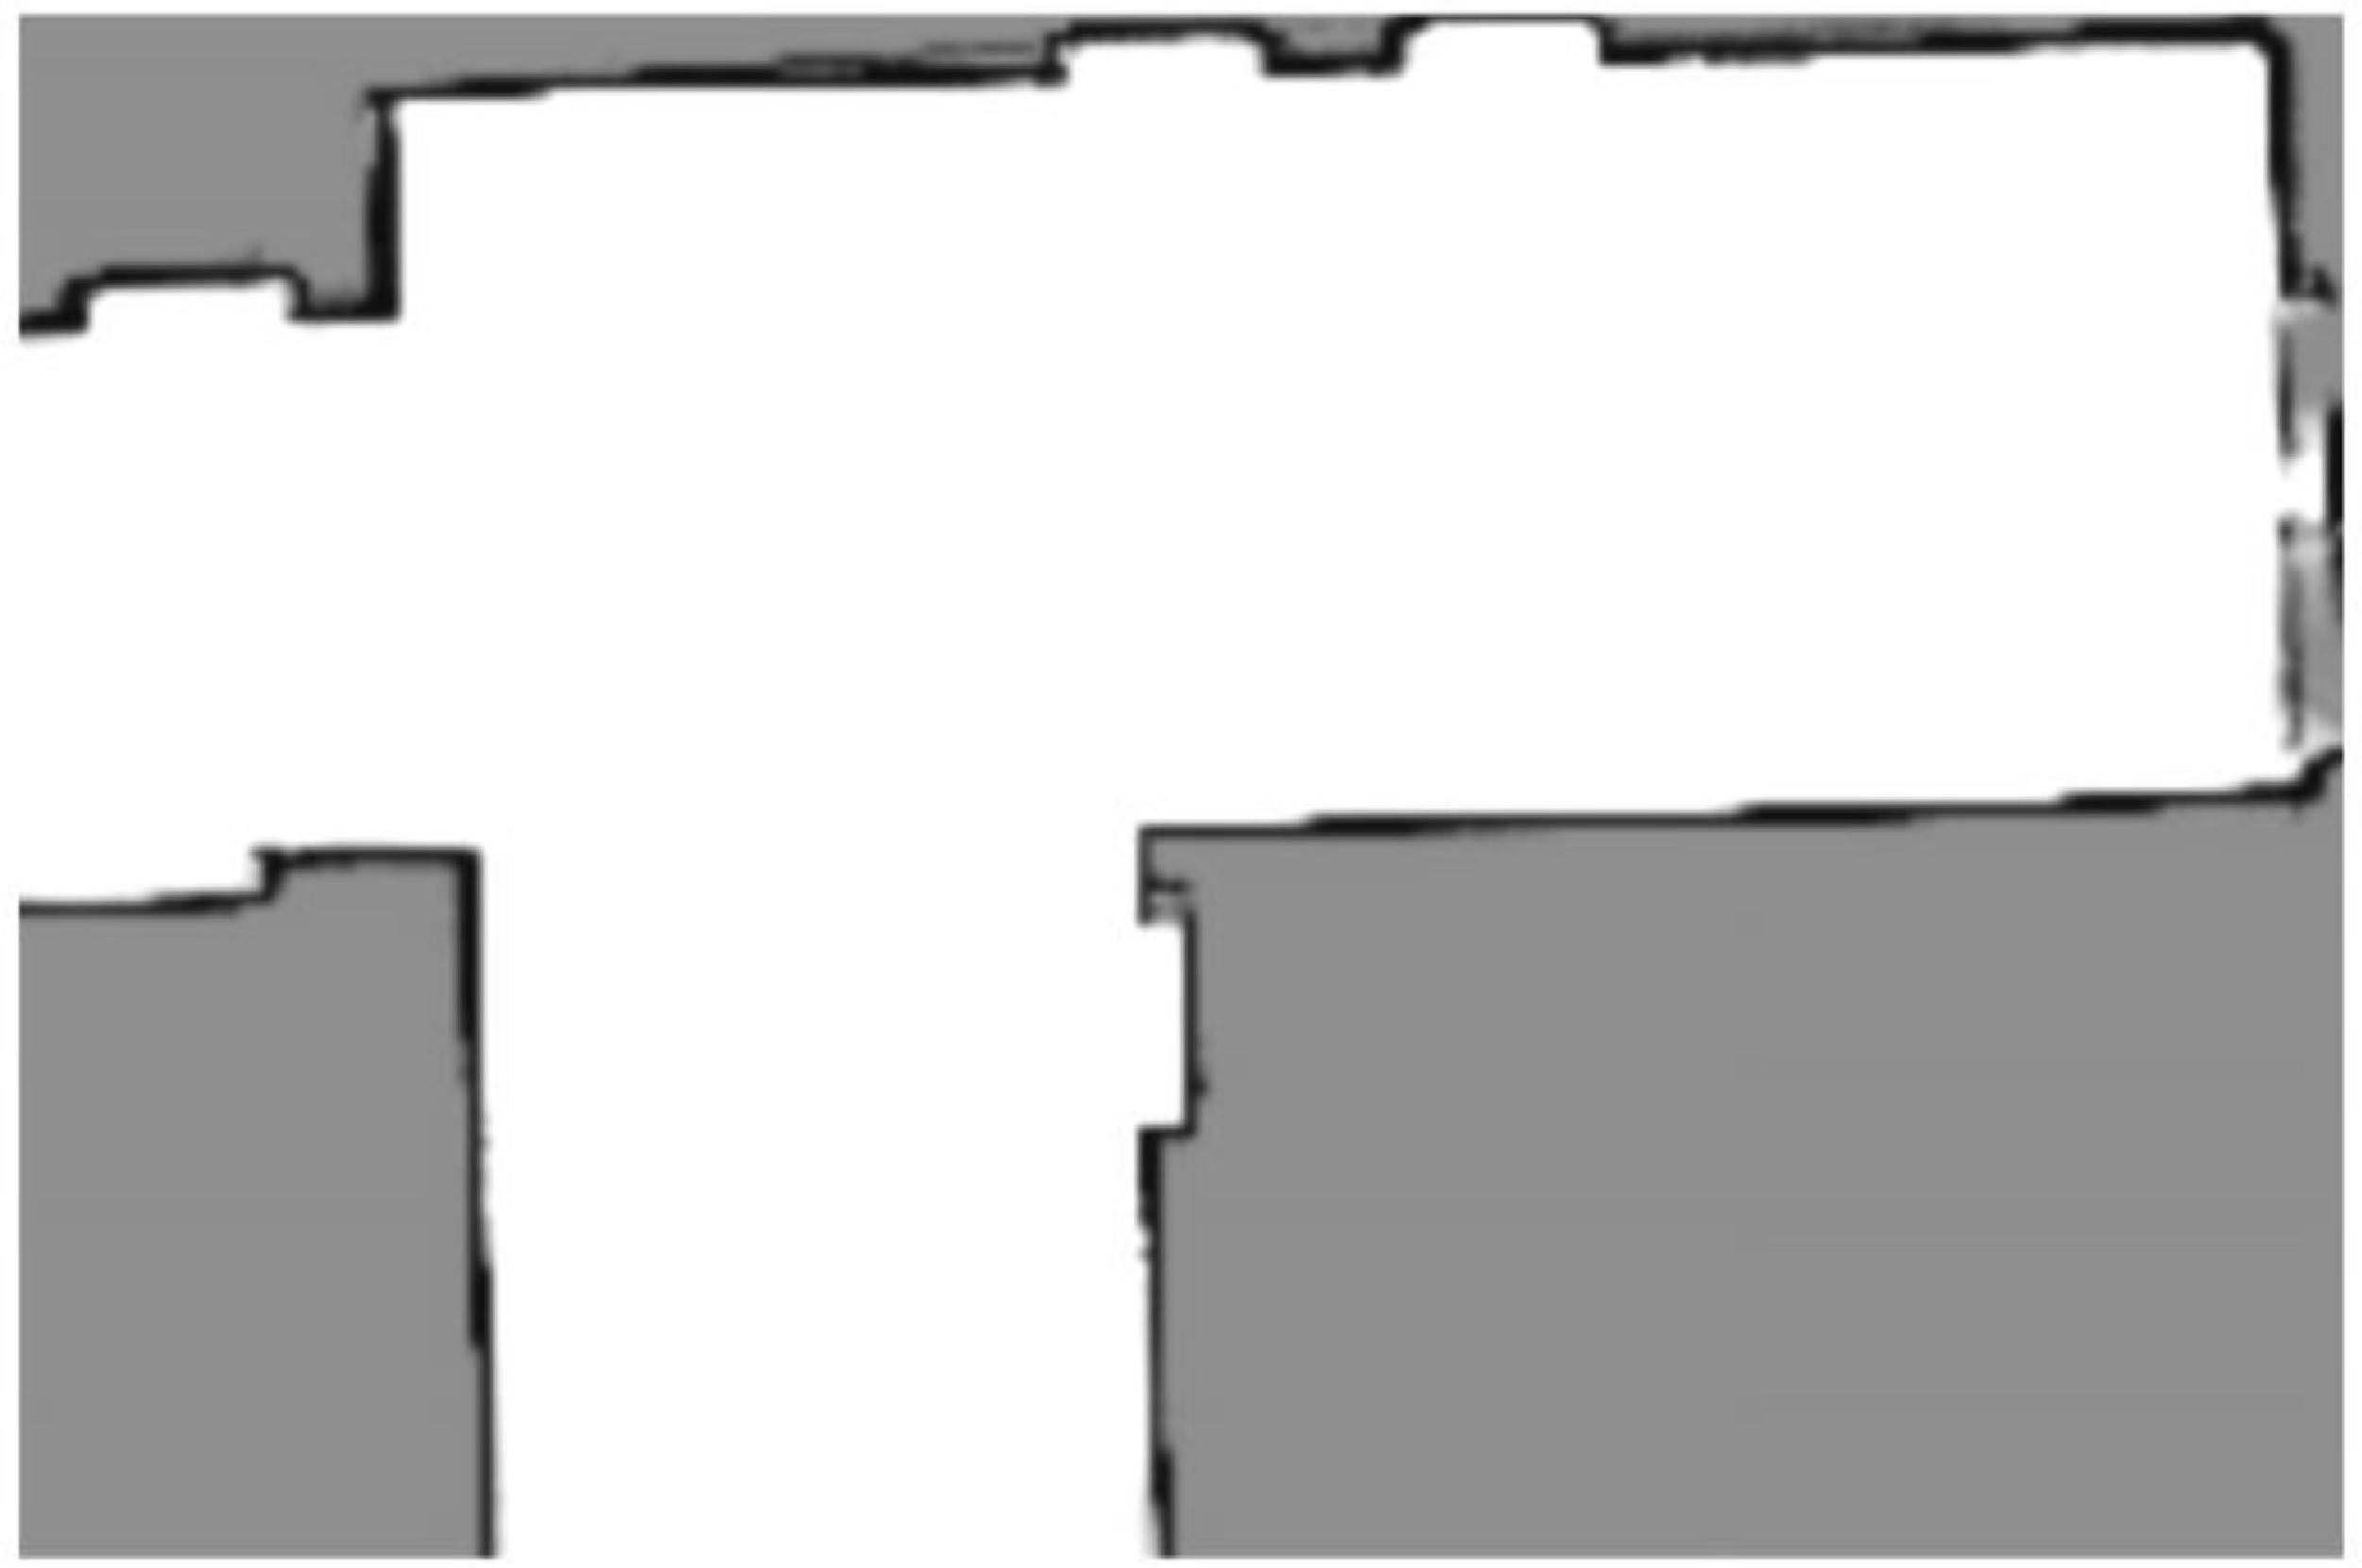
A scenario of the first experiment will be conducted in an environment with the presence of unknown static obstacles. Figure 33 depicts the original scenario’s two-dimensional map, which is free from impediments and was constructed using the SLAM technique. On the other hand, as shown in Figure 34, the actual area being navigated is filled with impediments, such as boxes and sheets. During the navigation process, the AGV is able to sense the barriers because it has no prior knowledge of them. The geographical distribution of these obstacles is designed to significantly obstruct the path of the AGV as it moves toward the destination. Figure 35 shows the actual AGV position recorded during experimental scenario I, as well as the time sequence of AGV navigation as seen in ROS RViz. This comparison demonstrates the effectiveness of the navigation system by highlighting the alignment between the simulated and actual trajectories. Figure 35a provides a visual representation of the reference path, the goal, and the starting point. Figure 35b–d depicts the movements of the AGV as it navigates around the obstacles that have been present, and Figure 35e depicts the actual trajectory that the AGV must take in order to successfully attain the goal. It can be observed that the AGV moves in a flexible manner between the obstacles, and the trajectory is considerably different from the reference path. This indicates that the suggested approach successfully led the AGV through an environment with static obstacles from the starting point to the target point.
Original map of experimental scenario I.

Actual experiment scenario I.

The process of AGV’s testing in experiment scenario I from a to e.

6.2 Experiment scenario II
The experiment’s second scenario is conducted in an environment where two little Arduino-based AGVs serve as the dynamic obstacles. It is crucial to remember that the original ADWA-HO has been significantly enhanced to improve navigation performance in dynamic environments as well. Scenario II, in which the mecanum wheel AGV’s trajectory is considerably disrupted twice by dynamic obstacles (small differential-wheeled AGVs) in its direction toward the target, will be described. Figure 36 illustrates the original scenario of the two-dimensional map, which is free from impediments and was constructed using SLAM. On the other hand, as shown in Figure 37, the actual area being navigated is filled with two small differential-wheeled AGVs. The temporal sequence of the AGV navigation, visualized in ROS RViz, and the corresponding real AGV position in experiment scenario II are depicted in Figure 38. Figure 38a provides a detailed representation of the reference path, the goal, and the starting point. Because the initial map does not contain any obstructions, the reference path leads directly to the place of interest. Figure 38b–e illustrates the actions of the AGV as it navigates around the two small moving AGVs. In the event that a small AGV prevents the large AGV from moving forward, the large AGV will move away from the small AGV (refer to Figure 38b, c). When the small AGV is a significant distance away from the large AGV (i.e., more than 0.20 m), the large AGV will begin to move in the target’s direction after dynamic obstacle avoidance, that is, the small AGV (see Figure 38). In practical terms, once a dynamic obstacle is detected within a radius of less than 0.20 m, the AGV enters a wait or detour behavior. As soon as the dynamic obstacle moves beyond this threshold, the local costmap is updated, and the AGV resumes path planning toward its target, as illustrated in Figure 38. A buffer zone is established to compensate for sensor update delays and AGV deceleration lag, thereby reducing the risk of collision with fast-approaching or unpredictable obstacles. In Figure 38e, the actual trajectory that the AGV takes when it successfully reaches the objective is depicted. As can be observed, the real trajectory of the large moving AGV is considerably distinct from the reference path. This demonstrates that the suggested method is capable of successfully navigating the AGV in a dynamic environment with two small moving AGVs as obstacles.
Original map of experimental scenario II.

Actual experiment scenario II.

The process of AGV’s testing in experiment scenario II from a to e.

6.3 Experiment scenario III
The final experiment is conducted outdoors, where the AGV must navigate between the start and goal locations while avoiding both dynamic and static obstacles in real time. Figure 39 displays a mapped environment in RViz, with the workspace denoted by defined bounds and gridlines. The working area is delineated by a hexagonal form, which changes dynamically as the AGV moves from one location to another. The AGV’s intended mapping process is shown by the green line. It illustrates how the AGV adjusts its trajectory to steer clear of obstacles as it approaches its target. The map indicates barriers that represent either stationary or moving elements of the surroundings. These are identified by the AGV’s sensors, which include depth cameras and LiDAR sensors. The AGV’s costmap can be observed by the gradation of red and blue hues surrounding obstacles. The AGV refrains from traveling through red zones, which are areas closer to obstacles and have higher costs. Safe paths are indicated by lower-cost regions, that is, blue zones. The costmap and path are constantly adjusted in real time as the AGV advances to account for environmental changes. This enables the AGV to travel quickly when encountering impediments that are stationary, moving, or have just been detected. The global plan, sensors scan, and local costmap belong to the inputs required to configure the navigation stack. Figures 40 and 41 illustrate the steps involved in testing an AGV in experiment scenario III, which includes nine static and three dynamic impediments, respectively, in an outdoor setting. They also provide a thorough depiction of the objectives, the initial point, and the path taken to attain the target.
Mapping in the outdoor environment in a) and b).

The process of AGV’s testing in experiment scenario III with static obstacles from a to c.

The process of AGV’s testing in experiment scenario III with static and dynamic obstacles from a to b.

The ADWA-HO algorithm’s real-time adaptability and efficacy were confirmed by the ROS-based outdoor AGV testing. This demonstrates its ability to adapt to both external static and dynamic situations. Using LiDAR and depth cameras, the AGV skillfully avoids both stationary and moving impediments as it moves from its starting point to its destination. With the help of the dynamically updated costmap, it selects safe routes by avoiding more expensive locations. Hexagonal gridlines enhance path planning, while RViz’s environment trajectory confirms accurate navigation. The algorithm’s resilience in real-time replanning is demonstrated by the AGV’s ability to dynamically adjust the route in response to static and moving obstructions.
Moving obstacles are identified via sensor fusion between LiDAR scans and depth images. The velocity vector and distance threshold (approximately 0.20 m) are used to classify an obstacle as dynamic. As soon as a dynamic obstacle is detected within a proximity range of less than 0.20 m, the local costmap assigns a high traversal cost to the immediate vicinity (red zones in the costmap), prompting the planner to seek alternative paths. The ADWA-HO algorithm triggers a local trajectory replanning if obstacles are predicted to intersect the current path. The AGV slows down, waits, or circumvents the obstacle based on proximity and motion trajectory. After successfully avoiding the obstacle, the AGV smoothly returns to a globally optimized path, ensuring goal convergence without significant trajectory drift. The above three figures illustrate the global costmap, sensor scans, and path adaptation (Figure 39), as well as trajectory adjustments made by the AGV to avoid nine static obstacles and account for sensor noise (Figure 40). The AGV’s local path deviations around the three dynamic obstacles, along with static obstacles, with visible smooth inflection points and avoidance maneuvers (Figure 41). This dynamic motion modeling of the obstacles and the AGV’s responsive strategy demonstrates the robustness of the ADWA-HO algorithm, validating its capability to handle unpredictable real-world navigation challenges in static and dynamic environments.
6.4 Dynamic obstacle avoidance
The AGV employs a hybrid navigation stack that integrates local and global planning to address these dynamics. While the local planner (DWA) continuously modifies the trajectory based on real-time sensor data, the global planner creates an initial path using a map of the environment. Strategies for managing dynamic obstacles include:
Real-time Detection: Continuous scanning of the environment is performed by LiDAR and depth cameras. Based on motion patterns, which are differences between successive scans, dynamic as well as static objects that have been detected are identified.
Costmap Update: Through the utilization of the ROS navigation stack, dynamic barriers can be added to the local costmap in the form of inflated high-cost zones. Because of this, the AGV is unable to choose routes that bring it close to moving impediments and therefore avoids the obstacles.
Trajectory Replanning: The AGV immediately begins the process of local trajectory replanning using DWA whenever it is anticipated that an obstacle will intersect the current path. This process involves computing velocity commands that avoid collisions while maintaining proximity to the global path.
Predictive Behavior: To anticipate future positions and adjust the path accordingly, a short-term motion prediction model is utilized for obstacles that are in motion. This model involves velocity extrapolation throughout one to two seconds.
Safety Buffering: A dynamic safety buffer is maintained around moving objects, approximately ranging from 0.15 to 0.30 m, and its size grows or decreases depending on the speed of the obstacle and its proximity.
6.5 Observed limitations
Real-world tests were conducted in various indoor and outdoor environments, as well as under different obstacle dynamics, to thoroughly evaluate the effectiveness and long-term reliability of the proposed hybrid navigation system. The AGV’s decision-making and path planning endurance was tested in unknown static barriers, dynamic interference from other AGVs, and harsh outside environments with static and dynamic variables. From every scenario, the system’s safety and collision prevention strengths, as well as stress-related behaviors such as careful maneuverability, temporary delays, and path recalculations, are revealed. The outcomes and system actions for each experimental scenario are listed below:
-
• In experiment scenario I (unknown static obstacles), the AGV occasionally exhibited minor deviations and increased lateral clearance while navigating through tightly packed static obstacles. This was due to the cautious behavior of local planners, which prioritizes safety when real-time updates show high obstacle density. In rare cases, this led to path segments that were longer than optimal, reflecting a conservative trade-off between safety and efficiency.
-
• When two little Arduino-based AGVs concurrently approached the main AGV from convergent directions in experiment scenario II (dynamic barriers), the system initiated a brief pause and replanning cycle. Although collision avoidance was maintained, this behavior caused little delay in achieving the goal. Furthermore, the replanning process occasionally produced zigzag courses when the processor recalculated the best escape routes if the dynamic AGVs suddenly changed direction or hovered nearby.
-
• Strong ambient lighting occasionally resulted in transient reflections in LiDAR returns from the shiny objects in experiment scenario III (outdoor setting with static and dynamic obstacles). This resulted in too cautious rerouting and exaggerated obstacle bounds. Additionally, because the costmap was updated frequently, short local trajectory oscillations were seen when dynamic and static barriers were grouped together. Nonetheless, the system continuously recovered and stayed clear of accidents, demonstrating the hybrid planner’s resilience.
7. Conclusion
To overcome the difficulties associated with path planning and control in omnidirectional mecanum wheel AGVs, we proposed and implemented the ADWA-HO method. Traditional algorithms, despite being effective in theory, frequently face practical challenges such as excessive turning points, redundant nodes, and longer runtimes, which restrict their efficiency in applications used within real-time environments. Through the combination of the MA* algorithm and the DWA, the ADWA-HO method enhances path planning, particularly in situations that are both static and dynamic.
-
• The ADWA-HO algorithm outperformed D*, APF, DWA, PRM & RRT fusion, and PRM & DWA fusion in average path length by 28.10%, 22.95%, 21.16%, 17.35%, and 10.71% and average motion time by 23.48%, 17.85%, 15.47%, 11.86%, and 7.53% in Map 1 and Map 2. ADWA-HO closely matches real-world conditions in maps 1 and 2, with an average path length deviation of 5.35% and motion time deviation of 4.38%. The fact that ADWA-HO has a lower standard deviation for both path length and motion time suggests that the algorithm performs continuously better compared to other algorithms.
-
• In Map 1, the RMS path length error is 10.41 cm, and the RMS motion time error is 0.72 s for ADWA-HO. In Map 2, the path length error is 10.77 cm, and the RMS motion time error is 1.33 s. The simulated and experimental results are closely correlated, demonstrating the accuracy and consistency of the ADWA-HO algorithm across various map settings.
-
• D* and APF require less computation but risk path inflections and collisions. DWA handles short-range obstacle avoidance with a moderate load but lacks global planning. PRM and RRT require higher computation for graph/tree expansion, which improves smoothness and safety. Hybrid PRM and DWA balance performance and load, while ADWA-HO achieves superior computation efficiency and accuracy with acceptable real-time complexity, as shown in Tables III and VII.
-
• With experiment scenarios I, II, and III with unknown static and dynamic barriers, ADWA-HO easily combines geometrical and semantic information for autonomous navigation and path planning. The effectiveness of the suggested approach is strongly supported by experiments utilizing AGV path planning and navigation in both static and dynamic environments, encompassing indoor and outdoor settings. These experiments confirm the proposed algorithm’s versatility in a range of real-world situations with multiple static and dynamic obstacles.
-
• The proposed hybrid AGV navigation system is resilient, adaptable, and safety-focused, as shown by real-world experiments in different and challenging circumstances. The system successfully avoided collisions and navigated safely despite unknown static obstructions, dynamic interference from other AGVs, and severe external conditions. Temporary delays, changes in trajectories, and path extensions while avoiding the obstacles were acceptable trade-offs that showed the planner prioritized safety over optimality in uncertain scenarios.
-
• The approach developed is capable of functioning in a workplace that is a coexistence of humans and robots, that is, human–robot collaboration, with the objective of producing a real-time map that incorporates semantic and geometric data.
-
• In future studies, multiple dynamic impediments will be taken into consideration during the testing process, and increasingly complicated barriers will be set up during the experiment. Future studies could use human and swarm-inspired hybrid obstacle avoidance strategies to increase the AGV’s capabilities. This could enhance the AGV’s adaptability and efficiency in challenging environments.
-
• Better human–robot collaboration may benefit from combining the recommended map construction method with generative AI models. The map will provide a baseline for scene perception, while generative AI models will enable the AGV to receive dynamic instructions, determine motions, and interact with humans.
The ADWA-HO algorithm generally improves the performance of AGV systems by offering path planning and control that is more efficient, accurate, and precise. As a result, it is ideal for deployment in environments that are both static and dynamic, as well as complex.
By following this link, anyone can access the codes and videos made for this research work: https://github.com/ankurgsb21/Omnidirectional-AGV-Control-in-static-and-dynamic-environments-using-Modified-ADWA-HO-Algorithm
Author contributions
Under the supervision of Prof. Mohammad Suhaib and Prof. Ajay K. S. Singholi, Ankur Bhargava undertakes the conceptualization, design, data collection, methodology, representation, and analysis of the study. The supervisors shared insights on how to write, edit, review, and analyze the data.
Financial support
Not applicable.
Competing interests
The authors report no conflicts of interest.
Ethical approval
Not applicable.
A. Appendix
Chassis design of the Mecanum wheel AGV.

Overall Mecanum wheel structure.

Overview of software and hardware.

Hardware system wiring diagram.

Flowchart of the motor control process.