Clays have been used widely as stabilizers of trace metals in soils in acid-mine drainage and sludges, in their natural form or after acid or thermal activation (Zorpas et al., Reference Zorpas, Constantinides, Vlyssides, Haralambous and Loizidou2000; Alvarez-Ayuso & Garcia-Sanchez, Reference Alvarez-Ayuso and Garcia-Sanchez2003; Chen et al., Reference Chen, Zhao and Wang2007; Wang et al., Reference Wang, Chen and Wang2007; Zotiadis et al., Reference Zotiadis, Argyraki and Theologou2012; Falayi & Ntuli, Reference Falayi and Ntuli2013). Their large specific surface area and layer charge are responsible for their ability to attract metal ions which may be: (1) bound onto their surfaces with ionic or covalent chemical bonds; (2) exchanged with other mobile ions present on their surface; or (3) precipitated onto the surface forming insoluble phases (O'Day & Vlassopoulos, Reference O'Day and Vlassopoulos2010).
The whole retention mechanism is termed ‘sorption’ and the clay–metal interaction is usually investigated by comparing the metal concentration in the solid phase and the liquid medium using the sorption isotherms (Limousin et al., Reference Limousin, Gaudet, Charlet, Szenknect, Barthes and Krimissa2007; Ismadji et al., Reference Ismadji, Soetaredjo and Ayucitra2015). Although the classical literature refers mainly to Langmuir and Freundlich models, recent studies have applied other isotherm models as well, such as Dubinin-Radushkevich, Sips, Redlich-Peterson, Toth, etc. (Bourliva et al., Reference Bourliva, Michailidis, Sikalidis, Filippidis and Betsiou2013; Guerra et al., Reference Guerra, Goco, Nascimento and Melo2016; Carolin et al., Reference Carolin, Kumar, Saravanan, Joshiba and Naushad2017). Generalized isotherm models are used to model multi-site or competitive adsorption. They are composed of several Langmuir-type terms, each describing a type of surface site (when sorption on several sites is described), the sorption of a specific component (in systems with several sorbates), or a single process (when sorption is the combination of various mechanisms) (Limousin et al., Reference Limousin, Gaudet, Charlet, Szenknect, Barthes and Krimissa2007). The multi-site isotherm approach has been used by several researchers in various sorbent-sorbate systems (Alvarez-Puebla et al., Reference Alvarez-Puebla, Valenzuela-Calahorro and Garrido2004b; Carmona et al., Reference Carmona, Lucas, Valverde, Velasco and Rodríguez2006; Guerra et al., Reference Guerra, Goco, Nascimento and Melo2016).
Among the clay minerals, smectite (especially montmorillonite) and palygorskite have been studied extensively for their ability to remove trace metals (Pb, Cu, Co, Ni, etc.) from aqueous monometallic and polymetallic solutions (e.g. Álvarez-Ayuso & García-Sánchez, Reference Alvarez-Ayuso and Garcia-Sanchez2003; Strawn et al., Reference Strawn, Palmer, Furnare, Goodell, Amonette and Kukkadapu2004; Potgieter et al., Reference Potgieter, Potgieter-Vermaak and Kalibantonga2006; Sheikhhosseini et al., Reference Sheikhhosseini, Shirvani and Shariatmadari2013) and numerous studies have been devoted to the understanding of adsorption mechanisms. For example, batch sorption studies regarding the Pb interactions with montmorillonite (Businelli et al., Reference Businelli, Casciari, Businelli and Gigliotti2003; Bourliva et al., Reference Bourliva, Michailidis, Sikalidis, Filippidis and Betsiou2013), or palygorskite (Chen & Wang, Reference Chen and Wang2007; Fan et al., Reference Fan, Li, Zhao, Jia, Xu and Wu2009) have shown that ion exchange and/or outer-sphere complexation are the main retention mechanisms at low pH, whereas inner-sphere complexation prevails at neutral to alkaline environments. Surface precipitation of lead carbonate onto Ca-bentonites was suggested by Strawn & Sparks (Reference Strawn and Sparks1999) and Zhang et al. (Reference Zhang, Tong, Wei and Tang2012). Also, spectroscopic investigations of Cu-bearing montmorillonite and palygorskite have revealed that the metal forms inner-sphere complexes with the octahedral Al and Mg, without excluding possible copper precipitates (Alvarez-Puebla et al., Reference Alvarez-Puebla, Aisa, Blasco, Echeverría, Mosquera and Garrido2004a; Schlegel & Manceau, Reference Schlegel and Manceau2013).
The current study focuses on natural clays rich in Fe-smectite and/or palygorskite from NW Greece. The effectiveness of Greek palygorskite as a stabilizer of trace elements in contaminated soil has previously been assessed empirically in the field and by means of laboratory experiments (Zotiadis et al., Reference Zotiadis, Argyraki and Theologou2012). The results of pilot-scale field experiments in the contaminated area of Lavrion, Greece showed that the specific type of palygorskite clay has significant sorption capacity and retention ability in relation to Pb, Zn, Ni, Cu, Sb and Mn. However, in such a complex system, involving many different metal ions, the retention mechanisms are difficult to resolve.
The present work is a follow-up of preliminary sorption results (Kypritidou et al., Reference Kypritidou, Argyraki, Chryssikos and Stamatakis2016) and focuses on the interaction processes between the clays and metal ions in monometallic, concentrated solutions of Pb and Cu. This approach has been adopted to simplify the system by controlling the number of dissolved species and gain a better insight into the metal-retention mechanisms involved. The ultimate goal of this research is to provide a basis for experimentation using natural polymetallic solutions.
A comparative laboratory study, using clays of varying mineralogical composition was set up with the following specific objectives: (1) to compare the effectiveness of Fe-Mg-rich clays containing different palygorskite/smectite amounts as metal ion sorbents; (2) to model the sorption process by applying a multi-site approach to the experimental data; and (3) to estimate the contribution of each participating mechanism (exchange, surface complexation, precipitation) to the overall retention, according to modelling results.
MATERIALS
Natural clay samples
The adsorbents used in the current study were Fe-Mg-rich clay materials consisting mainly of palygorskite and Fe-smectite from the Ventzia Basin clay deposits, Grevena (west Macedonia, Greece). The deposits are currently exploited by Geohellas S.A. and are considered to be weathering products of primary ultramafic rocks of the Vourinos complex (Kastritis & Kacandes, Reference Kastritis, Kacandes and Eliopoulos2003). Three samples with distinct mineralogical composition have been used in the present study: a purple-grey palygorskite-rich clay from the Pylori deposit (PCM), a beige smectite-rich clay from the Velanida deposit (SCM) and a light beige natural palygorskite-smectite mixture quarried from the Charami deposit (MCM). Approximately 30 kg of each field composite sample was homogenized thoroughly by manual mixing, and was piled up on the laboratory bench. Subsequently, five subsamples of each material were selected randomly and mixed to obtain 2-kg samples. These were ground in an automated laboratory ball mill (Retsch, SR200) and sieved to 60 mesh to produce laboratory samples of similar particle-size distribution which were used subsequently in the experiments.
The mineralogical characterization of the clay materials studied was based on a combination of powder X-ray diffraction (PXRD) and Fourier transform infrared spectroscopy (FTIR) data. Details were presented in a previous study (Kypritidou et al., Reference Kypritidou, Argyraki, Chryssikos and Stamatakis2016). Τhe respective XRD diagrams and FTIR spectra (with explanations), the micro-morphological characteristics observed with scanning electron microscopy and the bulk chemistry of the samples are provided in the Supplementary Material (https://doi.org/10.1180/clm.2018.12). The clay samples contain mainly palygorskite and Fe-smectite (>50%), and admixtures of quartz and serpentine (Fig. S1). Traces of dolomite were also noted in the SCM sample.
The palygorskite phase was identified in PCM and MCM samples only, and its abundance was estimated by combining XRD and FTIR data, according to Gionis et al. (Reference Gionis, Kacandes, Kastritis and Chryssikos2007) as ~70% in PCM and ~20% in MCM samples respectively. The palygorskite is fibrous (Fig. S3) and exhibits a mixed dioctahedral/trioctahedral character with a general formula (Gionis et al., Reference Gionis, Kacandes, Kastritis and Chryssikos2007; Chryssikos et al., Reference Chryssikos, Gionis, Kacandes, Stathopoulou, Suarez, Garcia-Romero and Del Rio2009; Stathopoulou et al., Reference Stathopoulou, Suarez, Garcia-Romero, Del Rio, Kacandes, Gionis and Chryssikos2011):
 $$y{\rm M}{\rm g}_{\rm 5}{\rm S}{\rm i}_{\rm 8}{\rm O}_{{\rm 20}}\left( {{\rm OH}} \right)_{\rm 2}{\rm \cdot} \left( {1 - y} \right)\left[ {x{\rm M}{\rm g}_{\rm 2}{\rm F}{\rm e}_{\rm 2}\cdot \left( {1 - x} \right){\rm M}{\rm g}_{\rm 2}{\rm A}{\rm l}_{\rm 2}} \right]{\rm S}{\rm i}_{\rm 8}{\rm O}_{{\rm 20}}\left( {{\rm OH}} \right)_{\rm 2}$$
where x is 0.41 for PCM and 0.78 for MCM, and y is 0.06 for PCM and 0.48 for MCM, respectively.
The Fe-smectite was identified in all samples and its amount was estimated by the relative intensity on XRD patterns as ~20% in PCM, ~70% in SCM, and ~40% in MCM. The phase exhibits a mixed dioctrahedral (nontronite)/trioctahedral (saponite) character (Kastritis & Kacandes, Reference Kastritis, Kacandes and Eliopoulos2003; Gionis et al., Reference Gionis, Kacandes, Kastritis and Chryssikos2006; Christidis et al., Reference Christidis, Katsiki, Pratikakis and Kacandes2010); therefore, we suggest that it is more appropriate to use the general term ‘Fe-smectite’ for the smectite content of the samples. Magnesium is the main cation present in the interlayer of the smectite (Kastritis & Kacandes, Reference Kastritis, Kacandes and Eliopoulos2003). It is also characterized by a flaky morphology which is more distinct in the SCM sample whereas in the MCM sample the flakes are connected to the palygorskite fibres (Fig. S3).
EXPERIMENTAL METHODS
Determination of the physiochemical characteristics of the samples
The cation exchange capacity (CEC, meq g–1) was determined by the ammonium acetate extraction method (Rhoades, Reference Rhoades1982). Briefly, the samples were saturated with sodium acetate (pH 8.2), washed with ethanol, and saturated again with ammonium acetate (pH = 7). The CEC was calculated by measuring the concentration of the replaced Na ions using a Jenway flame photometer. The specific surface area (SSA, m2 g–1) was measured on powdered samples by the BET method, performed by two different laboratories. The first measurement was carried out in the Laboratory of the School of Mineral Resources Engineering, Technical University of Crete using a NOVA220 device (Quantachrome) and the samples were outgassed under vacuum for at least 8 h at 140°C. The second measurement was obtained at the Laboratory of Inorganic Chemistry (Department of Chemistry, NKUA), where the samples were outgassed overnight at 80°C using a Tristar II device (Micromeritics). Nitrogen gas adsorption and desorption isotherms at –196°C were obtained and the calculation of the specific surface area was carried out using the multi-point BET method, in both procedures. The surface area presented is the average of the two measurements.
Batch potentiometric titration was carried out to determine the point of zero charge (pHPZC) of the samples. Solutions of 0.001, 0.01 and 0.1 M NaCl were prepared by dissolving appropriate amounts of analytical grade NaCl salt in double deionized water. A set of 10 aliquots of each electrolyte solution was made with adjusted pH between 3 and 10 using 0.1 M HCl or 0.1 M NaOH. The pH range was selected to minimize the dissolution of octahedral and tetrahedral functional groups that occur in extremely acidic and alkaline environments, respectively (Lazarević et al., Reference Lazarević, Janković-Častvan, Jovanović, Milonjić, Janaćković and Petrović2007). pH was measured using a bench-top pH-meter (Jenway 3040 Ion Analyzer) calibrated with buffer solutions of pH 4 and 7. After adjusting the pH, 25 mL of each electrolyte solution was added into 50 mL centrifuge tubes containing 0.1 g of solid (4 g L–1). The tubes were agitated horizontally at 300 rpm for 24 h in a thermostatic chamber set at 22°C and were subsequently centrifuged at 3000 rpm for 15 min. The supernatants were collected and the pH measured. Each sample was prepared and analysed in triplicate. Blank solutions (without solid) were also prepared for quality-control purposes. The point of zero charge was estimated by plotting the final pH of the suspensions (pHf) vs. the pH of the initial solution (pHi) for each electrolyte concentration.
Batch sorption and desorption experiments
Monometallic stock solutions of Pb and Cu (1000 mg L–1) were prepared by dissolving appropriate amounts of analytical-grade Pb(NO3)2 and Cu(NO3)2:3H2O salts in double deionized water. These solutions were diluted to obtain stock standard solutions with initial concentrations of 0–800 mg L–1. The pH was adjusted to ~3.6 by adding drops of 0.1 N HNO3, to ensure the cationic form of metal ions and to minimize the dissolution of clays. Measurements were obtained with the aforementioned bench-top pH-meter calibrated by using buffer solutions of pH 4 and 7.
The experimental conditions for the sorption experiments were selected according to previous equilibrium studies (Kypritidou et al., Reference Kypritidou, Argyraki, Chryssikos and Stamatakis2016) to optimize the results obtained. Specifically, the best reproducibility in the results has been observed for a solid/liquid ratio of 10 g L–1, a pH of 3.6 of the initial solution has been selected to ensure metal mobility and a contact time of 4 h to ascertain equilibrium. A quantity of 0.25 g of each clay material was weighed and dispersed in 25 mL of metal solution, in polyethylene centrifuge tubes, to obtain a solid/liquid ratio of 10 g L–1. The tubes were placed horizontally on an orbital shaker, to ensure thorough dispersion of the suspension, and agitated at 300 rpm for 4 h (to ensure equilibrium) at constant temperature (22°C) in a thermostatic chamber.
After 4 h, the samples were centrifuged at 3000 rpm for 15 min, the supernatants were collected and the final pH (pHe) was measured. The supernatants were stored at 4°C until analysis. The residue of centrifuged tubes was air-dried, disaggregated and used for the subsequent desorption experiments.
Desorption experiments were carried out using double deionized water and/or 0.01 M NaNO3, following previous similar work (e.g. Businelli et al., Reference Businelli, Casciari, Businelli and Gigliotti2003) in order to introduce an additional ion (Na) to the solution and to investigate possible exchange reactions in the interlayer of the clays. Desorption was studied under the same conditions as the sorption experiments (pH 3.6, solid mass 10 g L–1, shaking time of 4 h). The centrifuge tubes containing the reacted solid were first washed with 25 mL of double deionized water (pH = 5.5) and then with 0.01 M NaNO3 (pH = 7) using the procedure described above (agitation at 300 rpm for 4 h, at 22°C). The tubes were centrifuged and the supernatants after each addition were also collected and stored at 4°C. All experiments were performed in triplicate, and the average value and standard deviation were recorded for each set.
The supernatants collected were analysed for Pb and Cu using Flame Atomic Absorption Spectroscopy (F-AAS) (Perkin Elmer 1100 B). The Mg concentrations were also measured by F-AAS, to investigate the possible exchange reaction in the interlayer. All laboratory procedures and analyses were performed in the Laboratory of Economic Geology and Geochemistry of the National and Kapodistrian University of Athens.
The sorption capacity of the materials studied (q e, mg g–1) after sorption experiments was determined by the initial, C 0, and final, C s, metal concentration (mg L–1) in the solution at equilibrium using equation 1:
 $$q_{\rm e} = \left( {C_0 - C_{\rm s}} \right)\displaystyle{V \over m}$$
The amount of metal desorbed was estimated by the concentration of the metal released (C d, mg L–1) after washing with deionized water and NaNO3 (equation 2):
 $$q_{\rm d} = C_{\rm d}\displaystyle{V \over m}$$
where V = the volume of the solution (L) and m = the mass of sorbent used (g).
Sorption isotherms
The sorption of Pb and Cu was examined by fitting of the experimental data to Langmuir, Freundlich, Sips and Dubinin-Radushkevich (D-R) models (Table 1); in the literature these models are most commonly used to describe the sorption process between clay materials and inorganic sorbates (Ismadji et al., Reference Ismadji, Soetaredjo and Ayucitra2015).
Empirical isotherm models used in the current study.
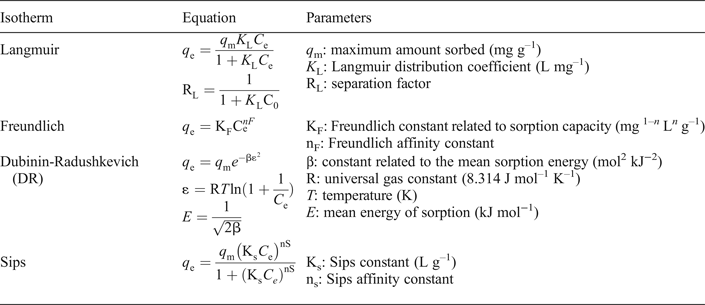
Briefly, the Langmuir model assumes a monolayer sorption on a homogenous surface with fixed, identical and equivalent sorption sites, whereas the Freundlich model characterizes a heterogeneous system with infinite binding sites. The coefficient K L is a measure of the interaction intensity between the sorbate surface and the solute molecules (Ismadji et al., Reference Ismadji, Soetaredjo and Ayucitra2015). The Langmuir separation factor RL (calculated by the coefficient K L) as well as the Freundlich exponent (nF) are used to describe the feasibility of sorption reaction, being unfavourable (RL > 1, nF > 1), linear (RL = 1, nF = 1), irreversible (RL = 0, nF = 0) or favourable (RL < 1, nF < 1) (Worch, Reference Worch2012). When studying heterogeneous systems at high sorbate concentrations, as in the current study, the Sips model is often employed: it incorporates characteristics of both the Langmuir and Freundlich models. The Ks and ns parameters are analogous to K L and nF, respectively (Ismadji et al., Reference Ismadji, Soetaredjo and Ayucitra2015). Finally, the Dubinin-Radushkevich (D-R) isotherm was employed because it allows estimation of the free energy of sorption. If E is <8 kJ mol–1, physisorption is the dominant process, whereas at 8–16 kJ mol–1, ion exchange predominates. Particle diffusion occurs at E > 16 kJ mol–1 (Argun et al., Reference Argun, Dursun, Ozdemir and Karatas2007).
Curve fitting on the experimental data was performed by linear or non-linear regression analysis using the OriginPro software package. For each isotherm model tested, the fitting procedure included the selection of appropriate model parameters to minimize the chi-square (χ2) value. Comparison between the tested models was based on the maximization of R2 (Tran et al., Reference Tran, You, Hosseini-Bandegharaei and Chao2017).
RESULTS
Physicochemical parameters of the natural clays
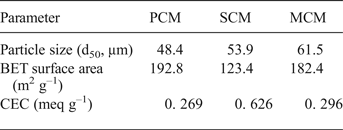
A summary of the main physicochemical characteristics of the clay materials studied is presented in Table 2. The samples exhibit almost identical specific surface areas, probably due to the intensive milling that caused a similar particle size (e.g. Vdovic et al., Reference Vdovic, Jurina, Škapin and Sondi2010). The specific surface area and CEC values of PCM are in general agreement with those found in the literature (SSA = 116–213 m2 g–1, CEC = 0.19–0.30 meq g–1) (Al-Futaisi et al., Reference Al-Futaisi, Jamrah, Al-Rawas and Al-Hanai2007; Chen & Wang, Reference Chen and Wang2007; Wang et al., Reference Wang, Liao, Zhang and Li2012; Rhouta et al., Reference Rhouta, Zatile, Bouna, Lakbita, Maury, Daoudi, Lafont, Amjoud, Senocq, Jada and Aït Aghzzaf2013). The SCM has CEC and SSA values close to those of a Brazilian nontronite (Guerra et al., Reference Guerra, Goco, Nascimento and Melo2016), which are greater than those for NAu-2 (from The Clay Minerals Society's Source Clays Repository) (Jaisi et al., Reference Jaisi, Liu, Dong, Blake and Fein2008), whereas Köster et al. (Reference Köster, Ehrlicher, Gilg, Jordan, Murad and Onnich1999) reported exchange capacities of >0.72 meq g–1 for a series of nontronites. The SSA of the mixed clay is also comparable to that of a smectite-palygorskite-bearing clay from Turkey, whereas its CEC is much smaller (SSA = 208 m2 g–1, CEC = 0.85 meq g–1 (Önal & Sarikaya, Reference Önal and Sarikaya2009)).
Summary of the physicochemical characteristics of the samples.
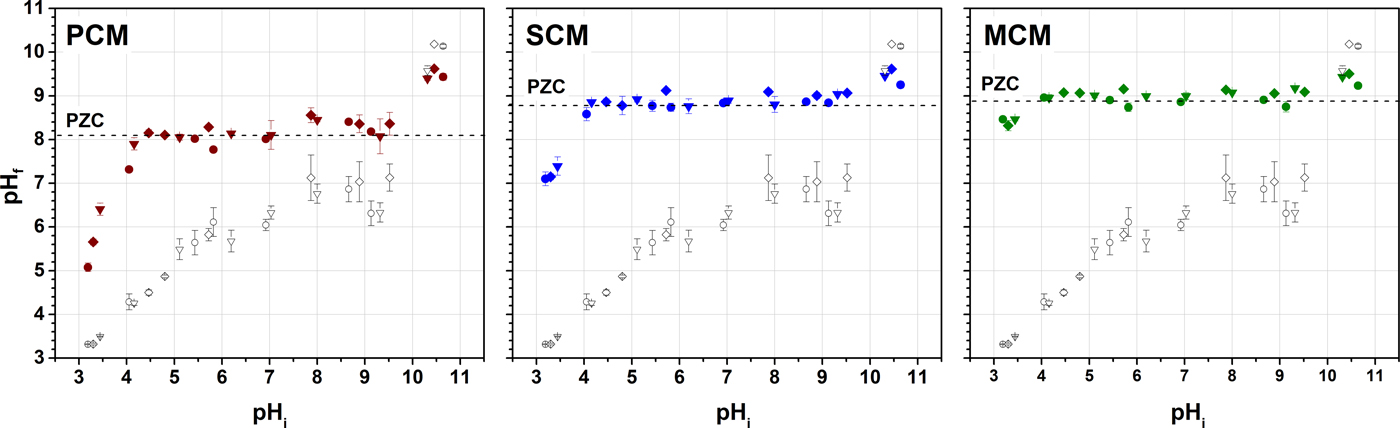
The typical plateau in the graph of pHf vs. pHi, which corresponds to the equilibrium between the protons and the clay surface and defines pHPZC, was observed at pH ~8.5 for PCM, and ~9 for SCM and MCM, respectively (Figure 1). The results are in general agreement with literature data for palygorskite (PZC = 7–11) (Pereira et al., Reference Pereira, Ferreira, Rita and Chaves2016; Rusmin et al., Reference Rusmin, Sarkar, Biswas, Churchman, Liu and Naidu2016; Acebal & Vico, Reference Acebal and Vico2017). The SCM and MCM samples studied show greater PZC values than those reported for the Brazilian nontronite (PZC ≈ 4) (Guerra et al., Reference Guerra, Goco, Nascimento and Melo2016) and NAu-2 from the Source Clays Repository (PZC = 7.2) (Jaisi et al., Reference Jaisi, Liu, Dong, Blake and Fein2008), however. The acid-base titration was conducted under atmospheric conditions, and the effect of solution buffering due to interaction with CO2 could not be avoided (Duc et al., Reference Duc, Gaboriaud and Thomas2005), as shown by the final pH value in the control solutions (Fig. 1). However, as the subsequent sorption experiments were also conducted at ambient conditions, the interaction with CO2 is considered to be crucial to the overall reactions that occurred.
Potentiometric titration curves for the three clay samples (solid symbols) and the respective control solutions (open symbols) at ionic strengths of 0.1 M (●), 0.01 M (▾) and 0.001 M (♦) NaCl, respectively.
Effectiveness of the Fe-Mg clays in removing Pb and Cu ions from aqueous solutions
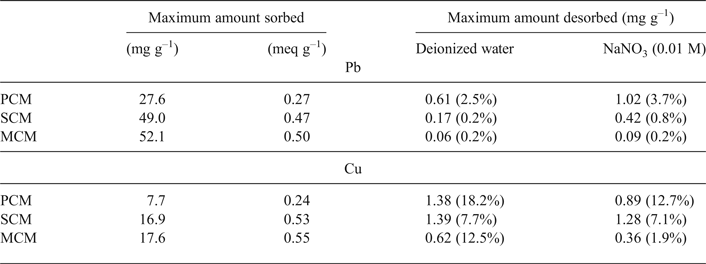
The maximum amounts of metal sorbed are listed in Table 2. The sorption capacity of the materials follow the order: MCM ≈ SCM > PCM for both metals. In addition, sorption is greater for Pb than for Cu on a wt.% basis. However, the equivalent fractions are identical (Table 2), which means that the clay samples have the same sorption affinity towards the two metals. The theoretical maximum metal load on clay surfaces was calculated roughly using the hydrated radii of the metal ions (rhPb = 4.01 Å, rhCu = 4.19 Å), normalized to the SSA of the clays. These calculations yield loads of 84–131 mg g–1 for Pb and 24–37 mg g–1 for Cu, respectively, values of the same order of magnitude as those obtained experimentally.
The desorption data revealed that the metal ions are strongly retained on the clay surfaces (Table 3). The released metal concentrations after leaching with water corresponded to the non-sorbed metal ions. The reaction with Na cations resulted in further displacement of metals. The amount leached by NaNO3 could be assigned to exchange phenomena. The retention capactiy of the materials follows the order: MCM > SCM > PCM, showing that metal sorption by the mixed clay is stronger and irreversible.
Maximum amounts of metal sorbed and desorbed per mass of clay material (mg g–1) after leaching with deionized water and 0.01 M NaNO3. The relative amount released is given in parentheses.
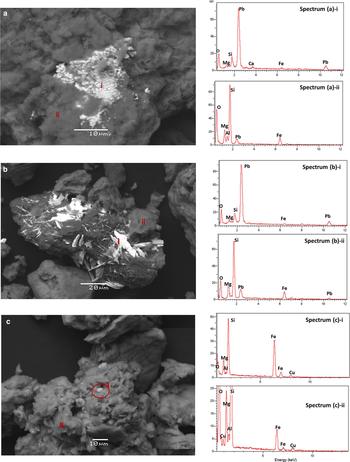
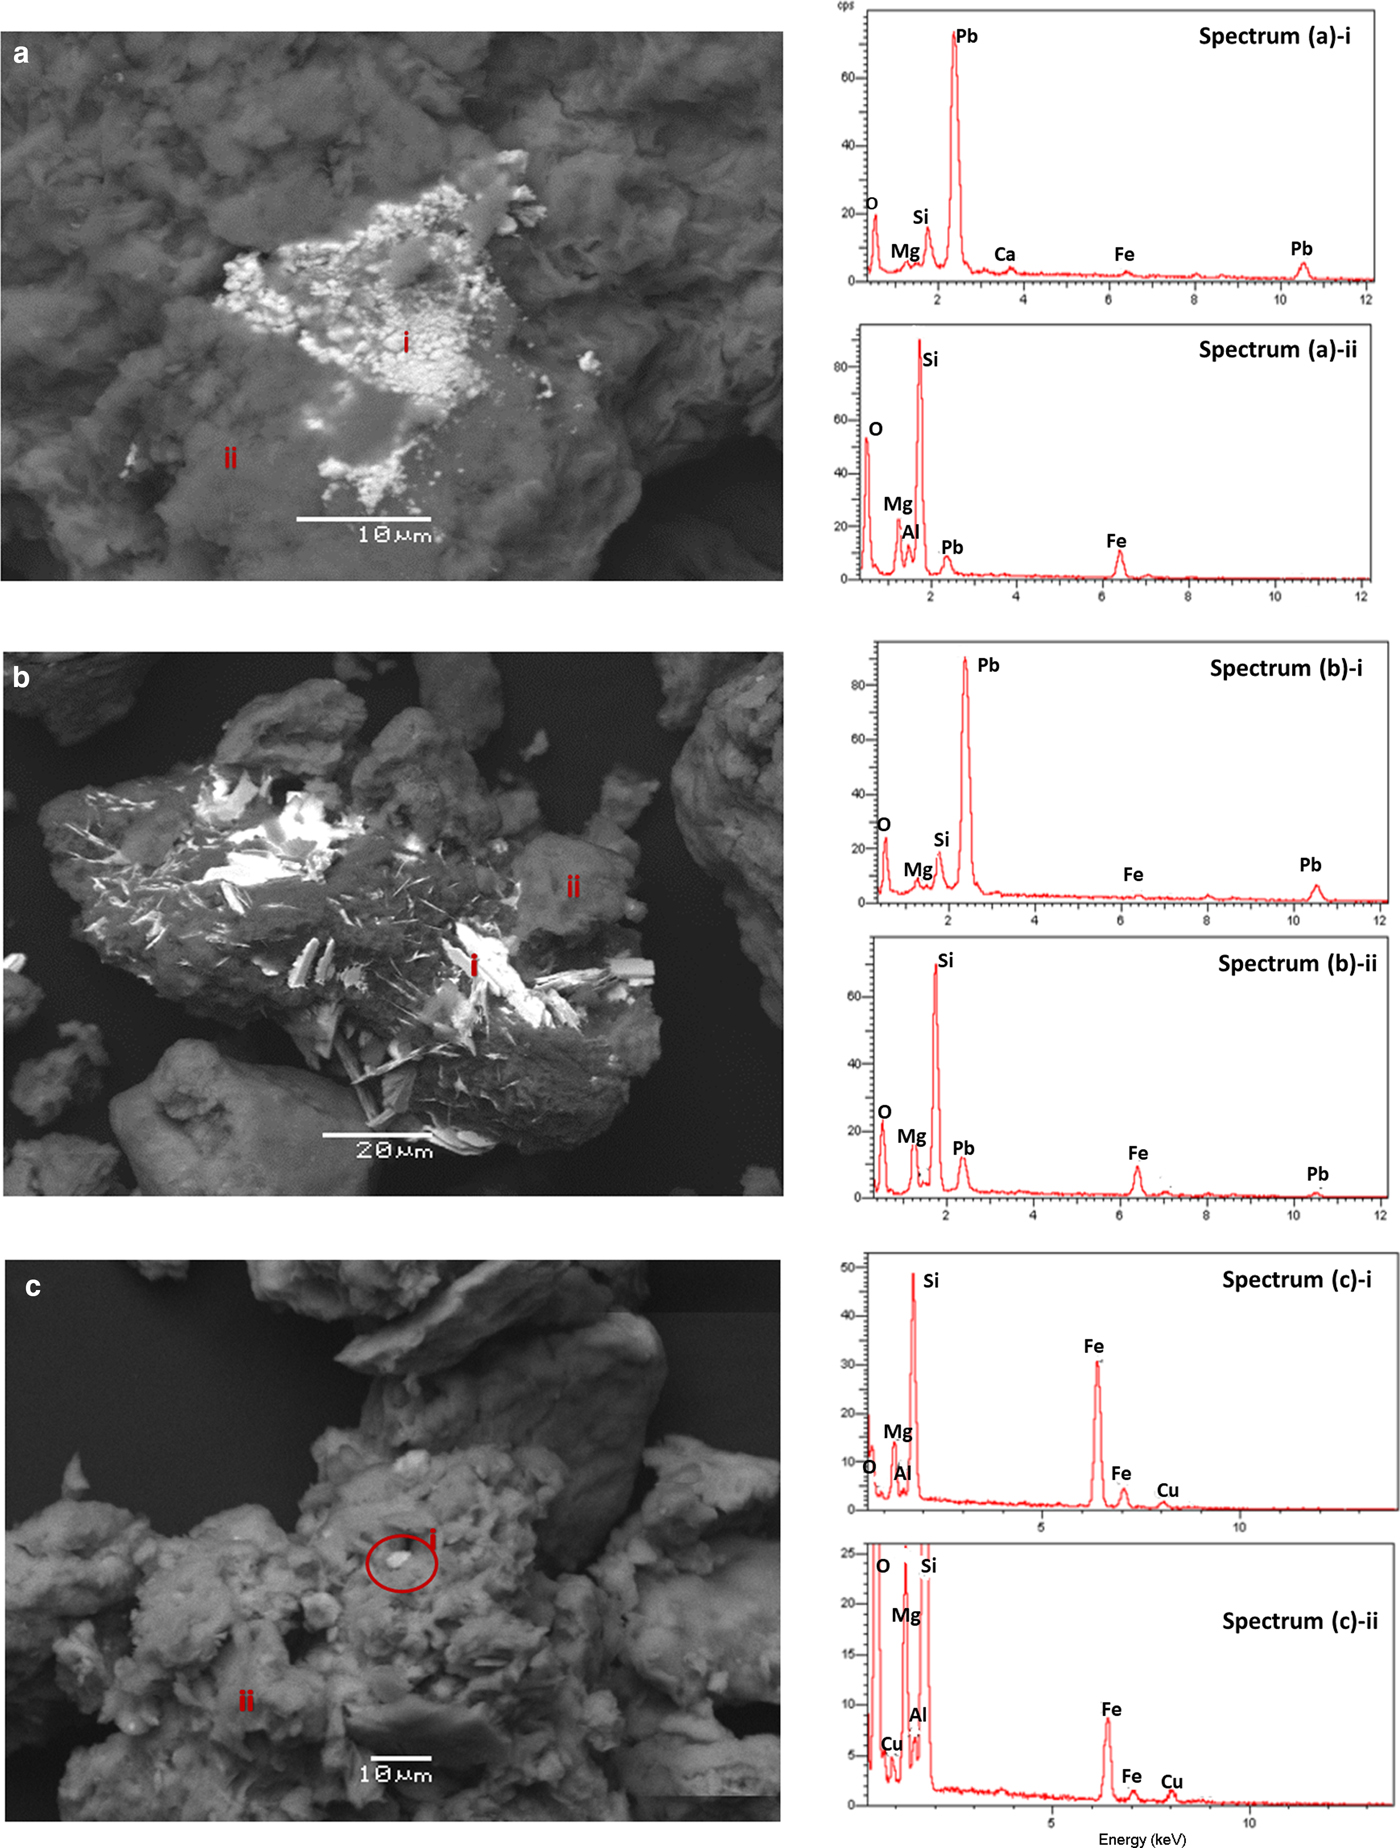
Examination of the metal-loaded samples using SEM-EDS showed that Pb is located both in the clay matrix and as scattered precipitates, which contained >80% Pb. The granular shape of the precipitates in SCM (Fig. 2a) points to cerussite and the laths in MCM (Fig. 2b) resemble hydrocerussite. The origin of lead carbonates could not be justified by the presence of calcite or dolomite in the natural clays (traces of dolomite were only found in the SCM sample); therefore the atmospheric CO2 was considered the main carbonate source. On the contrary, copper is only present within the clay mass in Cu-loaded samples (Fig. 2c), and no secondary Cu-rich phases were observed.
Selected SEM images and related EDS spectra of Pb-loaded SCM (a); and MCM (b); and Cu-loaded MCM (c) samples. Spectra i and ii correspond to the light and dark matter, respectively.
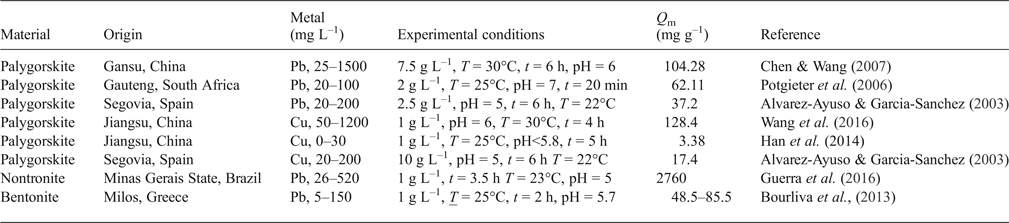
The sorption capacity of the clays studied has been compared with data from the literature (Table 4). The sorption capacity of the clays studied for Cu is comparable with values reported in literature. The capacities of the clays for Pb are smaller, however, taking into account the small amount of solid and the longer reaction times used in other studies.
Compilation of selected maximum sorption capacities (q m) of selected materials.
Sorption isotherms
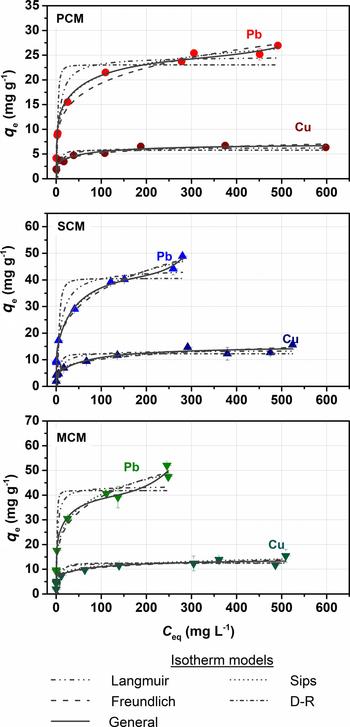
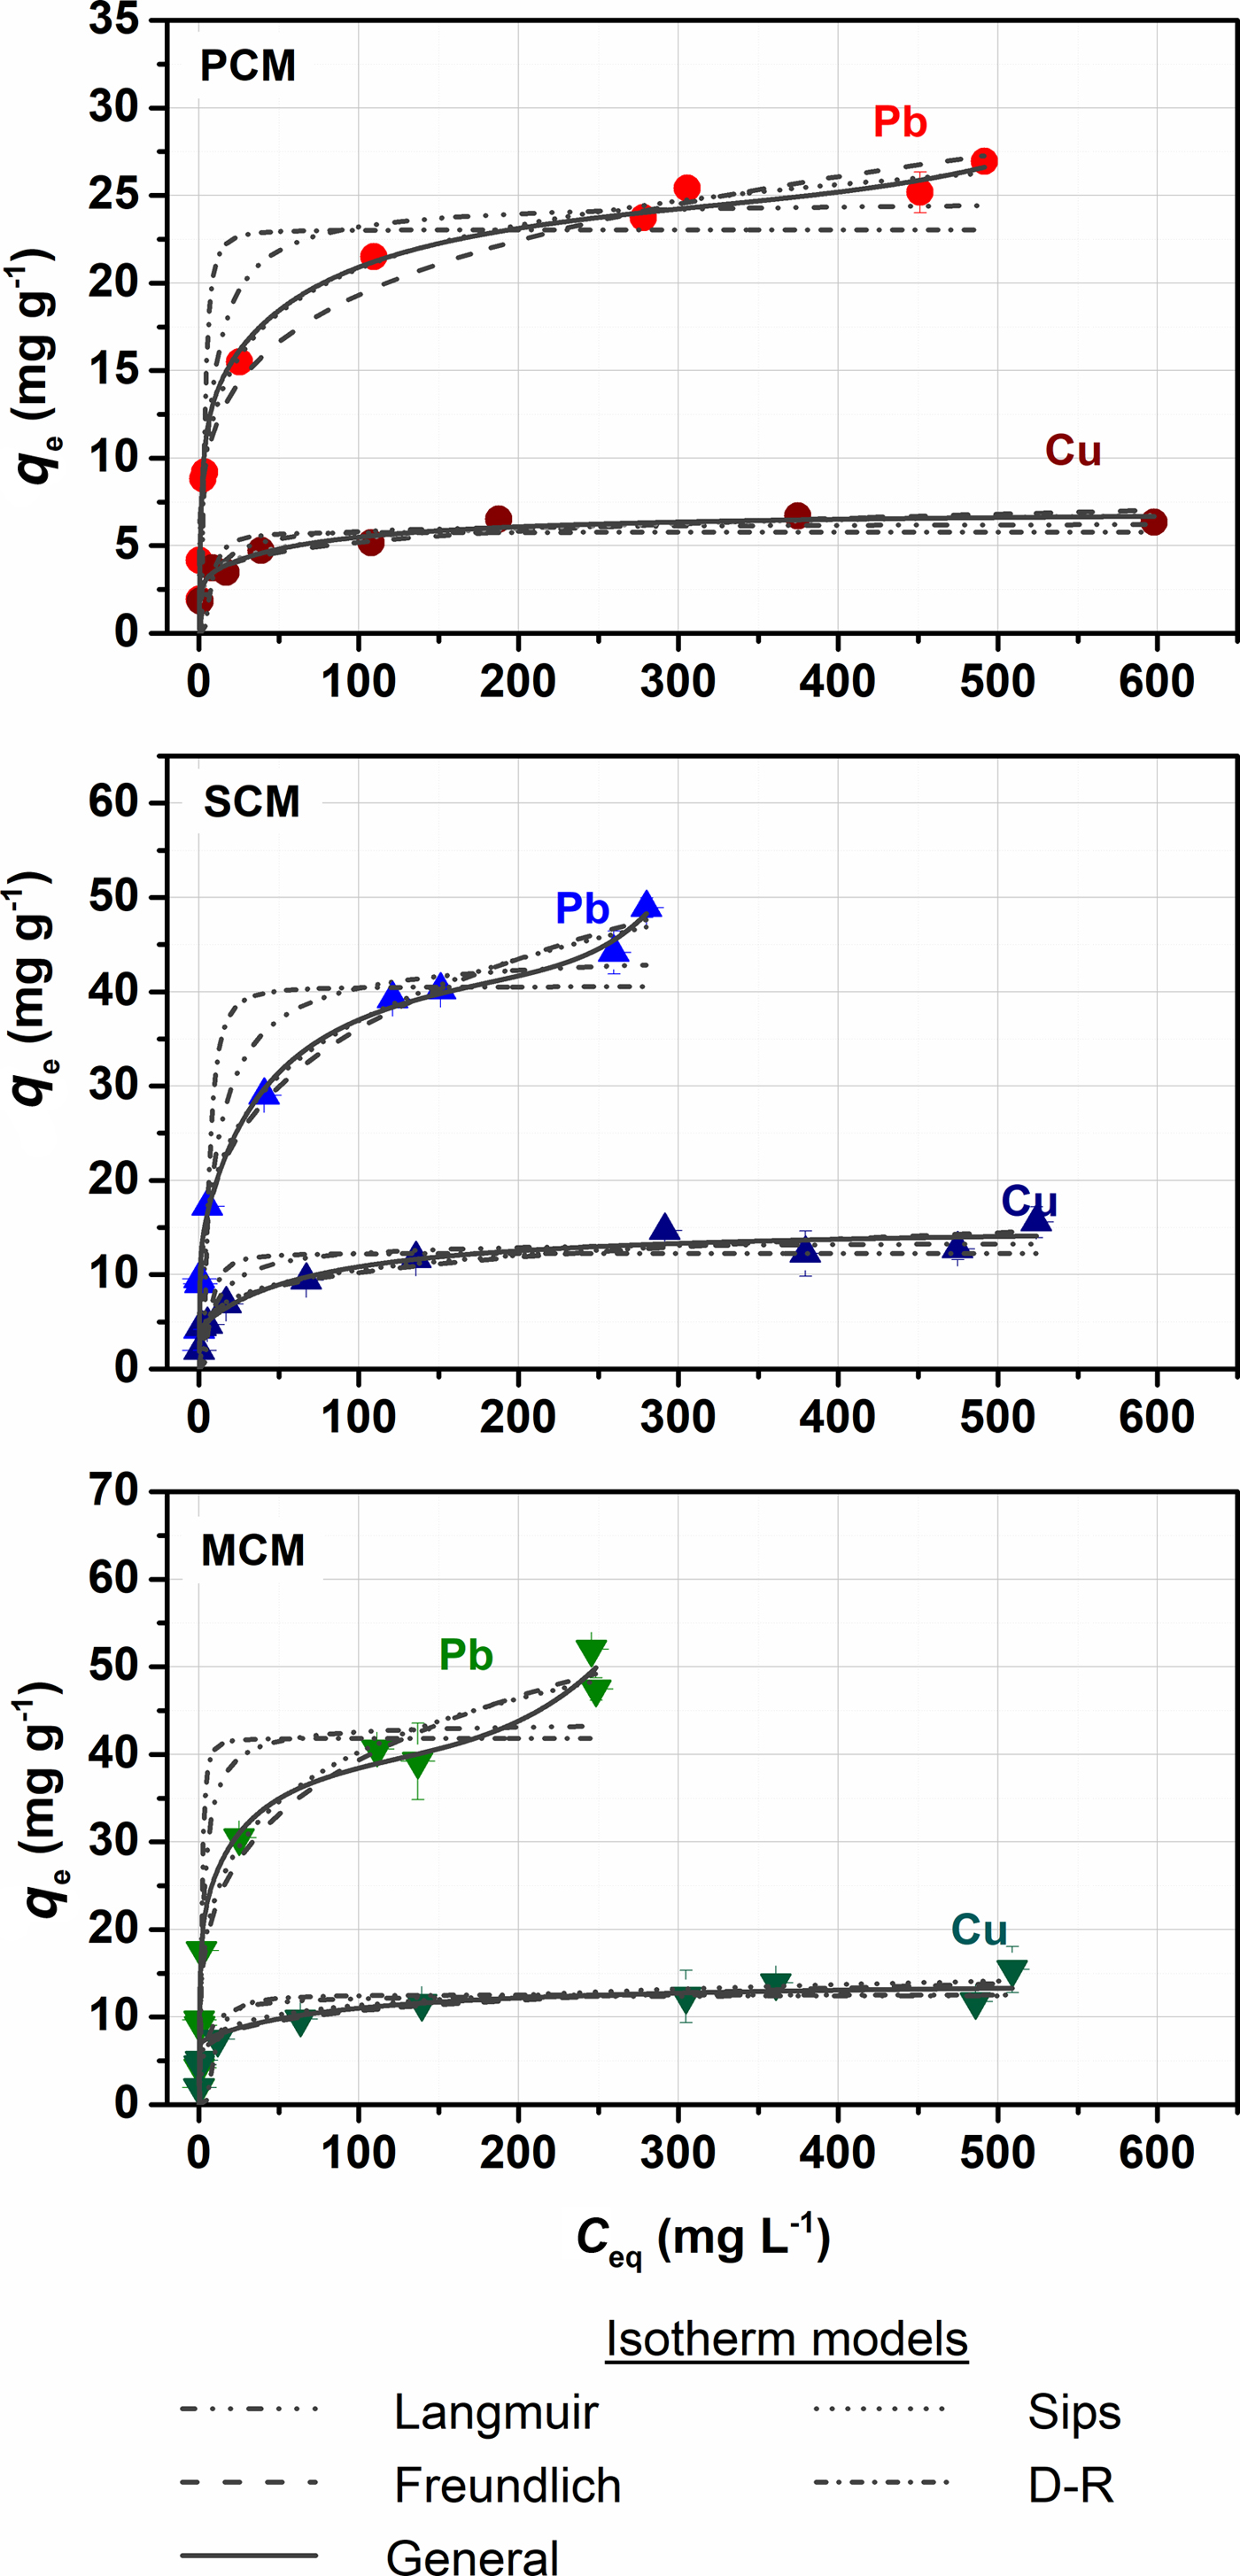
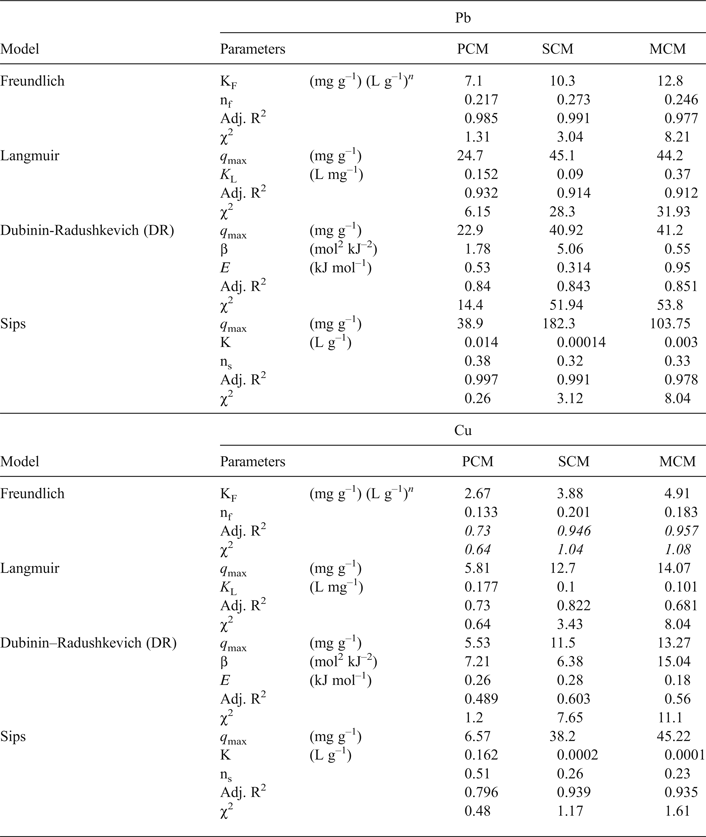
Taking into account the amounts of sorbed and desorbed metal, the sorbed metal concentrations, q e, were corrected by subtracting the amounts of metal released after washing with deionized water. The fitted curves are shown in Fig. 3 and the model parameters are presented in Table 5. The Freundlich and Sips models fit the experimental data well having both the largest R2 (>0.977 for Pb and >0.75 for Cu) and the smallest χ2 values (<10 for Pb and <3 for Cu), respectively, for the three materials. The predicted maximum sorption capacities calculated by the Sips model exceeded those of the Langmuir model. According to the Sips model, the capacity of the MCM and SCM samples are identical, whereas PCM will sorb smaller amounts of metal. The respective KS values follow the order: PCM > MCM > SCM. The relative interaction strength depends on the palygorskite content of the clays, denoting that specific sorption on clay edges is more stable than exchange in the interlayer space. The sorption process is also characterized as irreversible (RL = 0–0.5, nF < 0.5). Moreover, the sorption free energy, as determined by the D-R model, suggests that physisorption might be the main retention process; however the χ2 values were very high.
Sorption isotherms of Pb and Cu as a function of metal concentration (10 g L–1, pH = 3.6, t = 4 h, T = 22°C). Experimental data (points) were fitted to Langmuir, Freundlich, Langmuir, Dubinin-Radushkevich, Sips and general isotherm models.
Fitted parameters and error functions for the selected isotherm models.
Evolution of the suspension pH (pHe)
The pH of the starting metal solution was fixed to ~3.6, to ensure the free divalent form of Pb and Cu. However, the final pH of the suspensions increased up to 7.5–8 for Pb and 5–7 for Cu, suggesting sorption of protons by the functional groups. The affinity of the materials in sorbing protons follows the order: MCM > SCM > PCM.
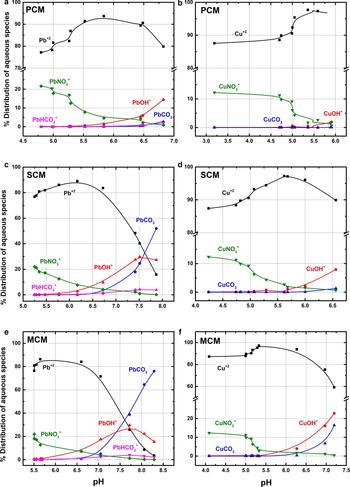
As the solution pH plays a major role in the form of ionic species in aqueous solutions, speciation calculations were conducted on the equilibrated metal concentrations (C e) as a function of pHe, using the PHREEQC geochemical code (Parkhust & Appelo, Reference Parkhust and Appelo1999) employed with Minteq v4 thermodynamic database (Fig. 4). The effect of the atmosphere buffering was assessed by equilibrating the solutions with CO2 (P CO2 = 10–3.5 atm), in order to simulate both the experimental and natural conditions in the surface environment, and in accordance with SEM observations (Fig. 2).
Lead (a, c, e) and copper (b, d, f) speciation diagrams of the suspensions at equilibrium, as a function of pH. Calculations by PHREEQC and minteq v4 database.
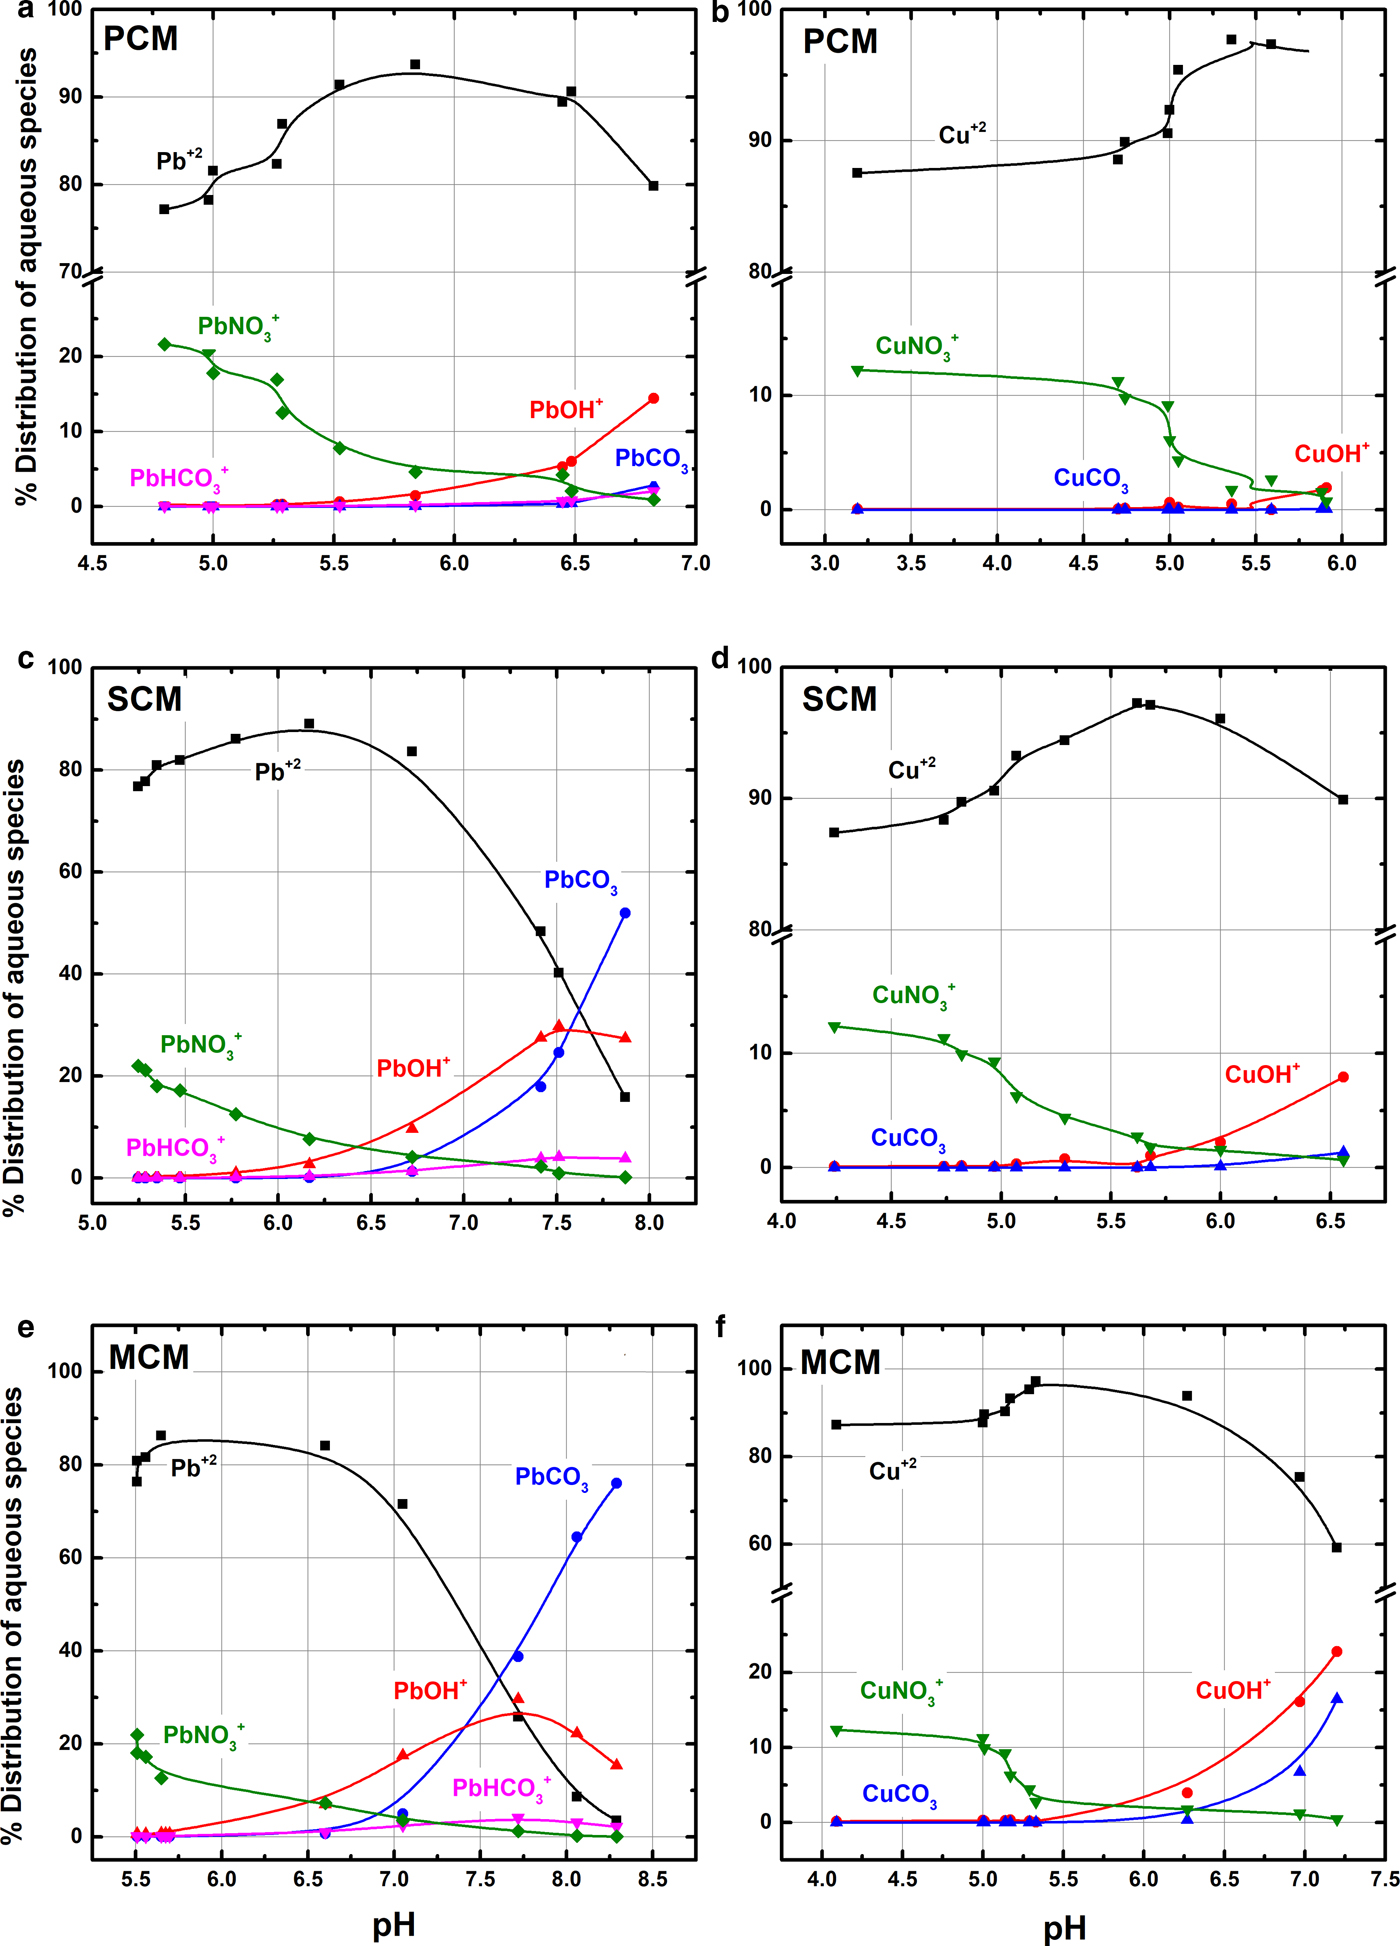
The thermodynamic calculations show that free cations (Pb+2, Cu+2), hydrolysed forms (PbOH+, CuOH+), carbonates (PbHCO3+, PbCO3, CuCO3) and nitrates (PbNO3+, CuNO3+) are the major aqueous species expected in the equilibrated suspensions. Pb2+ and Cu2+ are the major cations in all suspensions at pH < 7 for Pb (>70%) and <6.5 for Cu (>80%) (Fig. 3). At pH 5.5–7.5 the relative amounts of PbOH+ and CuOH+ increase, in proportion to pH for each sample. In PCM the amounts of hydrolysed Pb and Cu are smaller than analogous amounts in the SCM and MCM samples. The maximum PbOH+ fraction ranges from 13 (palygorskite clay) to 30% (mixed clay). The CuOH+ fraction ranges from 2 (palygorskite clay) to 23% (mixed clay), respectively. The suspensions of PCM are undersaturated with respect to Pb(OH)2 (SI < –1) and close to equilibrium in SCM and MCM (–1 < SI < 1). All suspensions are undersaturated with respect to Cu(OH)2 (SI < –2).
Equilibration of the samples with the atmospheric CO2 showed that the aqueous PbCO3 is also present in the suspensions having pH > 5.5. The maximum percentages calculated at the highest pH values were 12% in PCM, 50% in SCM and 75% in MCM samples. These samples were also close to equilibrium with respect to hydrocerussite and/or cerussite (–1 < SI < 1). Aqueous CuCO3 was found only in the MCM sample at pH > 6; nevertheless, the suspensions were undersaturated with respect to any related carbonate phases (azurite, malachite).
The nitrate ions concentration in randomly selected equilibrated suspensions was constant and equal to that in the initial metal solution indicating that there was no interaction between the anions and the solids. PbNO3+ (1–22%) and CuNO3+ (1–13%) show the same trend irrespective of the clay and their percentages are related to the initial nitrate concentration rather than the pH of the suspension. Overall, free-metal cations and nitrate complexes are the dominant aqueous species in the suspensions with low pHe (and high metal concentrations, C e), while hydrolysed complexes and uncharged species dominate in the suspensions with relatively high pHe (and low C e).
The origin of released Mg
The overall MgO of the bulk samples is 12.2% in PCM, 18.9% in SCM and 27.5% in MCM (Table S1). During the batch experiments, Mg ions may be released into the solution from: (1) unsatisfied bonds at the octahedral edges of palygorskite and Fe-smectite; (2) the interlayer space of Fe-smectite; or (3) the accessory mineral phases, such as serpentine and dolomite. The concentration of Mg in blank suspensions (at pH = 3.6) was 0.6 mg g–1 Mg, 0.9 and 1 mg g–1, for PCM, SCM and MCM, respectively.
The Mg concentrations in the suspensions containing Pb or Cu were greater than those in blank suspentions. The samples are classified according to the total Mg released after interaction with the metal solutions as follows: MCM (5.2–5.5 mg g–1) > SCM (4.8–5.1 mg g–1) > PCM (3.0–3.2 mg g–1).
DISCUSSION
Sorption mechanisms
The speciation calculations, the form of the sorption isotherms and the relationships between protons, Mg and the metals studied are indicative of a combination of sorption mechanisms occurring during the interaction of clay materials with metal solutions. These involve surface complexation (mainly with the abundant terminal SiOH groups of palygorskite), ion exchange (mainly with the interlayer Mg of smectites) and precipitation of solid compounds onto the surface, as discussed in the following paragraphs.
Surface complexation
Metal ions may displace protons in the surface functional groups by surface complexation. According to Lazarević et al. (Reference Lazarević, Janković-Častvan, Jovanović, Milonjić, Janaćković and Petrović2007), metal ions are preferably sorbed onto the clay surfaces until saturation of the available sites and protons are sorbed only after the available metal ions have been removed from the solution. Alternatively, protonation of the surface sites occurs first followed by [H+] displacement when the metal ions are added in the solution (Shirvani et al., Reference Shirvani, Kalbasi, Shariatmadari, Nourbakhsh and Najafi2006). In the present study the equilibrium pHe of the suspensions is lower than the measured PZC, indicating that the clay surfaces are highly protonated within the metal concentration range tested and thus we suggest that protonation of the clay surface precedes metal-[H+] exchange.
A mean surface complexation stoichiometry can be expressed in the following form (Stumm, Reference Stumm1992):
 $$n{\rm Si - OH} + Me^{ + 2} = {\rm} \left( {{\rm Si - O}} \right)_nMe^{(2 - n)} + n{\rm H}^ + ;{\rm} {\rm K}_s$$
where Si-OH represents the total active surface sites, Me 2+ is the solute metal concentration of Pb or Cu (C e)), (Si-O)nMe (2–n) corresponds to the sorbed quantity of the metal (q e), n is the proton coefficient (which describes the metal-proton exchange reaction), and Ks is the reaction constant. The logarithm of the mass balance equation is the Kurbatov equation (Kurbatov et al., Reference Kurbatov, Wood and Kurbatov1951) (equation 3):
 $${\rm log}K_d = {\rm log}K_s + n{\rm log}\left[ {{\rm Si - OH}} \right]{\rm} + n{\rm p}{\rm H}_{\rm e}$$
where K d is the distribution coefficient (q e/C e). The proton coefficient, n, corresponds to the slope of the fitted line, log K d–pHe and is used to distinguish betwee monodentate (n = 1) and bidentate (n = 2) complexes (Stumm, Reference Stumm1992; Mellis et al., Reference Mellis, Casagrande, Soares, da Cruz, de Camargo and Selim2013).
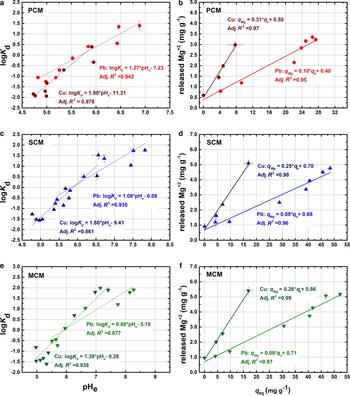
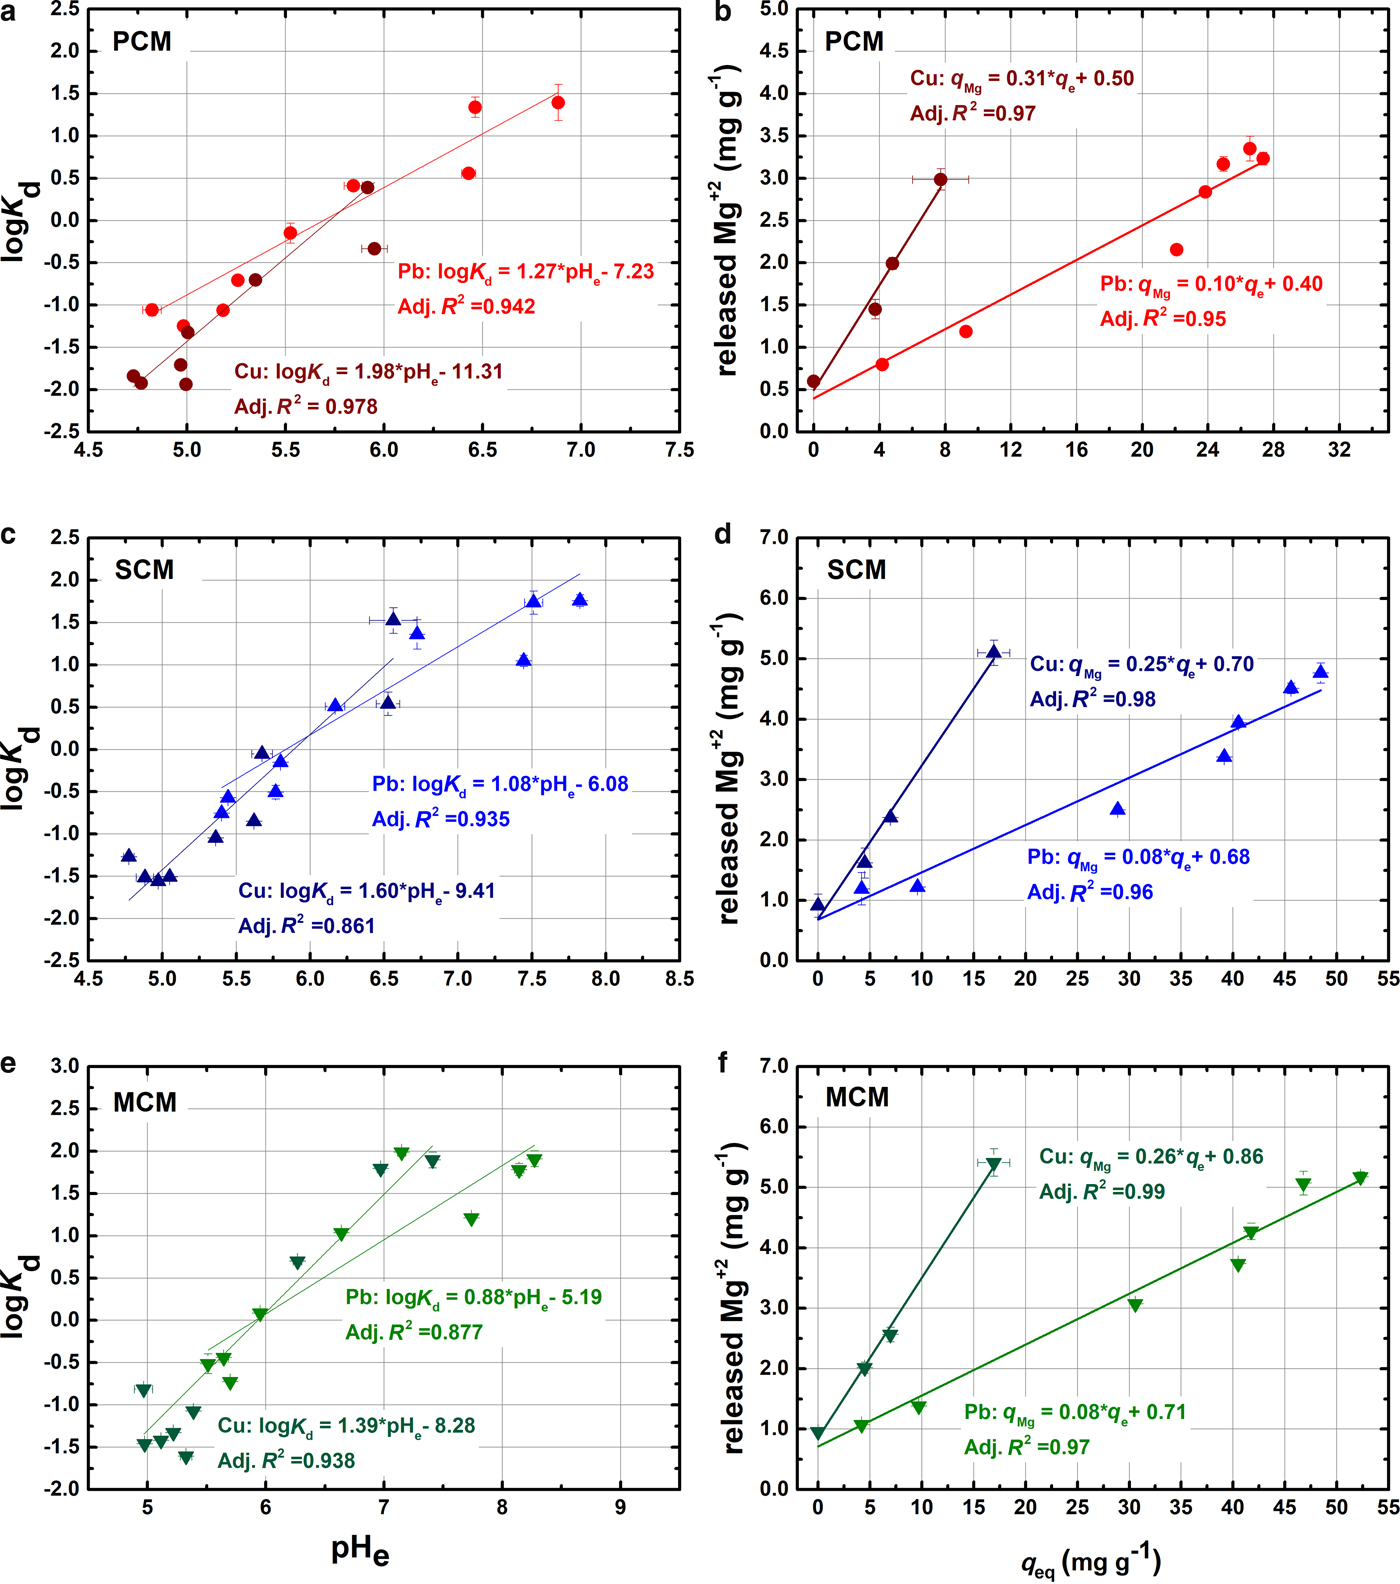
The respective logKd/pHe plots are presented in Fig. 5a, c, e. Using linear regression, the estimated n parameter increases in the order: PCM > SCM > MCM for both metals. This observation indicates that PCM has more reactive sites than the other two materials, due to the ribbon-like structure of palygorskite phase, which exposes more silanol groups (Galán, Reference Galán1996). The estimated n parameter for the Pb2+-H+ reaction ranged between 0.88 and 1.27, indicating that monodentate complexes (Si-OPb+) predominate over the bidentate hydrolysed forms (Si-OPbOH) (Heidmann et al., Reference Heidmann, Christl, Leu and Kretzschmar2005; Chen & Wang, Reference Chen and Wang2007). The respective n parameter for Cu suspensions is 1.39–1.98, suggesting an incomplete bidentate character ((Si-OCuOH and (Si-O)2Cu) similar to that described by Strawn et al. (Reference Strawn, Palmer, Furnare, Goodell, Amonette and Kukkadapu2004) in dioctahedral smectites and by Chen et al. (Reference Chen, Zhao and Wang2007) in palygorskites. These differences explain the lower pH values of the copper suspensions.
Relationship between the distribution factor Kd (L g–1) and the pHe in the suspensions at equilibrium (a, c, e). Relationship between the Mg released (mg g−1) from the clay samples as a function of sorbed metal concentration (mg g–1) (a, c, e).
The characterization of the possible metal complexes presented is based mainly on phenomenological observations and mathematical calculations. These calculations can only give estimates of the complexes, and further work using advanced spectroscopic techniques (e.g. EXAFS) would be necessary to support this hypothesis. Study of the metal-loaded samples using FTIR in the present research displayed no significant change in the signal because the quantity of sorbed metals was below the detection limit of the vibrational spectroscopic technique employed.
Ion exchange
Ion exchange has been assessed based on the Mg released in suspensions after interaction of the clay materials studied with the metal solutions. Considering that the clays studied are Mg-rich, the Mg ions could be both in the interlayer of the Fe-smectite (where they are weakly bonded) and at the edges of octahedral sheet of palygorskite and Fe-smectite. The interlayer Mg was estimated from the CEC measured (Table 2) for each material, 3.28 mg g–1 for PCM, 7.61 mg g–1 for SCM and 3.59 mg g–1 for MCM, respectively. The respective maximum attainable Pb and Cu loads of the samples were calculated as 27.9 mg g–1 and 8.6 mg g–1 for PCM, 64.8 mg g–1 and 19.9 mg g–1 for SCM, and 30.6 mg g–1 and 9.4 mg g–1 for MCM. Therefore, the complete exchange of interlayer Mg by the metal ions would yield exchange ratios of Mg/Pb = 0.12 and Mg/Cu = 0.38 for all samples.
The exchanged ratios were calculated by linear regression (R2 > 0.97) between the released Mg and the amounts of metal sorbed in Fig. 5b, d, f. The slope of the fitted lines corresponds to the Mg/metal exchange. The intercept corresponds to the Mg released in the absence of metal ions, and are in general agreement with the measured values in blank suspensions. The experimental Mg/Pb and Mg/Cu-exchanged ratios ranged between 0.08 and 0.1 for Pb and between 0.25 and 0.31 for Cu suspensions, respectively, which are lower than the maximum ratios calculated above. This is indicative of the replacement of interlayer Mg by the metal ions as one of the main retention mechanisms between the metal ions and the clays.
Previous work has shown that the metals can also displace the Mg ions of the broken edges of the octahedral sheets, especially when the exchanged ions have similar hydrated radii (rhMg = 4.28 Å) (Alvarez-Ayuso & Garcia-Sanchez, Reference Alvarez-Ayuso and Garcia-Sanchez2007; Shirvani et al., Reference Shirvani, Shariatmadari and Kalbasi2007; He et al., Reference He, Zhu, Yang, Han and Zhang2011). This might be the case in MCM sample where the Mg released (>4 mg g–1) surpassed the maximum amount exchanged (3.59 mg g–1). In addition, the maximum amount of metal sorbed (52 mg g–1 for Pb, 17 mg g–1 for Cu) exceeds the amount which can be accommodated in the interlayer (30.6 mg g–1 for Pb, 9.4 mg g–1 for Cu).
Modelling of the sorption process
Whilst the classical isotherm models may provide sufficient information on the characteristics of the solid–liquid system, they do not distinguish between the various mechanisms described in the previous paragraphs. A general isotherm is often employed to investigate the effect of each mechanism, i.e. ion exchange, surface complexation and precipitation in various solid–liquid systems (Alvarez-Puebla et al., Reference Alvarez-Puebla, Valenzuela-Calahorro and Garrido2004b; Carmona et al., Reference Carmona, Lucas, Valverde, Velasco and Rodríguez2006). The proposed general sorption isotherm consists of three parts, each assigned to a retention mechanism:
(1) Ion exchange (as described by the displacement of interlayer Mg from the metal ions) is expressed as equation 4:
(4) $$q_{{\rm ex}} = \displaystyle{{q_{{\rm ex}}^{{\rm max}} \; {\rm K}_{{\rm ex}}\; C_{\rm e}\;} \over {1 + \; {\rm K}_{{\rm ex}}C_{\rm e}\;}}$$
(2) Surface complexation (which involves the deprotonation of surface functional groups) is expressed as equation 5:
(5)$$q_{{\rm sc}} = \displaystyle{{q_{{\rm sc}}^{{\rm max}} {\rm K}_{{\rm sc}}C_{\rm e}} \over {1 + \; {\rm K}_{{\rm sc}}C_{\rm e}}}$$(3) Precipitation of oxides or carbonate species, expressed with a Freundlich-type equation (equation 6):
(6)$$q_{{\rm pre}} = {\rm A}C_e^{\rm b}$$


Combining the aforementioned equations, the overall retention process is described by equation 7:
 $$q = q_{{\rm ex}} + \; q_{{\rm surf}} + q_{{\rm prec}} = \; \displaystyle{{q_{{\rm ex}}^{{\rm max}} \; {\rm K}_{{\rm ex}} C_{\rm e}\;} \over {1 + \; {\rm K}_{{\rm ex}}C_{\rm e}\;}} + \; \displaystyle{{q_{{\rm sc}}^{{\rm max}} {\rm K}_{{\rm sc}}C_{\rm e}} \over {1 + \; {\rm K}_{{\rm sc}}C_{\rm e}}} + {\rm \; A}C_e^{\rm b}$$
where q exmax and q scmax are the maximum amounts of exchanged and complexation metals (mg g–1), Kex and Ksc are the exchange and complexation affinity constants (L g–1), A is the kinetic equilibrium constant b is the partial order for precipitation.
Non-linear regression was employed to simulate the experimental data with the proposed three-term sorption isotherm (Fig. 3) and the calculated parameters are presented in Table 6. The general trend is that Ksc > Kex and q sc ≤ q ex, which means that surface complexation forms stronger but fewer bonds than ion exchange.
Fitted parameters for equation 7.

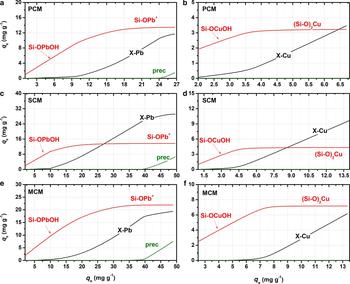
The estimated quantification of each process is displayed graphically in surface speciation diagrams (Fig. 6). Surface complexation (red line) is the predominant retention mechanism in the palygorskite-containing samples (PCM, MCM), whereas in SCM plays a secondary role. At low metal concentrations, the available metal ions are attached readily to the unsaturated surface, and the surface coverage increases proportionally to the increasing metal concentrations (the initial slope of the red curve). The saturation of the surface sites is described by a plateau of the related curve, and is quickly attained in the SCM sample, which lacks palygorskite. At saturation, the contribution of surface complexation in the overall sorption process of Pb and Cu is ~50% in PCM, ~30% in SCM and ~55% in MCM. Considering the speciation calculations presented in Fig. 4, the sorption of hydrolysed metals occurs at low q e, whereas the free divalent ions are attached at higher concentrations.
Surface speciation diagrams of Pb and Cu retained on PCM, SCM and MCM samples as a function of the total amount of metal sorbed at equilibrium (q e), calculated using the parameters in Table 6.
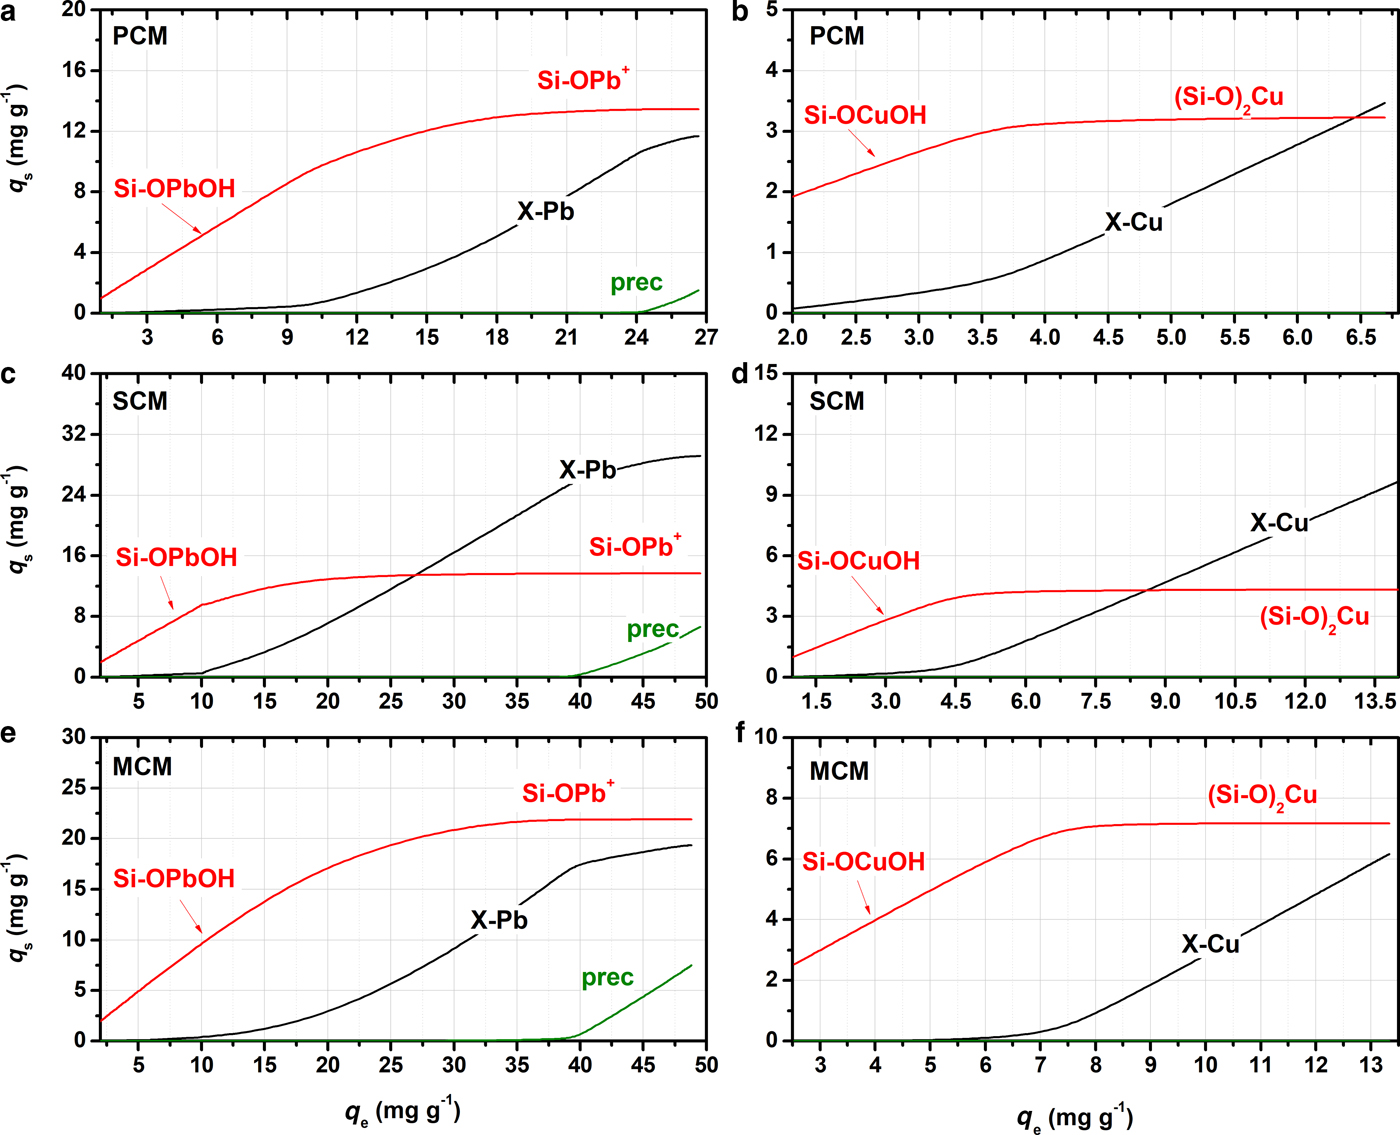
Ion exchange (Fig. 6, black line) is the most important retention mechanism in the SCM sample which has the largest smectite content. Generally, the metal ions that occupy the exchange sites increase proportionally to the total metal load, which is also in agreement with the Mg release into the solution observed as mentioned above. However, saturation of the interlayer is not achieved even at high metal concentrations, as it is superimposed by the oversaturation and precipitation of metal solids. According to calculations, ion exchange accounts for up to 45–50% of metal retention in PCM, 40–45% in MCM, and >60–70% in the SCM sample. Finally, precipitation (Fig. 6, green line) accounts for equal amounts in all Pb-saturated clay samples (up to 15%); no Cu precipitates were estimated by the model.
CONCLUSIONS
The sorption capacity of three natural clays for the removal of Pb2+ and Cu2+ from aqueous solutions was investigated by batch sorption experiments and numerical modelling. Sorption capacity is greater for the Fe-smectite-containing samples, MCM and SCM, for both metals. The relationships between metal retention, leaching of Mg ions and the pH of the suspensions suggest that sorption of metal ions by the clays studied occurs through ion exchange and surface complexation, accompanied by/or precipitation of secondary phases. A three-term isotherm model has been employed succesfully to quantify the role of each of the above mechanisms in the overall retention process and demonstrated the effect of clay materials on metal retention.
Further work is needed to elucidate the nature of complexes formed, by using advanced spectroscopic techniques and for exploring more complicated systems involving the interaction between multi-metallic soil solutions and the clay materials studied. This will improve our understanding of their sorptive behaviour and expand the range of their uses for environmental protection.
SUPPLEMENTARY MATERIAL
The supplementary material for this article can be found at https://doi.org/10.1180/clm.2018.12.
ACKNOWLEDGEMENTS
This research was partially funded by Geohellas S.A. (SARG-NKUA project no. 13706) and Edafomichaniki S.A. (SARG-NKUA project no. 11993). The authors are grateful to Dr Efstratios Kelepertzis and Mr Vassilios Skounakis of the Laboratory of Economic Geology and Geochemistry, for their invaluable help with laboratory measurements. Special thanks to Prof. George Christidis, of the Technical University of Crete and Mrs Despoina Chriti of the Laboratory of Inorganic Chemistry (Department of Chemistry, NKUA) for their assistance in determining the specific surface areas of the samples. The authors also appreciate the thorough review and the constructive comments by the three anonymous reviewers that improved the quality of the paper.