

Introduction
Throughout Mesoamerica, corporal animal forms (a term encompassing living animals, animal-derived by-products and artifacts made from animal bodies) have long played essential roles in state-level ritualized activities. They are elaborately displayed in sacrificial rites, consumed in feasts and utilized as religious instruments and adornments by ritual practitioners (Emery Reference Emery2003; Reference Emery2004; Emery & Götz Reference Emery and Götz2013; López Luján et al. Reference López Luján, Chávez Balderas, Zúñiga-Arellano, Aguirre Molina, Valentín Maldonado, McCarty and Arbuckle.2014; Sugiyama et al. Reference Sugiyama, Pérez, Rodríguez, Torres, Valadez, McCarty and Arbuckle2014). This paper focuses on three zooarchaeological assemblages from the Classic Period Maya site of Copan, Honduras (ad 426–822), to describe how corporal animal forms were implemented to mediate power, express social identities and encapsulate contemporary sociopolitical circumstances. Although a zooarchaeological investigation into the functions and meanings of these ritualized acts encompasses considerations of contemporary socio-political and environmental conditions from the archaeological contexts in which their subject species were embedded, it is also necessary to evaluate evidence and conform interpretations to align with well-understood characteristics of animal behaviour and biology.
The trio of contexts examined here are grouped such that they effectively bookend the Copan dynasty. The first two appear to have been auspiciously timed to coincide with the performance of a new baktun (400-year calendric renewal) ceremony on 9.0.0.0.0. (ad 435) marking the succession in rulership from the dynastic founder to his son. These fundamental assemblages relate to world-creation myths associated with the Starry Deer-Crocodile; a mythological entity prominent in both contexts. This being was materialized into the ritual arena through a formalized process of commingling and translating animal body elements. The third context was deposited more than three centuries later during the reign of Yax Pasaj, the last ruler of the Copan dynasty. This assemblage, extravagant with powerful felids conjuring the authority of the royal lineage, reflects a period of acute socio-political struggle faced by the Copan kingdom. The ritualized violence captured in this context represents some of the best evidence of animal sacrifice directly tied to the Copan state. Through rigorous zooarchaeological analysis of these three contexts, we reconstruct how corporal animal forms materialized the complex interaction ligatures that bind human, action, animal and environment.
Ritualized performance and power
This case study explores the role of the animal as sacrificial victim, as ritual paraphernalia and as interred burial offering. It considers the multitude of ways animals and their constituent parts participate in arenas wherein social boundaries are constructed and reified through ritual performance (Bell Reference Bell1992; Reference Bell1997; Kertzer Reference Kertzer and Wolf1991; Sugiyama et al. Reference Sugiyama, Pérez, Rodríguez, Torres, Valadez, McCarty and Arbuckle2014). Two of the examined contexts represent state-sponsored ritualized acts performed in order to materialize and substantiate specific world views (sensu DeMarrais et al. Reference DeMarrais, Castillo and Earle1996); in some cases by reenacting creation myths or dynastic histories. As orchestrators of these ritualized ceremonies, state functionaries carefully manipulated powerful key symbols (sensu Ortner Reference Ortner1973) to draw direct parallels with ontologies ascribed to these animals in order to support the protagonists’ social positions.
The interpretation of ritual as active performance—as a culturally constructed system of symbolic communication intended to engage all corporeal senses—endorses a uniquely archaeological perspective with its characteristic emphasis on the material precipitants of the spectacle: the setting, the ritual implements, and the actors (Inomata & Coben Reference Inomata, Coben, Inomata and Coben2006; Tambiah Reference Tambiah1981). As with many other contexts throughout Mesoamerica, the principal protagonists in ritualized acts at Copan frequently included animals and animal-form beings charged with active participatory agency, whether as live beasts in sacrificial rites or as animal paraphernalia.
Ethnographers working with modern New World indigenous communities have similarly documented that during ritual manipulation of animal elements, each part of an animal is perceived by the celebrants as a discrete entity endowed with proprietary agency (Bird-David Reference Bird-David1999; Hallowell Reference Hallowell, Tedlock and Tedlock1975; Viveiros de Castro Reference Viveiros de Castro1998), and that the inclusion of these animal entities into dedicatory acts affirms their essential role as mediators of power (Brown Reference Brown2004). This paper asserts that the presentation and ritual manipulation of corporal animal forms of wild, tamed/domestic, or mythological animals, revered as sacred and potent beings in native ontologies, was a central component of legitimation and domination strategies utilized by the Copan state as well as by individual elites residing within the valley. Two animal entities with special relevance to the present discussion of power, authority and legitimation are the mythological Starry Deer-Crocodile and the regional apex predator, the large felid (jaguar and/or puma).
The Starry Deer-Crocodile
Many native ontologies distinguish animals according to classification systems exhibiting vastly different composition and greater fluidity than the familiar Linnaean model. In addition to encoding and transmitting culturally constructed categories of use and meaning, these systems recapitulate and reaffirm the underlying socio-political structures upon which they are built (Bentley & Rodríguez Reference Bentley and Rodríguez2001; Hunn Reference Hunn1977). Ontologies that comprehend animal and human domains with similarly fluid distinction engender the conception (and often deification) of hybrid and chimerical entities. It was to such entities that ancient Copanecos ascribed ultimate natural agency: power expressed as the ability to make the rain fall, the sun rise, or to be an original force of creation itself (Brown Reference Brown2004; Saunders Reference Saunders1989).
For the Maya, crocodilian figures were prominent in mythological contexts. One essential and recurring theme in Maya cosmogenesis is embodied in the figure identified by epigraphers as the ‘Celestial Monster’, an entity frequently depicted as a crocodilian drifting through the cosmic sky. The variant of this creature referred to by David Stuart as the Starry Deer-Crocodile is represented in the form of a sky-band with star symbols adorning the body (Martin Reference Martin, Golden, Houston and Skidmore.2015; Stuart Reference Stuart2003; Reference Stuart2005; Taube Reference Taube, Finamore and Houston2010).The Starry Deer-Crocodile is a chimeric fusion of a crocodilian body with other animal forms, primarily the deer. In many of these representations, a body bearing characteristically crocodilian scutes, teeth and visage is fused with the limbs of an artiodactyl (identified by cloven-hooved ends), the ears of a deer and occasional antler-like protuberances on the forehead (Martin Reference Martin, Golden, Houston and Skidmore.2015, 192; Stuart Reference Stuart2005, 72).
Crocodiles were instrumental in the creation of the Maya world. The sacrifice of the Earth Monster, a crocodile body bearing mountainous tellurian serrations, transformed it into the terra firme afloat in a primordial sea (Stone & Zender Reference Stone and Zender2011, 183; Taube Reference Taube, Finamore and Houston2010). The Starry Deer-Crocodile is perhaps the counterpart figure for the underworld sky. Stuart (Reference Stuart2005, 168) interprets its representation as the bodily manifestation of an underworld sky or night sky that has ingested the daytime sun to be defecated or reborn each morning on the eastern horizon. The depictions of crocodile sacrifice at Temple XIX, Palenque can thus be interpreted as referring to an act involving world creation similar to the sacrifice of the Earth Monster (Stuart Reference Stuart2005). This is perhaps why crocodilians are sometimes configured in the shape of thrones in depictions of period-ending ceremonies, such as the one deciphered on Stela 6 at Piedras Negras, where rulers ‘take the crocodile throne’ (Stuart Reference Stuart2005, 89). William Fash and Barbara Fash (Reference Fash and Fash2016) have interpreted the Starry Deer-Crocodile as a thematic unit representing the process of destruction, creation and renewal of the universe reenacted through royal accession ceremonies at Copan. Data from zooarchaeological contexts, though relatively limited in comparison to the abundance of pictographic references, consistently confirm the importance of crocodilian elements (Thurston Reference Thurston2011). For example, the headless body of a crocodile was excavated in Burial 10 at Tikal and crocodile scutes were uncovered in Tomb A-III at Kaminaljuyu (Coggins Reference Coggins1975, 147); both contexts associate these creatures with ritualistic functions.
Felid symbolism and power
Ethnographic and iconographic studies provide abundant evidence that felids, as the dominant apex predators of the New World, were favored icons of power and prestige. The jaguar is a conspicuously central figure in the iconographic repertoire of Mesoamerica, expressing social, religious and militaristic power (Benson Reference Benson1972; Olivier Reference Olivier2016; Saunders Reference Saunders1989; Reference Saunders1998). Jaguars controlled the non-human world in the way that priests and dynasties could control human society. Jade artifacts, sculptures, cave paintings and other materials depicting the jaguar as a symbol of ferocious strength and valour capable of menacing humans can be traced as far back as the Olmec and other Formative period cultures (Aguilera Reference Aguilera1985, 15–17; Coe Reference Coe and Benson1972; Furst Reference Furst and Benson1968; González Torres Reference González Torres and González Torres2001; Grove Reference Grove and Benson1972). The lineage of this ancient prestige survives in modern native communities, such as the Chamula of Chiapas, Mexico, from whom ethnographers have recorded accounts of jaguars residing in the highest level of a three-tiered classification system (Gossen Reference Gossen1975).
The jaguar's characteristic rosette pelt and nocturnal vision linked this largest of New World carnivores to the night sky, to fertility and the underworld. Its golden-coated sympatric cousin, the puma, was associated with the sun and daylight and considered the jaguar's diurnal counterpart (Sugiyama Reference Sugiyama2016). Together, these two felids were the dominant agents of the night and day worlds. The most prominent zooarchaeological confirmation of the intimate connection between these ferocious beasts and state-level ritual performances comes from Central Mexican contexts at Teotihuacan (Sugiyama Reference Sugiyama2014; Sugiyama et al. Reference Sugiyama, Pérez, Rodríguez, Torres, Valadez, McCarty and Arbuckle2014) and Tenochtitlan (the Aztec capital) (López Luján et al. Reference López Luján, Chávez Balderas, Zúñiga-Arellano, Aguirre Molina, Valentín Maldonado, McCarty and Arbuckle.2014; Polaco Reference Polaco1991). Both case studies concluded that jaguars and pumas were regarded as paramount sacrificial beings, and that their byproducts such as crania and pelts were venerated as powerful emblems of state authority.
Copan and zooarchaeological considerations
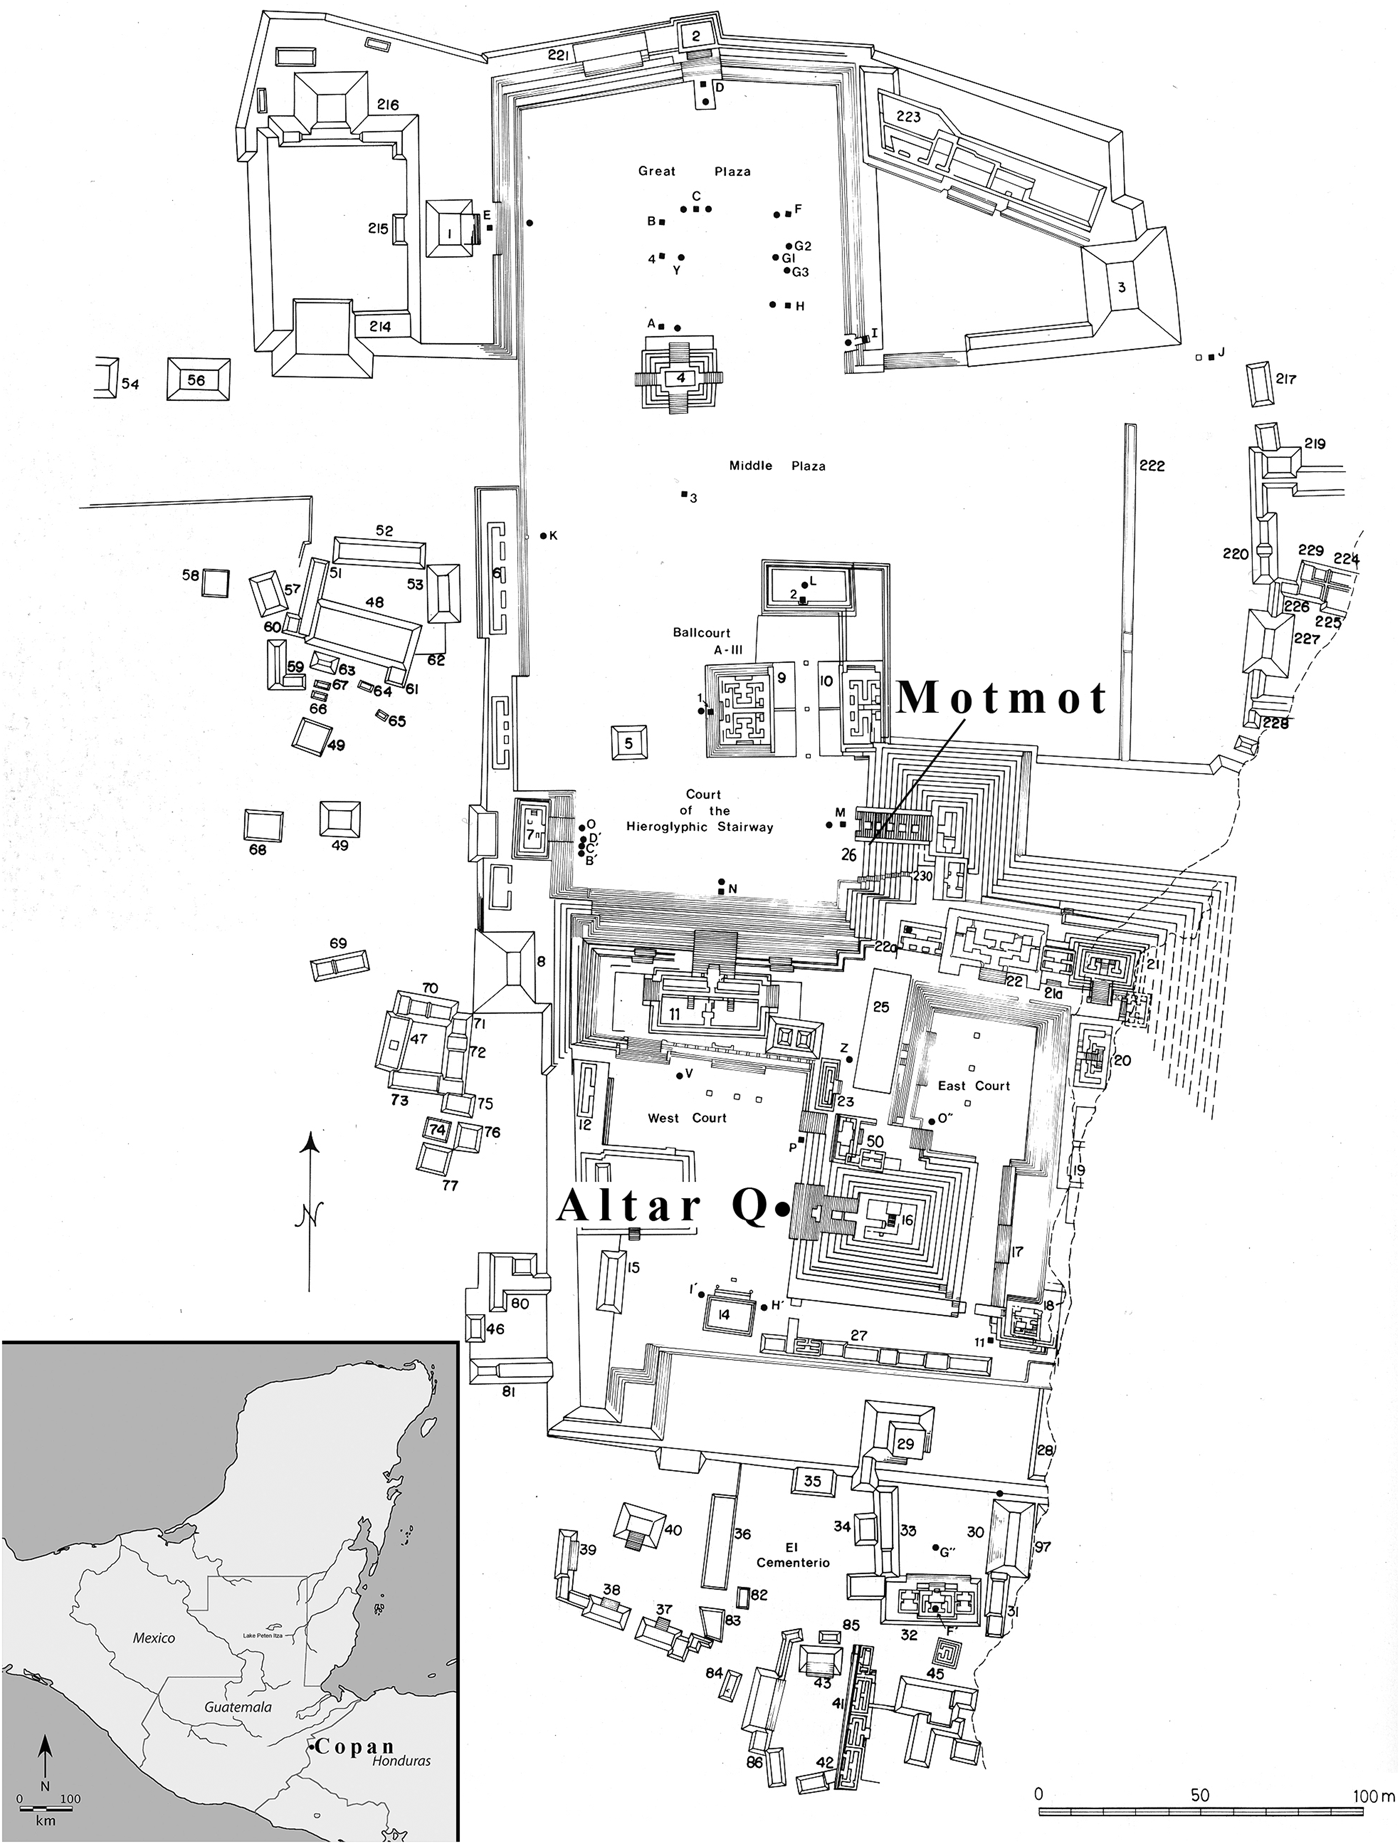
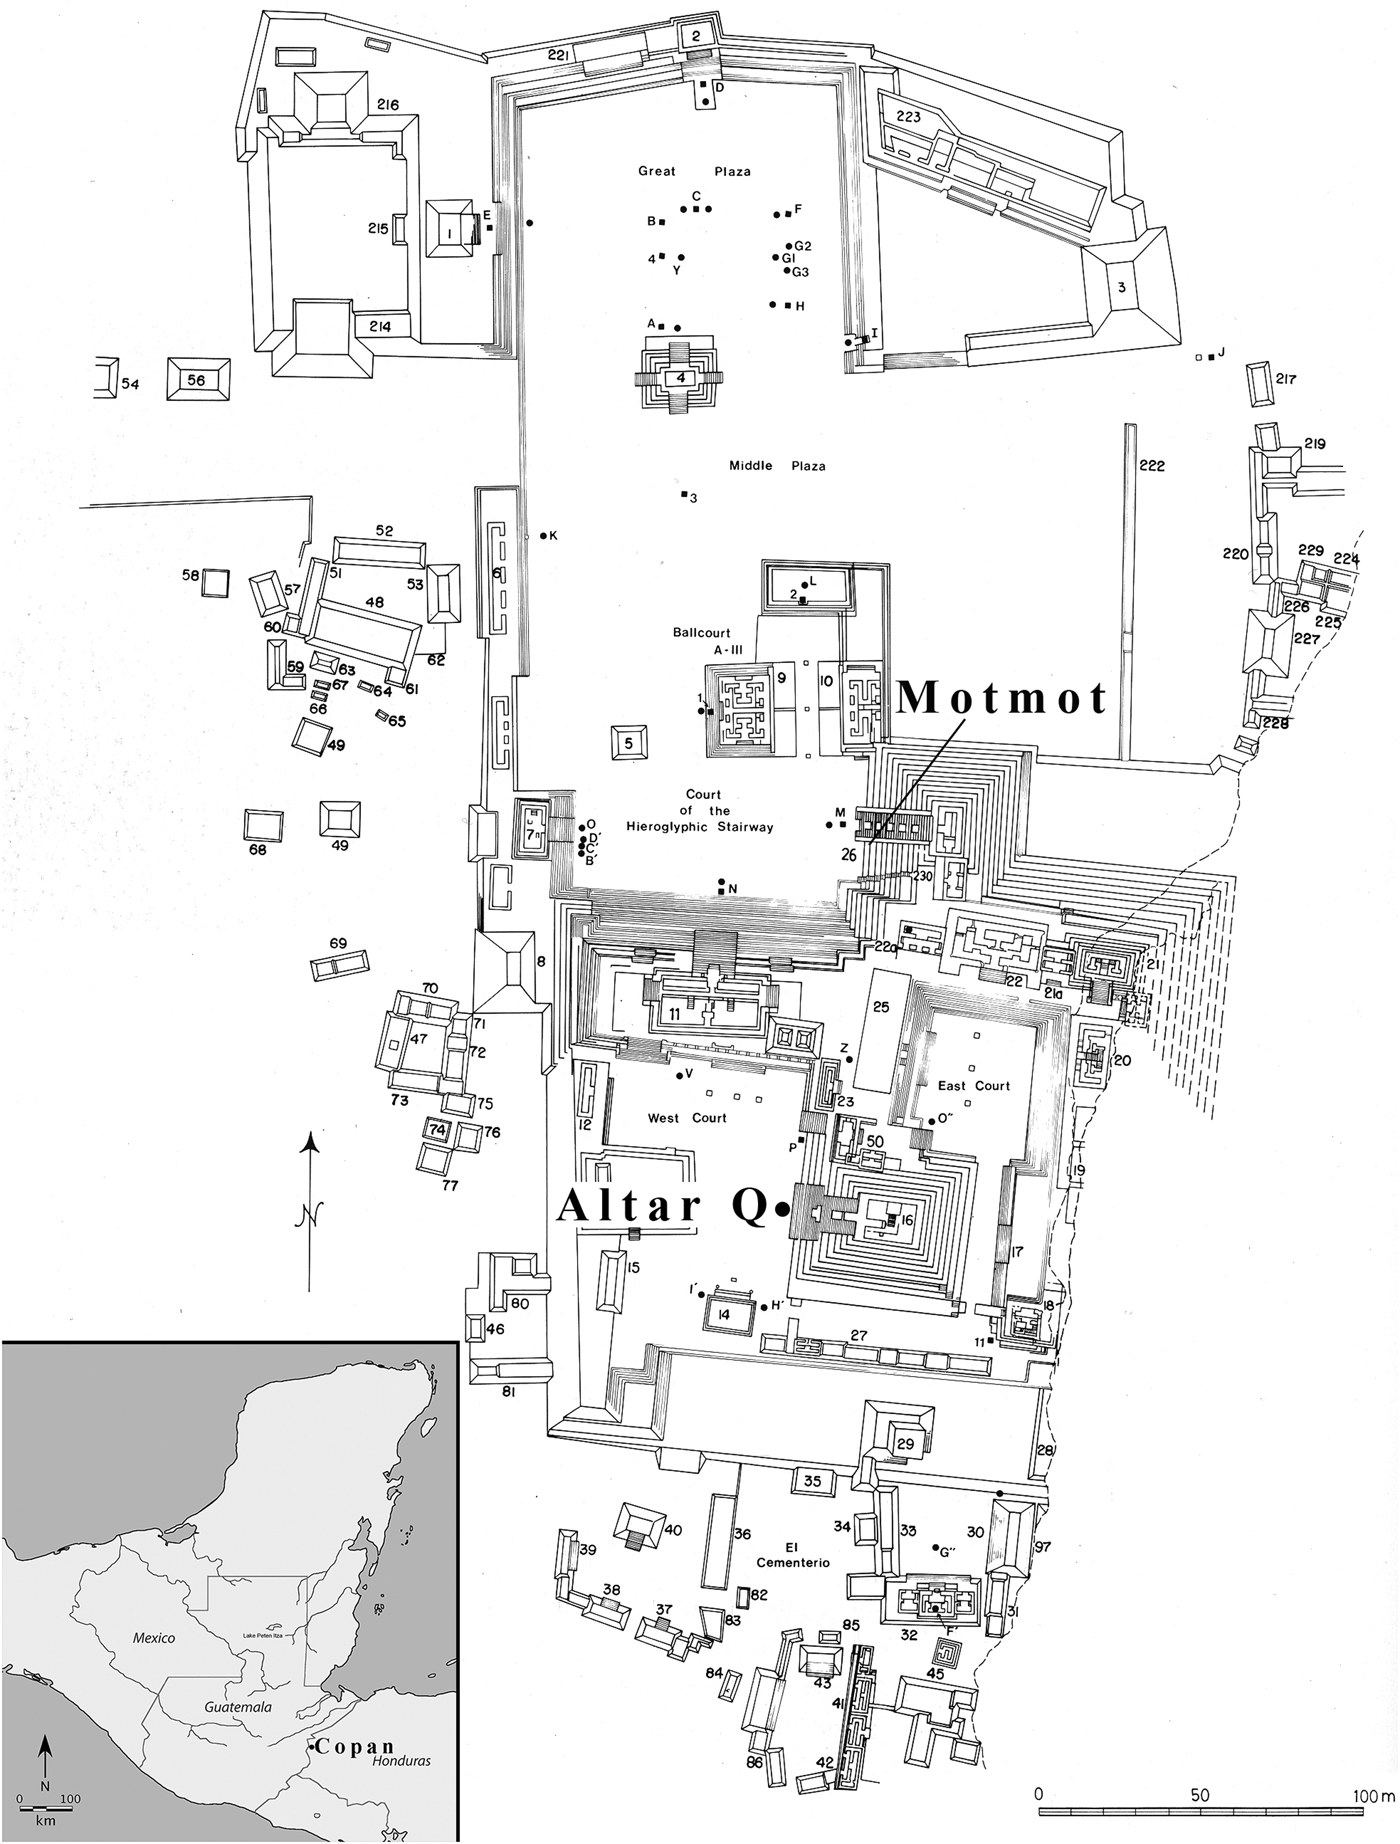
The Classic Maya city of Copan is a UNESCO World Heritage site located near the southeastern frontier of Mesoamerica in western Honduras. This enchanting Maya centre, famed for its elaborate sculptural and glyphic tradition, has been intensively excavated and documented for over a century (Fash Reference Fash2001; Reference Fash, Andrews and Fash2005; Fash et al. Reference Fash, Fash, Davis-Salazar, Bell, Canuto and Sharen2004). At the heart of the city lies the Principal Group, a civic-ceremonial district containing structures that housed Copan's ruling elite and the prominent Acropolis temples (Fig. 1). The Acropolis has been the subject of several high-profile archaeological expeditions involving extensive tunnelling into major monumental complexes replete with tombs of royal ancestors and grand offertory caches that attest to the prominence of the Copan dynasty.
Plan view drawing of Principal Group of Copan indicating location of Motmot and Altar Q assemblages. (Modified from Fash Reference Fash2001, fig. 8.)
Animal remains from finds within the Principal Group are mainly those which come from the offertory complex; reports of these remains typically comprise nothing more than perfunctory enumeration in taxonomic lists described by archaeologists (Beaubien Reference Beaubien and Emery2004). The most comprehensive review of fauna from the Principal Group was incorporated into a detailed zooarchaeological report published by Ballinger and Stomper (Reference Ballinger and Stomper2000). This review concerned a deposit of felids associated with Altar Q which will be described in more detail below. Settlement pattern surveys and excavations within other residential sites outside the ceremonial core have also yielded rich archaeological data attesting to the socio-political dynamics between the ruling elite in the ceremonial core and other elites throughout the Copan Valley, as well as commoners (Fash Reference Fash and Kolata1983; Willey et al. Reference Willey, Leventhal and Fash1978). Collins’ (Reference Collins2002) expansive sample of zooarchaeological remains from across the Copan Valley distinguished several status groups based on diet.
This paper developed from a concerted examination of three archaeological contexts, each of which contained evidence for ritualized usage of corporal animal forms. The objective of this examination is to resolve taxonomic identifications with greater precision and catalogue all surface modifications in order to reconstruct the ritual processes that employed these elements. A follow-up isotopic study of the animals’ oxygen, carbon and nitrogen values was conducted in order to further substantiate claims pertaining to their use and distribution (Sugiyama et al. Reference Sugiyama, Fash and France2018). We summarize each archaeological context in the following sections.
The Motmot assemblage
The earliest faunal assemblage examined was recovered from a stone-lined cylinder cist under the inscribed Motmot floor marker commemorating the royal accession of the son of the founding ruler K'inich Yax K'uk’ Mo’ to his father's office on the date 9.0.0.0.0 (ad 435) (Fash Reference Fash2001; Reference Fash, Andrews and Fash2005). The cache contained human remains of a young female adult, buried cross-legged on a reed mat, accompanied by many shell, lithic, jade and ceramic offerings (Fash et al. Reference Fash, Fash, Davis-Salazar, Bell, Canuto and Sharen2004, 69–74). It is noteworthy that one of the large jade pectorals from this deposit was decorated with the form of the Starry Deer-Crocodile. The complete puma skeleton found beside her suggests she was a highly esteemed day-keeper who was buried with her powerful spiritual co-essence, the puma. Other fauna scattered around the offering were primarily found inside the ceramic vessels, likely intended as food for the afterlife.
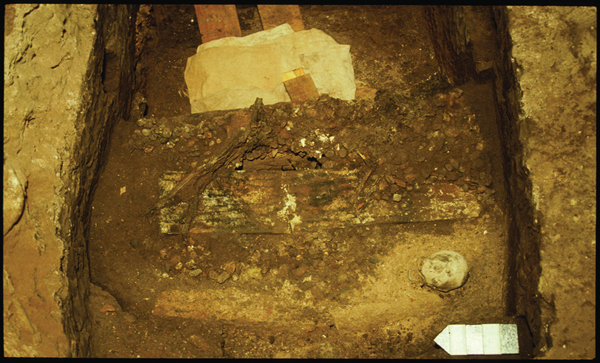
As described by Fash and his colleagues (Fash et al. Reference Fash, Fash, Davis-Salazar, Bell, Canuto and Sharen2004; Fash & Fash Reference Fash and Fash2016), this cache was re-entered in order to be terminated through a series of sealing acts. The first act saw the skulls of a deer and a male human placed inside the cist, after which the whole assemblage was set afire. The cist was then sealed by five long cut stones, upon which were placed the burnt skeleton of a decapitated and bound deer and several charred crocodile scutes (Fig. 2). A metre of sterile fill subsequently buried the animal remains atop the capstones sealing the cist. The fill was capped off by a final fire ignited on powdered cinnabar and the red-hot embers plus the weight of the limestone slab bearing the incised Motmot floor marker caused the cinnabar to disgorge rivulets of liquid mercury. The concluding ritual act took place perhaps 20 years later, when the inscribed floor marker was itself covered with other offerings and sealed with a large limestone slab (Fash et al. Reference Fash, Fash, Davis-Salazar, Bell, Canuto and Sharen2004).
Field photograph of the deer post-cranial bones and concentration of crocodilian scutes in situ. (Photograph: W. Fash.)

Shaman Burial, Plaza A of Group 9N-8
During the first half of the fifth century ad, contemporaneous with the Motmot cache, an elaborate burial was placed in Plaza A of Group 9N-8, outside the Principal Group. The interred individual was tentatively identified as a shaman based on the associated animal and other ritual accoutrements (Fash Reference Fash2001; Reference Fash, Andrews and Fash2005, 90). Grave goods consisted of many ceramic vessels, two with quartz stones (possibly used in divination), highly elaborate shell artifacts (including 110 spondylus-shell beads), a perishable polychrome object (highly deteriorated), as well as several faunal artifacts (Fash Reference Fash2001). Five stingray spines (utensils for auto-sacrifice), two turtle shells and one large collar or necklace composed of multiple materials were also identified. The individual exhibited indications of childhood enamel hypoplasia despite his apparent high status (Fash Reference Fash2001, 90–94). This assemblage represents fauna usage by elites situated outside the Principal Group and provides a valuable insight into the ways in which high elites were also negotiating their social identities via the same animal symbols utilized by the founding rulers of the city.
Altar Q
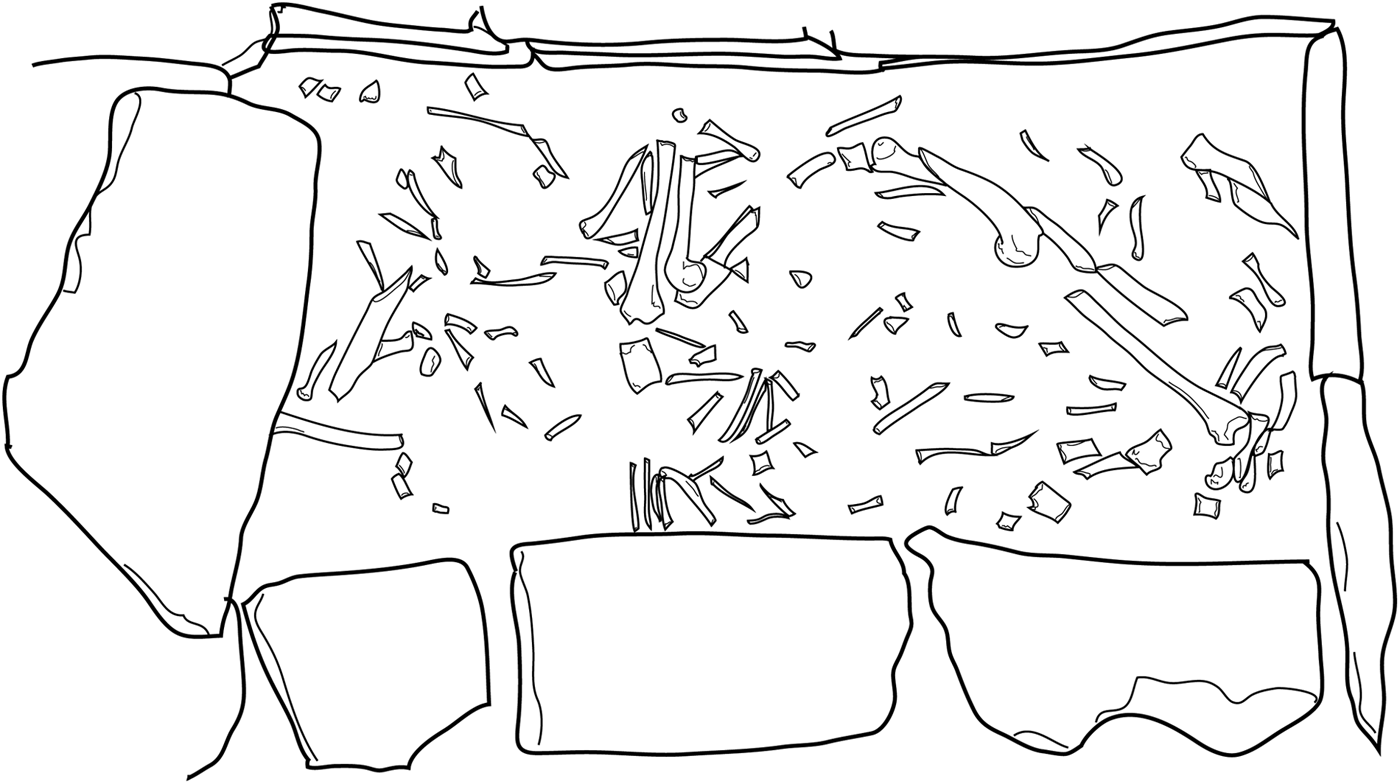
In 1988, as part of the Copan Acropolis Archaeological Project, an offering cache associated with an elaborate sculpture known as Altar Q was found in the Principal Group of the Acropolis in front of Structure 10L-16 (Temple 16). As an integral part of the completion of the final phase Temple 16 and the installation of Altar Q in front of it, in ad 776 Ruler 16 entombed a number of animals within a specially built stone masonry crypt (Fig. 3). The top of Altar Q describes the journey of the dynastic founder to Wiin-te’ Naah; foreign lands which are interpreted to be Teotihuacan (Stuart Reference Stuart, Carrasco, Jones and Sessions.2000). The apex of this journey was likely marked by a grand ceremony before the Sun Pyramid empowering him as the first ruler of Copan (Fash et al. Reference Fash, Tokovinine, Fash, Fash and López Luján2009). Altar Q was created as part of a large-scale building programme commenced during a period of deteriorating political stability, deforestation and population decline. Wrapping around the four sides of the altar is a king list beginning with the founder, K'inich Yax K'uk’ Mo’ (r. ad 426–437), who is depicted seated and facing Yax Pasaj (r. ad 763–810) (Martin & Grube Reference Martin and Grube2000; Stuart Reference Stuart1992) to whom he presents the baton of royal authority. The founder and array of 15 successive rulers legitimizes Yax Pasaj's authority as the rightful inheritor of this dynastic lineage.
Composite line drawing of the offertory cist next to Altar Q. Crypt dimensions: 131×48×117 cm. (Based on field photographs taken by W. Fash; drawing: N. Sugiyama.)

Ballinger and Stomper (Reference Ballinger and Stomper2000) previously analysed the zooarchaeological material from this cache and concluded that a minimum number of individuals (MNI) totalling 14 felids and 9 avian specimens were offered in the dedicatory ritual. Six felids were identified as jaguars. These conclusions led to the reconstruction of a glorifying ritual episode in which the final ruler of Copn, Yax Pasaj, sacrificed these ferocious jaguars upon the altar in dedication to his dynastic forebears. Jaguars are closely associated with rulership throughout Mesoamerica (Benson Reference Benson1972; Saunders Reference Saunders1989; Reference Saunders1994), and their sacrifice would have been a conspicuous invocation of the symbolic power commanded by these emblems of state identity, as if to quell the incipient rumblings of political destabilization threatening the integrity of the Copan dynasty.
Unfortunately, this particular reconstruction is difficult to corroborate with the data from the assemblage. Such a dedication, where a menagerie of primary sacrificial victims were all concurrently deposited in the cist, would have required multiple resource-intensive campaigns to capture so many of these apex predators at the same time from their specialized and far-flung niches. This would be an extraordinary feat for a Copan kingdom even at the height of its strength, let alone a Copan beset by terminal political strain and environmental deterioration. Jaguar males relentlessly patrol their extensive territorial domains and are quite intolerant of incursions by other males. Collectively, this behaviour typically leads to the formation of a mutually exclusive patchwork of solitary home ranges within which females develop similar, but more densely concentrated ranges (Rabinowitz & Nottingham Reference Rabinowitz and Nottingham1986). For example, a recent survey of jaguar populations near Pantanal, Brazil, found that females ranged over 25–38 sq. km while males required twice as much terrain (Schaller & Drawshaw Reference Schaller and Drawshaw1980). Range size is partly governed by prey availability: in the tropical lowlands of Belize, highly abundant prey contributed to much more compact territorial domains, with male ranges as small as 33.4 sq. km and female ranges as small as 10 sq. km (Rabinowitz & Nottingham Reference Rabinowitz and Nottingham1986).
Compare these ranges with the compass of the entire Copan Valley at roughly 42 sq. km and it becomes apparent that even under ideal conditions collecting 14 wild felids, including six jaguars, would necessitate fielding multiple successful trapping expeditions with each party venturing well outside the valley. When Ballinger and Stomper (Reference Ballinger and Stomper2000) used upper thresholds of jaguar density calculated to yield home ranges as low as 8 sq. km, they concluded that even this optimal scenario only allows for five jaguars to be locally available at any given time. Thus, the conclusion that Copan could commit sufficient resources, manpower and time to the capture of six jaguars plus another eight felids for a single sacrificial dedication (Ballinger & Stomper Reference Ballinger and Stomper2000, 232) finds little justification in the available data. Support for this claim is further undermined by structural considerations arising from the urbanization of the Copan pocket and deforestation of the valley, both being forces hypothesized to have accelerated the decline of the Copan state. Furthermore, of the 14 felids identified, all but one were adults and none have pathological indicators of captivity.
This is why a puma (Puma concolor) skeleton was studied comparatively during their re-analyses. Pumas occupy the largest and most diverse habitat range of all feline species in the Americas. They are as comfortable in swamplands and páramos as they are in dense jungles, temperate woodlands and high-altitude coniferous forests, and can be found at elevations from sea level to 5000 m above sea level (de la Rosa & Nocke Reference de la Rosa and Nocke2000). Puma and jaguar are highly similar morphologically and where their distributions overlap, as they did in the Copan Valley, they are direct competitors for many resources. The puma's territorial habitat is even more extensive than that of the jaguar and varies drastically with seasonality, environment, prey availability and intrinsic factors of the puma itself (age, sex, body size, etc.) (Grigione et al. Reference Grigione, Beier, Hopkins, Neal, Padley, Schonewald and Johnson2002; Seidensticker et al. Reference Seidensticker, Hornocker, Wiles and Messick1973). For example, a case study conducted along the California coastal range and the Sierra Nevada mountains reported mean home ranges of 90 sq. km in the summer and 100 sq. km in the winter for females, while for males these values fluctuated between 300 sq. km in the summer and 350 sq. km in the winter (Grigione et al. Reference Grigione, Beier, Hopkins, Neal, Padley, Schonewald and Johnson2002).
Smaller felid species local to the Copan Valley include the ocelot (Leopardus pardalis), the margay (Felis wiedii) and the jaguarondi (Felis yagurarondi). The ocelot and margay have pelage markings that may have favoured their substitution for jaguars in cases when the latter were difficult to acquire. While no felids smaller than a puma were identified by Ballinger and Stomper (Reference Ballinger and Stomper2000), special effort was made during our re-analysis to acquire species-level identification.
Ballinger and Stomper (Reference Ballinger and Stomper2000) suggested a combination of trade, hunting and hand-rearing as a solution to this sourcing dilemma, although their zooarchaeological data did not directly address this scenario. Several alternative and mutually compatible hypotheses were tested during re-analysis: 1) several felid species besides the jaguar were incorporated into the offering; 2) the skeletal remains represent not only primary sacrificial victims, but secondary animal products; and 3) the requisite felid count was reached either by captivity or trade in order to augment the supply available from local wild sources. Re-analysis thus focused on performing updated calculations of MNI metrics, species-level identification and recording the taphonomic history, surface modifications and element distributions to evaluate each of these hypotheses.
Zooarchaeological methods and results
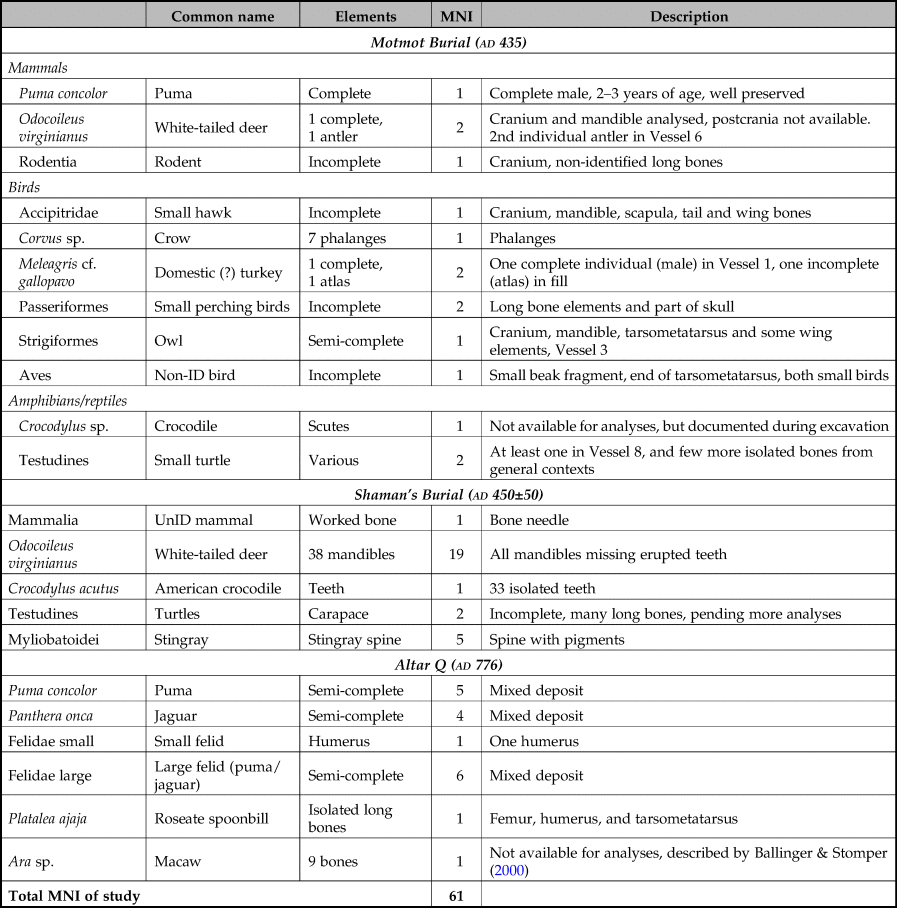
Standard zooarchaeological methods for recording the species, side and surface modification of each element were performed on the three assemblages to varying degrees of detail depending on prior work (Reitz & Wing Reference Reitz and Wing2004). These data were collected over the course of two laboratory consultations at the Centro Regional de Investigaciones Arqueológicas (CRIA) in Copan, Honduras, by Sugiyama, once in summer 2008 when the Altar Q faunal assemblage was re-analysed and again during summer 2014 when the primary objective of the trip was to obtain isotope samples (Sugiyama et al. Reference Sugiyama, Fash and France2018). During this second visit other contexts were also analysed in order to gather zooarchaeological and isotopic data from wider temporal and spatial spans. A summary of these results can be consulted in Table 1.
Summary of zooarchaeological assemblage from this study.

The Motmot assemblage
No comprehensive zooarchaeological analyses of the fauna extracted below the Motmot floor marker had been published. While the entire collection could not be analysed to satisfaction due to time constraints, a general picture of most of the fauna associated with the assemblage was composed despite incomplete identification of miscellaneous fill elements.
Within the cache, a complete deer skull of a young individual (1–1.5 years old) exhibited lower premolar 1–3 in mid-eruption, and its upper dentition still retained the deciduous 1–3 premolar (Gilbert Reference Gilbert1980, 100–101). A second deer identified as a male deer between 1.5 and 2.5 years of age was represented by two antlers placed inside a ceramic offering, Vessel 6. The ends of these antlers were highly polished and terminated in sharp points. The deer skull and a male human skull, both scorched black by fire, were placed by the female human's feet.
The complete puma (Puma concolor) skeleton, identified as a male due to its prominent sagittal crest, was the focus of the zooarchaeogical inquiry. Its teeth were fully erupted (which occurs by one year of age), though its coronal suture and spheno-occipital synchrondrosis were still unfused. Its long bones were mostly fused, although several elements still clearly retained fusion lines, suggesting this individual was a young adult between 2 and 3 years of age. The puma apparently was in relatively good health at the time of death. No surface modifications indicative of captivity nor cause of death were found. This was in sharp contrast to the felid skeletons analysed at Teotihuacan, where animal captivity was strongly signalled by an abundance of trauma and disease pathologies, including fractured limbs and ante-mortem injuries (Sugiyama et al. Reference Sugiyama, Somerville and Schoeninger2015).
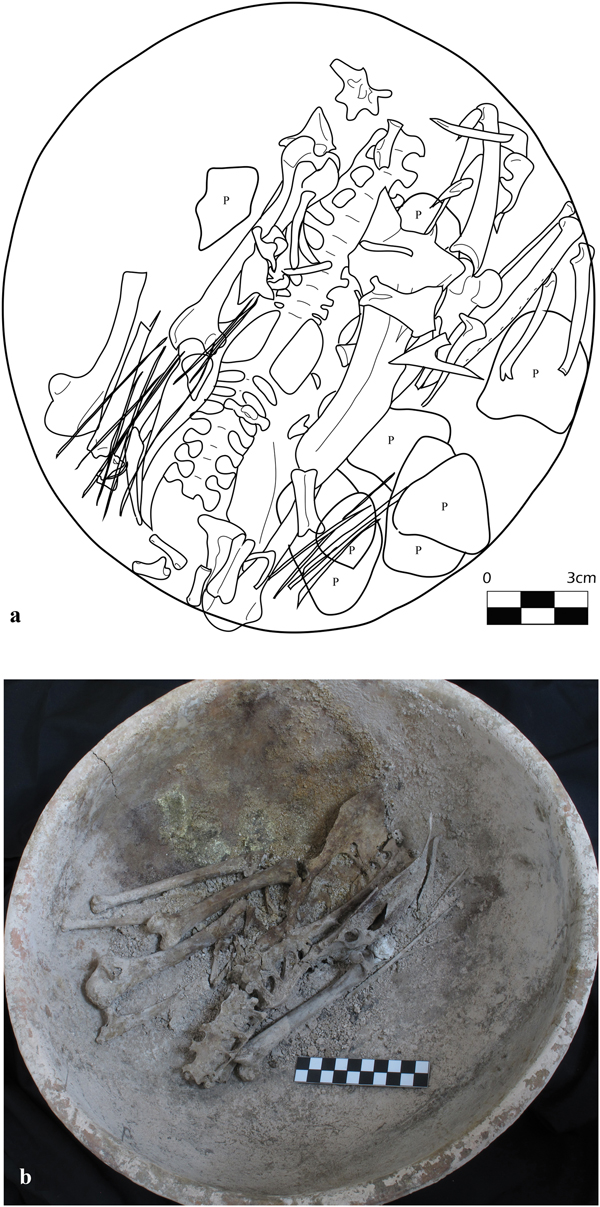
A large ceramic basin (Vessel 1) contained the remains of a nearly complete turkey still in its original semi-articulated configuration, suggestive of an offering as a meal for the afterlife (Fig. 4). The missing remains, which largely consist of small and easily scattered bones like phalanges, ribs and wing elements, may have been displaced during excavation or curation. Species-level distinction between the domesticated turkey (Meleagris gallopavo) and the wild ocellated turkey (M. ocellata), both of which are not locally available, is challenging. However, this semi-complete male (identified by the presence of spurs) is likely that of the domestic turkey due to several morphological traits outlined by Emery and colleagues (Reference Emery, Thornton, Sharpe, Cunningham-Smith, Duffy and McIntosh2016), such as the deltoid crest shape, wide and deep capital groove, etc. on the humerus. Additional metric data could further confirm this identification as M. gallopavo. Bone discoloration patterns indicate the cache was burnt after all the flesh had decayed during re-entry during termination rituals. The second turkey identified corresponds to an atlas, larger in size, recovered from the fill.
Turkey skeleton in Vessel 1: (a) drawing generated from overlaying excavation drawings (P = piedra, rock); and (b) photograph of skeleton in the vessel as preserved today.

Several other avian specimens were identified. Vessel 3 contained the remains of an owl (Strigiformes) cranium, mandible, tarsometatarsus and some wing elements. A head, part of the shoulder, wing bones and caudal vertebrae of a small hawk (Accipitridae) were also recognized. Seven phalanges of a crow were identified on the floor of the crypt. Two small perching birds were also interred with the burial (one semi-complete and another including only the head with some wing and hind limb elements). At least one small turtle was identified from Vessel 8, although other turtle elements were also present among other materials collected from the area surrounding the vessels that were not piece plotted.
Excavation records document that scutes (identified by Randolph Widmer as crocodilian) and deer post-cranial bones were found atop the capstone (Fash et al. Reference Fash, Fash, Davis-Salazar, Bell, Canuto and Sharen2004), but neither the scutes nor the deer post-cranial bones were available for analysis. Excavators note that the deer cranium identified in the cache was probably the counterpart of the post-cranial bones, similarly burnt, deposited during the termination of the offering. However, we were unable to test the fit along the articular surface or determine age/size correspondence because of the badly burned and deteriorated state of the skeletal remains. The deliberate inclusion of deer and crocodilian elements into the termination ritual and the depiction of a mythological hybrid deer-crocodile figure on the jade pectoral inside the offering cache itself suggest that the Starry Deer-Crocodile was the central referent in this ritualized act (Fash & Fash Reference Fash and Fash2016).
The Shaman burial
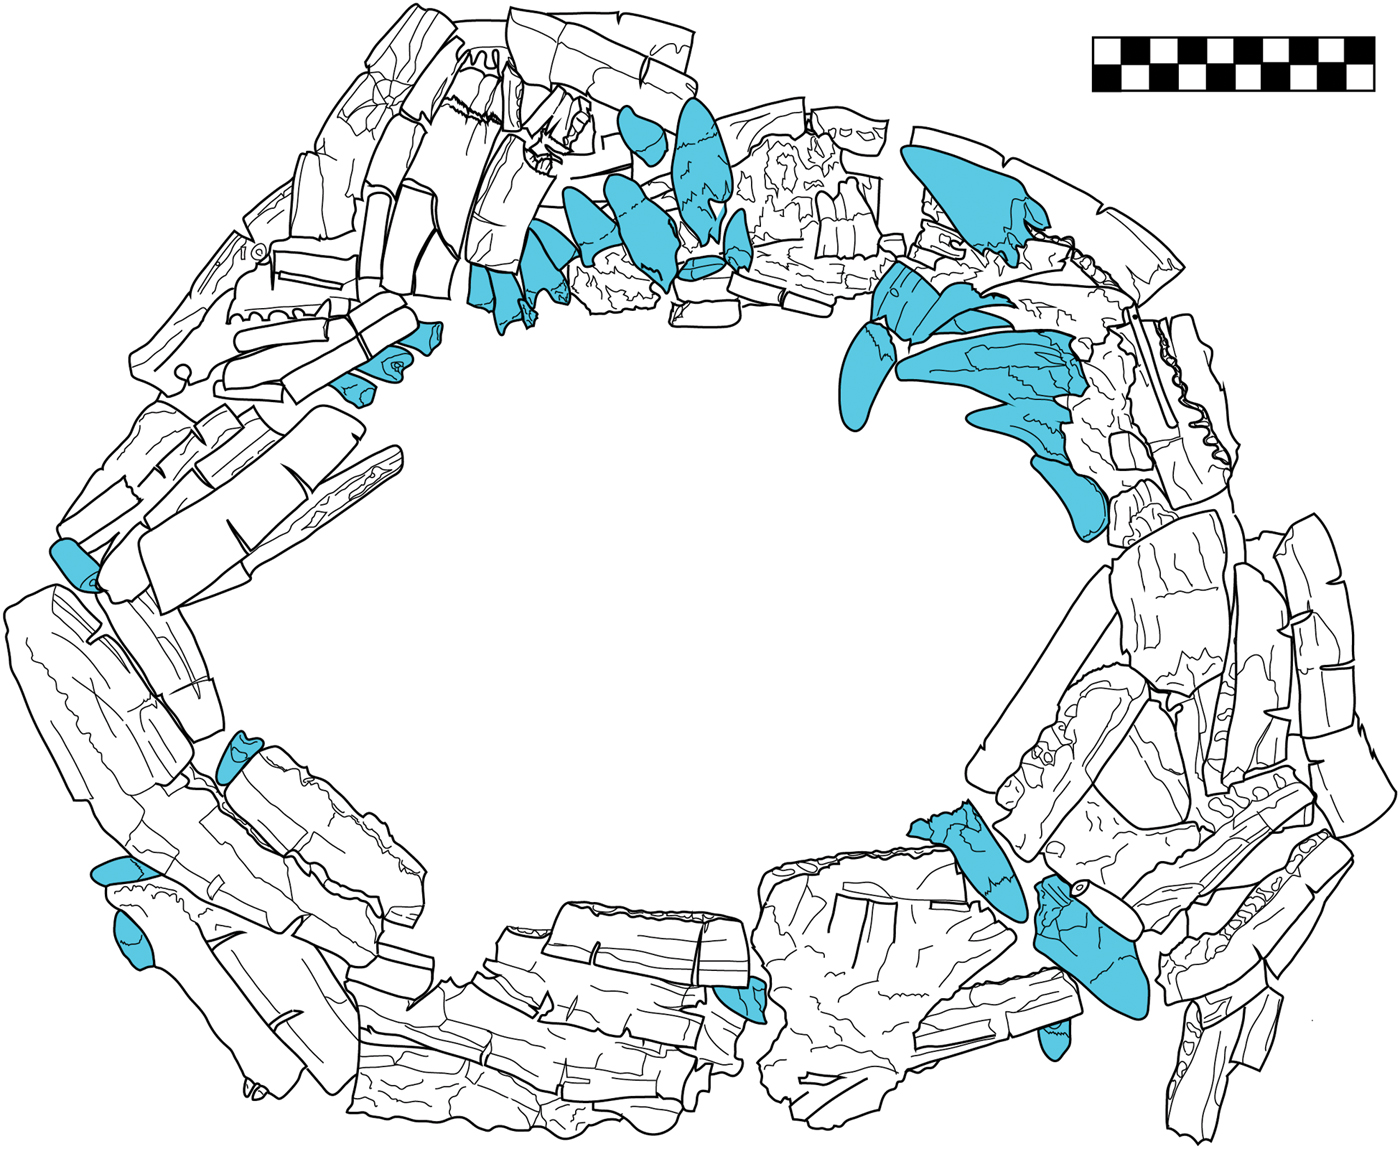
The most prominent feature analysed from this cache was a unique collar, possibly a necklace, located just to the east of the individual's head. This element is composed of an MNI of 19 deer, represented solely by mandibles. The circular arrangement of lower jaws is accented by loose crocodilian teeth (coloured in the line drawing), totalling an MNI of one crocodile (Fig. 5). The entire assemblage was smothered under the weight of the fill, requiring the entire feature to be consolidated in situ and extracted whole in the original arrangement rendered in the line drawing. Four stingray spines were found in the centre of this necklace, with a fifth spine adhered to the bottom on the back. Some of the red ochre originally sprinkled on this feature remains visible on its surface. The combination of the powder-like state of many of the bones and the consolidants applied to preserve them made discerning subtle surface modifications a difficult task. Nonetheless, most of the deer mandibles displayed a common modification in the form of two large slits carved perpendicular to the mandibular body. These incisions would have been useful for anchoring the disparate elements into a specific configuration. Many of the mandibles exhibited fine striations, likely a result of polishing, but no other surface features nor pathologies were noted at the time.
Plan view drawing of deer mandibles and crocodile teeth collar from Burial VIII-36, Plaza A of group 9N-8. Crocodile teeth are shaded. (Drawing: N. Sugiyama.)
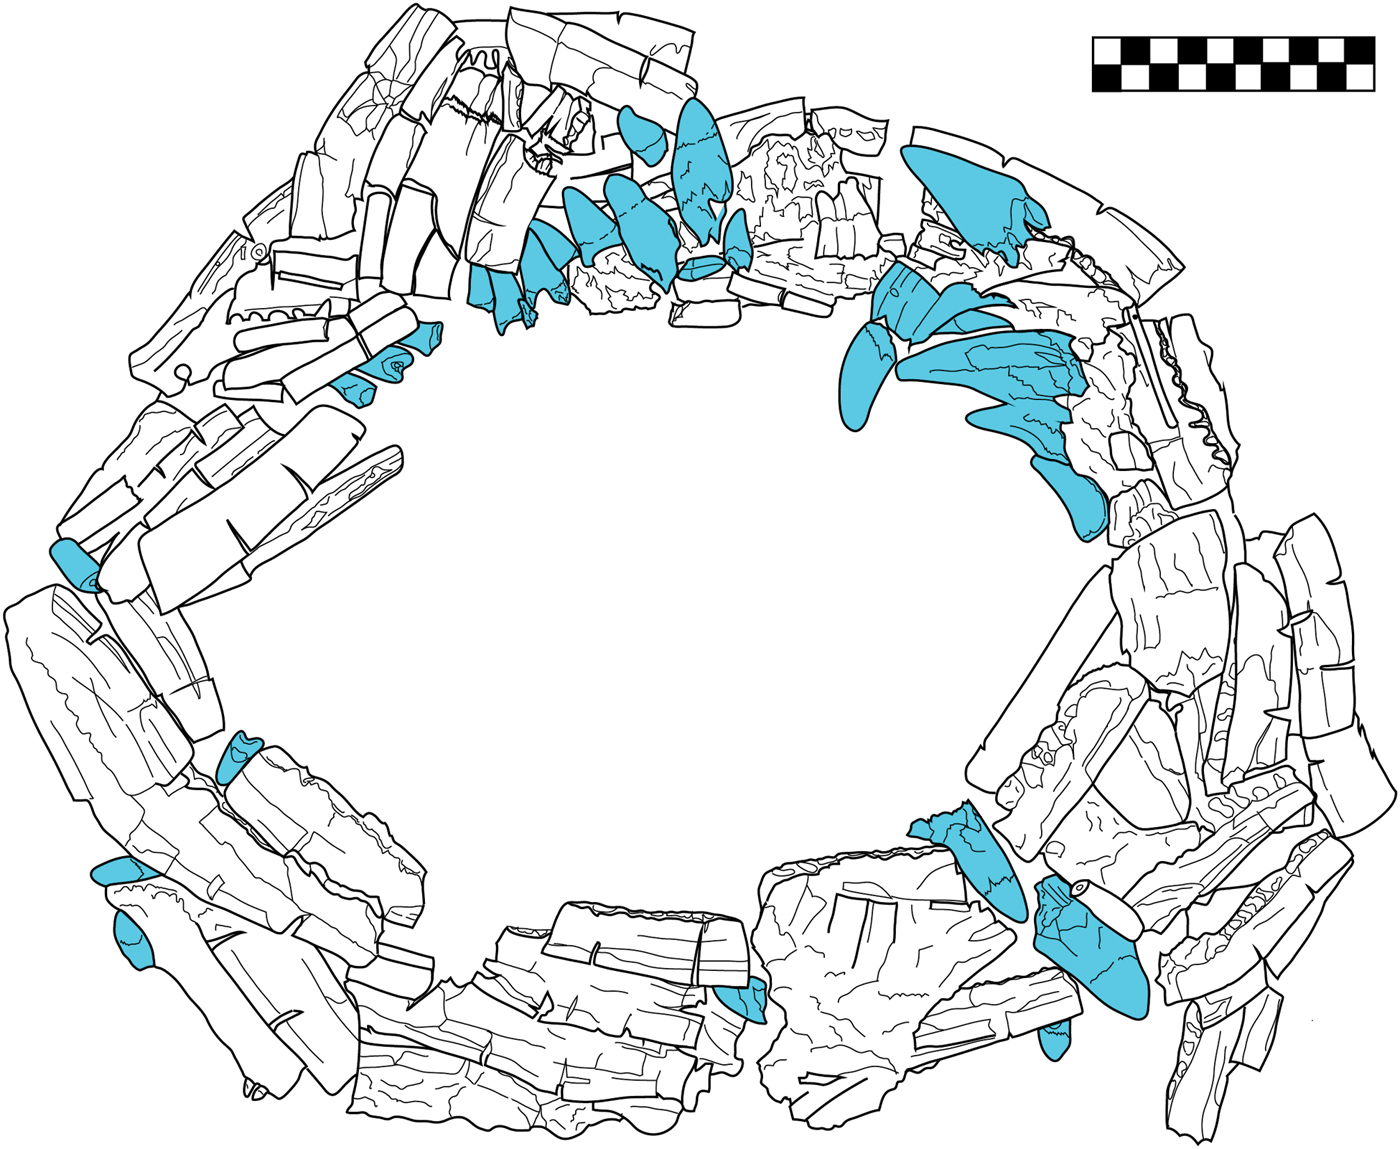
There was no apparent preferred age range evident from the selection of deer mandibles; they span from young adults with teeth still erupting in the sockets to full adult mandibles. Erupted dentition was entirely absent, having been intentionally extracted from the mandibles. Thus, no wear patterns could be detected which could have allowed for more accurate age profiles. Instead, several isolated crocodilian teeth were found mingled, seemingly intended as substitutes for the absent natural deer dentition. The deliberate combination of deer mandibles and crocodilian teeth into this feature proves corporal animal forms were manipulated as material manifestations of a deer-crocodile hybrid creature, similar to and possibly representing the Starry Deer-Crocodile.
Altar Q
Re-analysis of Altar Q followed up on the initial identifications and interpretations by Ballinger and Stomper (Reference Ballinger and Stomper2000), including the re-assessment of the MNI, species-level identification and recording the taphonomic history through surface modification. Modern comparative materials at the Instituto de Biología of the National Autonomous University of Mexico and the National Museum of Natural History, Smithsonian Institution, were the basis for species-level identifications.
MNI and species identification
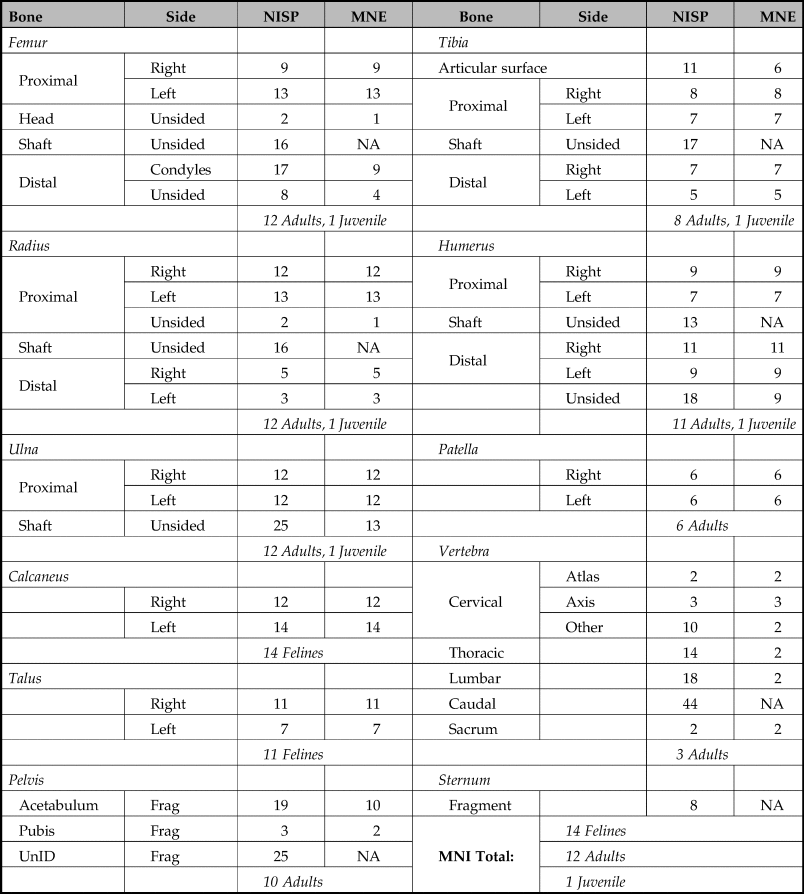
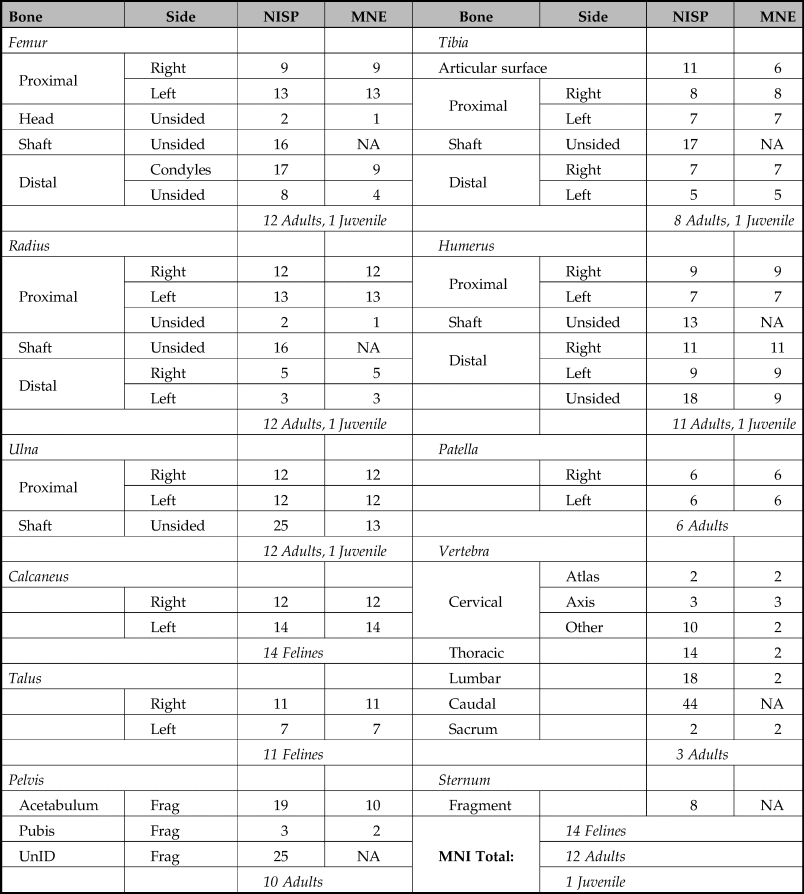
Ballinger and Stomper (Reference Ballinger and Stomper2000) calculated MNI using weight-bearing bones (calcaneous) and performed species identification using cranial (particularly occipital) fragments. They arrived at a felid MNI of 14, including a single juvenile (Ballinger Reference Ballinger1988). Ballinger's (Reference Ballinger1988) element distribution chart (Table 2) reveals consistent preservation between quantities of right versus left sides of each element. Differential preservation favours long bones and compact bones (e.g. calcaneous and talus), while quantities of irregular bones (e.g. vertebrae, pelvis, sternum, crania) are disproportionately reduced due to the effects of density-mediated destruction (Marean & Frey Reference Marean and Frey1997). This element distribution is consistent with the paucity of cranial fragments, which are fragile and relatively prone to disintegration from taphonomic processes. Ballinger and Stomper (Reference Ballinger and Stomper2000), however, attribute this pattern to ancient curation practices, suggesting heads were cut off and utilized for other functions.
Feline MNE and MNI calculations based on post-cranial bones by Ballinger (Reference Ballinger1988).
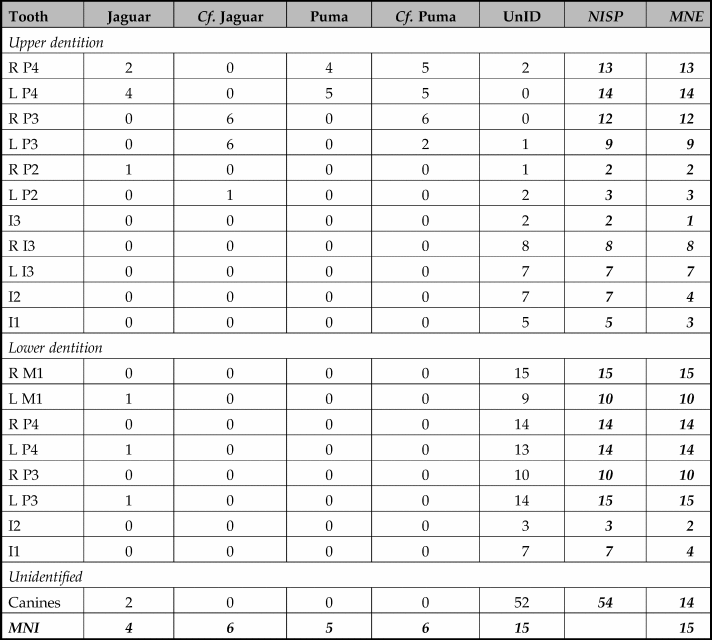
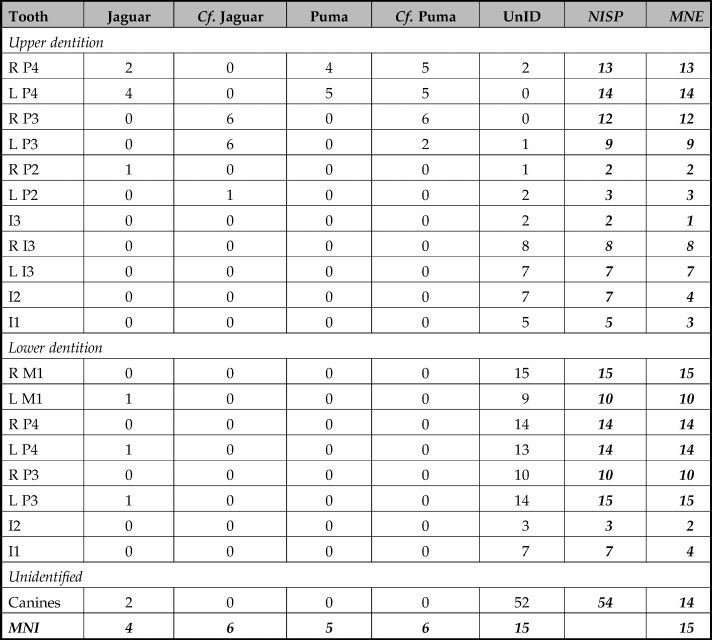
Present MNI calculations targeted elements with both high survivability and those reliably diagnostic of species. In Table 3, the number of identifiable specimens (NISP) and the minimum number of elements (MNE) based on dentition are tabulated. The MNI for this assemblage based on dentition is 15, accounting for one more individual than previous publications. There is variation on the MNE of each tooth, presumably due to differential preservation and recovery rate based on tooth size. Molars are the most reliable teeth upon which to base MNI calculations because their robust physical forms preserve well and are more likely to survive the screening process (incisors tend to get lost), as well as being easier to side and bearing distinct morphological features for species-level identification. With both the lower first molar and lower third premolar accounting for 15 individuals, it is increasingly evident that the absence of cranial fragments observed by Ballinger was not due to curation practices, but a consequence of differential preservation.
Table of feline NISP and MNE of each tooth. Total NISP 224 teeth. Cf. tentative identification.
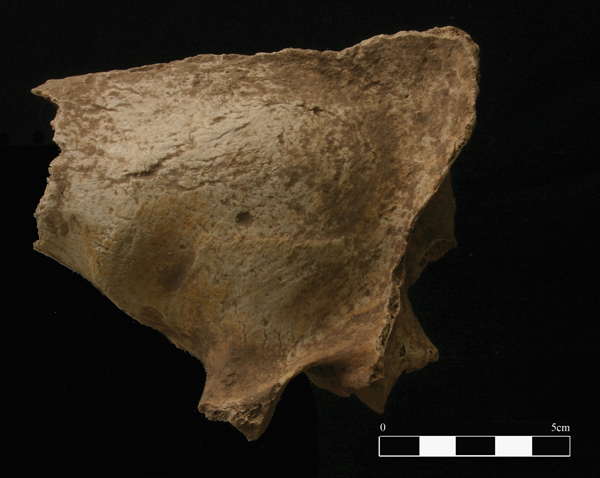
Distinguishing between feline species, particularly those as morphologically close as jaguars and pumas, is extremely difficult and often requires a robust comparative collection and a thorough examination of subtle distinctive qualities in the teeth and crania. Due to intra-species variation (age, sex and sub-species), size alone is often inadequately diagnostic of species. Ballinger and Stomper's (Reference Ballinger and Stomper2000) description states original species identification was based on posterior features of the cranium as outlined in Olsen (Reference Olsen1964). At the time of our reanalysis, only one semi-complete cranium was preserved well enough to identify these features as those of a jaguar (Fig. 6). Due to the scarcity of preserved complete cranial elements, the dentition was reanalysed to determine whether the assemblage contained any species other than the jaguars identified by Ballinger and Stomper.
Semi-complete cranium of a jaguar from Altar Q.

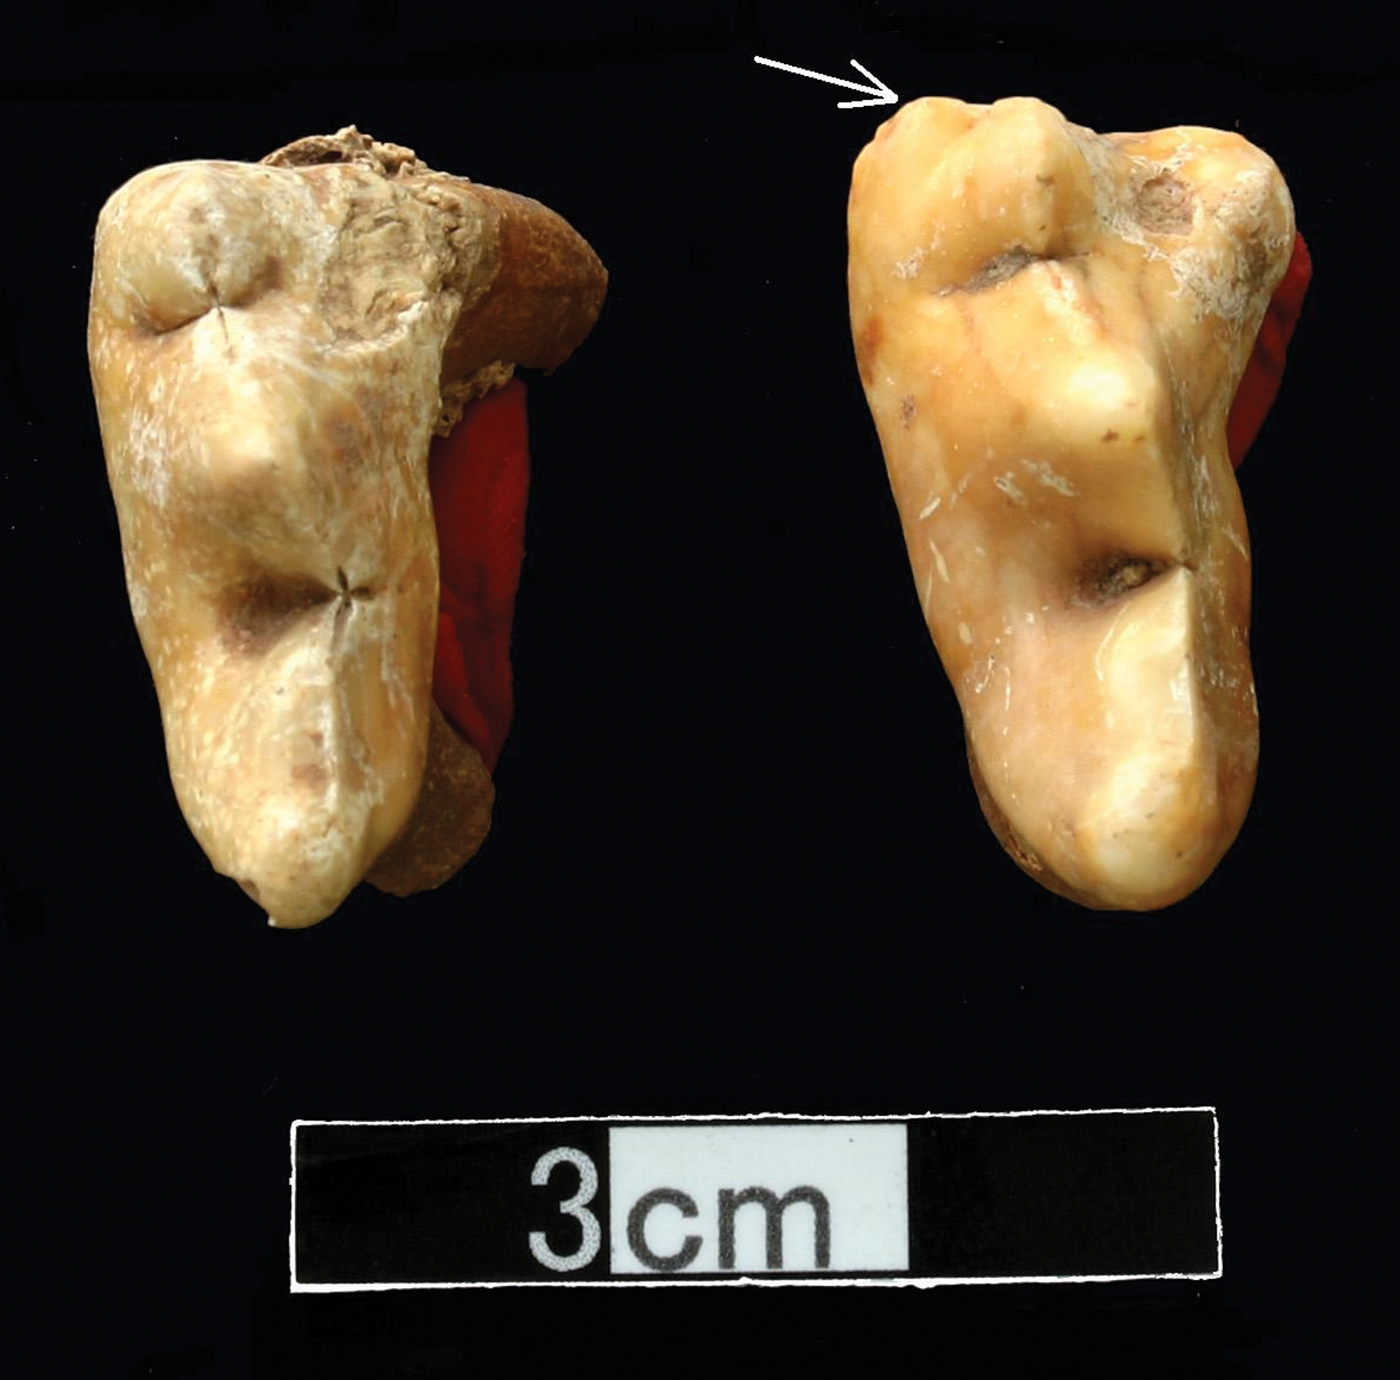
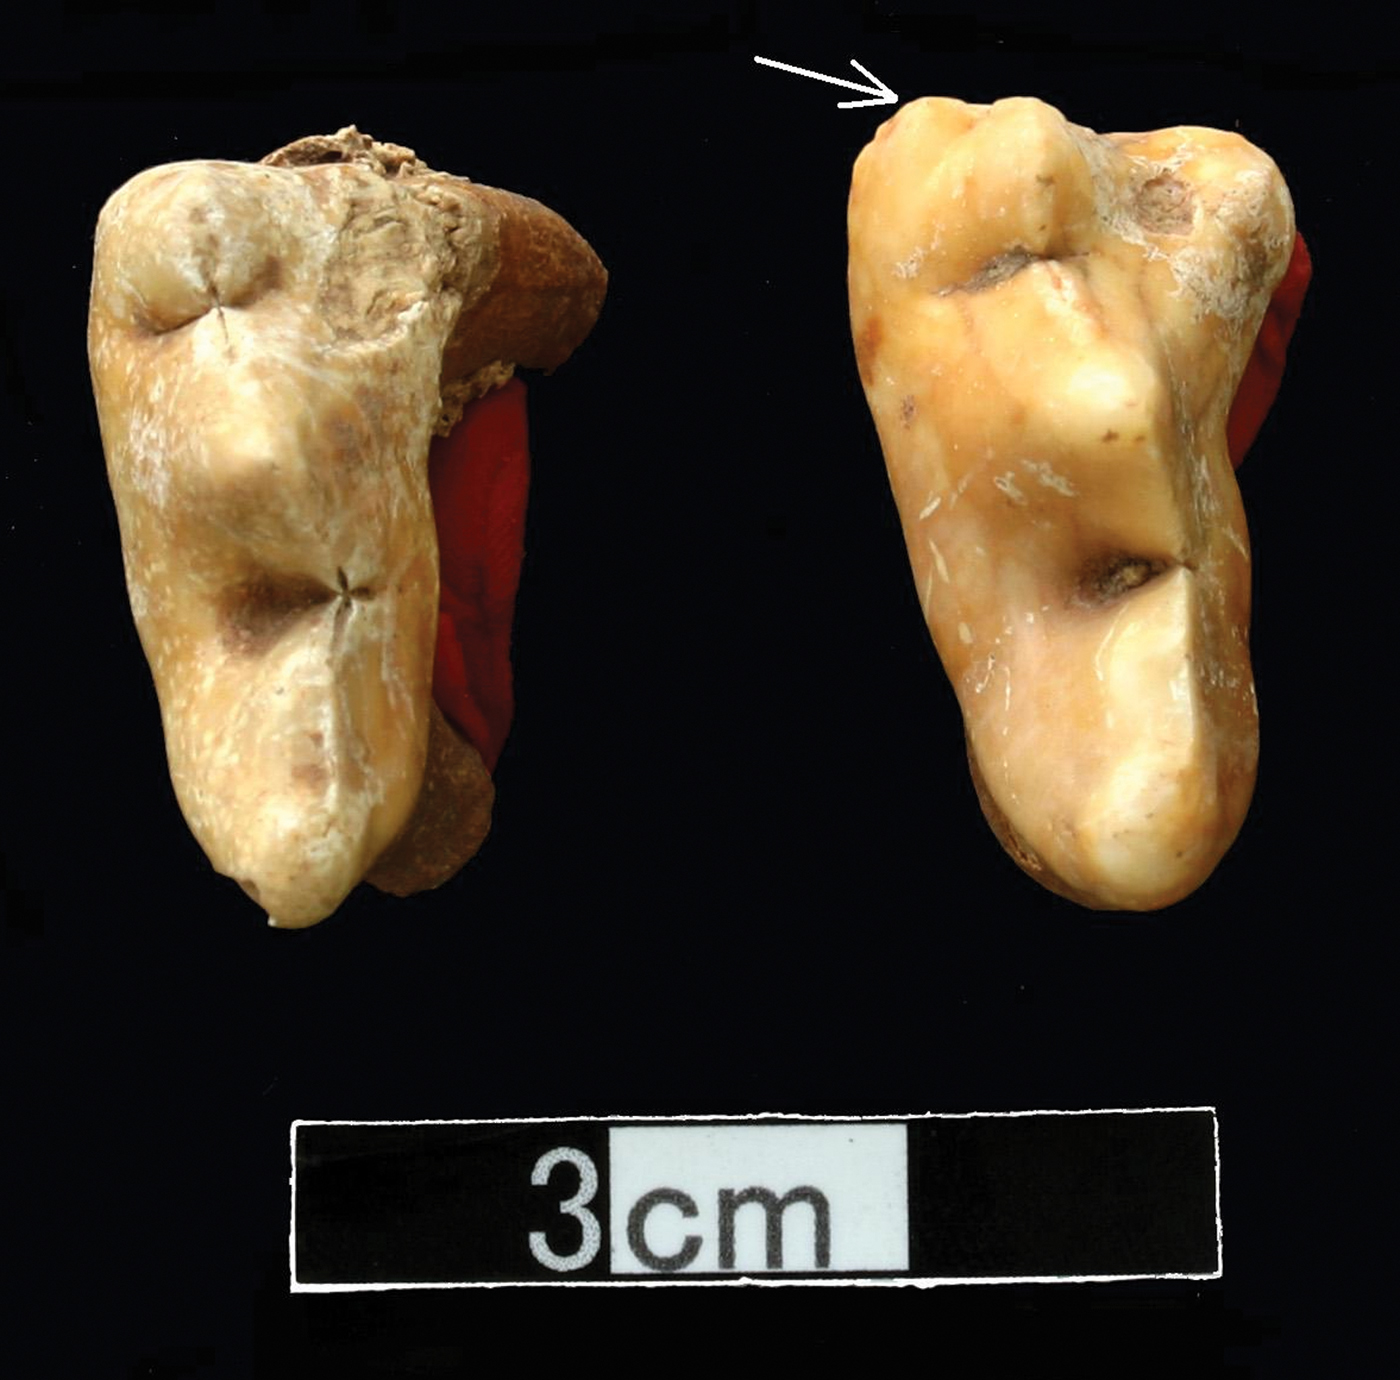
One marked characteristic feature is found on the upper fourth premolar (P4). Adult jaguars tend to have an extra cusp on the upper P4 not found in adult pumas from southern tropical climates (Fig. 7) (Sugiyama Reference Sugiyama2014). While comparative materials show the occasional presence of a small cusp among some puma sub-species on their deciduous teeth, this feature is reduced to an insignificant bump or disappears completely on their permanent dentition. Based on this criterion, at least five individuals can be confidently identified as pumas, while an additional four are likewise jaguars. There were no deciduous teeth recovered in this collection, suggesting the assemblage was primarily of adult felines, but this may be due to differential preservation.
Comparison of puma (left) and jaguar (right) upper fourth premolar, arrow indicates the extra cusp.
The remarkably consistent post-cranial morphology of felids, as a group, tends to make species-level identification notoriously difficult. Yet one incomplete humerus in the collection was far too small and gracile to have come from a puma or a jaguar, though it still had the characteristically long, outward flaring and distinctive supracondylar ridge of a felid approximately jaguarondi or ocelot in size. As dentition analysis indicated that all the molars analyzsed were of either puma or jaguar origin, this humerus represents an additional individual, bringing the final total to 16 felids interred in the offering. In accordance with the traditional practices of ancestor worship, this would have made for a total sacrificial headcount of 16 animals: one for each past ruler with a final animal dedicated to the contemporaneous 16th ruler himself.
Surface modification
Surface modifications attest to the taphonomic and cultural processes affecting the skeletal remains. Although the offering cache was entirely sealed, the felid body parts were found disarticulated, making it so difficult to distinguish one individual from another that this assemblage was dubbed ‘jaguar stew’ in the field (W. Fash pers. comm., 2008; see Figure 3). While this chaotic distribution pattern was tentatively attributed to evident rodent disturbance, comprehensive analysis of weathering patterns and surface modification suggest possible alternative conclusions.
Weathering stages reflect periods of bone surface exposure prior to burial and can reveal the time period over which bones accumulated in an assemblage (Behrensmeyer Reference Behrensmeyer1978). However, it is important to recognize that surface cracking patterns resembling those caused by weathering can also result from water infiltrating the bones. Variable weathering stages on individual elements were noted at the time of analysis. If these represent differential weathering stages, it suggests that some of the felid skeletons were exposed to varying degrees of weathering prior to their deposition into the crypt at Altar Q. Given the assumption that this assemblage represented a primary burial of sacrificed felids that were placed into a sealed crypt in situ, the hypothesis that some of the bones were weathered is counterintuitive.
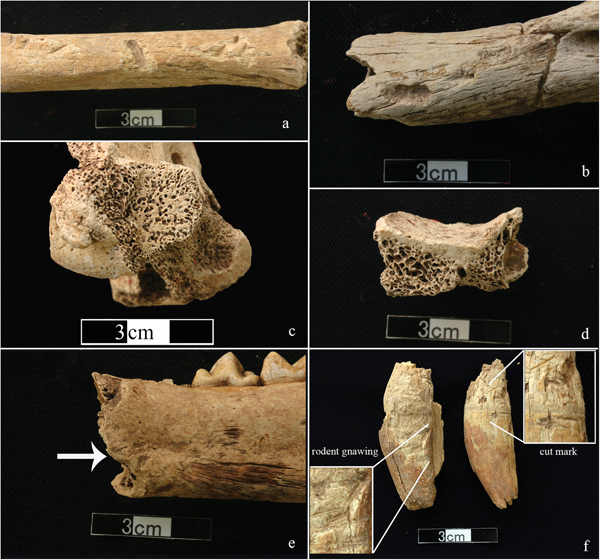
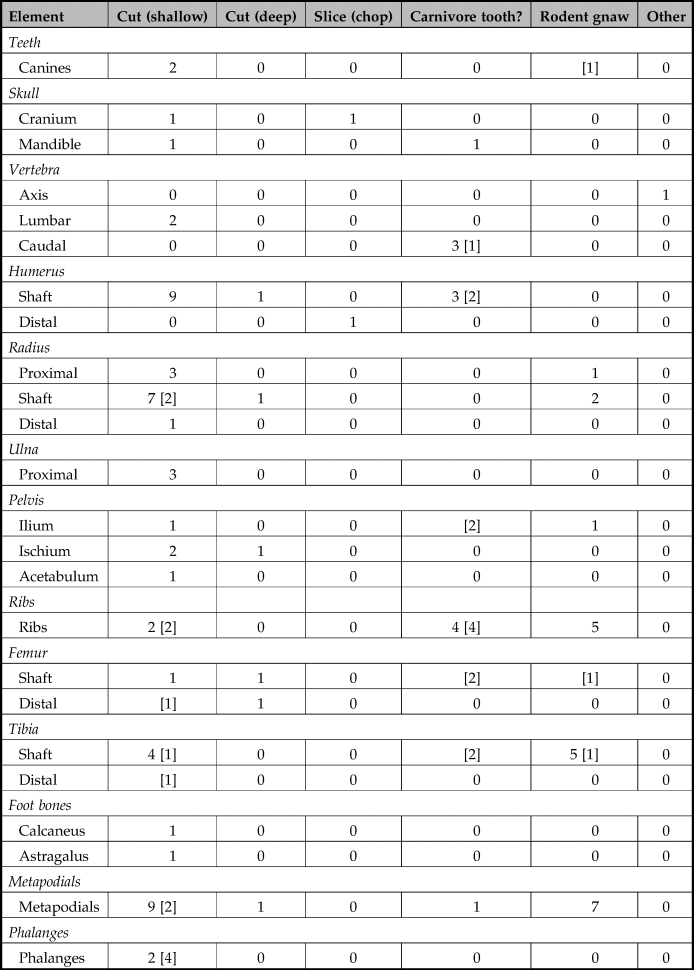
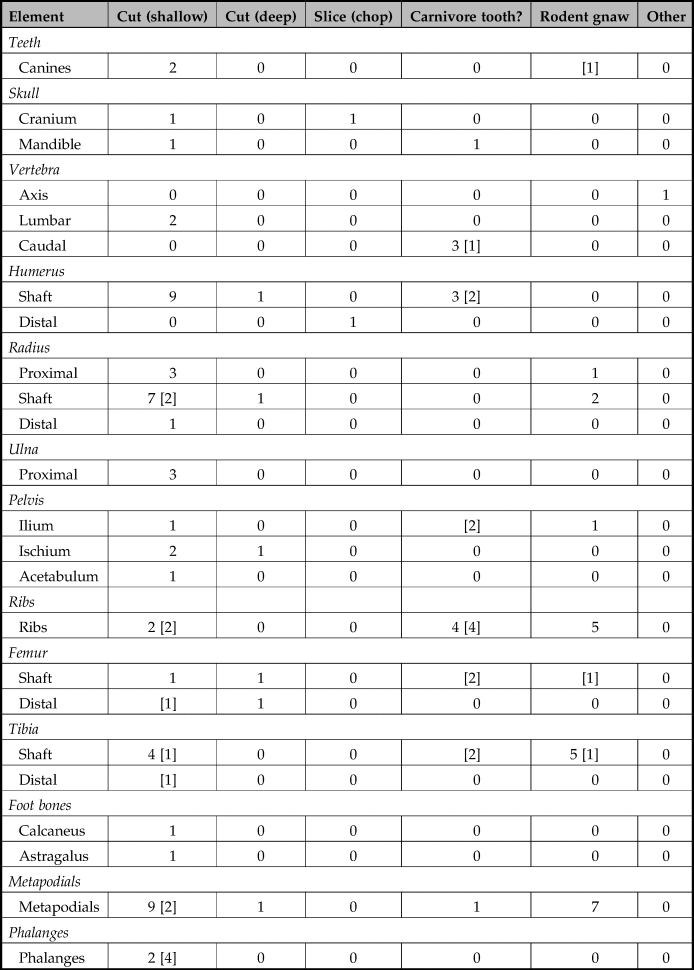
Table 4 reports the distribution of surface modifications: cutmarks, rodent gnawing, root marks and possible carnivore tooth marks (Fig. 8). Isolated rodent gnaw marks can resemble cutmarks, so only those cuts too deep for rodent bite patterns were tallied. Chop marks, a special case of cut marks where the cut runs nearly perpendicular through the bone, were also recorded on this assemblage. In the case of a distal humerus, it was determined that weathering occurred prior to the chop, which would mean that bone manipulation must have occurred after weathering and final secondary deposition into the crypt (Fig. 8c).
Examples of surface modifications; (a) humerus bearing possible tooth marks; (b) humerus bearing possible root mark and light weathering; (c) distal humerus bearing chop mark; (d) cranial element bearing chop mark; (e) mandible with cut marks; (f) rodent-gnawed canine (left) and canine bearing cut marks (right).

Summary of the number of bones that exhibited surface modifications. Number in [ ] represents low-confidence identifications.
Another chop mark was identified on a cranial fragment in the occipital region right along the sagittal crest (Fig. 8d). As the occipital region of the skull is commonly broken off during curation in order to extract the soft tissues in the brain case (Sugiyama et al. Reference Sugiyama, Pérez, Rodríguez, Torres, Valadez, McCarty and Arbuckle2014), it is reasonable to conclude that this individual underwent preparation when soft tissue was still present in the brain case. The envelope of cranial skin would often be stripped from these skulls as part of this process, to be prepared as pelts utilized to accentuate ritual regalia.
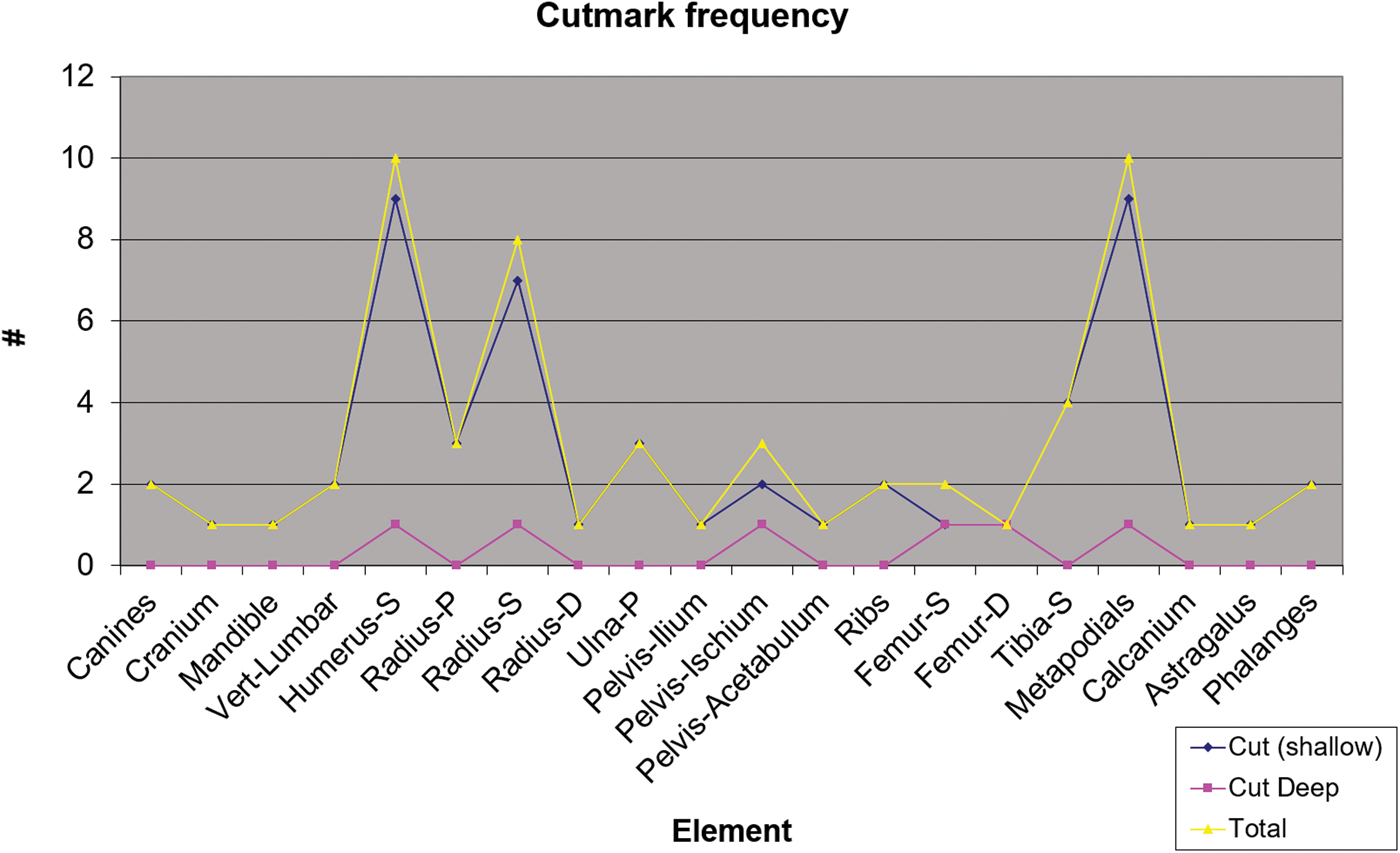
Cutmarks were distributed across a wide variety of element types. For example, a mandible and a cranium bore cutmarks along areas where the bone is most proximal to the pelt, these being regions of bone that are often modified as a result of pelt extraction (Table 4). Cutmarks were most prevalent along the shaft of the humerus and the metapodials, with a generally higher frequency on the shaft than on the epiphysis in the case of the humerus, radius, femur and tibia (Fig. 9). Deep cuts also occur primarily along the shafts. As carcass disarticulation usually results in cutmarks along the epiphysis of long bones, the present cutmark distribution is in accordance with meat-acquisition strategies. As the ritualized hunting and consumption of large felids has been documented among modern indigenous communities by ethnographers, it is possible that such customs were also practised in Copan. In these cases ritualized consumption habits involve sympathetic acquisition of desirable felid traits like speed, cunning, bravery, and the ability to see in the underworld, made possible through the ingestion of felid flesh (Saunders Reference Saunders1998; Zuidema Reference Zuidema and Urton1985).
Cutmark distribution across the skeletal elements. P = proximal; S = shaft; D = distal.
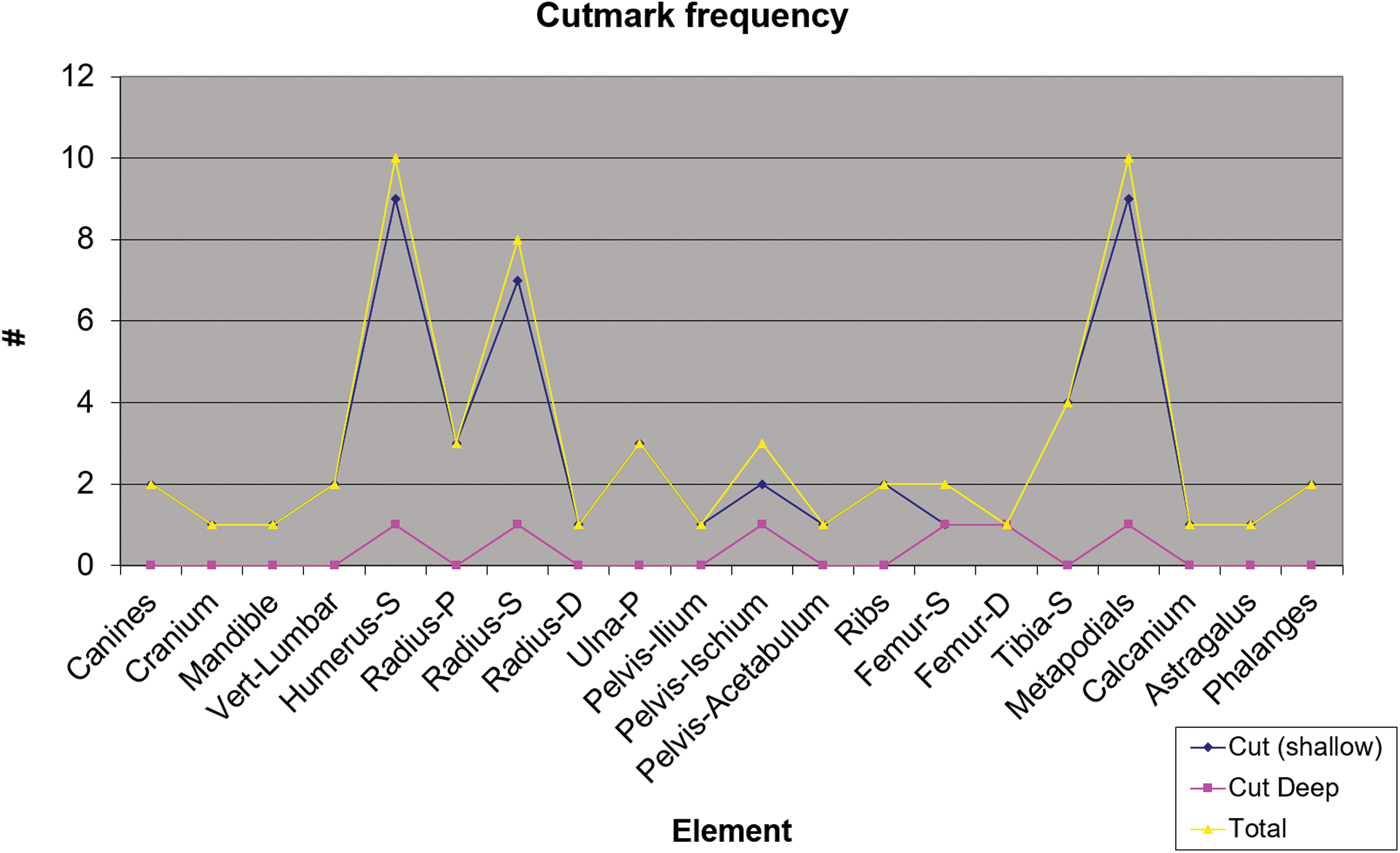
Cutmarks on vertebrae were rare, with only two marks identified on lumbar vertebrae. This distribution does not support previous interpretations of felid decapitation, as this procedure regularly results in cutmarks on the first cervical vertebra. The presence of cut marks on canines (Fig. 8f) may have resulted from a separate reworking of the teeth or during tooth extraction for ornamental or other uses.
Carnivore tooth marks were also recorded. Due to the highly deteriorated surface, other taphonomic alterations and absence of a microscope, we could not confirm with high confidence that these marks were indeed the work of carnivores. Nonetheless, although they are not abundant (n = 11), the presence of these marks leaves open the possibility that some of the materials may have been opportunistically accessed by carnivores post deposition.
This scenario detracts from the initial interpretation which postulated that the felid remains from this cache represent a single mass burial of sacrificed individuals deposited immediately following the hypothesized violent ritual act. What is more likely is that the felids in this context represent several burial types: though some animals were indeed deposited as primary burials immediately after sacrifice, others may have been secondary burials, and of these not all may have been complete or intact corpses.
Another significant consideration is that nine avian specimens, including a bird skeleton documented in the field by W. Fash at the upper northwest corner of the cist, were noted and identified as macaws by Ballinger and Stomper (Reference Ballinger and Stomper2000). Our reanalysis also identified elements of a roseate spoonbill (Platalea ajaja) in the form of a femur, humerus and tarsometatarsus. Both the macaw and the spoonbill were highly esteemed for their brightly coloured feathers. While the macaw (both military and rosette macaw) could have been sourced locally, the celebrants would have had to acquire their spoonbill from one of its habitats in the mangrove forests, mudflats and freshwater marshes prevalent along either of the outer coastal lowlands (Ridgely & Gwynne Reference Ridgely and Gwynne1992, 76; van Perlo Reference van Perlo2006).
In summary, this zooarchaeological investigation furnishes an updated and more rigorously qualified analysis of the corporal animal form materials found in the Altar Q cache, which in turn enables a more realistic reconstruction of these materials’ ritual deposition, thus:
1. The quantity of individuals interred into the offering cache was prescribed to agree with the auspicious number 16, as each of the 16 rulers in the Copan dynasty would thus be represented by a corresponding felid, including the final, presiding ruler himself.
2. In order to procure such an extravagant quantity of large, far-ranging and solitary felids, it was necessary to assemble the selection from a mixture of jaguars, pumas and even a smaller felid species.
3. Both primary and secondary deposits were made in order to reach the required number of felids for the offering cache.
4. Spectacular bird species prized for their vividly coloured plumage, including at least one macawFootnote 1 and one roseate spoonbill, were also deposited into the cache.
Interpreting human–animal interactions at Copan
In this study we document three offertory contexts that together represent the length of the Copan dynasty and which feature corporal animal forms in prominent roles as sacrificial victims, sustenance for the afterlife and ritual paraphernalia. Two examples of exceedingly diverse form were identified as paramount agents in ritualized acts related to world creation, state formation and legitimation, and the establishment of social identity: the Starry Deer-Crocodile and the jaguar (though this latter may be generalized to ‘the large felid’ with arguably equal propriety). Each context demonstrates that the multi-layered processes of power negotiation taking place in these offertory and mortuary rituals pivoted on the significance of the various corporal animal forms employed in them.
Evidence from the Motmot burial reveals that the participation of animals as agents in state-level ritualized acts was institutionalized at least as far back as the first royal succession of the Copan dynasty at the great Period Ending of 9.0.0.0.0. In the elaborate world-creation ceremonies in which royal authority was ritually transferred from the founding patriarch K'inich Yax K'uk’ Mo to his son, corporal animal forms conveyed agency in several ways.
During the initial deposition of the offertory cache, a human female entombed in the funerary chamber was paired with her spiritual companion in the form of a complete, intact puma placed alongside her body. By permanently associating her with the sacred potential of this powerful being, the ritual celebrants signified and legitimized this shamanic female's elite social identity. At Copan, a tradition of reserving utmost reverence for the felid, manifest in the consistently regal association of these corporal animal forms in state-level ritual contexts, appears to have been strongly conserved across the centuries from the dynasty's propitious origination to its fitful demise half a century after the dedication of Altar Q.
The primary human/felid Motmot burial was sumptuously accessorized with a plentitude of additional animal offerings, with some stored in or presented upon ceramic vessels to provide for the afterlife. The Starry Deer-Crocodile, being an embodiment of the noumenal creative energies that brought the world into existence, was another essential participant in this cosmic renewal ceremony marking the first dynastic accession. Its sacrifice was ritually realized by setting aflame a symbolic configuration of crocodile scutes and deer post-cranial bones.
It is especially noteworthy that the ancient Maya not only depicted the hybrid animal beings of their cosmology, they further instantiated these entities into tangible materiality (sensu DeMarrais et al. Reference DeMarrais, Castillo and Earle1996) by physically assembling their novel corporal animal forms out of natural bone and tooth elements. The Starry Deer-Crocodile represented the cycle of destruction, creation and renewal of the universe as interpreted via the iconographic and epigraphic evidence of Stela 6 of Piedras Negras (Stuart Reference Stuart2005). Likewise, the royal accession ceremonies at Copan featured ritual protocols which enabled celebrants simultaneously to manipulate the metaphorical and physical aspects of these sacred beings through the tangible materiality of their corporal animal forms. It was not by chance that these ceremonies were performed on the baktun of 9.0.0.0.0., as this date would have been singularly charged with allusions to the forces of world renewal, their ontological significance thus extending to the second scion of the Copan dynasty as his right to rule was sealed in the flaming pyre of deer and crocodilian forms placed atop the capstones sealing the cache.
Curiously, it appears that around this same time a different Copan constituency had also begun using ritual performance to invoke the powerful symbolism of the Starry Deer-Crocodile. The prevailing scholarly view of the Starry Deer-Crocodile, in which this being is closely affiliated with the divine axis of the Maya cosmic order (Stone & Zender Reference Stone and Zender2011), posits that any use of its form would thus be the exclusive privilege of royal elites. But given that at least one context featuring this form was found in a non-royal elite setting less than a kilometre from the Principal Group, we surmise that over time, ritual access to the Starry Deer-Crocodile may have become increasingly extramural. The chronological proximity of the Motmot burial to the Plaza A shaman burial and the presence of a jade bead necklace, that combines green (Yax), Quetzal (K'uk’), and macaw (Mo’) elements , suggest he may have been in the service of the first ruler. Already during this early period, local elites were renegotiating their respective statuses within the complex matrix of social hierarchies developing within this newly ascendant state.
Several new insights emerged from the detailed reanalysis of the Altar Q assemblage. First, the number of unique felids identified in the offering increased from 14 to 16, two more than previously identified and a total which corresponds to the sequence of rulers portrayed on the perimeter frieze of Altar Q itself. The group was not entirely composed of jaguars, but was instead a mixed composition of felid types including several pumas and one smaller felid. Our interpretation of the ritual process is further informed by newly derived surface modification data. Distinctly different weathering stages along with the presence of apparent carnivore tooth marks and other modifications suggest that the tomb incorporated both primary and secondary burials, and/or that its contents may have been exposed to access for some time. A certain portion of the animals were evidently processed prior to deposition, possibly to extract resource materials such as pelt, meat and teeth. This interpretation is supported by the disarticulated nature in which the faunal assemblage was found. The depredating effects of scavenging rodents notwithstanding, the low frequency of gnaw marks is nonetheless insufficient to account for the chaotic disorder of the offertory remains.
These new insights help resolve a significant logistical paradox: How could Copaneco trappers not only capture 16 powerful, reclusive and far-ranging felids in the limited time period building up to the Altar Q sacrifice event (an astounding feat even under ideal circumstances), but do so under conditions of terminal political stress coupled with an advanced state of deforestation that would have suppressed the population of these animals in the local hinterlands of the city? The short answer, based on the evidence presented in this study, is that they did not. Although trapping expeditions would likely have supplied a substantial fraction of these animals (perhaps up to a third) which may have been kept in captivity (Sugiyama et al. Reference Sugiyama, Fash and France2018), the remainder seem to have come from a variety of origins. Moreover, some of these felids may not have been alive or even intact at the time of deposition and were constituted by a mix of jaguars, pumas and at least one smaller felid species.
What we conclude from this is that Altar Q and its associated faunal offerings hint at the likelihood that an insurmountable legitimacy crisis may have been threatening the integrity of the Copan dynasty, prompting the ruling patriarch to stage an unprecedentedly ambitious dedication ritual. This spectacle drew upon two time-honoured stores of cultural value: ancestor worship and felid symbolism. Although Yax Pasaj may have desired that each dynastic ruler be represented with a correspondingly prominent large felid for the dedication ritual, obtaining 16 live adult jaguars from the wild for this purpose would have been decidedly unrealistic. Instead, the required number of felids was apparently reached by way of mixing jaguars with non-jaguar felids, as well as by incorporating numerous secondary deposits with primary burials. New isotopic data add to this evidence of animal captivity and trade of this same assemblage (Sugiyama et al. Reference Sugiyama, Fash and France2018). All the king's hunters and all the king's men were simply unable to procure 16 jaguars from a highly altered environment with degraded forest cover, especially in the fractious political circumstances of late eighth-century ad Copan. Minute analysis of the zooarchaeological remains provides a more realistic snapshot of the extremely complex factors that mitigated the execution of state ritualized activities in the past.
Copan's use of corporal animal forms as key value-mediating agents is diagnostic of Mesoamerica as a whole. The power expressed by animals is conveyed through social and physical structures readily analogous to those of humans, making them ideal symbolic vessels for storing, negotiating and materializing complex human value systems. As such their forms feature prominently as symbols of state authority and as identifiers marking socio-political boundaries. In this study we have endeavoured to perform a detailed zooarchaeological analysis of corporal animal forms at Copan in order to facilitate a more comprehensive reconstruction of some of the power negotiations in play, which in the archaeological record are manifest most clearly in the material precipitants of ritualized performances.
Acknowledgements
The excavations of the Motmot and Altar Q caches were conducted as part of the Copan Acropolis Archaeological Project, administered by the Instituto Hondureño de Antropología e Historia, under the overall direction of William Fash. William Fash would like to thank Barbara Fash for her keen eye and interpretive acumen in the investigation of those contexts, as well as Karla Davis-Salazar for the excavation of the Motmot cist offering. He would also like to acknowledge the contributions of Ricardo Agurcia and the previous osteological work conducted by Diane Ballinger, Jeffrey Stomper and Randolph Widmer. Zooarchaeological inquiry was conducted by Sugiyama with the generous support of Harvard University's Bowditch Exploration Fund, the Owens Fund of the Peabody Museum and the Peter Buck Fellowship at the National Museum of Natural History (NMNH), Smithsonian Institution. Species-level identification was determined with the aid of the mammalian and avian collection housed at the NMNH and the Instituto de Biología at the National Autonomous University of Mexico. Sugiyama extends special thanks to Torben Rick (project co-supervisor), Christine France (project co-supervisor), Melinda Zeder, Megan Spitzer and Yen-Shin T. Hsu for their support during the post-doctoral fellowship period. Sugiyama is grateful for the extensive editing and comments provided by Robert Cebollero on the text.