Introduction
Numerous historical investigations have described nineteenth-century asylums for the mentally ill, both in Europe and in the United States. Typically, these investigations have attempted to situate an asylum in historical and institutional context, as well as giving some attention to describing the residents as a means to understand the processes by which certain classes of persons became institutionalized (e.g., Dowdall Reference Dowdall1996; Dwyer Reference Dwyer1987; Grob Reference Grob1966, Reference Grob1994; McCandless Reference McCandless1996, Reference McCandless, Porter and Wright2003; Rothman Reference Rothman1971, Reference Rothman2002; Scull Reference Scull1989; Sitton Reference Sitton1999). In this paper, we document a nineteenth-century asylum, with several differences from previous work. First, the subject organization, the Colorado Insane Asylum, was located in the Mountain West of the United States rather than Europe or the eastern United States, and we examine it during a specific period (ca. 1880–1900) that involves a frontier rather than industrialized society. More importantly our investigation differs from that of others by offering an explicitly demographic and social epidemiological treatment of admission processes. This is by no means the only approach to an historical understanding of a mental health organization, but we believe this methodological difference offers a more rigorous approach than is typically seen. Thus, the substantive focus of the current study involves characterizing the patient population of the late-nineteenth-century Colorado Insane Asylum, with particular attention to comparing the patients to the source population from which they came. To this end, we calculate and compare admission rates across sex, age, marital, occupation, and immigration status. Doing so illuminates the extent to which individuals in various status groups, who varied in power and social advantage, differed in their risk of being institutionalized in the context of nineteenth-century Colorado. We begin by describing the general social and historical context of this asylum, and then proceed to the more strictly epidemiological portions of the work. A second goal is to closely examine the extent to which the establishment of the Asylum in Colorado differed in notable ways from the founding and building of establishments to house the mentally ill in other parts of the United States, especially the eastern United States.
Context of the Nineteenth-Century Asylum for the Mentally Ill
During the early nineteenth century, a number of social, economic, and demographic changes were associated with how Americans managed and cared for the mentally ill. Of particular importance was the decline of family centered households, the growth of cities, and a large increase in the population by the middle of the nineteenth century, along with a great deal of immigration (Grob Reference Grob1994). As cities grew in size and industrialization increased prominence, migration away from family occurred. Families were more geographically dispersed, making them less functional as primary caretakers for those with mental illness. Consequently, in the early part of the nineteenth century cities in the East established hospitals for the insane, at first for those who could pay for their care. By the second quarter of the nineteenth century, the state began to play an increasingly important role in the treatment of the mentally ill, particularly the indigent, and public institutions began to be developed (Grob Reference Grob1994). Soon after, states elsewhere experiencing comparable problems to those in the Northeast began to construct hospitals for the mentally ill, and the rate of hospital construction rapidly increased (Grob Reference Grob1966, Reference Grob1983).
Colorado and the West in general contrast with the pattern of state-supported insane asylums in the East. Although Colorado, as a frontier territory and state, did share the relative separation of residents from family support, it had a small and predominantly rural population at the time when the Asylum first opened in the late nineteenth century. According to the 1860 and 1870 US census, the population of the entire state of Colorado was less than 40,000 and grew little until railroad lines were completed after 1870, after which time rapid growth occurred. The flow of people to the territory and later the state to farm, mine, breath clean air, start a new life, and so forth brought the US census population count to nearly 200,000 by 1880, more than 400,000 by 1890, and more than 500,000 by 1900.
Another difference in Colorado and other western states was that industrialization and urbanization were almost absent during the early years of colonization by comparison to states in the East (Neuschatz Reference Neuschatz1986; Sprague Reference Sprague1976; Wolff Reference Wolff2003). Like the eastern United States, however, many foreign immigrants were among these early residents. Abbott and colleagues report that in 1860 the population in “Pikes Peak country” witnessed fewer than 8 percent immigrants. At this time the largest numbers of immigrants were Irish, followed by German, and then English. These authors report that the number of foreign-born immigrants jumped dramatically after 1860, and by 1870 the percentage of foreign born had more than doubled (Abbott et al. Reference Abbott, Leonard and Noel2005: 193). The draw for these immigrants was largely economic, enticing both the wealthy and those who fled difficult times in the country of origin. Another driving factor in the rapid population increase after 1860 was the Homestead Act of 1862 which made land available for nearly nothing (Neuschatz Reference Neuschatz1986; Sprague Reference Sprague1976), and that, along with completion of the railroad, opened up the eastern Plains to farming.
Denver was and still is the largest city in Colorado, with a population of 35,000 in 1880 which had ballooned to 106,713 in 1890 (Abbott et al. Reference Abbott, Leonard and Noel2005: 242). The city acted as the place where immigrants stopped to plan their next move, to gather together necessary goods to support themselves, and it offered a place to return to when dreams were unmet (Abbott et al. Reference Abbott, Leonard and Noel2005). Colorado's second city in this era, Pueblo, had a population of only 3,000 in 1874 (Hall Reference Hall1891: 457), but it grew as a smelting industry developed to process ore from mines in the mountains to the west and later an operating steel mill was built, with the city reaching 24,000 by 1890 (Ubbelohde et al. Reference Ubbelohde, Benson and Smith1972: 1934). Also noteworthy was Leadville, a mining town in the mountains west of Denver. Leadville was a boom town and had a population of 15,000 in 1880, but by 1890, the population had declined to 10,384 (Abbott et al. Reference Abbott, Leonard and Noel2005). So, while Colorado did have some “urban centers,” their populations were much smaller than urban centers in states to the east. By way of comparison, Grob (Reference Grob1994) reports that by 1850, New York City had a population of more than 500,000, the size of the entire Colorado population in 1900, and in 1850 four other cites had populations between 100,000 and 250,000, while there were 20 cities with populations ranging in size between 25,000 and 100,000. The population density differences and the industrialization and urbanization differences in states to the east quickly show the distinctions between these two regions. According to Sprague (Reference Sprague1976), those who colonized Colorado were very independent and were not interested in working for anybody for a wage, both perhaps necessary traits for the frontier economy. This was true of those who moved to Colorado to gain their wealth by mining silver or gold, as well as those who came to engage in farming or ranching. Capital was slow to come to the state, and investors, whether from the United States or Europe, were often absent, at least until the late 1890s (Neuschatz Reference Neuschatz1986; Sprague Reference Sprague1976). Therefore, much of the socioeconomic and political infrastructure was un- or underdeveloped.
Migrants and Other Marginalized Persons and the Development of the Asylum
Colorado gained statehood in 1876, and as a territory of immigrants (from within the United States as well as elsewhere), it did have the geographic dispersion of families, and separation of individuals from their families, that helped create a demand for institutionalized means of care for the mentally ill. Economic or ethnic disadvantage also may have been relevant. Tomes (Reference Tomes1984) argued that by the mid-nineteenth century, the asylums in the east predominantly housed indigent and marginalized persons, although some of those with money also entered the institutions. But there is little discussion by most researchers about differences in mental health treatment or institutionalization by race, ethnicity, sex, or occupation, in particular, and not as these categories compare to the general population from which the patient population was derived. Immigrant status among patients is addressed by Grob (Reference Grob1994: 87), but again, without comparison to immigrant representation within the general population. He asserts, however, that immigration to the United States was increasing rapidly at the time many public institutions were founded, and he further notes that asylums, prisons, and welfare institutions housed large numbers of foreign born. He also points out that despite the fact immigrants formed less than half the population of New York in 1850, there were nearly four and a half times as many immigrants in the New York Lunatic Asylum on Blackwell's Island. At the time, explanations for the relatively large number of immigrant patients varied. A popular contemporary public view was that the immigrants, especially the Irish, were morally and culturally deficient and incapable of assimilation into the American population, a view that presumably made them more subject to being identified as “ill.” By contrast, some asylum physicians argued that the large proportion of immigrants in asylums was due to the circumstances they faced, including poverty, dislocation to totally new surroundings, and absence of supporting family networks. Other physicians shared something like the popular view arguing that the Irish in particular were of low intelligence and lacked insight into their condition. In the East, then, this class and ethnicity did affect the rate of hospitalization, particularly of lower class immigrants, especially the Irish. However, because these observations do not formally account for the relative size of the Irish population, it is not at all certain how disproportionately the Irish are represented in Asylums.
Careful comparison of the demographic composition of insane asylums in relation to the population at large are absent from historical analyses of such institutions. The exceptions to this observation are limited. Grob (Reference Grob1983: 8–9), for example, relies on the 1880 US census to describe the demographic composition of insane persons in the US population. He reports that “nearly 52 percent [of insane persons] were female, 71 percent native born, 93 percent white, and 7 percent black. About 9,300 were kept in almshouses. Of the remainder, half were cared for in mental hospitals and the other half in their own homes. The hospital population was composed of an equal number of males and females; 62 percent were native born and about 96 percent white” (Grob Reference Grob1983: 8). Grob additionally describes the age of the population of mentally ill (mean of 45.3), further noting that persons 60 years and older made up more than 17 percent of the mentally ill population. He reports that single persons comprised 54 percent of the total insane population; 37 percent were married, 9 percent were widowed, and less than 1 percent were divorced. While these figures are useful, they offer no systematic comparison to the composition of the population at large.
Similarly, Tomes (Reference Tomes1984) describes the age, sex, ethnicity, and marital status of the institutionalized at the Pennsylvania Hospital for the Insane in Philadelphia. Reporting on the patient population from 1841 to 1883, she indicates that the patients were diverse and complex. For example, in this setting many patients were paying for their treatment, but about half were paying nothing or were indigent. Tomes further finds nearly equal numbers of men and women in the institution, of whom more than half were married or widowed, and suggests that the majority of patients were in the “prime of life” when admitted (Tomes Reference Tomes1984: 190). She found that only 6 percent of the patients were younger than age 20, and about 19 percent were older than 50. In terms of immigrant status, in the Pennsylvania hospital during this 43-year time period of the study about one-fourth of all patients were foreign born, coming predominantly from Ireland, Germany, and England (Tomes Reference Tomes1984: 190). As one additional piece of information, Tomes notes that only a few blacks were admitted to the institution. Again, this information depicts the patient population in the institution, but the absence of comparable information on the Pennsylvania population as a whole precludes analyzing the relation of social factors to admission processes.
Background on the Nineteenth-Century Colorado Insane Asylum
Only a decade after Colorado gained statehood, the Colorado Insane Asylum was approved by the legislature in early 1879 and later in the year began accepting patients. As stated by the legislature, the primary reason for establishing the hospital was to save money by keeping patients in the state rather than sending them to institutions in the East (Stone Reference Stone1919). There was lively debate and bidding for the location of the institution within the state, but Colorado's first US senator, George M. Chilcott, made available 40 acres of farm land in northwest Pueblo, Colorado, and so it gained the Asylum. Chilcott's three-story farmhouse was renovated to house male patients while a small, one-story frame house was built for women, and Dr. Pembroke R. Thombs, formerly a Civil War Army surgeon, was appointed as Asylum superintendent. From this small beginning, the institution rose to a population of more than 400 residents by 1900, as will be detailed in the following text. Like mental health institutions elsewhere in the country, the Colorado Mental Health Institute continued to grow, with a new building for males finished in 1883, and a new facility for females completed in 1888, and in the twentieth century the patient population was more than 5,000 by the 1940s. Also like that at other locations, the patient population declined drastically with deinstitutionalization during the 1960s and early 1970s.
The Data
Our analysis of admission rates and analysis of the composition of the Asylum resident population relies on the original handwritten admission records of Dr. Thombs. These documents are housed in the Colorado Mental Health Institute Museum in Pueblo, Colorado, and were made available to us by Ms. Nell Mitchell, curator of the museum. In the early 1990s a student at Colorado College in Colorado Springs translated all the data into machine-readable form, and that database was provided to us by Dr. Michael Hoffman of Colorado College. Dr. Thombs's admission records included each patient's name, date of admission, age, sex, marital status, state/country of origin, county of residence and county admitting the patient, occupation, diagnosis, date of discharge from the facility if such occurred, and cause and date of death for patients who died there. These admission records include 1937 patients, admitted between October 1879 and December 1899 when Thombs stepped down as superintendent.
The second chief data source used was aggregate US Census data for Colorado for the years 1870, 1880, 1890, and 1900 (US Bureau of the Census), which provides estimates of the size and composition of the source population from which admissions arose. Such data, of course, imperfectly describes the nineteenth-century Colorado population, particularly with the influx and outgo of immigrants with the rise and fall of the price of silver and gold that occurred at various times during the 20-year period we are investigating. The population numbers were also shifting dramatically as the Native Americans were removed to reservations either out of state or at the physical margins of the state. By 1860, what is today Colorado witnessed the immigration of Latinos from New Mexico into southern portions of the state. Like Native Americans, New Mexicans were disparaged by the dominant population, with numerous conflicts between the New Mexicans and Anglos (Abbott et al. Reference Abbott, Leonard and Noel2005).
The US Census data offer the best available demographic description of the population and it allows us to analyze admission to the Asylum in relation to the Colorado population. The census provides “denominator” information on the size and characteristics of the population at risk underlying admission rates. In addition to conventional printed summary census data (1870, 1880, 1890, 1900), we also used data compiled and made conveniently available in machine readable form by Gutman (Reference Gutmann2005).
Analytic Methods
The fundamental descriptive and comparative measures used are admission rates, where “rate” has a strict epidemiological definition, namely the number of occurrences of some event divided by a measure of the amount of person-time in the population from which the events arose (see, e.g., Rothman and Greenland Reference Rothman and Greenland1998). Calculating a rate requires both “numerator” information on the events of interest, in this case the numbers of admissions occurring, and the dates on which each admission occurred. Rates also require denominator information on the population at risk, in this case the numbers and characteristics of persons present in the Colorado population in each year. Because US Census data are available only at decade intervals, we interpolated (quadratic) from the US Census population figures given for the state of Colorado for 1870, 1880, 1890, and 1900 to estimate population numbers and distributions for intercensal years. For the computation of overall rates of admission (see table 1), and for the computation of rates by age and/or sex (e.g., tables 3, 4, and 5), yearly population estimates were derived by interpolating from decadal census size estimates within each five-year sex/age category, and then aggregating these to obtain an estimate of the relevant population total. Yearly estimates of the state population within categories of marital status (table 5), occupation (table 6), and nativity (tables 7 and 8) similarly were obtained by interpolation from census counts for these data categories, and were used to provide denominator information to compute rates within these categories. With the numerator information from admission records, and the denominator person-time figures approximated by interpolation, we estimated admission rates for each year.
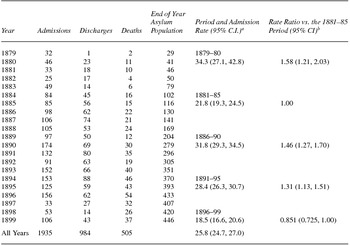
Asylum population flow and admission rates

aAdmission rate based on Colorado state population, per 100,000 person-years. Population base to calculate person-years in this table derives from US Census reports, as compiled by Gutman (Reference Gutmann2005). Population counts for intercensal years were estimated by three-point quadratic interpolation, using census year figures from 1870, 1880, 1890, and 1900. Confidence intervals were based on an exact Poisson procedure, as implemented in Stata (StataCorp 2013).
bRate ratios for period effects were not standardized for differences in age and sex distributions vs. the 1881–85 period because it made no substantial difference from the crude ratios presented here.
Using these rates, we measured the relation of a particular social variable using rate ratios. So, for example, if the estimated admission rate for males in a particular period was 30.0 per year per 100,000 males in the population, and the estimated admission rate for females was 15.0, the male/female rate ratio for that year was 2.0, indicating that males in the Colorado population were admitted to the Asylum at twice the rate of females. The random aspect of rates and rate ratios were quantified using confidence intervals, typically based on the exact Poisson procedures implemented in the Stata software (StataCorp 2013). However, we remind readers that these confidence intervals cannot address the uncertainty in rates and rate ratios introduced by the need to estimate population size for intercensal years.
Description and Analysis of Asylum Admissions
The beginning point for our description and analysis of admission to the Colorado State Insane Asylum is a review of the flow and rate of patient admissions into the Asylum from October 1879 until the end of December 1899, for which the relevant data appear in table 1.
The Asylum population grew from 29 in 1879 to a high of 446 in 1899. The admission rate aggregated across the entire period was 26.0 admissions per 100,000 persons in the Colorado population per year. The admission rate ranged from a high of 34.3 per 100,000 persons per year to a low of 18.5 during the 1896–99 period. (We present admission rates here and elsewhere for five-year periods, to give more stable estimates of this low-frequency event than would come from single-year estimates. The initial and final periods, 1879–80 and 1896–99, differ in length so as to give convenient half-decade periods in the middle years.) Confidence intervals for the admission rates and ratios, located in the last two columns of table 1, provide a measure of the extent to which the figure for any given period may reflect purely random variation in the admission process. On this basis, we note that the estimate of the rate in periods with a small number of admissions, such as 1879–80, are relatively imprecise, because the confidence interval for this rate shows the figure for 1879–80 might plausibly be as low as 27.1 per 100,000 or as high as 42.8 per 100,000. Similarly, the confidence interval for the rate ratio of that period compared to the 1881–85 ranges from 1.21 to 2.03, suggesting that the true rate for 1879–80 might be as little as 1.2 times as high as that for the later comparison period, up to as much as twice as high. Taking account of such possible random variations in rates, the data reliably show that admission rates during 1879–80, 1886–90, and 1891–95 were relatively elevated, while those in 1881–85 and 1896–99 were relatively low. These differences should not be regarded as convincing evidence of social change that increased and decreased the occurrence of mental illness. Undoubtedly the number of admissions was at least partly dictated by the changing physical capacity of the institution. For example, the substantial increases in patient population size between 1883–84 and 1888–89 occurred at times when new construction at the Asylum was completed (Mitchell et al. Reference Mitchell, Painter, Zier, Painter, Magennis, Zier, Mitchell, Conyers and Kennedy2002). At the other end, though, comments from the superintendent in official reports on the Asylum (see, e.g., Commissioners and Superintendent of the Colorado Insane Asylum, 1896) commonly cite lack of staff and building space and the consequent need to deny admission requests (e.g., from county judges for females). The physician-superintendent also complains of space/staffing constraints causing him to admit only “incurables” and not those who, in his view, might have benefitted from treatment (1896: 6). Available records, however, do not allow us to know by exactly how much capacity increased, rather only that physical expansion did occur. Besides institution capacity, another prosaic source of changing rates of admission size would be changes in the structure of the frontier population, which became older and less dominated by males over the time period covered here. However, the changing age/sex composition of the Colorado population turned out not to account for variation in the admission rates across periods. In results not shown here, we examined rate ratios for each period compared to 1881–85 as the reference period, adjusted for the changing age and sex distribution of the Colorado population (using Mantel-Haenszel methods implemented in Stata [StataCorp 2013]), and found that the adjusted rate ratios did not differ substantially from the unadjusted crude rate ratios presented in table 1.
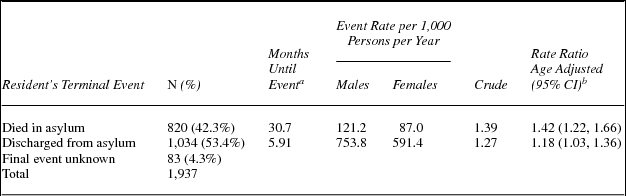
Table 2 gives supplementary detail concerning Asylum residents’ discharge or death. The results show that, although many residents remained for a long time, the Asylum was not simply a permanent sentence until death, as more than half of those admitted were discharged before they died. Among those discharged, the median time in the Asylum was a little less than six months, indicating that if discharge did it occur, it happened relatively quickly. Discharge rate calculations show that among 1,000 persons eventually discharged, nearly 754 men and 591 women could be expected to depart within a year, with men somewhat more likely than women to be discharged. Death was not necessarily a rapid event for the 42 percent of those who did die in the institution. Median time until death among those who died in the Asylum was 30.7 months, with a rate of 121 males and 87 females per thousand persons per year. Men were more likely to die before leaving the Asylum than women, as indicated by the rate ratio of 1.42. The small difference between the crude and age-adjusted rate indicates that the elevated rate for men is not attributable to any differences in the age distribution of male versus female residents.
Death and discharge of asylum residents by sex

aMedian months until event among those experiencing the event.
bAdjusted for five-year categories of age, using Mantel-Haenszel methods implemented in Stata (StataCorp 2013).
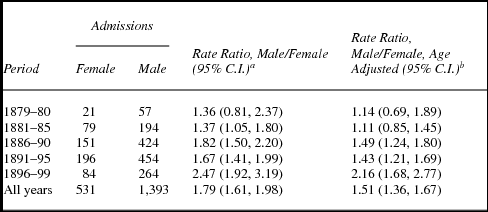
The data shown in table 3 take us beyond the basic description of the flow of patients into and out of the Asylum to an examination of the effects of sex on admission risk, and how this varied across time. About three-quarters of all patients admitted to the Asylum were males. However, due to the relative excess of males in the Colorado population, the effect of male gender on the rate ratio is more modest than this number might suggest. Across the entire 20-year period, the average estimated rate ratio for males versus females was 1.78, meaning that males, relative to their representation in the source population, were somewhat less than twice as likely as females to be committed to the Asylum. This rate ratio is even lower when adjusted (using Mantel-Haenszel methods again) for the age distribution of males versus females. The age-adjusted ratio for males versus females is 1.51, as shown in the last column of table 3, meaning that for any given age group in the Colorado population, males had about 1.5 times as high a rate of admission as females. At each period shown in table 3, the crude and adjusted admission rates for males were higher, and the age-adjusted rate ratio was always somewhat lower (e.g., 1.36 vs. 1.14 in 1879–80, 2.47 vs. 2.16 in 1896–99). Thus, a consistent but relatively small part of the excess of male admissions stems from their tending to be of different ages (typically older) than females and, as we shall see, increasing age tended to increase substantially the risk of Asylum admission. The shortage of space for females at some times, as mentioned in the official report cited previously, would also have contributed to the relative excess of males among admissions.

How did this experience compare with other asylums at the time? Tomes (Reference Tomes1984: 322–23) reports that in the Kirkbride Hospital for the Insane in Philadelphia during the first half of the nineteenth century, male admissions outnumbered female admissions by 70 to 30 percent, and that by the mid-nineteenth century males and females were more evenly represented; 55 to 45 percent. Given that the values Tomes reports are not adjusted by the sex ratio of the population, it is not entirely clear how similar or different the values are compared to the Colorado Insane Asylum sample (see table 4). If we hypothetically assume that the source population for this hospital. had equal numbers of males and females, a plausible conjecture for a relatively urbanized, nonfrontier population, the male/female rate ratios would have been in proportion to the percentages, that is, 2.33 and 1.2. Our crude ratio of 1.78 for late-nineteenth-century Colorado would fall between these two figures. For the Buffalo Mental Health Institute, Dowdall (Reference Dowdall1996) reports that the principal operating mode was to admit and accommodate equal numbers of men and women, but he notes that males most often outnumbered females in a ratio of 1.2:1 (Dowdall Reference Dowdall1996: 110), somewhat less than our rate ratio. Grob (Reference Grob1983) also reports that male and female admissions were nearly equal in various eastern hospitals as reported in the 1880 census and as discussed previously. Again, the fact that these figures are not reported as rates and do not take into account the sex distribution of the population makes it difficult to compare them with our results, but more importantly, it makes it impossible to speak rigorously about the relative institutionalization risk of men and women. If, however, we believe these hospitals drew from a relatively developed, urbanized population for which a balanced sex ratio is a reasonable assumption, it would appear that men did face an increased institutionalization in nineteenth-century Colorado. While the exact reasons for this are unknown, they might stem from occupational features of frontier life in Colorado. For example, miner's heavy metal exposures may cause increased rates of dementia, as hypothesized by Bower et al. (Reference Bower, Getty, Smith, Simpson and Hoffman2005, Reference Bower, McCants, Custodio, Ketterer, Getty and Hoffman2007) in preliminary analyses of lead exposure in a sample of patients who had died in the Asylum. Alternatively, increased frequency of certain diseases may have resulted in an increased risk of institutionalization, especially syphilitic dementia that would have been acquired in a frontier context in which contacts with prostitutes were presumably common among men.
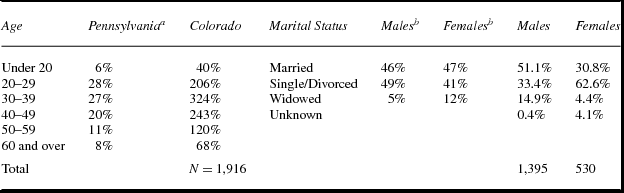
Age at admission and marital status of patients in the Asylum, Colorado (1879–99) and Pennsylvania (1883)

aData taken from Tomes (Reference Tomes1984: 323), table A.2.
bData taken from Tomes (Reference Tomes1984: 323), table A.1. No divorced patients are listed.
Returning to the Colorado admission data, we focus on how the effect of sex on admission changed over time. Were there periods in which the effect of being male was a greater or smaller risk of admission? Focusing on the age-adjusted figures given in the last column of table 3, it can be seen that the elevated rate of males tends to increase over time. While males were only modestly more likely than females to be admitted to the Asylum during the early part of the study period (e.g., an 11 to 14 percent higher rate in 1879–85), this difference became relatively larger in later years, with the maximum being the 2.16 male/female rate ratio found in 1896–99. However, as indicated by the relatively wide and overlapping confidence intervals for the age-adjusted rate ratios for each period, this estimate of a trend toward an increased risk for males is somewhat unreliable, and thus partly stems from random variation in the component rates for men and women.
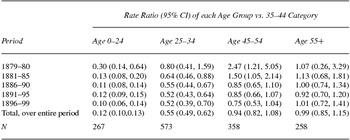
Admission rate ratios for age groups are shown in table 5, with the reference category (comparison group) being persons aged 35 to 44 (the largest category). Each figure in this table indicates how much higher the rate was in a particular age group relative to this reference. These ratios are not adjusted for differences in sex distribution here because this adjustment left the rates essentially unchanged. The admission rate ratios by age group across the total period, as displayed in the last row of table 5, show that the relative rate of institutionalization was lowest among the young, with persons under 25 about one-tenth as likely to be admitted as persons in the 35 to 44 comparison category (rate ratio = 0.12), and persons aged 25 to 34 only about one-half as likely to be admitted (ratio = 0.55). Beyond that, however, there were no essential differences among the three oldest categories, as the 45 to 54 and 55+ groups had rate ratios versus age 35 to 44 not distinguishable from 1.0. This overall pattern of much lower rates among young persons prevailed across all time periods, as did the similarity among rates for three oldest categories, with the only notable exceptions being elevated rates estimated from the relatively small number of admittees in the 45 to 54 age group in the earliest two time periods. Available data do not permit controlling for marital status while examining the effect of age on institutionalization risk, because the marital status by age population distribution is not available from the published nineteenth-century US Census figures.
Admission rate ratios by age groups and perioda

aRate ratios are not adjusted for sex distribution differences, because this adjustment left the ratios essentially unchanged. N = 670 for the age 35–44 reference category.
Comparison of age effects in other contemporaneous institutions is difficult, given that other investigators have not considered the source population. We can however, compare the age composition of the Philadelphia asylum in 1883 described by Tomes with that of the Colorado Insane Asylum, which we presented in table 4. The two institutions’ distributions are relatively similar, but the Colorado sample has a smaller percentage of individuals aged 20 to 29, and somewhat more individuals aged 30 to 39 and 40 to 49. It is unclear whether the similar age composition of the two asylums reflects rates of admission, age structure of the source populations, or a combination of the two.
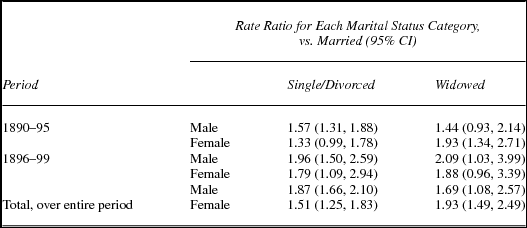
Marital status is another key demographic category affecting the risk of institutionalization. Given the greater frequency of single persons in the frontier environment, and more people living away from kin, marital status should be of particular relevance to noninstitutional opportunities for care. So, as others suggest (e.g., Tomes Reference Tomes1984: 323), we would suspect that single persons would be more likely to be admitted. Also, we would expect behaviorally or emotionally troubled persons to be less likely to have established or maintained a marital relationship. The data in table 6, which show the admission rate ratios by marital status categories for each sex and time period, largely support this conjecture. Only the years between 1890 and 1900 are shown because census data on the marital status distribution for Colorado is not available before 1890. Further, marital status distributions are not available by age, so it is not possible to adjust the rate ratios for differing age distributions within marital status categories, as previously noted. Single and divorced categories were combined, due to the rarity of divorce among Asylum patients. Table 6 shows that single and widowed persons, among both males and females, were more likely to be admitted to the Asylum than were those who were married, with a rate ratio of 1.87 and 1.69 for single males and widowed males as compared to married males. The corresponding ratios for females were 1.51 and 1.93 in comparison to their married counterparts. These data are consistent with the hypothesis that those without family ties had no other means of care and were consequently institutionalized.
Admission rate ratios for marital status categories, by sex and perioda

aColorado population marital status distribution for decennial years obtained from US Census (1890, 1900); figures for intercensal years were interpolated (linear). Census data on the marital status distribution for Colorado is not available before 1890, which limits the presentation here to the 1890–1900 period. Note also that because marital status distributions are not available by age, it is not possible to adjust the rate ratios for differing age distributions within marital status categories.
For comparison, again we can look at data presented by Tomes for the Pennsylvania Hospital for the Insane in Philadelphia. Table 4 shows marital status for males and females in the Pennsylvania Hospital in 1883 and that of the Colorado Insane Asylum population. Notice that for the Pennsylvania sample reported by Tomes (Reference Tomes1984), the percentage of married men and women is about the same as that of Colorado, while there are more single men than women and more widowed women than men. By contrast, in the Colorado sample there are about 20 percent more married men than women, but a far greater percent of single women than men. At the same time, there are many more widowed men than women as recorded in the medical records. Again it must be cautioned that without the population numbers from which the Pennsylvania asylum patient population was drawn, it is not entirely clear whether the similarities and differences observed in these two patient populations is real or whether the observed differences might be due to differences in the general population structure.
We next consider occupational status as a risk factor for Asylum admission. Insofar as occupation indicates class position, we expected that persons in lower-ranking occupations would have higher rates of admission, because they would have been less likely to have afforded private care. For this purpose, we used the relatively detailed occupational data given in the admission records to place each Asylum resident in the occupational categories used by the US Census from 1870 to 1900. The census reports population numbers by sex and occupational category, using only five categories: agriculture and mining, professional service, domestic and personal service, trade and transportation, and manufacturing and mechanical. These categories are not optimal for the current purposes. For example, the domestic and personal service category includes barbers and hairdressers, boarding and lodging house keepers, hotel keepers, engineers and firemen, hunters and guides, nurses and midwives, soldiers and policemen, servants, saloon keepers, laborers of all types, and government employees of all types, among other job categories. Trade and transportation includes real estate agents, bankers and brokers, bookkeepers, salesmen, drivers and teamsters, hucksters and peddlers, merchants and dealers, railroad employees, errand boys, and bank officials, among others (US Bureau of the Census 1890). These categories do not necessarily reflect economic class distinctions, at least as interpreted today. However, as a basis for examining occupation as a risk factor for Asylum admission, they are all that is available. Thus, these data were used as the basis for source population information in computing rates, with populations for intercensal years obtained by interpolation.
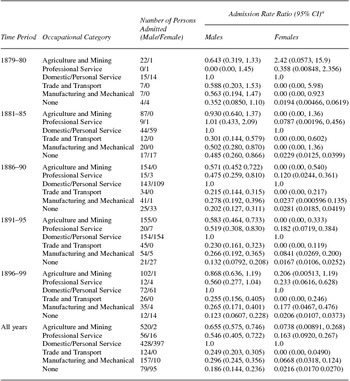
Table 7 displays admission rate ratios by occupational category, within sex, by five-year time period, with the domestic and personal service occupation category as the basis of comparison.
Rate ratios for admission by census occupational category, sex, and time period

aEach entry in this column is the ratio of the admission rate in each occupational category as compared to the rate for Domestic/Personal Service, within each sex and time period.
Looking first at the summary across all years, it can be seen that the admission rate was highest among those in the domestic and personal service category, with the result that rate ratios for all other categories were less than 1.0. Among males in the Asylum population, this category largely included persons who were reported in the original medical records as “laborers,” while among women Asylum residents, typical occupations fit under modern definitions of domestic work, with entries such as “housekeeper” or “laundress.”
The very lowest risk occupational category was “none,” with an admission rate less than one-fifth as high among males in the domestic and personal service reference category, and less than one-fortieth as high among females. Among males, the other occupational categories were also markedly lower, with trade and transport being next lowest, followed by manufacturing and mechanical, professional service, and agriculture and mining (ratio of 0.655). Among women, it is much more difficult to draw generalizations about occupational variation in admission rates, because numbers of Asylum residents are so low in all occupational categories outside domestic and personal service and none as to make rate ratios relatively meaningless.
In general outline, these results prevailed in all periods: in every single period and for both men and women, rate ratios for all categories were lower than for domestic and personal service (1881–85 for men being the one narrow exception). While the content of the other occupational categories may be somewhat ambiguous as regards class position, we can at least say that the highest admission rate occurred in a category with a clear, though not exclusive, predominance of persons from the bottom layer of the class structure.
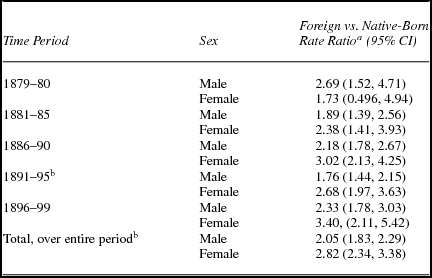
Another aspect of social advantage that influenced Asylum admission was the place or country of origin. We hypothesized that foreign-born persons, as more marginalized and less likely connected to extended kin, would have higher institutionalization rates than would those born in the United States. The results reported in table 8 show, first of all, that people of foreign birth were at least twice as likely to be admitted to the Asylum as were the native born.
Admission rate ratios for foreign vs. native born, by sex and period

a Ratios estimated based on rates calculated using US Census data on nativity of the Colorado population for the base. Population figures for intercensal years derive from interpolation of census data (1870–1900).
bFemale rate ratio differs from male ratio at p < 0.05.
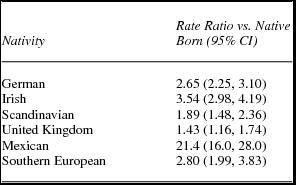
Over the entire 20-year time period represented by the records, this elevated rate was even higher for foreign-born women, a result that prevailed within every single period except 1879–80. Being a foreign-born citizen greatly increased the risk of Asylum admission. Table 9 offers a more focused examination of the influence of specific foreign nativities on the institutionalization rate, but due to small numbers, the rates have been combined across all 20 years. Of particular interest was the admission of those from German areas in Europe, Ireland, Scandinavia, the United Kingdom, Mexico, and southern European countries. The most dramatic finding was that the Irish were more than three times as likely to be admitted to the Asylum as the native born. We also found that the admission rate ratio for persons from Mexico was extremely high (21.4), which probably is an anomaly occasioned by substantial census undercounting in the heavily Mexican southern portion of Colorado, which would have lowered the denominator of the rates. Rates were also high among natives of Germany, Southern Europe, Scandinavia, and the United Kingdom, in that order. In interpreting these rates, though, one should recognize the other variables that might be correlated with immigrant status, such as age, marital status, or occupational status. Because the census does not give state-level distributions of immigrant status jointly with these other variables, an analysis of the influence of immigrant status adjusted for any of these other variables is not possible at the current time.
Admission rate ratio for specific non-US nativities, all years, 1879–99a

aRatios estimated based on rates calculated using US
Census data on nativity of the Colorado population for the base.
Discussion and Conclusion
The preceding has offered a quantitative analysis of factors related to admission to a nineteenth-century public mental hospital in the Mountain West. Here, we will summarize our findings, offer explanations for some of them, and conclude with comments on the scholarly contribution of the current work.
A first finding of interest is that admission or commitment to the insane Asylum did not entail permanent incarceration, as more than half of those admitted were discharged within six months. This is not different from the discharge data reported by Grob (Reference Grob1990) where he notes that before 1880 few patients remained in the institution for a year or longer while most were discharged within four to six months. A preliminary examination of the causes for admission to the Colorado Insane Asylum as noted by the admitting physician, indicated that about 20 percent of the patients (predominantly men), had intemperance listed as the primary diagnosis at admission. Therefore, males were more likely to be discharged within a short period of time than females, which also fits this conjecture. In fact at the time the Colorado Insane Asylum was opened, there was some public debate about what to name the institution. In the town of Pueblo, an editorial in the local newspaper, Colorado Weekly Chieftan, noted that there was an “alarming” increase in intemperance, and that an inebriate asylum was needed to cure this disease (1879). Rather than construct a state asylum for alcoholics, individuals were admitted to the Insane Asylum as a means of social control where inebriates were institutionalized until sober and then released. The practice of confining substance abusers in mental asylums or in institutions specifically constructed for the purpose was gaining popularity during the last half of the nineteenth century along with the growing popularity of the intemperance movement as discussed by Hall and Appelbaum (Reference Hall and Appelbaum2002).
Many patients though, were not discharged within the last 20 years of the nineteenth century, and 42 percent of them died at the institution. Males were more likely to die in the institution than females, a fact not explainable by gender differences in age distributions among the residents, so the explanation must lie in the kinds of problems from which men suffered at admission. One hypothesis would be that men in frontier Colorado were more likely than women to be exposed to certain health risks, particularly syphilis, toxic heavy metals, or head injuries from mining, ranching, or agriculture that would have brought them to the Asylum with both physical and mental problems. A closer analysis and better understanding of death and discharge rates, and the possible linking of them to physical and mental problems at admission, will have to remain as the subject of a future investigation.
Results of this study show sex difference in Asylum admission, with men consistently admitted at higher rates than women, even after adjusting for age. Several explanations for the male/female difference are possible: it could reflect sex-related health risks in the frontier Colorado environment, as just suggested. Or, the behavior of mentally ill men might have been more troubling to public or family order than that of women, increasing the chance that someone insisted on commitment. Alternatively, it could reflect whatever biological differences appear to lead to greater incidence of severe disabilities such as schizophrenia among men.
State institutions all over the country were established largely to address problems of the poor. Similarly, persons in Colorado of lower income/lower prestige occupations were more likely to be institutionalized in the nineteenth century. The higher admission rate of individuals in this category of typically lower skill, lower income occupations may stem from two causes. First, people in these occupations would have lacked the economic resources to enable them to pay for care, or resist commitment. Second, persons with cognitive and behavioral impairment sufficient for Asylum admission may have been in lower prestigious occupations precisely because of their impaired social functioning.
No different than other institutions in the country, nativity or ethnicity was also an important factor affecting admission to the Colorado Insane Asylum. Foreign-born men and women were admitted at, respectively, twice and three times the rate of their native counterparts. Particularly dramatic rates of admission are demonstrated among the Irish, who had 3.5 times higher rates of admission than native born. This parallels the observations of Tomes (Reference Tomes1984) and Grob (Reference Grob1983) about heavy Irish representation in asylums elsewhere in the United States, and is consistent with commitment practices based on a nineteenth-century American view of the Irish as racially and culturally inferior to other white nationalities (Smedley Reference Smedley2007: 150–53, 222–23). How such racialized practices were extended to Mexican immigrants is unclear because, while their relative admission rate was quite high, this finding is as likely to reflect census undercounts as actual admissions. African Americans, though present in Colorado, were nearly absent from the Asylum, and Native Americans had already been removed from the state and confined to reservations.
The current work offers several scholarly contributions. First, it contrasts with other literature on nineteenth-century asylums by describing an institution in the frontier West as opposed to the urban East. Although we hypothesized that admission and incarceration in the Asylum may have been different on the frontier, it appears that the Colorado institution followed a similar trajectory to other, earlier established mental institutions in the East. Were diaries or other detailed accounts of the admission of certain individuals to the institution available, it may have helped to provide detailed information about admissions that is lacking and which could shed light on the entire institutionalization process. Also, at the time the Colorado Insane Asylum was established, the legislature stated that it would save money to house patients in the state, yet there were only five individuals institutionalized out of state (Stone Reference Stone1919). That does not suggest a sufficient state need to merit constructing buildings, establishing fields and gardens, and hiring a medical superintendent for an institution. Further research could shed more light on this.
This study focuses directly on admission, rigorously connecting the characteristics of the patients to the composition of the population from which they came. As such this should serve as an example of how to apply epidemiological methods to such a problem. More importantly, however, the admission data should be of particular interest to those theorizing about asylums as agents of social control, particularly in the frontier West, because it does appear persons from marginalized or potentially threatening ethnic and other statuses were more likely to be admitted. Finally, the current work has given relatively little attention to patient experience within the asylum such as death and discharge, and we hope that future work on those topics can further illuminate the role of social characteristics in the nineteenth-century Colorado Insane Asylum.