INTRODUCTION
How does normal cognitive aging differ from pathological cognitive aging, such as that seen in Alzheimer’s disease (AD)? Some researchers suggest that AD is an exaggeration of normal aging in which cognition declines along a single continuum and severe impairment (i.e., dementia) is an acceleration of the same process that causes normal cognitive decline (Brayne & Calloway, Reference Brayne and Calloway1988; Huppert, Reference Huppert, Huppert, Brayne and O’Connor1994). However, recent research on the nature of age-related decline strongly supports the multiple factor framework of cognitive aging in which brain changes in normal aging are distinct from pathological changes evident in AD. The multiple factor framework specifies that more than one process is responsible for cognitive decline with age (Buckner, Reference Buckner2004; Gabrieli, Reference Gabrieli1996; Hedden & Gabrieli, Reference Hedden and Gabrieli2004).
Buckner (Reference Buckner2004) argues that there are multiple distinct factors responsible for age-associated cognitive decline and that these factors may target different brain regions and produce different cognitive profiles. For example, there is evidence that the frontal lobes are primarily affected by aging, whereas the medial temporal and parietal lobes are affected in early AD, suggesting that cognitive decline in normal aging is attributable to changes in the frontal lobes, whereas cognitive decline in the early stages of AD is attributed to medial temporal lobe and parietal lobe pathology.
Support for the multiple factor framework comes from both neuroimaging (e.g., Head et al., Reference Head, Snyder, Girton, Morris and Buckner2005; Ohnishi, Matsuda, Tabira, Asada, & Uno, Reference Ohnishi, Matsuda, Tabira, Asada and Uno2001) and behavioral (e.g., Albert, Reference Albert1997; Gabrieli, Reference Gabrieli1996) studies. Head et al. (Reference Head, Snyder, Girton, Morris and Buckner2005) reported that, whereas there was only minimal reduction in hippocampal volume in nondemented older adults compared with a younger control group, there were significant reductions in hippocampal volume in mild AD patients. Furthermore, across the mild AD and nondemented older adults there was evidence of reduction in anterior white matter volume. These findings support the existence of an AD-specific influence on the medial temporal and parietal lobes likely affecting memory, and a separate ubiquitous age-related influence on frontal white matter regions that may affect abilities, often classified as executive functioning, in older adults. Ohnishi et al. (Reference Ohnishi, Matsuda, Tabira, Asada and Uno2001) found widespread age-related cortical volume reductions but AD-specific reduction in the hippocampal formation and entorhinal cortex.
Normal age-associated declines in cognition have not been limited to performance on tasks hypothesized to reflect executive functioning, but have also been demonstrated on measures of memory, processing speed, reasoning, and spatial ability, both cross-sectionally (e.g., Salthouse, Reference Salthouse2004) and longitudinally (e.g., Christensen, Reference Christensen2001). What differentiates AD-associated from age-associated declines is the pattern of impairment. Albert (Reference Albert1997) reported that difficulty acquiring new information is often the most salient symptom of AD and, in fact, AD patients show substantial impairment in delayed recall, as compared to immediate recall when compared with normal controls. This finding is consistent with findings indicating that early AD is associated with neuronal loss and the formation of neurofibrillary tangles and neuritic plaques in the entorhinal cortex and subiculum, regions responsible for transferring information into and out of the hippocampus.
The use of multivariate statistics applied to neuroimaging data provides an innovative way to examine whether multivariate analysis of PET data reflects the multifactorial nature of age-related cognitive decline. PET and single photon emission computed tomography (SPECT) studies across the adult lifespan have demonstrated distinct patterns of cerebral blood flow (CBF) reduction associated with normal aging (Krausz, Bonne, Gorfine, Karger, Lerer, & Chisin, Reference Krausz, Bonne, Gorfine, Karger, Lerer and Chisin1998; Takahashi, Yamaguchi, Kobyashi, & Yamamoto, Reference Takahashi, Yamaguchi, Kobyashi and Yamamoto2005; but see Meltzer et al., Reference Meltzer, Cantwell, Greer, Ben-Eliezer, Smith and Frank2000) and with AD (e.g., Benson, Kuhl, Hawkins, Phelps, Cummings, & Tsai, Reference Benson, Kuhl, Hawkins, Phelps, Cummings and Tsai1983; Bradley et al., Reference Bradley, O’Sullivan, Soper, Nagy, King and Smith2002; Jagust, Reference Jagust2004; Johnson, Mueller, Walshe, English, & Holman, Reference Johnson, Mueller, Walshe, English and Holman1987). These studies have generally relied on univariate analytic approaches to identify discrete regions of group differences in CBF. In a typical univariate analysis, parametric statistics are applied to information contained within each image voxel to identify group differences that exceed an a priori determined statistical threshold. Although useful for examining group differences in specific regions, this technique, by definition, does not address explicitly the relationship among voxel values and is limited in drawing inferences about functional connectivity. An alternative to the use of univariate statistics applied to functional neuroimaging data is the use of a multivariate approach, such as the Scaled Subprofile Model (SSM). SSM uses principal components analysis to derive which voxel values covary, and then tests linear combinations of the identified principal components to identify functional patterns that distinguish between groups (e.g., healthy elderly vs. those with AD). The SSM captures spatially correlated activity (i.e., patterns of activation across the brain) and thus is better suited than univariate analyses to examine functional connectivity.
The main purposes of this study were to use SSM to investigate whether PET reflects the multifactorial nature of age-related cognitive decline, as well as to evaluate the ways in which an age-related covariance pattern is distinct from an AD-related pattern using a novel statistical approach. To accomplish this goal we first needed to identify an age-related covariance pattern with SSM that effectively distinguished between neurologically healthy younger and older adults with H215O PET. Covariance patterns of brain metabolism assessed with fluorodeoxyglucose (FDG) PET (Moeller et al., Reference Moeller, Ishikawa, Dhawan, Spetsieris, Mandel and Alexander1996) have been identified previously that discriminate between young and older adults. Identifying an H215O PET covariance pattern that successfully distinguishes between older and younger subjects may provide a sensitive signature of the aging process in the healthy brain.
One advantage of SSM analysis is that it allows the subject’s expression of the covariance pattern to be represented by single number (subject scaling factor, SSF), which, in turn, easily allows examination of neuropsychological correlates of age-related cerebral changes. For example, Scarmeas et al. (Reference Scarmeas, Habeck, Zarahn, Anderson, Park and Hilton2004) found that expression of an identified PET pattern in healthy older subjects, subjects categorized as cognitively impaired, and subjects diagnosed with mild AD was negatively correlated with memory scores and performance on a test of overall cognitive status. Greater expression of the covariance pattern indicates greater manifestation of the pattern, which may include both areas of relatively increased and decreased activity. Another goal of this study was to examine whether individual differences in the expression of an age-related pattern are associated with cognitive function in nondemented older adults.
Based on the previous findings that demonstrated a relationship between cognitive performance and expression of the AD-related covariance pattern, we expected that expression of the age-related covariance pattern to be negatively associated with tests known to decline with age. That is, we hypothesized that SSF would be associated with poorer performance on measures of memory, processing speed, and overall cognitive status. Measures of knowledge show a positive relation with age until approximately the mid-50s, at which time the relationship becomes stable or declines slightly (e.g., McArdle, Ferrer-Caja, Hamagami, & Woodcock, Reference McArdle, Ferrer-Caja, Hamagami and Woodcock2002; Salthouse, Reference Salthouse2004; Tucker-Drob, Reference Tucker-Drob2009). Because the SSM pattern captures systems underlying age- or disease-relate cognitive decline, we hypothesized that there would not be a strong relation between pattern expression and measures of knowledge.
Once an age-related pattern was identified, it was compared with a pattern that distinguishes between cognitively healthy older adults and those with mild AD, similar to the pattern presented in Scarmeas et al. (Reference Scarmeas, Habeck, Zarahn, Anderson, Park and Hilton2004). Several steps can be taken to examine whether PET reflects the multifactorial nature of cognitive aging.
First, the similarity between the age-related pattern and the AD-related pattern can be assessed by examining whether there are unique distributions of brain areas associated with each covariance network. This is evaluated by examining whether the age-related pattern is effective at distinguishing between older normal controls and mild AD subjects, and whether the AD-related pattern is effective at distinguishing between younger and older subjects. This is accomplished by forward-applying the age-related pattern to the older/AD sample and calculating each subject’s expression of the pattern to examine whether the pattern can successfully discriminate between healthy older subjects and the AD patients. Similarly, the AD-related pattern can be forward applied to the young/older sample and its effectiveness at distinguishing between the young and older groups can be evaluated. The multifactorial view of cognitive aging would be supported if the effectiveness of the patterns were diminished when forward-applied to the alternate groups.
A second approach to evaluate the differences between the patterns involves removing the age effect from the data by statistically removing the activity related to the age-derived pattern, and calculating a new AD-related covariance pattern. The newly derived AD-related pattern can be compared with the original AD-related pattern to examine which components of the AD-related pattern can be attributed to an age effect. If the pattern does not change substantially, in particular its ability to accurately categorize cognitively healthy participants and participants diagnosed with AD, the implication is that aging and AD are different processes.
To summarize, the main purpose of this study was to use SSM to examine the utility of covariance patterns derived from PET data in reflecting the differences in normal and pathological cognitive aging. We first identified a covariance pattern using H215O PET data that successfully distinguished between a group of younger and cognitively-healthy older adults. Second, we examined whether individual differences in expression of the age-related pattern are associated with cognition. Finally, we compared the age-related covariance pattern with an AD-related pattern to examine the differences in normal age-related and AD-related declines.
METHODS
Subjects
Subjects were from ongoing neuroimaging studies and included 23 younger adults (mean age = 23.39 years; SD = 2.31; range = 19–28 years) and 16 older adults (mean age = 71.44 years; SD = 6.84; range = 62–81 years). They were carefully screened with medical, neurological, psychiatric, and neuropsychological assessments and those with neurological, psychiatric, or severe medical disorders were excluded. Performance on the Mini Mental State Examination (MMSE; Folstein, Folstein, & McHugh, Reference Folstein, Folstein and McHugh1975), North American version of the New Adult Reading Test (NART, Nelson, Reference Nelson1982), Selective Reminding Test (SRT; Bushke & Fuld, Reference Bushke and Fuld1974), and Wechsler Adult Intelligence Scale-Revised (WAIS-R; Wechsler, Reference Wechsler1981) digit symbol and vocabulary subscores was evaluated to exclude those individuals with dementia or cognitive impairment. All data were obtained in compliance with institutional guidelines.
Neuropsychological Evaluation
Subjects were administered a brief cognitive battery including a modified version of the MMSE, which is designed to assess overall cognitive status. The modified MMSE (mMMSE; Stern, Sano, Paulson, & Mayeux, Reference Stern, Sano, Paulson and Mayeux1987) has a maximum score of 57 and includes all the items in the original MMSE in addition to items designed to assess attention/calculation, general knowledge, language, and construction. The SRT was used to measure list learning and verbal memory. SRT total recall, SRT delayed recall, and SRT delayed recognition were the measures used. From the WAIS-R the Vocabulary subtest and Digit Symbol subtest (a measure of processing speed) were used as dependent measures. The NART is a test that requires subjects to pronounce words that violate conventional grapheme–phoneme rules, and has been used to assess overall intellectual functioning.
Image Acquisition and Postprocessing
H215O resting PET scans were acquired for each individual by injecting a bolus of 30 mCi H215O intravenously. A Siemens EXACT 47 PET camera (Knoxville, TN) was used and scan acquisition was triggered by the detection of a threshold level of true counts from the camera. Two 30-s scan frames were acquired and were averaged to produce a single image per subject. Because arterial blood sampling was not conducted, only nonquantitative count images were obtained. Each subject’s image was spatially transformed to the PET Montreal Neurological Institute template and subsequently smoothed with an isotropic Gaussian kernel (FWHM = 12 mm) using SPM 99 (Wellcome Department of Neurology).
Subprofile Scaling Model
For the SSM analysis, voxel-wise data from resting H215O PET scans from both younger and older adults were simultaneously included in a principal components analysis. Principal components (PCs) were identified that captured the greatest amount of variance. Each voxel has either positive or negative loading in each PC. To identify a covariance pattern that best discriminated between the younger and older groups, each subject’s expression of the first five PCs was entered into a linear regression model as the independent variable. Group membership (younger vs. older) was the dependent variable. This regression yielded a linear combination of five PCs that best discriminated the younger and older groups. The number of PCs to be included in the analysis was determined by Akaike’s information criterion (AIC) (Burnham & Anderson Reference Burnham and Anderson2002). The first five PCs had the lowest value of AIC and were therefore selected as predictors in the regression model. Selecting the set with the lowest AIC criterion value in the group discrimination fit ensures the best possible bias-variance trade-off, that is, using enough information in the data to ensure satisfactory group discrimination without over fitting the noise in our subject sample by including too many parameters in the fit.
A bootstrap resampling technique was used to assess the stability of weights of all the voxels in the covariance pattern. The term “covariance pattern” refers to this linear combination of the first five PCs. A subject scaling factor (SSF) was calculated for each subject. The SSF, similar to a factor score, represents the extent to which the subject expresses the PCs; higher SSF values indicate that voxels with positive loadings have increased flow and voxels with negative loadings have corresponding decreased flow.
The identified age-derived pattern was forward-applied to PET data from older subjects and mild AD subjects. The AD group consisted of individuals who were outpatients at the AD Research Center at Columbia University who met NINCDS-ADRDA criteria for probable AD (McKhann, Drachman, Folstein, Katzman, Price, & Stadlan, Reference McKhann, Drachman, Folstein, Katzman, Price and Stadlan1984) and had a Clinical Dementia Rating (CDR) of 1. The AD sample consisted of 17 patients (mean age = 68.4 years; SD = 8.7) diagnosed with mild AD. Participants whose dementia etiology was not attributed to AD were excluded. The mean mMMSE score of the sample was 46.4 (SD = 5.1), which corresponds to a Folstein MMSE of approximately 25. Detailed description of the recruitment and demographic characteristics of the AD sample have been reported (Scarmeas et al., Reference Scarmeas, Habeck, Zarahn, Anderson, Park and Hilton2004). Older subjects used in the derivation of the AD-related pattern were the same subjects used in the current study to derive the age-related pattern. The older sample performed significantly better on all neuropsychological tests (i.e., mMMSE, SRT total, SRT delayed recall, and age-adjusted scores on the WAIS-R digit symbol) relative to AD patients (Scarmeas et al., Reference Scarmeas, Habeck, Zarahn, Anderson, Park and Hilton2004).
The AD-related covariance pattern was identified by subjecting resting voxel-wise PET data from a set of AD patients and cognitively-healthy older adults to an SSM analysis in which each subject’s expression (SSF) of the first five PCs was entered into a linear regression model as the independent variable. Group membership (AD vs. cognitively-healthy older adults) was the dependent variable. This regression resulted in linear combination of the five PCs that best discriminated between the two groups. Once again, AIC was used to determine the number of PCs to retain in the regression.
To facilitate comparisons across the different patterns it was important to use a conjunction of all subjects, i.e., Alzheimer’s subjects, cognitively-healthy older adults and young adults, before any analysis as to ensure that identical voxel subsets were considered in all analyses in this study. This necessitated that we re-derive the AD-related pattern. Although slightly different than the AD-related pattern originally presented in Scarmeas et al. (Reference Scarmeas, Habeck, Zarahn, Anderson, Park and Hilton2004), our bootstrap map correlated highly (.93) with the Scarmeas et al. bootstrap map. The area under the curve was 85.7% and a cutoff value of −.37.33 yielded a sensitivity of 81% and specificity of 77%.
To forward-apply the pattern every voxel value in a subject scan is multiplied by the corresponding voxel weight in the covariance pattern, and subsequently summed over the whole brain volume. The summation is represented by a single number that shows the extent each subject expresses the age-related pattern (i.e., the SSF). Each subject’s SSF is then entered into a linear regression with group membership (e.g., older adults vs. probable AD) as the dependent variable. This was done for both the age-related and AD-related patterns.
The age-related pattern was also statistically removed from the data as a test of the patterns’ similarity. Assuming that any data set can be written in matrix form as Y, where rows denote scans, and columns denote voxels, and the age-related covariance pattern can be denoted as row vector, v, removal of the variance associated with the covariance pattern from the data set is a simple projection. The residualized data matrix Yres can be obtained as: Yres = Y (1 - v’ v), where 1 denotes the unit matrix.
RESULTS
Identifying the Age-Related Pattern
Demographic and neuropsychological data from the young and older groups are presented in Table 1. The younger group performed better on the mMMSE, on all measures of the SRT, and on the digit symbol test unadjusted for age. The average performance of the cognitively healthy older adults on the mMMSE (M = 54) is comparable to a score of 29 on the original 30-point MMSE. There were no significant differences in years of education or performance on vocabulary subtest and the NART across the groups.
Means (and SDs) for the demographic and neuropsychological data

Note
Mean values and standard deviations (SDs, in parentheses) are reported. Some of the information in this table regarding the older adults was previously reported in Scarmeas et al. (Reference Scarmeas, Habeck, Zarahn, Anderson, Park and Hilton2004). mMMSE = modified Mini Mental State Examination; SRT = Selective Reminding Test; NART = New Adult Reading Test.
* p < .05.
** p < .01.
The identified covariance pattern that discriminated between the younger and older subjects is presented in Figure 1.
Bootstrap Z-map of the horizontal, axial, and sagittal view of the brain regions involved in the age-derived covariance pattern (above the 3.09 threshold, suggesting a one-tailed p level of .001). Positive factor loadings, indicating an age-related increase in cerebral blood flow (CBF), are represented in “hot” colors.

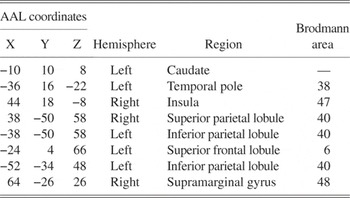
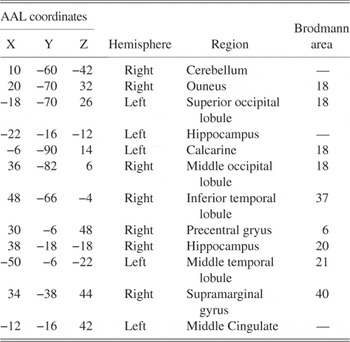
The MNI coordinates and their anatomical labeling (Tzourio-Mazoyer et al., Reference Tzourio-Mazoyer, Landeau, Papathanassiou, Crivello, Etard and Delcroix2002) are presented in Tables 2 and 3, respectively. Specific regions associated with negative loadings, corresponding to an age-related decrease in flow, included the caudate, insula, parietal lobule, and the frontal gryus (see Table 2).
MNI coordinates and AAL of areas in the age-related covariance pattern with negative loadings

Note
Areas with cluster extent > 20 are presented.
MNI coordinates and AAL of areas in the age-related covariance pattern with positive loadings

Note
Areas with cluster extent > 20 are presented.
Positive loadings, indicating age-associated increases in flow, were observed in the cuneus, cerebellum, hippocampus, and the temporal and occipital gyri (see Table 3).
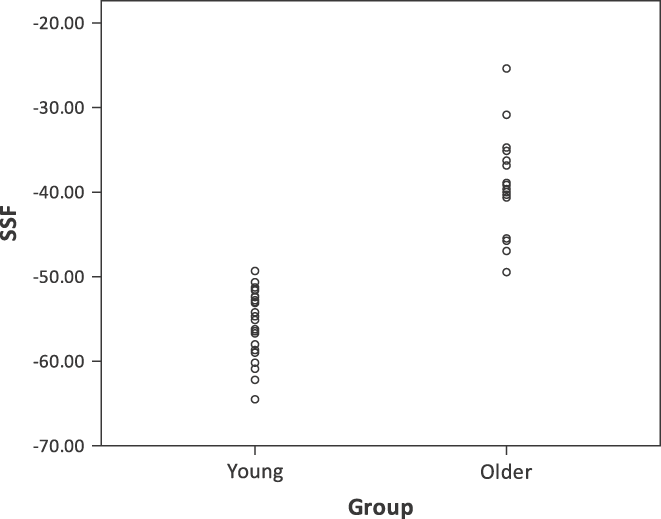
By design, the mean subject expression of the identified covariance pattern was significantly greater in the older subjects than in the younger subjects (p < .001; Figure 2). The greater mean SSF in older subjects suggests that, compared with the younger adults, they have more increased flow in areas with positive loadings and more decreased flow in areas with negative loadings.
Distribution of the subject scaling factor (SSF) of the age-related pattern across young and older subjects.

A receiver operating curve (ROC) was used to determine the SSF cutoff value that produced the optimal group discrimination (i.e., sensitivity and specificity). Near perfect discrimination between the younger and older groups was obtained with a SSF cutoff value of −.50.6, yielding a sensitivity of 95.7% and a specificity of 100%.
Neuropsychological Test Performance
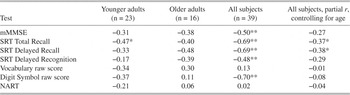
Table 4 presents the correlations among the expression of the age-related covariance pattern and performance on the neuropsychological variables in the nondemented subjects. Within the young group, subjects’ SSFs were negatively correlated with SRT total recall performance. The magnitude of the associations between pattern expression and cognition was similar in older groups, although the correlation coefficients did not reach statistical significance, likely due to the smaller sample and decreased power. When the subjects were pooled, the expression of the pattern was negatively correlated with performance on the mMMSE, with all three of the SRT memory variables, and with the digit symbol test. After partialling out the effect of age, which correlated .90 with SSF (p < .001), performance on SRT total recall and delayed recall was still significantly negatively correlated with expression of the pattern.
Pearson correlation coefficients (r) between SSF of the age-related covariance pattern and neuropsychological variables

Note
mMMSE = modified Mini Mental State Examination; SRT = Selective Reminding Test; NART = New Adult Reading Test.
* p < .05.
** p < .001.
Comparisons of the Age-Related and AD-Related Patterns
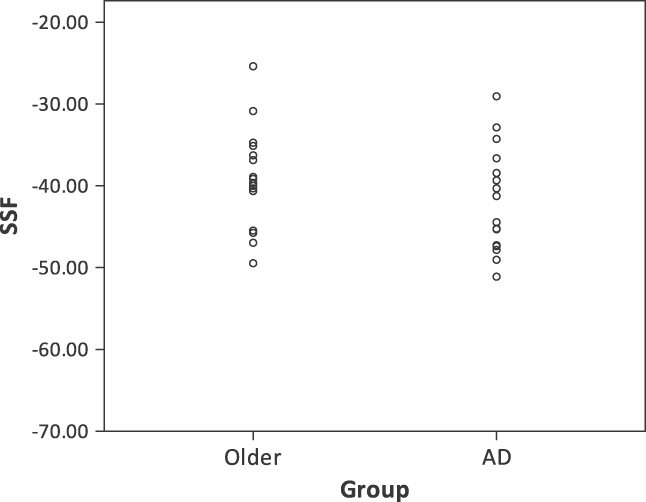
Two techniques were used to compare the age-related pattern and the AD-related covariance pattern. The first technique for comparing the age-related and AD-related pattern involves forward-applying the patterns. First, the identified age-related pattern was forward applied to the sample of healthy older subjects and the mild AD patients, and the SSF was calculated for each subject. The SSF reflects the subjects’ expression of the age-related pattern only. The purpose of the forward-application was to determine whether the age-related pattern can distinguish between a group of older adults and AD subjects. The SSF of the older and AD groups of the forward-applied age-related pattern is presented in Figure 3. It can be seen that the discrimination between the healthy older adults and AD patients was very poor. The area under the curve was 61.4%.
Distribution of the subject scaling factor (SSF) of the age-related pattern forward-applied to the healthy older subjects and mild Alzheimer’s disease (AD) subjects.

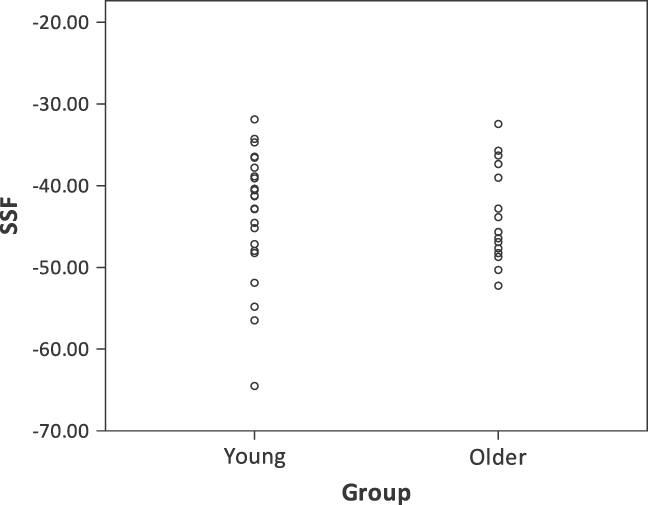
In the next step, the AD-related pattern was forward-applied to the sample of young and older adults. In this case, the SSF reflects the subjects’ expression of the AD-related pattern, which is presented in Figure 4. Once again, the AD-related pattern did a poor job of discriminating between the young and older groups. The area under the curve was 55.4%.
Distribution of the subject scaling factor (SSF) of the Alzheimer’s disease (AD) -related pattern forward-applied to the young and healthy older subjects.

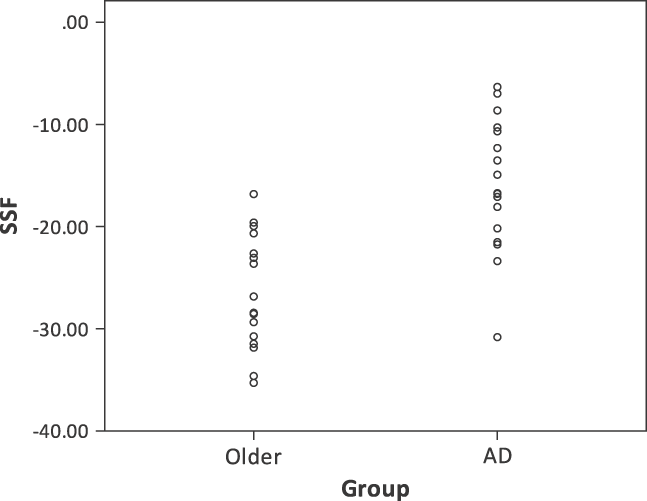
The second technique involves removing the age-related pattern from the data of the older and AD samples. With the identified age-associated pattern statistically removed from the data, a new AD-related pattern was then calculated using SSM. Figure 5 presents the distribution of the SSF of the AD-related pattern across healthy older subjects and mild AD patients, after the age-related pattern had been removed from the data. An ROC curve was used to determine which SSF score produced the best sensitivity and specificity. The area under the curve was 88.6%, and using a SSF cutoff of −18.84, this new AD-related pattern had a sensitivity of 94% and a specificity of 71%. Thus, the specificity and sensitivity of the new AD-related pattern, with the age-related covariance pattern removed from the data, was very similar to the original AD-related pattern.
Distribution of the subject scaling factor (SSF) of the Alzheimer’s disease (AD) -related pattern, with the age effect statistically removed, across healthy older subjects and mild AD subjects.

The original AD-related covariance pattern that discriminated between the older and AD subjects is presented in Figure 6A along with the covariance pattern of the new AD-related pattern (Figure 6B) after removing the normal age-related activity. The figure demonstrates the similarity between the two patterns.
Bootstrap Z-map of the horizontal, axial, and sagittal view of the brain regions involved in the Alzheimer’s disease (AD) -related covariance pattern (above the 2.00 threshold, suggesting a one-tailed p level of .03) are presented in panel A and the AD-related pattern, after removing the age effect, is presented in panel B. Positive factor loadings, indicating an AD-related increase in cerebral blood flow (CBF), are represented in “hot” colors.

DISCUSSION
Using a multivariate covariance technique applied to H215O PET, an age-related covariance pattern data was identified that discriminated between a sample of younger and older adults with high sensitivity and specificity. One benefit associated with SSM analysis is that the expression of the covariance pattern can be represented parsimoniously with a single number. The SSF may reflect systematic changes in CBF associated with normal aging, and it easily permits an examination of behavioral correlates of age-related cerebral changes.
We hypothesized that expression of the covariance pattern would be correlated with measures of memory, processing speed, and overall cognitive performance. Across the sample of young and older adults, each of these measures was strongly correlated with the SSF, with correlation estimates ranging from −.49 to −.70. Furthermore, when the effect of age was statistically controlled, expression of the pattern was still significantly correlated with SRT total recall and SRT delayed recall. These findings suggest that SSM analysis captured age-related differences in CBF that may underlie memory performance independent of age. That is, over and above the variation accounted for by age, subject expression of the covariance pattern explained additional variation in performance on the memory tasks, suggesting that expression of the pattern may be more functionally significant than chronological age itself.
We had also hypothesized that the measures of knowledge (i.e., vocabulary subtest, NART) would be not be strongly related to SSF. And, in fact, we found that there was no significant relationship between SSF of the age-related pattern and performance on these tasks, which speaks to the specificity of the findings to age-related cognitive decline.
Additional analyses compared the age-related covariance pattern with an AD-related pattern. Positive loadings in the AD-related pattern were seen in the lingual gyrus, cuneus, claustrum, and parahippocampal gyrus. Negative loadings were noted in bilateral parietal lobules, bilateral frontal lobules, left temporal gyrus, and cingulate. Therefore, whereas the AD-related pattern was defined primarily as negative loadings in the parietal lobule, frontal lobule, and cingulate and by positive loadings in the lingual gyrus, cuneus, and parahippocampal gyrus, the age-associated pattern was primarily defined by negative loadings in the caudate, insula, and prefrontal lobe and positive loadings in the cerebellum, occipital and temporal lobules. The patterns are consistent with previous reports of AD- and age-related dysfunction. Inspection of Figure 1 shows that there is a large area in the frontal lobe associated with age-related decreases in CBF. Inspection of Figure 6 indicates that there is a large area of decreased flow in the left medial temporal lobe, as might be expected of an AD-related pattern. The AD-related pattern is consistent with previous PET studies (Klunk et al., Reference Klunk, Engler, Nordberg, Wang, Blomqvist and Holt2004) and generally reflects the distribution of AD pathology. Neuroimaging and behavioral studies (see Buckner, Reference Buckner2004, for a review) have shown that “normal” aging is best characterized by morphometric, functional, and neuropsychological dysfunction associated with the frontal lobes.
Two approaches were used to compare the age- and AD-related patterns. In the first approach, the age-related pattern was forward-applied to the sample of older and mild AD patients to examine whether it was useful for discriminating between the groups. The SSF was calculated for each individual and the discrimination of the age-related pattern on the older and AD groups was poor. When the AD-related pattern was forward applied to the sample of young and older adults it, too, was poor at discriminating between the groups. These findings suggest that normal and AD-related differences in the brain can be represented by distinct covariance patterns, thereby providing additional support for the multiple factor framework of aging, because the effectiveness of the age-related and AD-related patterns in group discrimination did not transfer across the samples.
In the second technique, the age effect was removed statistically from the data of the older subjects and the AD patients, and a new AD-related pattern was identified with SSM. This new AD-derived pattern was compared with the original AD-related pattern. The sensitivity and specificity of the new pattern was similar to that of the original AD-related pattern, which suggests that the age-related pattern did not have a lot in common with the AD-related pattern. Similarly, removing the age effect by covarying the activity related to the age-derived pattern did not affect the ability of the AD-related pattern to discriminate between the two groups. As the pattern did not change substantially after the removal of the age effect and its ability to accurately categorize participants was maintained, we can be fairly confident that the utility of the AD-related pattern is unaffected by age. This finding suggests that the expression of the AD-related pattern may be useful clinically in identifying individuals who are experiencing pathological changes. Future studies may use in vivo measurement of pathology (e.g., Pittsburgh Compound B) to validate the usefulness of these findings.
Many studies have examined mediators of the relationship between normal aging and CBF. For example, vascular conditions, such as hypertension (e.g., Nobili et al., Reference Nobili, Rodriguez, Marenco, De Carli, Gambaro and Castello1993; Shaw, Mortel, Meyer, Rogers, Hardenberg, & Cutaia, Reference Shaw, Mortel, Meyer, Rogers, Hardenberg and Cutaia1984), diabetes (e.g., Nagamachi et al., Reference Nagamachi, Nishikawa, Ono, Ageta, Matsuo and Jinnouchi1994; Quirce et al., Reference Quirce, Carril, Jimenez-Bonilla, Amado, Gutierrez-Mendigucia and Banzo1997), and other stroke risk factors have been shown to be related to CBF. Furthermore, stroke risk factors have been shown to be related to poorer cognitive functioning (e.g., Elias, Wold, D’Agostino, Cobb, & White, Reference Elias, Wolf, D’Agostino, Cobb and White1993) and to predict future cognitive decline (e.g., Knopman et al., Reference Knopman, Boland, Mosley, Howard, Liao and Szklo2001) or incident dementia (e.g., Luchsinger, Reitz, Honig, Tang, Shea, & Mayeux, Reference Luchsinger, Reitz, Honig, Tang, Shea and Mayeux2005; Luchsinger & Mayeux, Reference Luchsinger and Mayeux2004). In the current study, while we did not consider stroke risk factors explicitly, participants were medically screened and excluded if they had significant medical morbidity. Nonetheless, it is possible that subtle, subclinical vascular disease may have impacted the derivation of the age- and AD-associated covariance patterns either through its effect on CBF directly or through interaction with chronological age or AD pathology. It will be important for future studies to derive SSF patterns based on the distribution of known risk factors for cognitive aging or mediators of age-associated effects on CBF, such as vascular risk factors.
In conclusion, comparison of an age-related and AD-related patterns in the current sample indicate that the age-related pattern did not discriminate between older and mild AD groups, and the AD-related pattern did not discriminate between young and older groups. Also, the age-related and AD-related covariance patterns did not have a lot in common. These findings suggest that distinct covariance patterns can be derived with PET data using a novel statistical approach that can discriminate between normal and pathological aging. This approach provides evidence consistent with the multifactorial nature of cognitive aging and has potential utility for early identification of pathological aging. Furthermore, prospective application of these covariance patterns in independent data sets might allow the quantification of separate age- and AD-related burden on resting-state cerebral blood flow.
ACKNOWLEDGMENTS
K.L.S. is supported by a training grant from the National Institute of Mental Health (T32 MH020004). This work was supported by the federal grant R01 AG026158 (Y.S.), R01 EB006204 (C.H.), and K23 AG029949 (A.M.B.).