Globally, the food transition is primarily driven by changes in food systems, characterised by the increased availability and consumption of ultra-processed foods (UPF)(Reference Popkin, Barquera and Corvalan1). According to the Nova classification, UPF are industrial formulations that are typically ready for consumption and composed of numerous substances extracted from foods (oils, fats, sugar, starch and proteins) and derived from food constituents (hydrogenated fats and modified starch). Many of these substances are used exclusively in industrial processing, with little to no fresh or minimally processed foods in their composition(Reference Monteiro, Cannon and Levy2).
Higher consumption of UPF has been associated with various adverse health outcomes across different stages of life(Reference Lane, Gamage and Du3,Reference Louzada, Costa and Souza4) . In children, a consistently higher intake of UPF over time is associated with obesity, cardiovascular diseases, asthma, and cancer(Reference De Amicis, Mambrini and Pellizzari5). Children, adolescents, and adults are increasingly consuming UPF in their diets(Reference Louzada, Cruz and Silva6–Reference Oviedo-Solís, Monterrubio-Flores and Cediel9). Studies considering children > 2 years (> 2 years) old, adolescents, and adults have shown that higher UPF consumption negatively affects the nutritional quality of diets, leading to increased intake of free sugars, total fats, and saturated fats while reducing the intake of fibre, protein, potassium, Zn, Mg and vitamins A, C, D, E, B12 and niacin(Reference Martini, Godos and Bonaccio10–Reference Louzada, Martins and Canella12). However, this relationship is still little known for younger children (< 2 years). In the USA, the energy contribution of UPF for children < 2 years is greater than that of unprocessed or minimally processed foods (45 % and 42 %, respectively), and UPF contributed most to intakes of Fe, Zn and Na(Reference O’Connor, Martinez-Steele and Wang13).
Many products aimed at children are fortified with synthetic micronutrients as part of a commercial strategy. The fortification of UPF is accompanied by misleading advertising that may contribute to customers to believe they are consuming healthy food products(Reference Kroker-Lobos, Mazariegos and Guamuch14), regardless of the type of processing or other ingredients used in their production. Furthermore, children may be at risk of excessive micronutrient intake from UPF(Reference Sangalli, Rauber and Vitolo11,Reference Vítolo, Baratto and Sangalli15) . These characteristics highlight the complex role of UPF in childhood nutrition and underscore the limitations of relying on UPF as a source of micronutrients.
The Brazilian population represents a relevant target for investigating the impacts of UPF consumption, as the predominant Brazilian dietary pattern is still predominantly based on unprocessed or minimally processed foods, resulting in a relatively low contribution of UPF to total energy intake(Reference Monteiro, Louzada and Steele-Martinez16). Moreover, the specific relationship between UPF consumption and nutrient intake among children under 5 years of age – particularly those < 2 years – remains poorly understood. Examining this relationship is especially important in populations where the dietary contribution of UPF has not yet surpassed that of unprocessed foods, to generate robust evidence supporting dietary guidelines that emphasise that, even during early childhood. Therefore, this study aims to describe the amounts of energy and macro- and micronutrient intake by Brazilian children based on the Nova classification and to estimate the association between this consumption and energy participation of UPF in the diet at 6–23 and 24–59 months.
Methods
Study design, sampling and population
This manuscript uses cross-sectional study data from the Brazilian National Survey on Child Nutrition (ENANI-2019), a household survey with a complex probabilistic sample that examined 14 558 Brazilian children < 5 years in 123 municipalities distributed in twenty-six states and the Federal District(Reference Vasconcellos, Silva and Castro17,Reference Alves-Santos, Castro and Anjos18) . The ENANI-2019 sample design used stratification and clustering and is representative of Brazil’s five major geographic macro-regions, children’s age groups and sex. More details on this survey are available elsewhere(Reference Alves-Santos, Castro and Anjos18). For this study, 12 590 children aged 6–59 months were evaluated.
Food consumption assessment
Food consumption was assessed using a single 24-h recall (24HR), and the data were collected by trained interviewers(Reference Lacerda, Boccolini and Alves-Santos19). The application of the 24HR used the multiple-pass method recommended by the United States Department of Agriculture(Reference Moshfegh, Rhodes and Baer20), which was incorporated into an application developed for this purpose – the 24HR Application Software (24HR-App). A photographic manual for quantifying children’s food consumption was used to provide measurement options specifically tailored for this population(Reference Crispim, Kac and Lacerda21).
Conversion of household measurements to units of mass, volume and food composition
More than half (51·4 %) of the reported household measurements for each food and preparation method were obtained using the Table of Measurements Referenced for Food Consumption in Brazil(22) and around one-third (29·3 %) from the photographic manual for quantifying children’s food consumption. When necessary, the household measurement quantity of the same food was assumed for different preparation methods, or the same method was used for foods with similar consumption characteristics (10·1 %). When absent, information from the Table for Assessment of Food Consumption in Household Measurements (such as ladle, spoon, mug, baby bottle, etc.) was used(Reference Pinheiro, Lacerda and Benzecry23) (9·2 %). The estimate of breast milk intake was calculated using the stable isotope method, which determines a daily amount of breast milk by age group corrected by the total volume of liquids consumed, i.e. the standardised value of breast milk intake in a specific age group should be diminished of 45 % of total liquids consumed in the day(Reference da Costa, Haisma and Wells24) (estimated value by age group according to Costa et al. – 45 % of the total liquids ingested by the child reported in the ENANI’s 24HR).
The food composition analysis was performed using the Brazilian Food Composition Table (TBCA in Portuguese), version 7.2(25). All items were matched by analysing the equivalence of their names/synonyms, descriptors and classifiers according to the methodology proposed by Infoods(26). Culinary preparations composed of different ingredients were broken down to estimate nutrient amounts at the ingredient level, using a standard recipe. For foods and preparations such as fortified milk, infant formulas, infant flours, etc., the centesimal composition of the product reported by the manufacturer on its website in 2020 was used and typed into the dataset independently by two researchers from ENANI-2019, with subsequent checking. More details were described elsewhere(27).
The following nutrients and units of measurement were obtained: energy (kcal); protein (g); carbohydrates (g); fats (g); saturated fat (g); dietary fibre (g); Ca (mg); Fe (mg); Mg (mg); phosphorus (mg); potassium (mg); Zn (mg); Cu (mg); Se (µg); vitamin A RE (µg); vitamin A RAE (µg); vitamin D (µg); vitamin E (µg); thiamine (mg); riboflavin (mg); niacin (mg); vitamin B6 (mg); vitamin B12 (µg); vitamin C (mg) and folate (µg). The TBCA has limitations regarding Na and added sugar content since it needs to update the nutrient content of industrialised foods and because it uses a recipe pattern (standardised use of salt). For this reason, these nutrients were not evaluated.
Nova classification
Foods/beverages and ingredients of culinary preparations were classified according to Nova(Reference Monteiro, Cannon and Levy2), which categorises foods into four groups according to the extent and purpose of the industrial processing: unprocessed or minimally processed foods (including breast milk); processed culinary ingredients; processed foods and ultra-processed foods (UPF). Since unprocessed foods are generally consumed in association with culinary ingredients, in the analyses of this manuscript, these groups were combined, obtaining three groups: (1) unprocessed or minimally processed foods and processed culinary ingredients; (2) processed foods and (3) UPF. Subsequently, the relative energy contribution of each of the three food groups was estimated based on total energy consumed. The UPF group was divided into quintiles of energy contribution, representing the share of UPF in the diet based on total daily energy intake. The population was thus divided into five groups, with the first quintile representing the lowest consumers and the fifth quintile the highest consumers. Additionally, the UPF were categorised into subgroups(Reference Monteiro, Cannon and Levy2) based on those described for consumption in Brazil(Reference Louzada, Cruz and Silva6) and further expanded to include subgroups consumed recurrently by children: chocolates, ice cream, gelatin, flan and other industrialised desserts; cold cuts and processed meats; dairy drinks; fried or baked savory snacks; hot dogs, hamburgers and other sandwiches; industrialised cakes and sweet pies; infant formulas; special-purpose infant formulas; infant supplements; instant flours; margarine; ready-to-eat sauces; ready- or semi-ready-to-eat dishes; savory crackers and packaged salty snacks (cream cracker, corn extrudate, potato chips, etc.); soft drink; other sweetened beverages; sweet cookies; ultra-processed bread; ultra-processed dairy compound other UPF (breakfast cereals and cream cheese).
Socio-demographic variables
The socio-economic and demographic variables used in the analysis were: child’s age range (6–23 and 24–59 months); sex (female or male); Brazilian geographic macro-region (North, Northeast, Southeast, South and Midwest); monthly per capita family income classified into Brazilian minimum wage categories (R$ 998·00 (∼USA$ 252·88) in 2019 and R$ 1039·00 (∼USA$ 247·90) in 2020) (< ¼, ¼ ≤ ½, ½ ≤ 1, > 1); educational level of the child’s mother/caregiver (0–7; 8–10; 11; ≥ 12 years of study) and self-reported skin colour or race of the child’s mother/caregiver (white; mixed-race, black). Due to the low representation of Indigenous and Asian origin mothers/caregivers (< 1 %), the estimates for these subgroups could be biased and were not presented.
Data analysis
Of the 12 590 children aged 6–59 months evaluated in ENANI-2019, twenty lacked 24HR records, two were excluded for reporting only water consumption, and fifteen were excluded due to implausibly high energy intake. To identify implausible dietary reports, age-specific upper cut-offs for total daily energy intake (in kilocalories) were applied(28), indicating errors in reporting. The adopted cutoffs were 6–7 months: 3261 kcal; 8–9 months: 3339 kcal; 10–11 months: 3619 kcal; 12–23 months: 4524 kcal; 24–35 months: 4853 kcal; 36–47 months: 5333 kcal; 48–59 months: 6322 kcal (n 15). Sensitivity analyses, including all observations, showed no statistical differences in the results. The thirty-seven exclusions from 24HR were distributed evenly across macro-regions and age groups and did not affect the weights used for ENANI-2019’s population expansion estimates. Therefore, 12 553 24HR were evaluated (Figure 1).
Flow diagram children evaluated in ENANI-2019.

Figure 1. Long description
The flowchart begins with 14,558 children evaluated in 12,524 households. It then filters out children under 6 months of age, leaving 4,354 children aged 6-23 months and 8,236 children aged 24-59 months. Children lacking 24HR records are excluded, resulting in 4,344 children aged 6-23 months and 8,226 children aged 24-59 months with 24HR record data. Children reporting consumption of only water are further excluded, leaving the same numbers. Children with implausibly high energy intake are then filtered out, resulting in a final count of 4,337 children aged 6-23 months and 8,216 children aged 24-59 months included in the study.
For socio-economic and demographic variables, missing data were imputed using the automatic hot-deck method, in which participants with similar characteristics (Brazilian geographic macro-regions, sex, age and income quartile) were used(Reference Alves-Santos, Castro and Anjos18). The hot-deck method was also used to impute 24HR missing or inconsistent data, such as quantity and/or measuring utensils. More details on imputation were described elsewhere(27).
Prevalence and 95 % CI were described for socio-economic and demographic characteristics and for the day of the week on which consumption was reported. These were classified as weekdays (Monday, Tuesday, Wednesday and Thursday) and weekends (Friday, Saturday and Sunday). The mean and 95 % CI of the relative share of energy consumed by Nova groups, UPF subgroups and UPF quintiles were described, stratified by age group (6–23/24–59 months). The same analyses were performed to characterise the relative share of total energy intake from Nova groups, and subgroups were calculated for the first and last quintiles of UPF energy contribution (in supplementary material). Considering each age group, the mean and 95 % CI for nutrient intake per 1000 kcal(29,Reference Willett, Howe and Kushi30) was estimated for total consumption and the Nova groups. Statistically significant differences were determined by the lack of overlap in the 95 % CI of the mean across Nova groups. The same analyses described the total energy intake and each nutrient intake per 1000 kcal, stratified by quintiles of UPF energy participation. No calculations were performed to correct protein, Fe, Zn and Ca bioavailability.
Crude and adjusted linear regression models were performed, stratified by age groups, to verify the change in nutrient consumption as a function of the energy participation of UPF (in quintiles) – a strategy that inherently captures the substitution of breast milk by UPF – with their coefficients (β) and corresponding 95 % CI being presented. Changes were considered statistically significant when the 95 % CI of the β coefficient did not include zero. Confounders were defined based on variables relevant to infant and child dietary intake from prior knowledge, theoretical plausibility and established evidence in the literature. The adjusted models included: per capita household income (numerical variable), macro-region, maternal/caregiver education and the day of the week on which consumption was reported (weekdays or weekend) (categorical variables).
The analyses were performed in R (RCoreTeam, 2023) using the srvyr and survey packages, accounting for the sampling plan structure, weights and calibration to compensate for non-response and match population estimates to the total known population.
Results
Among the 12 553 children evaluated, the largest proportion was male (6–23 months: 51·1 %; 24–59 months: 51·2 %), resident in the southeastern macro-region of Brazil (6–23 months: 38·9 %; 24–59 months: 39·2 %), of mixed race (6–23 months: 50·0 %; 24–59 months: 53·1 %), between ¼ and ½ minimum wage per capita (6–23 months: 34·0 %; 24–59 months: 33·1 %) and with maternal schooling of 11 years of completed studies (6–23 months: 37·9 %; 24–59 months: 40·0 %). Approximately 70 % of reported dietary intake was recorded on weekdays (6–23 months: 73·7 %; 24–59 months: 72·8 %) (online Supplementary Table 1).
Unprocessed or minimally processed food and culinary ingredients accounted for more than 60 % of the energy intake in both age groups (6–23 months: 74·5 %, 95 % CI 73·1, 76·0 and 24–59 months: 65·1 %, 95 % CI 63·8, 66·4) (Table 1). Considering the total population (6–59 months), 68·3 % of the energy intake comes from unprocessed or minimally processed food and culinary ingredients, 3·5 % from processed foods and 28·8 % from UPF (data not presented in tables).
Description of the relative share of total energy consumed from nova groups, ultra-processed subgroups, and UPF quintiles. ENANI-2019

Table 1. Long description
The table presents data on the energy participation percentage of various food groups and ultra-processed food subgroups for two age groups: 6-23 months and 24-59 months. It includes mean values and 95% confidence intervals for each category. The table is divided into sections for Nova groups, ultra-processed food subgroups, and UPF quintiles. For the 6-23 months age group, unprocessed or minimally processed foods and culinary ingredients account for 74.5% of energy intake, processed foods for 1.8%, and ultra-processed foods for 23.7%. For the 24-59 months age group, unprocessed or minimally processed foods account for 65.1%, processed foods for 4.4%, and ultra-processed foods for 30.5%. The table also breaks down the energy participation of specific ultra-processed food subgroups and quintiles for both age groups.
*Nova groups energy participation (%), represents the relative contribution of each subgroup of the Nova to the diet considering the total energy consumed on the day.
†UPF, Ultra-processed foods.
‡UPF subgroup’s energy participation (%), represents the relative contribution of each subgroup of ultra-processed foods to the diet considering the total energy consumed on the day.
§UPF energy participation (%) by quintiles, represents the contribution of ultra-processed foods to the diet considering the total energy consumed per day, dividing the population into fifths, where the first fifth represents the lowest consumers and the last fifth the highest consumers.
UPF accounted for 23·7 % (95 % CI: 22·3, 25·1) of total energy intake among children aged 6–23 months and 30·5 % (95 % CI: 29·2, 31·7) for those aged 24–59 months. The highest energy shares of the UPF subgroups were instant flours (6·7 %, 95 % CI 6·0, 7·5), sweet cookies (3·4 %, 95 % CI 3·0, 3·8) and infant formulas (2·9 %, 95 % CI 2·1, 3·7), for 6–23 months, and sweet cookies (6·0 %, 95 % CI 5·4, 6·7), chocolates, ice cream, gelatin, flan and other industrialised desserts (5·2 %, 95 % CI 4·8, 5·7) and dairy drinks (3·3 %, 95 % CI 3·0, 3·6), for 24–59 months (Table 1). These subgroups continue to have the highest energy participation when compared with the lowest and largest quintiles of UPF (online Supplementary Tables 2 and 3). A significant gradient is observed regarding the quintiles of UPF energy participation in both age groups: between 6 and 23 months, the first quintile presented a mean of 1·5 % (95 % CI 1·2, 1·8) of dietary energy participation from UPF, while the last quintile showed 59·2 % (95 % CI 56·6, 61·9) for 24–59 months, the mean of the first quintile was 2·0 % (95 % CI 1·7, 2·3), while for the last quintile was 55·7 % (95 % CI 54·7, 56·7) (Table 1).
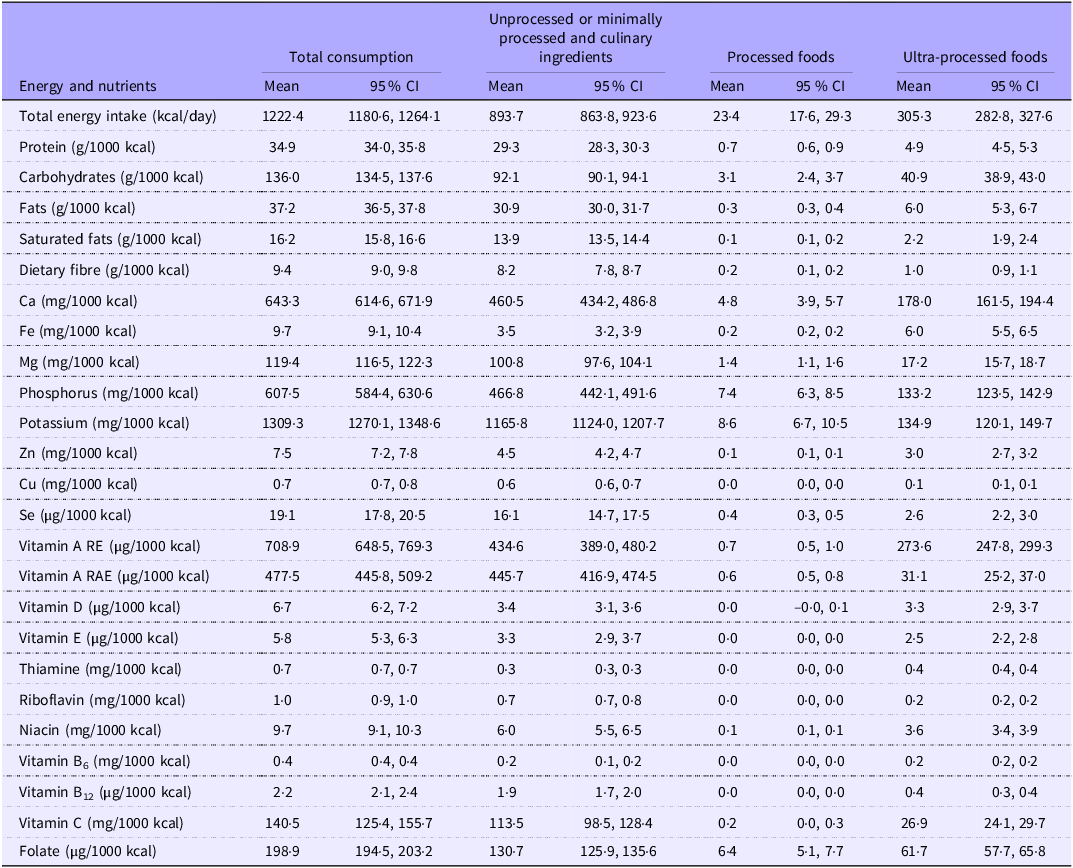
In both age groups, the unprocessed or minimally processed and processed culinary ingredients food group was the main contributor to most nutrient intake in the diet. For 6–23 months, the largest contributor of Fe was the UPF group (6·0 mg, 95 % CI 5·5, 6·5), which was not observed for 24–59 months. Although significantly different, both unprocessed or minimally processed and processed culinary ingredients, and UPF groups contributed to thiamine (0·3 mg/1000 kcal, 95 % CI 0·3, 0·3 v. 0·4 mg/1000 kcal, 95 % CI 0·4, 0·4, respectively) in both age groups (Tables 2 and 3).
Nutrient intake from total diet and according to nova groups among Brazilian children aged 6–23 months. ENANI-2019

Table 2. Long description
The table presents data on nutrient intake from total diet and according to nova groups among Brazilian children aged 6–23 months. It includes columns for total consumption, unprocessed or minimally processed and culinary ingredients, processed foods, and ultra-processed foods. Each column provides mean values and 95% confidence intervals for various nutrients such as energy intake, protein, carbohydrates, fats, dietary fiber, calcium, iron, magnesium, phosphorus, potassium, zinc, copper, selenium, vitamins A, D, E, thiamine, riboflavin, niacin, vitamin B6, vitamin B12, vitamin C, and folate. The table highlights the contribution of different food groups to nutrient intake, with notable trends and comparisons across the groups.
Nutrient intake from total diet and according to nova groups among Brazilian children aged 24–59 months. ENANI-2019

Table 3. Long description
The table presents data on nutrient intake from total diet and according to nova groups among Brazilian children aged 24 to 59 months. It includes columns for total consumption, unprocessed or minimally processed and culinary ingredients, processed foods, and ultra-processed foods. The table has 30 rows and 10 columns, detailing various nutrients such as total energy intake, protein, carbohydrates, fats, saturated fats, dietary fiber, calcium, iron, magnesium, phosphorus, potassium, zinc, copper, selenium, vitamins A, D, E, thiamine, riboflavin, niacin, vitamin B6, vitamin B12, vitamin C, and folate. Each column provides mean values and 95% confidence intervals for each nutrient. Notable trends include the significant contribution of ultra-processed foods to iron intake in the 6 to 23-month age group and the shared contribution of unprocessed or minimally processed foods and ultra-processed foods to thiamine intake in both age groups.
In children aged 6–23 months, a significant negative consumption gradient was observed the greater the energy share of UPF in the diet for the nutrients: fat, potassium and vitamin A RAE (β: –3·1 (95 % CI: –3·6, –2·5); –49·7 (95 % CI: –67·9, –31·4); –113·7 (95 % CI: –136·7, –90·6), respectively). Furthermore, a significant positive consumption gradient was observed for the nutrients: total energy (β: 73·6 (95 % CI: 44·6, 102·7)), carbohydrates (β: 7·3 (95 % CI: 5·8, 8·7)), Ca (β: 75·5 (95 % CI: 57·6, 93·4)), Fe (β: 2·9 (95 % CI: 2·5, 3·3)), phosphorus (β: 38·1 (95 % CI: 26·8, 49·4)), vitamin A RE (β: 104·3 (95 % CI: 72·3, 136·3)) and folate (β: 15·7 (95 % CI: 12·0, 19·5)) (Table 4).
Energy and nutrient intake from total diet by quintiles of energy intake of UPF in diet, among Brazilian children aged 6–23 months. ENANI-2019

Table 4. Long description
The table presents data on energy and nutrient intake from total diet by quintiles of energy intake of ultra-processed foods (UPF) in the diet among Brazilian children aged 6-23 months. It includes mean values and confidence intervals for various nutrients across Quintile 1 and Quintile 5, along with crude and adjusted coefficients. The table has 25 rows and 10 columns, with headers for Quintile 1 Mean, Quintile 1 CI 95 percentage, Quintile 5 Mean, Quintile 5 CI 95 percentage, Crude coefficient beta, Crude coefficient CI 95 percentage, Adjusted coefficient beta, and Adjusted coefficient CI 95 percentage. Notable trends include higher intake of total energy, carbohydrates, calcium, iron, phosphorus, vitamin A RE, and folate in Quintile 5 compared to Quintile 1. Conversely, Quintile 1 shows higher intake of fats, saturated fats, potassium, and vitamin A RAE. The units of measurement vary by nutrient, including kilocalories per day, grams per 1000 kilocalories, and micrograms per 1000 kilocalories.
UPF, ultra-processed food.
*Quintile, represents the contribution of ultra-processed foods to the diet considering the total energy consumed per day, dividing the population into fifths, where the first fifth represents the lowest consumers and the last fifth the highest consumers.
†crude coefficient, obtained from linear regression between the quintiles of energy participation of ultra-processed foods (exposure) and the nutrient in question (outcome).
‡adjusted coefficient, obtained by adding the following variables to the crude model: per capita income (numerical variable), macro-region, maternal/caregiver education and day of the week of reported consumption (weekday or weekend; categorical variables).
In children aged 24–59 months, there was a significant decrease in most nutrients the higher the energy participation of UPF in the diet, while there was an increase in total energy and carbohydrate consumption (β: 92·8 (95 % CI: 66·7, 118·8) and 2·3 (95 % CI: 1·2, 3·3), respectively). It is noteworthy that there is no significant difference for Ca (β: 3·1 (95 % CI: –11·5, 17·7)) (Table 5). The mean intake for the intermediate quintiles (Q2–Q5) is reported in online Supplementary Tables 4 and 5.
Energy and nutrient intake from total diet by quintiles of energy intake of UPF in diet, among Brazilian children aged 24–59 months. ENANI-2019

Table 5. Long description
The table presents data on energy and nutrient intake from total diet by quintiles of energy intake of ultra-processed foods (UPF) in the diet among Brazilian children aged 24 to 59 months. The table includes five quintiles, with mean values and 95% confidence intervals for various nutrients. Key nutrients include total energy intake, protein, carbohydrates, fats, dietary fiber, calcium, iron, magnesium, phosphorus, potassium, zinc, copper, selenium, vitamin A, vitamin D, vitamin E, thiamine, riboflavin, niacin, vitamin B6, vitamin B12, vitamin C, and folate. Notable trends include a significant decrease in most nutrients with higher UPF energy participation, while total energy and carbohydrate consumption increase. For instance, total energy intake in quintile 1 is 1112.7 kilocalories per day, compared to 1648.4 kilocalories per day in quintile 5. Carbohydrate intake increases from 142.6 grams per 1000 kilocalories in quintile 1 to 148.3 grams per 1000 kilocalories in quintile 5. Calcium intake shows no significant difference across quintiles. The table highlights the impact of UPF on nutrient intake in young children.
UPF, ultra-processed food.
*Quintile, represents the contribution of ultra-processed foods to the diet considering the total energy consumed per day, dividing the population into fifths, where the first fifth represents the lowest consumers and the last fifth the highest consumers.
†Crude coefficient, obtained from linear regression between the quintiles of energy participation of ultra-processed foods (exposure) and the nutrient in question (outcome).
‡adjusted coefficient, obtained by adding the following variables to the crude model: per capita income (numerical variable), macro-region, maternal/caregiver education and day of the week of reported consumption (weekday or weekend; categorical variables).
Discussion
Brazilian children aged 6–59 months have almost twothirds of their energy intake coming from unprocessed or minimally processed, processed culinary ingredients foods and culinary ingredients; almost 30 % of the energy intake of children (6–59 months) is derived from UPF. There is also significant variation between the extreme quintiles of UPF energy intake. Among children from the lowest quintile, < 2 % of energy came from UPF, whereas among those from the highest quintile, this proportion was > 55 %. In both age groups, the unprocessed or minimally processed and processed culinary ingredients food group was the main contributor to most nutrient intake in the diet. However, the UPF group was the largest contributor to Fe intake among younger children.
Approximately 24 % of total energy intake among younger children (6–23 months) comes from UPF, with 31 % among older children (24–59 months). We observed a greater energy contribution of UPF in the diet, a lower consumption of fat, potassium and vitamin A RAE and a higher consumption of total energy, carbohydrates, Ca, Fe, phosphorus, vitamin A RE and folate among younger infants aged 6–23 months. This can be partially explained by the fact that instant flours and infant formulas – foods commonly fortified with micronutrients – are the main subgroups of UPF consumed by these children. Still, these characteristics do not make these UPF harmless − infant flour for children contains a mean of 23 ± 9 g of total sugars per 100 g (25–42 % of calories)(Reference Garro-Mellado, Guerra-Hernández and García-Villanova31). In Brazil, based on the nutritional composition shown on labels, the sugar content is approximately 33 g, with flavourings in its composition. Moreover, infant flour is commonly consumed with milk (a minimally processed food) and is a source of Ca, phosphorus, vitamin D, vitamin A RE and Zn(Reference Cifelli, Hess and Fulgoni32,Reference Kay, Welker and Jacquier33) , factors that may help explain the increase in nutrient intake with higher UPF intake. Notably, the energy contribution of milk in these children’s diets remains constant, regardless of whether they fall within the first or last quintile of UPF intake. However, for older children (24–59 months), there is a decrease in the consumption of most nutrients and an increase in total energy and carbohydrates among the largest quintile of UPF. This occurs because sweet cookies, chocolates, ice cream, gelatin, flan and other industrialised desserts and dairy drinks are the main UPF consumed by these children.
Considering nationally representative American children under 2 years, from the National Health and Nutrition Examination Survey (2013–2018), the energy contribution from UPF and unprocessed or minimally processed foods were 45 % and 42 %, respectively; unprocessed or minimally processed foods contributed the most to nutrient intakes, except for Fe, Zn and Na, for which UPF were the main contributors(Reference O’Connor, Martinez-Steele and Wang13). Chaney et al. (2024)(Reference Chaney, Arnold and Frongillo34) assessed longitudinally low-income American children under 5 years and investigated the association between the Infant Diet Quality Index measured at ages 0 to 1 year and nutrient intake and the percentage of energy from each Nova group measured at 2–5 years of age. Nearly half of the energy intake was attributed to UPF (40–50 %), a much larger proportion than in the Brazilian children. Infant Diet Quality Index score was positively associated with dietary fiber and potassium at age 2 years. At all ages, Infant Diet Quality Index was negatively associated with added sugars. Across quintiles of total energy at all ages, higher Infant Diet Quality Index scores were associated with consuming a higher percentage of energy from unprocessed/minimally processed foods and a lower percentage of energy attributed to UPF: –24 % (2 years); –20 % (3 years and 4 years); –29 % (5 years). These findings reinforce that lower UPF consumption is associated with better nutrient quality. In comparison with that study, our results among children aged 24–59 months are aligned with this pattern, whereas the associations observed among infants aged 6–23 months were different.
A meta-analysis that evaluated fourteen studies of nationally representative surveys including children (over 1 year, but mostly over 2), adolescents and adults in different countries (four in studies in South America; five in Europe; two in North America; one in Taiwan, Korea and Australia) has shown that an increased UPF intake correlated with a substantial increase in free sugars and total and saturated fats, as well as a decrease in fibre, protein, potassium, Zn, Mg and vitamins A, C, D, E, B12 and niacin, a result that agrees with ours(Reference Martini, Godos and Bonaccio10). In a UK population-based birth cohort that evaluated children at 21 months of age and 7 years, UPF intake was inversely associated with fat, saturated fat and protein intake in toddlerhood, fibre intake in mid-childhood, and higher UPF consumers had higher intakes of free sugar and Na in toddlerhood and mid-childhood(Reference Conway, Heuchan and Heggie35). Another study pointed out a direct association between higher UPF consumption and dietary energy density and the dietary content of free sugars and inverse associations with dietary fibre among preschool and school-age children in eight countries (Argentina, Brazil, Chile, Colombia, Mexico, Australia, the UK and the USA)(Reference Neri, Steele and Khandpur7). In Spain, among children with an average age of 5 years, higher UPF consumption was associated with inadequate intake of three micronutrients among the twenty evaluated(Reference García-Blanco, de la O and Santiago36) In a Brazilian city (Belo Horizonte), in children aged 8–12 years, a higher contribution from UPF was inversely associated with protein, fibre, vitamin A, Fe and Zn intake and directly associated with total energy, lipid and Na intake(Reference de Lacerda, do Carmo and de Sousa37). The reduced micronutrient intake and increased critical macronutrient intake observed in our study among older children (24–59 months) align with previous research and are similar to findings in adults(Reference da Costa Louzada, Ricardo and Steele38–Reference Martínez Steele, Popkin and Swinburn40).
The recommendation to avoid UPF consumption for children > 2 years is deemed appropriate(41). There is substantial evidence that increased consumption may worsen the profile of nutrient intake (decreasing micronutrient intake and increasing total energy and carbohydrate intake). For children < 2 years, although the intake of certain micronutrients (Ca, Fe, phosphorus, vitamin A RE, vitamin C and folate) can increase with higher UPF consumption, this does not justify recommending these foods, given the numerous health risks associated with them, as documented in the literature(42). First, there was also higher total energy consumption, which is associated with excess weight(Reference Teo, van Dam and Whitton43) and carbohydrate intake, which is associated with metabolic outcomes (increased TAG and decreased high-density lipoprotein)(Reference Nguyen, Santos and Braun44). Beyond excess energy and carbohydrate intake, research conducted in Brazil indicates that 99 % of the UPF sold contained either a cosmetic additive or an excessive amount of critical nutrients, according to the PAHO profile(Reference Canella, Pereira Montera and Oliveira45). Specifically regarding UPF intended for children, both in Brazil(Reference Polezi, Bandoni and Capriles46) and in France(Reference Richonnet, Mosser and Favre47), these foods contain excessive amounts of sugar (55 % and 89 %, respectively), and in Brazil, around 50 % of the products also contain food dye.
In addition, higher UPF consumption is strongly associated with higher mortality, type 2 diabetes, obesity, cardiometabolic disorders and common mental disorders (adverse sleep-related outcomes and anxiety)(Reference Lane, Gamage and Du3). In children, there is an association with obesity, greater body adiposity and greater consumption of critical nutrients associated with chronic non-communicable diseases(Reference Chen, Mousavi and Mandhane48–Reference Araya, Corvalán and Cediel54) Specifically, among the same population as this study (6–23 months old with ≥ 5 UPF group consumption), being overweight was associated with 1·7 odds(Reference Farias, Anjos and Berti51). Studies also highlight the presence of chemical contaminants (such as bisphenol A) in the packaging of these foods(Reference Yates, Kadiyala and Deeney55). Therefore, potential micronutrient contributions from UPF do not compensate for their harmful effects, including excess energy, critical nutrients/ingredients and elements such as sweeteners, dyes and other cosmetic ingredients, as well as other elements mentioned. Moreover, children in the first quintile of UPF reach the estimated average requirement(56) for most micronutrients (vitamins A, C, B12, thiamine, riboflavin, niacin, folate, Fe, Mg, phosphorus and Zn).
The reformulation of UPF to reduce critical nutrients is not a viable option despite being presented as a possible solution. In Brazil, agreements with the food industry were established between 2011 and 2017 to reduce Na and sugar in UPF. However, reports released in 2024 indicate that some food categories did not comply. Sweet cookies – which are one of the most consumed foods in both age groups evaluated in this study – have the highest number of non-compliant products(57,58) . Additionally, UPF manufacturers replace the sources of nutrients-to-limit with ingredients that replicate their taste, texture, bulk and processing functionality without significantly adding to costs(Reference Scrinis and Monteiro59) (such as replacing sugar with artificial sweeteners) that also cause harm to health, as a change in the gut microbiota(Reference Hosseini, Barlow and Leite60). Besides, it is crucial to consider the possible toxicity of micronutrients if we associate the high quantities of such nutrients in these UPF (which is a marketing strategy) and specific public policies – such as the fortification of corn and wheat flours with Fe and folic acid (with moderate amounts, without risk of toxicity)(Reference Vítolo, Baratto and Sangalli15) or prophylactic Fe supplementation for children 6–23 months.
In this context, it is essential to consider a set of regulatory policies, such as limiting the number of micronutrients added to UPF, implementing fiscal measures to tax UPF – prioritising the most consumed subgroups among children if a phased approach is needed – while subsidising the purchase of unprocessed and minimally processed foods and regulating marketing strategies targeting children, particularly on social media and food labelling. This includes restrictions on the use of characters, promotional gifts and claims related to micronutrient fortification and enrichment, which serve as advertising tactics(Reference Polezi, Bandoni and Capriles46,Reference Richonnet, Mosser and Favre47) . Furthermore, it is important to consider policies that facilitate access to unprocessed and minimally processed foods for socially vulnerable groups. According to several studies, these groups show a greater increase in UPF consumption than less vulnerable groups over time(Reference Louzada, Cruz and Silva6,Reference Pozveh, Aktary and Polsky61) and have less access to unprocessed and minimally processed foods(Reference Castro, Schincaglia and Leite62,Reference Borges, Canuto and Pasqual63) .
Some limitations are assumed in this work. First, applying a single 24-h recall, which does not capture intra- and inter-individual dietary variability, can lead to nutrient estimates that are either underestimated or overestimated. Nevertheless, this method adequately describes population averages(64). Second, there is a lack of correction for the bioavailability of Fe, Ca and Zn nutrients due to the absence of information on the phytate and oxalate content of foods in TBCA. Compositional data analysis constitutes an alternative methodological framework; however, because dietary energy shares are inherently compositional, modeling the energy contribution of UPF as the exposure variable captures the substitution of UPF for other Nova food groups. This approach is consistent with the theoretical framework underlying the Nova classification(Reference Monteiro, Cannon and Levy2) and with previous epidemiological studies(Reference Louzada, Martins and Canella12,Reference da Costa Louzada, Ricardo and Steele38,Reference Antoniazzi, de Miranda and Rauber39,Reference Rauber, Louzada and Steele65) , and therefore does not introduce bias in the estimated associations. Despite this, we highlight the potential of this study to address the nutrient profile consumed by children under 5 years of age, according to the energy contribution of UPF. Sensitivity analyses were performed and included: (i) removing infant formula from the UPF group and (ii) retaining outliers in the analyses. No material differences were identified in the results across these analyses. Previously, such data have only been reported nationally in high-income countries such as the USA, the UK and European nations, where the average energy contribution of these foods reaches 50 % – nearly twice that of Brazil. Moreover, this study employs the gold-standard method for estimating UPF consumption.
Conclusions
For Brazilian children aged 6–59 months, the unprocessed or minimally processed and processed culinary ingredients food group was the main contributor to most nutrient intake. For children aged 6–23 months, the greater the energy contribution of UPF in the diet, the lower the intake of fat, potassium and vitamin A RAE, and the higher the intake of Ca, Fe, phosphorus, vitamin A RE, vitamin C and folate, but also the higher the total energy and carbohydrates. Among children 24–59 months, the greater contribution of UFP is associated with lower intake of most nutrients and higher intake of total energy and carbohydrates.
The potential benefits of the micronutrients present in UPF do not outweigh the detrimental effects associated with these products, as thoroughly documented by scientific research. The Brazilian dietary guidelines for children under 2 years of age align with the necessary measures to improve the quality of their diet. These recommendations emphasise the importance of basing children’s diets on diverse, unprocessed or minimally processed foods, restricting UPF intake for children in this age group and limiting UPF intake after this age. The Brazilian recommendations for children < 24 months(42) are corroborated by the WHO guidelines for complementary feeding of infants and young children aged 6–23 months(66).
Supplementary material
For supplementary material/s referred to in this article, please visit https://doi.org/10.1017/S0007114526107508
Acknowledgements
To the participating families who made this study possible. To other members of the Brazilian National Survey on Child Nutrition (ENANI-2019) team for their support in the fieldwork and organisation of the database. To the Brazilian Ministry of Health and the Brazilian National Research Council (CNPq) for the financial support.
This research was funded by the Brazilian Ministry of Health/Brazilian National Research Council (CNPq) – process: 440890/2017-9.
E. M. A. L., S. P. C., D. R. F., N. H. A-S., I. R. R. C., and G. K. designed research; L. B. V. C., E. M. A. L., S. P. C., T. L. B., D. R. F., N. H. A-S., P. N R. C., I. R. R. C., and G. K. conducted research; N. O. and R. M. S. analysed data; and N. O., R. M. S., I. N. S., and J. L. wrote the paper. N. O. had primary responsibility for the final content. All authors read and approved the final manuscript.
The authors declare no conflicts of interest.
The data used in this work are in the public domain and can be accessed at https://enani.nutricao.ufrj.br/material-instrutivo-e-banco-de-dados/
The ENANI-2019 was approved by the Research Ethics Committee of Clementino Fraga Filho University Hospital of UFRJ (Protocol number: 89798718.7.0000.5257). The study complied with the ethical principles established by Resolution n. 466/2012 of the Brazilian National Health Council. The parents or caretakers of the children who agreed to participate in the survey signed two copies of the informed consent form, freely and spontaneously, after hearing an explanation of all the ethical issues of the study.