1 Introduction
Bubbly flows are commonly used to promote heat and mass transfers between a liquid and a gas. In this context, the description of the liquid agitation is a key issue. In the most general situation, such as that encountered in an industrial bubble column, the agitation has different sources: (1) the bubble-induced agitation that results from the flow disturbances generated by bubble motions (Lance & Bataille Reference Lance and Bataille1991; Cartellier & Rivière Reference Cartellier and Rivière2001; Zenit, Koch & Sangani Reference Zenit, Koch and Sangani2001; Risso & Ellingsen Reference Risso and Ellingsen2002), (2) the buoyancy-driven recirculation cells that develop as soon as the volume fraction is not uniform (Climent & Magnaudet Reference Climent and Magnaudet1999; Mudde Reference Mudde2005), and (3) the turbulence produced by mean shear (Larue de Tournemine & Roig Reference Larue de Tournemine and Roig2010; Prakash et al. Reference Prakash, Martínez Mercado, van Wijngaarden, Mancilla, Tagawa, Lohse and Sun2016). The present work focuses on the bubble-induced agitation at large Reynolds number, i.e. in situations where significant wakes develop at bubble rears, which is the case for bubble Reynolds numbers larger than 100 for air bubbles in water. A relevant configuration to isolate the bubble-induced agitation from the other sources of fluctuations is the homogeneous swarm of rising bubbles. In recent years, several works have carried out experimental investigations of this configuration in order to characterize the properties of the bubble-induced agitation (Martinez-Mercado, Palacios-Morales & Zenit Reference Martinez-Mercado, Palacios-Morales and Zenit2007; Roig & Larue de Tournemine Reference Roig and Larue de Tournemine2007; Risso et al. Reference Risso, Roig, Amoura, Riboux and Billet2008; Martinez-Mercado et al. Reference Martinez-Mercado, Chehata Gómez, Van Gils, Sun and Lohse2010; Riboux, Risso & Legendre Reference Riboux, Risso and Legendre2010; Mendez-Diaz et al. Reference Mendez-Diaz, Serrano-García, Zenit and Hernández-Cordero2013; Colombet et al. Reference Colombet, Legendre, Risso, Cockx and Guiraud2015).
A description of the statistical properties of the bubble-induced agitation has been achieved by Riboux et al. (Reference Riboux, Risso and Legendre2010) from measurements in a homogeneous swarm of ellipsoidal bubbles of diameter
 $d$
between 1.6 and 2.5 mm rising in water (
 $500\leqslant Re\leqslant 800$
) at volume fraction
 $\unicode[STIX]{x1D6FC}$
from 0.5 % to 10 %. Three physical quantities are required to determine the agitation. The first is the energy of the fluctuations, the standard deviation of which is found to scale either as
 $V_{0}\unicode[STIX]{x1D6FC}^{0.4}$
or as
 $V\unicode[STIX]{x1D6FC}^{0.5}$
, where
 $V_{0}$
is the rise velocity of an isolated bubble and
 $V$
the average velocity of a bubble within the swarm at the corresponding volume fraction. The second quantity is the integral length scale
 $\unicode[STIX]{x1D6EC}$
of the fluctuations, which has been found to be independent of the gas volume fraction and thus does not scale with the average distance between the bubbles. It is also not proportional to the diameter of bubble, but rather corresponds to the length of the bubble wake (Risso et al.
Reference Risso, Roig, Amoura, Riboux and Billet2008). There is, however, no consensus on its exact expression (Mendez-Diaz et al.
Reference Mendez-Diaz, Serrano-García, Zenit and Hernández-Cordero2013). These two first quantities characterize the large energetic scales of the agitation. The third one is the dissipation rate of energy
 $\unicode[STIX]{x1D716}$
, which characterizes the small dissipative length scales. It has been found to simply balance the power of the buoyancy force that is developed during the rising motion of the bubbles, and is thus written as
 $\unicode[STIX]{x1D716}=\unicode[STIX]{x1D6FC}gV$
. Once velocities are normalized by the standard deviation of the fluctuations and lengths by
 $\unicode[STIX]{x1D6EC}$
, the structure of the liquid agitation turns out to be weakly dependent on the gas volume fraction. The agitation is anisotropic with a standard deviation of the vertical fluctuations that was found to be between 30 % and 50 % larger than that of the horizontal fluctuations by Riboux et al. (Reference Riboux, Risso and Legendre2010). The PDFs (probability density functions) of the fluctuations do not follow a Gaussian distribution. That of the horizontal fluctuations is symmetric while that of the vertical fluctuations shows a long tail for strong upward fluctuations, resulting from the presence of the bubble wakes. The spatial spectra of the vertical and horizontal fluctuations are similar. Both show a specific subrange in power
 $-3$
of the wavenumber
 $k$
, followed at small scales by a classic
 $-5/3$
range.
Altogether, these results draw a rather comprehensive view of bubble-induced turbulence at large Reynolds number. However, even if it clearly appears that bubble wakes and their interactions play a major role, the physical mechanisms responsible for all the observed specific properties were still obscure. As pointed out by Risso et al. (Reference Risso, Roig, Amoura, Riboux and Billet2008), a major difficulty in the understanding of bubble-induced agitation lies in the fact that it combines two contributions of different natures, which have no reason to share the same properties. The first, which is called spatial fluctuation, is the result of the strong spatial heterogeneity of the flow around each bubble and within the wakes. It exists even at low Reynolds number, when the flow disturbance generated by each bubble and the flow through a large number of bubbles are both laminar. The second contribution, which is called time fluctuation, results from the fact that the flow becomes unstable at large Reynolds number, and is really a kind of turbulence. Unfortunately, there is no easy way to separate these two contributions in a configuration where the bubbles are moving. By considering a swarm of two-dimensional bubbles rising at high Reynolds number in a Hele-Shaw cell, Bouche et al. (Reference Bouche, Roig, Risso and Billet2012, Reference Bouche, Roig, Risso and Billet2014) managed to investigate experimentally spatial fluctuation in the absence of turbulence, thanks to the friction at the cell walls which prevents from any turbulence development. They found that the PDFs of the spatial fluctuation also showed the signature of the wakes and the spatial spectrum contained a
 $k^{-3}$
subrange. However, the wake of a confined bubble is different from that of an unconfined one because of the friction at the walls, and the interactions between bubbles are different because of the two-dimensional geometry. The relevance of these results for three-dimensional bubble columns remained thus limited.
Otherwise, the separation of the liquid velocity
 $\boldsymbol{U}$
into two contributions is straightforward if the bubbles are all moving at the same constant velocity
 $V$
. Let us denote the time averaging by an overbar and the spatial averaging by angle brackets. In the frame where the bubbles are at rest, the instantaneous liquid velocity,
 $\boldsymbol{u}(\boldsymbol{x},t)=\boldsymbol{U}(\boldsymbol{x},t)-V\boldsymbol{e}_{\boldsymbol{z}}$
, can be decomposed as
 $$\begin{eqnarray}\boldsymbol{u}(\boldsymbol{x},t)=\overline{\boldsymbol{u}}(\boldsymbol{x})+\boldsymbol{u}^{\prime }(\boldsymbol{x},t),\end{eqnarray}$$
where
 $\overline{\boldsymbol{u}}(\boldsymbol{x})$
is the spatial fluctuation which only depends on the location
 $\boldsymbol{x}$
, and
 $\boldsymbol{u}^{\prime }(\boldsymbol{x},t)$
is the time fluctuation which still depends both on time
 $t$
and
 $\boldsymbol{x}$
, and satisfies
 $\overline{\boldsymbol{u}^{\prime }}=0$
. If the flow is homogeneous, we can consider that it is ergodic in space, and spatial averaging is thus similar to ensemble averaging. The total energy of the fluctuation
 $\langle \boldsymbol{u}^{2}\rangle$
is the sum of those of the spatial and time fluctuations,
 $$\begin{eqnarray}\langle \boldsymbol{u}^{2}\rangle =\langle \overline{\boldsymbol{u}}^{2}\rangle +\langle {\boldsymbol{u}^{\prime }}^{2}\rangle .\end{eqnarray}$$
Such a decomposition has been applied to the results of numerical large-scale simulations of a homogeneous bubble swarm by Riboux, Legendre & Risso (Reference Riboux, Legendre and Risso2013). In that study, each bubble is modelled by a fixed source of momentum added to the Navier–Stokes equations, which are solved on a regular mesh grid with a spacing of the order of the bubble size. The size of the momentum source, also of the order of the bubble size, is adjusted so that the computed wake of an isolated bubble is found in agreement with experiments from a distance of a few radii behind the bubble. A great number of these momentum sources are randomly distributed over the computational domain and the liquid flow is simulated. Even when considering a constant vertical momentum source opposite to the drag force on a bubble, the simulation of the bubble swarm generates unsteady liquid velocity fluctuations. In the vertical direction, the statistical properties of these fluctuations (PDF and spectrum) are found in good agreement with the experimental results of Riboux et al. (Reference Riboux, Risso and Legendre2010). This leads to the conclusion that the principal mechanism driving bubble-induced liquid agitation at large Reynolds number is the interactions of the bubble wakes. It depends weakly on the precise structure of the flow close to the bubbles and on the bubble velocity fluctuations. Then, the decomposition of the fluctuations into spatial and time contributions sheds light on their specific roles. In particular, the evolutions of the fluctuating energy of the two contributions with the gas volume fractions are different, which means that two different models must be combined to describe the evolution of the total energy. Also, the asymmetry of the PDF of the vertical fluctuations results from the asymmetry of the spatial fluctuation whereas that of the time fluctuation is symmetric. In contrast, the
 $k^{-3}$
slope of the spatial spectrum of the total fluctuations is present in both contributions, although it results from two different mechanisms.
These large-scale simulations, however, suffer from some limitations. First, when considering the opposite of a constant vertical drag force as the only forcing term to model the bubble, the energy of the computed fluctuations in the horizontal direction is unrealistically weak. Adding a horizontal oscillatory forcing term allows recovery of the correct energy in the horizontal direction but not the correct spectrum. It is therefore not satisfactory and, in the following, only the case with a constant vertical drag force will be discussed and compared with the present results. A second limitation comes from the limited resolution of the simulations, the consequences of which on the dynamics of the fluctuations are difficult to assess. Moreover, one can argue that even if the total fluctuations predicted by these large-scale simulations have been validated from comparison with experiments, their decomposition into spatial and time contributions has not.
This work reports the investigation of another configuration with which the decomposition of the fluctuations can be achieved, but which is not affected by the limited resolution of the simulations. This configuration is an experimental channel flow of water through an array of fixed solid spheres. The spheres are randomly and homogeneously distributed within the channel. The liquid velocity is measured by means of particle image velocimetry far enough from the channel walls and from the entrance of the array so that the flow can be considered as statistically steady in each point and uniform in space. This flow depends on two independent dimensionless numbers: the volume fraction
 $\unicode[STIX]{x1D6FC}$
of the dispersed phase, which is set to 2 %; the Reynolds number
 $Re$
, based on the sphere diameter
 $d$
and the mean flow velocity
 $\langle U\rangle$
, which is varied from 100 to 1000.
If we trust the conclusions of the large-scale numerical simulations, the structure of the flow through a random array of obstacles is dominated by wake interactions and is independent of the velocity field in the vicinity of the obstacles. The present flow should thus feature the same properties as any high-Reynolds-number dispersed two-phase flow, provided the structure of the wakes is similar. The production of vorticity at the surface of a bubble is different from the production of vorticity at the surface of a solid sphere due to the difference of boundary conditions for the fluid. This is illustrated by the fact that, at the same Reynolds number, the drag coefficient of a bubble is much smaller than that of a solid sphere. Nonetheless, the wake of a bubble in a swarm of bubbles and that of a solid sphere in a swarm of spheres both exponentially decrease with the distance, and differ from each other only by their length of decay (Risso et al.
Reference Risso, Roig, Amoura, Riboux and Billet2008). At same
 $\unicode[STIX]{x1D6FC}$
and
 $Re$
, the fluctuations generated by an array of spheres will have different magnitudes and length scales than those of a swarm of bubbles. However, after normalization by their standard deviation and integral length scale, we expect that the fluctuations will show similar PDFs and spectra. We shall check this assumption by comparing the present measured total fluctuations to those obtained in the experimental investigation of a real bubble swarm. Also, we shall decompose the fluctuations into their spatial and time contributions and compare the results with those of the large-scale simulations of a bubble swarm.
Even though the original motivation of the present work is the description of the physical mechanisms driving the bubble-induced agitation, the main purpose is to confirm that the general properties of high-Reynolds-number two-phase flows are independent of the nature of the dispersed phase. It is also worth mentioning that the flow through a random array of obstacles is also pertinent for flows within canopies (White & Nepf Reference White and Nepf2003; Nepf Reference Nepf2012, and references therein), although in this case cylinders are more relevant than spheres.
The present paper is organized as follows. The experimental model is presented in § 2 together with measurement techniques. Section 3 presents and discusses the variances of the fluctuations, § 4 the PDFs, § 5 the spectral analysis in terms of length scales and § 6 the spectral analysis in terms of time scales. Finally, concluding remarks are proposed in § 7.
2 Experimental model and measurement method
Our objective is to characterize experimentally the agitation generated by the flow through an unbounded array of fixed spheres randomly distributed over space. Generating a flow representative of such an ideal situation requires one to overcome several main difficulties. First, the test section under investigation has to be large enough and contain a sufficient number of spheres to be statistically relevant. Second, the chosen spatial distribution of the spheres must be compatible with a means of maintaining them fixed in the flow. Third, we have to check that the agitation observed within the array is not influenced by the conditions at the boundaries of the test section, such as fluctuations in the incoming flow or generated at walls. A fourth major difficulty arises from the fact that we need optical access to the region among the spheres in order to allow laser Doppler anemometry (LDA) and particle image velocimetry (PIV) measurements.
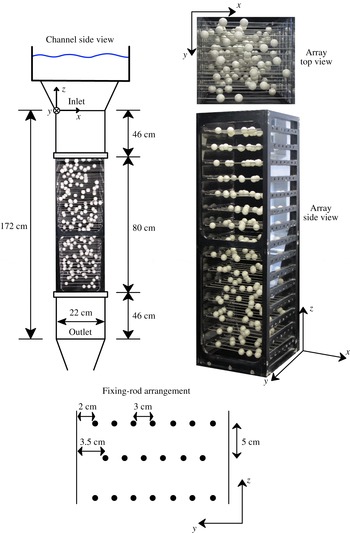
The set-up is described in figure 1. A rack supporting the spheres is inserted within a square vertical channel of side 220 mm and height 1960 mm. The rack is a structure of aluminium and glass of height 800 mm and side 220 mm, which is inserted in the middle of the channel. Its internal wall smoothly bridges the upper and lower parts of the channel without causing any discontinuity. An almost complete optical access through the channel in the horizontal
 $y$
-direction is provided thanks to two large windows of
 $220\times 376~\text{mm}^{2}$
on both opposite sides of the channel. Along the horizontal
 $x$
-direction, a partial optical access is granted by 16 windows of width 220 mm and height 34 mm. Among these windows, 15 horizontal beams take place on the rack sides that are perpendicular to the
 $x$
-direction. Between each pair of facing beams is fixed a row of 7 or 6 stainless steel threaded rods of 2 mm overall diameter, which go through the channel in the
 $x$
-direction (see their precise arrangement in the lower part of figure 1). Two hundred plastic spheres of diameter
 $d=20$
mm are mounted on the 97 rods. Thereby the total volume of the spheres represents 2 % of the total volume of the corresponding portion of the channel. After having considered many possible configurations, the locations of the spheres have been chosen as follows. First, two spheres were placed on each rod, the
 $x$
-coordinate of the centre of each of them being randomly chosen under the sole constraint that the spheres must not overlap. The positions of
 $2\times 97=194$
spheres were thus determined. Then, the rods aimed to receive the 6 remaining spheres, and the
 $x$
-coordinates of these spheres were randomly chosen.
Experimental set-up.

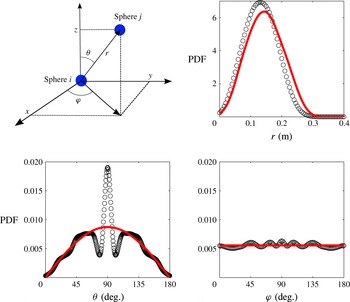
Pair probability density functions of the distribution of the spheres: symbols, actual distribution; lines, ideal distribution.

Due to the imposed geometrical constraints, the spatial distribution of the sphere centres may differ from the ideal situation where all locations are fully statistically independent from each other. This can be evaluated by considering the probability of having the centre of a sphere
 $j$
at the location
 $\boldsymbol{x}+\boldsymbol{r}$
from the centre of a given sphere located at
 $\boldsymbol{x}$
. The relative position
 $\boldsymbol{r}$
(see figure 2) being described by the spherical coordinates (
 $r$
,
 $\unicode[STIX]{x1D703}$
,
 $\unicode[STIX]{x1D719}$
), we introduce the conditioned pair probability density functions
 $G_{r}(r)$
,
 $G_{\unicode[STIX]{x1D703}}(\unicode[STIX]{x1D703})$
and
 $G_{\unicode[STIX]{x1D719}}(\unicode[STIX]{x1D719})$
of finding a sphere at a distance
 $r$
, or in the direction given by
 $\unicode[STIX]{x1D703}$
, or in the direction given by
 $\unicode[STIX]{x1D719}$
, relative to another sphere, respectively. For fully independent locations, it is easy to show that
 $G_{\unicode[STIX]{x1D703}}(\unicode[STIX]{x1D703})=\sin (\unicode[STIX]{x1D703})/2$
and
 $G_{\unicode[STIX]{x1D719}}(\unicode[STIX]{x1D719})=1/\unicode[STIX]{x03C0}$
. We have computed ideal distributions
 $G_{r}(r)$
for spheres randomly distributed within either a spherical or a cubic domain. The results are similar for both geometries provided
 $r$
is normalized by the maximal possible distance between two spheres, which is the diameter of the spherical domain and the diagonal of the cubic domain. It is also worth mentioning that the computed statistics are reasonably converged for a sample of 200 spheres. The red curves in figure 2 show the PDFs of the ideal sphere pair distributions –
 $G_{r}(r)$
corresponding to a cubic domain of side 220 mm. The symbols show the distribution of the spheres within the experimental set-up, estimated by the density kernel method from the actual distances between the spheres (Parzen Reference Parzen1962). Since the experimental array is elongated in the vertical direction, we have divided the experimental domain into four cubic subdomains of side 220 mm, which overlap with each other by 2667 mm in the vertical direction. The experimental distributions plotted in figure 2 are the average of the distributions of these four subdomains. The experimental distributions
 $G_{r}(r)$
and
 $G_{\unicode[STIX]{x1D719}}(\unicode[STIX]{x1D719})$
are remarkably close to the ideal ones. Concerning
 $G_{\unicode[STIX]{x1D703}}(\unicode[STIX]{x1D703})$
, the agreement is also good except for a narrow peak around
 $\unicode[STIX]{x1D703}=0$
, which corresponds to an excess of spheres aligned in the horizontal direction, and indicates that the privileged direction of the rods has a slight influence on the statistics of the angles relative to the vertical direction. However, we can conclude that the present experimental spatial distribution is reasonably representative of a random swarm of spheres, the positions of which are independent. It is worth mentioning that this result has been obtained for a particular volume fraction of spheres,
 $\unicode[STIX]{x1D6FC}=2\,\%$
, for which the most probable distance between two spheres is
 $L_{max}\approx 15$
cm. Such a satisfactory distribution could not have been obtained for a significantly different value of
 $\unicode[STIX]{x1D6FC}$
. At smaller
 $\unicode[STIX]{x1D6FC}$
, the number of spheres contained in the volume of the present channel would not have been large enough to constitute a statistically relevant ensemble. At larger
 $\unicode[STIX]{x1D6FC}$
, the value of
 $L_{max}$
would not have been large enough compared to the minimum distance between the centres of two neighbouring spheres (5 cm, 3 cm and
 $d=2$
cm in the
 $z$
-,
 $y$
- and
 $x$
-directions, respectively).
A downward flow of water is generated by gravity through the channel from a supply tank located above. The bulk velocity
 $\langle U\rangle$
can be varied between 5 and
 $50~\text{mm}~\text{s}^{-1}$
, which corresponds to a Reynolds number based on the sphere diameter,
 $Re=d\langle U\rangle /\unicode[STIX]{x1D708}$
, ranging between 100 and 1000. The flow in the absence of the array of spheres is detailed in Amoura et al. (Reference Amoura, Roig, Risso and Billet2010). Due to the short length of the channel, the flow cannot reach a fully developed state. Except for a narrow region close to the walls, the time-averaged velocity is uniform over the channel and the turbulence generated the wall is negligible. Because the supply tank is fed by means of a series of jets, the flow coming into the channel is turbulent. The corresponding turbulent fluctuations are isotropic, homogeneous in the horizontal plane and decreasing along the vertical distance, and show a classic
 $k^{-5/3}$
inertial spectral subrange. At the elevation that corresponds to the beginning of the measurement region considered in the present work, the ratio of the variance of the vertical velocity to the bulk velocity is, in the absence of the spheres, 0.068 at
 $Re=110$
, 0.048 at
 $Re=220$
, 0.023 at
 $Re\geqslant 600$
. It will be shown later that these levels are small compared to those of the fluctuations generated within the array of spheres, except as regards the time fluctuation at
 $Re=100$
. The incoming turbulence can therefore be ignored in the present study for
 $Re\geqslant 200$
.
Fluorescent particles of encapsulated Rhodamine are dispersed in the water. Since their size is approximately 10
 $\unicode[STIX]{x03BC}\text{m}$
and their density is approximately 1200
 $\text{kg}~\text{m}^{-3}$
, their settling velocity is of the order of 0.01
 $\text{mm}~\text{s}^{-1}$
, which is negligible compared to the velocity scales under investigation, and hence ensures that they behave as good tracers. A laser aligned with the
 $x$
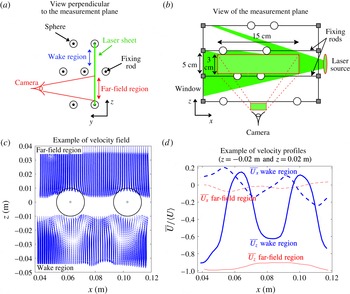
-direction (figure 3) is used to generate a vertical light sheet of approximately 0.5 mm thickness through one of the side windows. The illuminated regions are included in one of the planes that contain fixing rods. Due to the limited optical access by the windows and the presence of rods and spheres, a single measurement region is a rectangle that extends over 30 mm in the vertical
 $z$
-direction and over 150 mm in the horizontal
 $x$
-direction. By moving the laser, a great number of such measurements windows can be investigated. Depending on the position of the laser, a measurement region is either located just underneath a rod, and thus contains the near wake of two (or three) spheres, or just above a rod. Examples of fields of the time-averaged velocity
 $\overline{\boldsymbol{U}}$
measured by PIV in the wake and the far-field regions are shown in figure 3 as well as some horizontal profiles of
 $\overline{U_{x}}$
and
 $\overline{U_{z}}$
. We clearly see that the wakes are confined in the regions located at less than
 $2d$
behind the spheres where the largest spatial variations are observed, whereas the profiles are almost flat in the far-field region. We may thus anticipate that the largest spatial fluctuations will be observed in the vertical direction and due to the contribution of the wake region.
(a,b) Schematic of the arrangement for PIV measurements. (c) Examples of time-averaged measured velocity fields at
 $Re=1040$
(for the sake of clarity, only the central part of the measurement regions is shown). (d) Examples of horizontal time-averaged velocity profiles in the far-field region (
 $z=-0.02$
cm) and in the wake region (
 $z=+0.02$
cm).

Low-speed and high-speed PIV systems have been used. The low-speed system is composed of a Sensicam PCO camera and a Yag laser with a wavelength of 532 nm and an energy of 30 mJ per pulse. It was used to record sequences of 1000 velocity fields at a rate of 2 measurements per second. The high-speed system is composed of an APX RS3000 camera and a Yag laser with a wavelength of 524 nm and an energy of 10 mJ per pulse. It was operated at 50 or 100 fps (depending on the channel bulk velocity) and logged 6000 velocity fields at each run. In both cases, the size of a pixel corresponded to 140
 $\unicode[STIX]{x03BC}\text{m}$
. Note that the size of a particle of tracer in an image is approximately two pixels, which is much larger than its actual size and corresponds to the size of the diffraction spot generated by the diaphragm of the camera. The images were processed by a home-made software (similar to that used in Riboux et al.
Reference Riboux, Risso and Legendre2010), which uses classic PIV algorithms based on two-dimensional fast Fourier transform, subpixel interpolation and 50 % cell overlap. Since PIV cells of
 $16\times 16$
pixels were used, the spatial resolution was 2.2 mm. The low-speed system has been used to determine all quantities that do not need a high time resolution: PDFs, moments and spatial spectra of velocity fluctuations. The high-speed system has been used to obtain time spectra. (Further details on set-up and instrumentation are available in Amoura (Reference Amoura2008) and Besnaci (Reference Besnaci2012)).
In order to determine the statistical properties of the velocity fluctuations, spatial averaging over the array is required. Since the flow needs to develop, measurements in the upper part of the domain must not be considered. By comparing the results obtained at various elevations, we showed that the flow characteristics no longer evolve in the lower half of the array. We have thus selected various measurement regions located in the bottom half of the test section. For all quantities, spatial averaging is done by considering the velocity samples collected in all positions of all measurement regions. The weight of the samples was just slightly adjusted in order to ensure that the wake regions and the far-field regions have the same global statistical weight, as would be the case if the whole volume was investigated. Depending on the considered Reynolds number, 7, 21 or 24 measurement regions have been investigated: three wake regions and four far-field regions for
 $Re=120,230,450,650,845$
, nine wake regions and 12 far-field regions for
 $Re=340$
, and 11 wake regions and 13 far-field regions for
 $Re=1040$
. The corresponding statistical samples are large enough to expect a good statistical convergence. However, it remained to assess whether no bias has been introduced by their definition. We have randomly chosen thirty locations within the lower part of the array where velocity time signals were measured by means of a two-component LDA. The LDA system is composed of a Spectra Physics 2016 Argon laser of wavelengths 488 and 514.5 nm, and two Dantec Burst Spectrum Analyser 57N10. The maximum dimension of the measurement volume was 0.8 mm and the acquisition duration (
 ${\approx}10$
min) was chosen in order to ensure the statistical convergence of the velocity variance by time averaging in each measurement point. Contrary to PIV samples, LDA measurement points are not constrained to belong to planes that contain the fixing rods. Therefore, there is no statistical bias in the determination of the global variance of the velocity fluctuations over the array by averaging the LDA results obtained in the 30 different points.
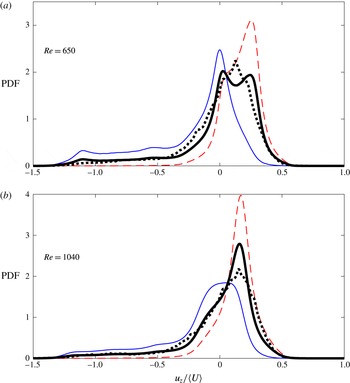
Figure 4 shows the PDFs of the vertical velocity obtained by PIV and LDA for
 $Re=650$
and
 $Re=1040$
. Regarding PIV results, the PDFs of the far-field region (thin red dashed line) and that of the wake region (thin blue solid line) are presented together with their combination, which gives the PDF of the fluctuations over the whole domain (thick black solid line). The PDFs of the wake region are strongly asymmetric, with a long tail in the downward direction that corresponds to the velocity defects behind the spheres, while the PDFs of the far-field region are almost symmetric. Moreover, the mean velocity of the wake region
 $\langle u_{z}\rangle ^{w}$
is lower than that of the far-field region
 $\langle u_{z}\rangle ^{ff}$
. The PDFs of the two regions are thus shifted relative to each other, the maximum of the wake region being close to zero while that of the far-field region is approximately
 $0.25\langle U\rangle$
. This has a major consequence on the PDF of the global fluctuations over the whole domain, which turns out to be much broader than the PDFs of each of the two separated regions. The contribution
 $(\langle u_{z}\rangle ^{w}-\langle u_{z}\rangle ^{ff})^{2}$
to the variance of the global fluctuations
 $\langle u_{z}^{2}\rangle$
that comes from the difference of the average velocities is of the order of
 $0.1\langle U\rangle ^{2}$
. A significant part of the energy of the vertical fluctuations is therefore related to spatial variations of the velocity between points located on both sides of a sphere, and involves scales larger than
 $d$
.
PDFs of the vertical fluctuations with the two different methods of estimation and for the two types of regions: thin (red) dashed line, PDF in the far-field region by PIV; thin (blue) solid line, PDF in wake region by PIV; thick (black) solid line, PDF over the whole domain by combination of PIV measurements in the wake and the far-field regions; dotted (black) line, PDF over the whole domain by LDA in several points randomly distributed through space.

Despite the moderate number of samples used, the PDFs of the global fluctuations over the whole domain obtained by PIV match well with the PDFs obtained by LDA. The only noticeable difference is the existence of two small bumps in the PDF of PIV measurements at
 $Re=650$
, which are a residual trace of the shift between the maximums of the two regions. We can therefore conclude that the PIV samples are statistically relevant for the estimation of spatially averaged quantities over the whole array.
One could also wonder about the influence of the rods that support the spheres on the flow. Even though their total volume is approximately one third of that of the sphere (0.7 % of the total volume of the test section), their diameter is below the spatial resolution of the PIV measurements and less than one tenth of that of the spheres. The flow region disturbed by their presence is therefore much less than that of the sphere, especially their wake, as the associated Reynolds number is also ten times less. This is confirmed by the good agreement between of the PIV results that were obtained in planes that contain rods and the LDA results that are truly randomly distributed over space.
3 Variances of velocity fluctuations
In this section, the variances of the various contributions are analysed to determine how energy is shared between the different kinds of fluctuations.
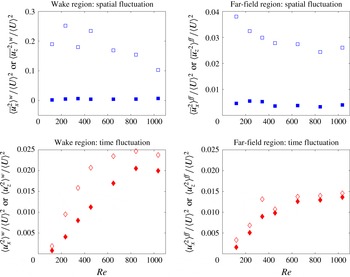
Figure 5 presents the variances measured either in the wake region or the far-field region as a function of the Reynolds number. The features of the spatial fluctuation are easily understood by considering the velocity field and the horizontal profiles shown in figure 3. Regarding the vertical fluctuations, the velocity defects behind the spheres generate large fluctuations of the order of the bulk velocity
 $\langle U\rangle$
while the potential flow upstream of the spheres also generates significant fluctuations, but within a much smaller region. In the wake region, this leads to a large variance
 $\langle \overline{u_{z}}^{2}\rangle ^{w}$
, which decreases from
 $0.3\langle U\rangle ^{2}$
to
 $0.1\langle U\rangle ^{2}$
as
 $Re$
increases, probably due to an attenuation of the wake. In the far-field region, a moderate variance
 $\langle \overline{u_{z}}^{2}\rangle ^{ff}$
is measured, which saturates around
 $0.025\langle U\rangle ^{2}$
at
 $Re=1000$
. In the horizontal direction, the main causes of fluctuations are the recirculation due the flow separation in the wake region and the potential disturbances in the far-field region, which both generate small variances
 $\langle \overline{u_{x}}^{2}\rangle ^{w}$
and
 $\langle \overline{u_{x}}^{2}\rangle ^{ff}$
of the order of
 $0.005\langle U\rangle ^{2}$
.
Variances of the velocity fluctuations in the wake and far-field regions normalized by the square of the average flow velocity
 $\langle U\rangle ^{2}$
. Open symbols represent vertical fluctuations (
 $z$
-direction) and solid symbols represent horizontal fluctuations (
 $x$
-direction).

The properties of the time fluctuations are remarkably different from those of the spatial fluctuations. The variances of horizontal and vertical velocity in the wake region (
 $\langle u_{x}^{\prime 2}\rangle ^{w}$
and
 $\langle u_{z}^{\prime 2}\rangle ^{w}$
) as well as those of the far-field region (
 $\langle u_{x}^{\prime 2}\rangle ^{ff}$
and
 $\langle u_{z}^{\prime 2}\rangle ^{ff}$
) increase with the Reynolds number up to
 $Re=800$
as the turbulence develops within the channel, before converging towards values of the same order:
 $\langle u_{x}^{\prime 2}\rangle ^{w}\approx 0.020\langle U\rangle ^{2}$
,
 $\langle u_{z}^{\prime 2}\rangle ^{w}\approx 0.025\langle U\rangle ^{2}$
,
 $\langle u_{x}^{\prime 2}\rangle ^{ff}\approx \langle u_{z}^{\prime 2}\rangle ^{ff}\approx 0.015\langle U\rangle ^{2}$
. The turbulence is therefore clearly not confined in the sphere wakes, but invades the whole flow. Despite the strong differences observed for the variance of the spatial fluctuation between the wake and the far-field regions, as well as between the horizontal and vertical directions, the time fluctuations are almost isotropic and rather homogeneously distributed over space.
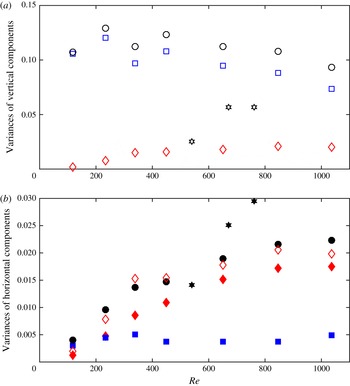
We consider now the statistics of the fluctuations over the whole flow field, which have been obtained by merging the measurements of the wake and the far-field region. Figure 6 presents the variances of the spatial fluctuations (
 $\langle \overline{u_{z}}^{2}\rangle$
,
 $\langle \overline{u_{x}}^{2}\rangle$
), of the time fluctuations (
 $\langle u_{x}^{\prime 2}\rangle$
,
 $\langle u_{z}^{\prime 2}\rangle$
) and of the total fluctuations (
 $\langle u_{x}^{2}\rangle$
,
 $\langle u_{z}^{2}\rangle$
), as a function of the Reynolds number. The variances of the vertical velocity are represented by open symbols in figure 6(a) while those of the horizontal velocity are represented by solid symbols in figure 6(b). In order to facilitate the comparison between the two directions, the variances of the vertical time fluctuations is also reported in figure 6(b).
Variances of the velocity fluctuations in the whole domain normalized by the square of the average flow velocity
 $\langle U\rangle ^{2}$
. Open symbols represent vertical fluctuations (
 $z$
-direction) and solid symbols represent horizontal fluctuations (
 $x$
-direction). Black circles represent total fluctuations
 $\langle u_{x}^{2}\rangle /\langle U\rangle ^{2}$
or
 $\langle u_{z}^{2}\rangle /\langle U\rangle ^{2}$
, blue squares represent spatial fluctuation
 $\langle \overline{u_{x}}^{2}\rangle /\langle U\rangle ^{2}$
or
 $\langle \overline{u_{z}}^{2}\rangle /\langle U\rangle ^{2}$
, and red diamonds represent time fluctuation
 $\langle {u_{x}^{\prime }}^{2}\rangle /\langle U\rangle ^{2}$
or
 $\langle {u_{z}^{\prime }}^{2}\rangle /\langle U\rangle ^{2}$
. Black stars show the total fluctuation measured in a real bubble swarm by Riboux et al. (Reference Riboux, Risso and Legendre2010).

The spatial fluctuation (square symbols) is mainly related to the velocity deficit in the wakes of the spheres. It involves a large energy in the vertical direction, which decreases from
 $\langle \overline{u_{z}}^{2}\rangle \approx 0.12\langle U\rangle ^{2}$
to
 $0.07\langle U\rangle ^{2}$
as
 $Re$
increases, and a small variance in the horizontal direction, which remains almost constant
 $\langle \overline{u_{x}}^{2}\rangle \approx 0.005\langle U\rangle ^{2}$
. The spatial fluctuation is thus highly anisotropic, with
 $\langle \overline{u_{z}}^{2}\rangle /\langle \overline{u_{x}}^{2}\rangle \gtrsim 15$
.
The energy of both components of the time fluctuation (diamond symbols) is an increasing function of
 $Re$
. At
 $Re=100$
, the variance of the time fluctuations is very small,
 $\langle u_{z}^{\prime 2}\rangle \approx \langle u_{x}^{\prime 2}\rangle \approx 0.002\langle U\rangle ^{2}$
, which indicates that no turbulence is generated within the array of spheres. The variance is even much smaller than that of the turbulence which is present in the channel in the absence of the array of spheres,
 $\langle u_{z}^{\prime 2}\rangle \approx \langle u_{x}^{\prime 2}\rangle \approx 0.068\langle U\rangle ^{2}$
. The turbulence in the incoming flow is therefore dissipated by its passage throughout the first half of the array of spheres before it reaches the measurement region. For
 $Re\geqslant 200$
, the steady flow through the array of spheres is unstable and the turbulence that develops within the test section becomes predominant. Both the vertical and the horizontal fluctuations then increase to reach a plateau for
 $Re\geqslant 800$
:
 $\langle u_{z}^{\prime 2}\rangle =0.02\langle U\rangle ^{2}$
and
 $\langle u_{x}^{\prime 2}\rangle =0.017\langle U\rangle ^{2}$
. The energy of the time fluctuation is thus almost equally distributed between the two directions, with an anisotropy ratio
 $\langle u_{z}^{\prime 2}\rangle /\langle u_{x}^{\prime 2}\rangle \approx 1.15$
at large
 $Re$
.
The total fluctuations (circle symbols) combine the contributions of the spatial and time fluctuations. The vertical variance
 $\langle u_{z}^{2}\rangle$
is largely dominated by the spatial fluctuation. It is found in between
 $0.09\langle U\rangle ^{2}$
and
 $0.13\langle U\rangle ^{2}$
and shows a slight trend to decrease as the Reynolds number increases. In contrast, the horizontal variance
 $\langle u_{x}^{2}\rangle$
is dominated by the time fluctuation. It significantly increases from
 $0.004\langle U\rangle ^{2}$
at
 $Re=120$
up to
 $0.02\langle U\rangle ^{2}$
at
 $Re=1040$
. As a consequence, the anisotropy ratio
 $\langle u_{z}^{2}\rangle /\langle u_{x}^{2}\rangle$
decreases strongly from 27 to 4.
For the sake of comparison, the total variances of the liquid fluctuations measured in a real bubble swarm by Riboux et al. (Reference Riboux, Risso and Legendre2010) are shown by black stars on figure 6. Even though it is of the same order of magnitude, the energy of the fluctuations induced by the spheres is significantly different from that generated by the bubbles. The production of vorticity at the surface of a solid sphere is larger than the production of vorticity at the surface of a bubble due to the differences in boundary conditions for the liquid. Even for the same Reynolds number, the drag coefficient of a bubble and that of a solid sphere are different, and we do not expect the energy of the fluctuations produced in both cases to be similar. However, comparing the ratio of the vertical component to the horizontal component is interesting since it sheds light on the mechanisms of energy redistribution between the directions. In the case of the experiment with freely moving bubbles (
 $500\leqslant Re\leqslant 800$
),
 $\langle u_{z}^{2}\rangle /\langle u_{x}^{2}\rangle \approx 2$
, while in the case of the experiment with fixed spheres at
 $Re=650$
,
 $\langle u_{z}^{2}\rangle /\langle u_{x}^{2}\rangle \approx 6$
. As already observed by Riboux et al. (Reference Riboux, Legendre and Risso2013) in LES where the bubbles are modelled as constant vertical sources of momentum, considering a fixed orientation of the relative velocity between the dispersed and the continuous phases does not allow one to recover a relative level of fluctuating energy in the horizontal direction comparable to that of a real bubble swarm.
4 Probability density functions of velocity fluctuations
The energy of the fluctuations has been discussed above. We will now consider the probability density functions of the fluctuations normalized by their standard deviation in order to discuss the structure of the fluctuations independently of their energy.
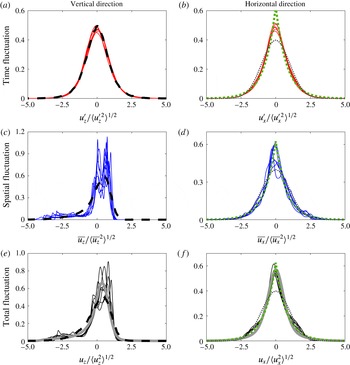
Figure 7 shows the PDFs of the normalized fluctuations measured in the array of spheres for all considered Reynolds numbers from 120 to 1040. Both the vertical (figure 7
a,c,e) and the horizontal (figure 7
b,d,f) components of the fluctuations are represented by thin lines for all contributions: total fluctuation,
 $u_{z}/\langle {u_{z}}^{2}\rangle ^{1/2}$
and
 $u_{x}/\langle {u_{x}}^{2}\rangle ^{1/2}$
(figure 7
e,f), spatial fluctuation,
 $\overline{u_{z}}/\langle \overline{u_{z}}^{2}\rangle ^{1/2}$
and
 $\overline{u_{x}}/\langle \overline{u_{x}}^{2}\rangle ^{1/2}$
(figure 7
c,d) and time fluctuation,
 $u_{z}^{\prime }/\langle u_{z}^{\prime 2}\rangle ^{1/2}$
and
 $u_{x}^{\prime }/\langle u_{x}^{\prime 2}\rangle ^{1/2}$
(figure 7
a,b). To facilitate interpretation, a Gaussian law of zero average and unit variance (black dashed line) as well as an empirical exponential law (green dashed line),
 $f(x)=\text{exp}(-|x|/0.8)/0.4$
, have also been drawn in the subfigures corresponding to the horizontal components (figure 7
b,d,f).
Probability density functions of time (a,b), spatial (c,d) and total (e,f) fluctuations in vertical (a,c,e) and horizontal (b,d,f) directions. Thin (coloured) lines: results of the present work in the random array of spheres for
 $Re=120$
, 230, 340, 450, 650, 850 and 1040. Thick (grey) lines in (e,f): experimental results in a swarm of rising bubbles at
 $Re=770$
by Riboux et al. (Reference Riboux, Risso and Legendre2010). Dashed (black) lines in (a,c,e) LES results by Riboux et al. (Reference Riboux, Legendre and Risso2013). In each graph of (b,d,f), the black dashed line shows a Gaussian law of zero mean and unit variance, while the light (green) dashed line is the empirical exponential law:
 $f(x)=\exp (-|x|/0.8)/0.4$
.

It is visible that the statistical convergence of the PDFs of the spatial fluctuation, which show a certain scattering, is lower than those of the time fluctuation, which are rather smooth. The reason for that follows. Only a single time-averaged velocity field is available for each spatial region that is investigated. The number of samples available for the estimation of the spatial fluctuation is therefore the product of the number of velocity samples in a image by the number of regions considered, i.e. from 7000 to 24 000 depending on the Reynolds number. In contrast, 1000 instantaneous velocity fields are available for the estimation of the time fluctuation, which leads to 1000 times more samples to build the PDF of the time fluctuation than that of the spatial fluctuation. Since it involves the two contributions, the scattering of the PDF of the total fluctuation is in between them.
Once normalized by their standard deviation, all the PDFs turn out to be almost independent of the Reynolds number. Regarding the spatial fluctuation (figure 7 c,d), the PDF of the vertical component is strongly asymmetric, with a long tail in the direction of negative fluctuations that is the signature of the sphere wakes, while that of the horizontal component is well described by an exponential law. Regarding the time fluctuation (figure 7 a,b), the vertical PDF is nicely symmetric and does not show any traces of the wakes. Moreover, both directions show similar PDFs, which are well described by an exponential distribution. The PDFs of total fluctuation (figure 7 e,f) are easily understood as the combination of the PDFs of the two contributions. In the vertical direction, the total PDF is similar to that of the spatial fluctuation, which is largely dominant over the time fluctuation. In the horizontal direction, the central part of the total PDF corresponds to the dominant contribution of the time fluctuation, whereas the small wings on both sides are due to the small contribution of the spatial fluctuation.
In summary, the total vertical fluctuation is dominated by the spatial fluctuation while the total horizontal fluctuation is dominated by the time fluctuation. The asymmetry of the vertical fluctuation and the major part of the anisotropy level between the vertical and the horizontal components of the fluctuations are due to the spatial fluctuation, i.e. to the average flow disturbance generated around each sphere. On the other hand, the time fluctuation, which results from the instability of the flow through a random array of obstacles, is almost isotropic, with perfectly symmetric PDFs. However, it presents a distinctive property: its PDFs are strongly non-Gaussian and are well described by an exponential distribution.
It is now interesting to compare the present results with previous results obtained in a bubbly flow. In figure 7 the normalized PDFs of the total fluctuations measured in a real bubble swarm are denoted by thick continuous grey lines in (figure 7 e,f). (Note that to allow comparison with the flow through an array of fixed spheres, the fluctuations induced by the bubbles are described in a frame where the average bubble velocity is zero. Consequently the vertical fluctuations presented here have a sign opposite to the definition that is generally used in the bubbly flow literature). In both the horizontal and the vertical directions, the PDFs of the total fluctuations measured in an array of fixed spheres are in good agreement with experiments in a real bubbly flow. The only significant difference is that the tail of negative fluctuations generated by the wakes of the spheres is slightly sharper than that generated by the wakes of the bubbles, probably because the no-slip condition on a sphere surface generates a stronger wake compared to the slip condition on a bubble. The free motion of the bubbles and the fluctuations of the orientation of their instantaneous velocity around the vertical direction may also contribute to a less important contribution of the wakes to the average vertical velocity deficit. The normalized PDFs of the spatial, time and total vertical fluctuations obtained by LES of a bubble swarm are denoted by thick black dashed lines in figure 7(a,c,e). They are all in good agreement with the results of the present investigation.
It is also remarkable that the major features of the PDFs of the total fluctuations of the liquid velocity observed in an array of fixed spheres – namely the exponential tail in the negative vertical direction and the exponential behaviour in the horizontal direction – are similar to those of the PDFs of the velocity of particles sedimenting in a fluid otherwise at rest computed by direct numerical simulations by Fornari, Picano & Brandt (Reference Fornari, Picano and Brandt2016a
, figure 10) and Fornari et al. (Reference Fornari, Picano, Sardina and Brandt2016b
), for a low particle volume fraction (
 $\unicode[STIX]{x1D6FC}\leqslant 1\,\%$
), a particle to fluid density ratio of 1.02, and a particulate Reynolds number between 150 and 200. This suggests that the particle motions show the signature of a fluid agitation which is similar to that observed in the present work.
It has been shown in the previous section that the energy of the fluctuations and its distribution between the vertical and the horizontal directions are not the same for an array of spheres as for a swarm of bubbles. These discrepancies are due to the no-slip condition at the sphere surface and to the fixed orientation of the velocity of the spheres relative to the mean liquid flow. However, this turns out to have a little influence on the PDFs of the normalized total fluctuations, which are found in good agreement with those measured in a real bubble swarm. Moreover, the comparison with LES results shows that the similarity with a bubbly flow is also valid for the separate contributions to the fluctuations. Regarding the PDFs of the fluctuations, the present flow configuration through a random array of spheres therefore turns out to be a relevant model of the agitation generated by a homogeneous swarm of rising bubbles, or any types of objects moving at large Reynolds number.
5 Wavenumber spectra of velocity fluctuations
The wavenumber spectra of the total fluctuations are determined in the following way. We first consider an instantaneous velocity field obtained by low-speed PIV (figure 3). The spectrum of each horizontal line of the flow field is determined by means of a discrete Fourier transform of either the horizontal velocity
 $u_{x}(x)$
or the vertical velocity
 $u_{z}(x)$
. The spectra are then averaged over the lines of each image (spatial averaging in the vertical direction), over all images of a time sequence (time averaging) and over all regions investigated (spatial averaging over all the test section). We thus obtained the one-dimensional averaged wavenumber spectra
 $S_{xx}$
(respectively
 $S_{zx}$
) of the horizontal fluctuations (respectively the vertical fluctuations) in the horizontal direction. The range of wavelengths available is from 4.4 to 160 mm. Note that due to the small dimension of the PIV fields in the vertical direction, spectra in the vertical direction,
 $S_{xz}$
and
 $S_{zz}$
, are not available. The spectra of the time and spatial fluctuations are obtained with the same method from
 $\overline{u}(x)$
and
 $u^{\prime }(x)$
, with the only difference being that no time averaging of the spectra of the spatial fluctuations is done.
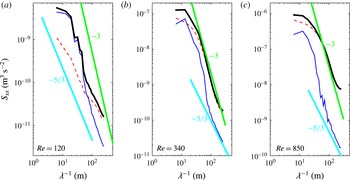
Figure 8 shows log–log plots of the longitudinal one-dimensional spectra of the horizontal velocity fluctuations
 $S_{xx}$
as a function of the reciprocal of the wavelength
 $\unicode[STIX]{x1D706}^{-1}=k/2\unicode[STIX]{x03C0}$
, for
 $Re=120$
,
 $Re=340$
and
 $Re=850$
. Transverse spectra
 $S_{xz}$
are not shown since they feature trends very similar to longitudinal spectra. The total, spatial and time fluctuations are represented by thick (black) lines, thin (blue) lines and dashed (red) lines, respectively. The thick (green and cyan) straight lines marked the
 $-3$
and
 $-5/3$
slopes. The spectra in figure 8 have not been normalized, which allows one to compare the contributions of the spatial and time fluctuations and their evolution with the Reynolds number.
Longitudinal one-dimensional wavenumber spectra of the horizontal velocity fluctuations
 $S_{xx}$
as a function of the reciprocal of the wavelength
 $\unicode[STIX]{x1D706}^{-1}=k/2\unicode[STIX]{x03C0}$
, for
 $Re=120$
(a),
 $Re=340$
(b) and
 $Re=850$
(c). Thick (black) line: total fluctuation; thin (blue) line: spatial fluctuation; dashed (red) line: time fluctuation. The thick (green and cyan) straight lines marked the
 $-3$
and
 $-5/3$
slopes.

The shape of the spectrum of the spatial fluctuation is weakly dependent on the Reynolds number over all the range of
 $Re$
investigated: it follows a
 $-3$
slope at large scales and a
 $-5/3$
slope at small scales. A
 $k^{-3}$
spectral subrange has been observed in a bubble swarm confined in a Hele-Shaw cell where no turbulence can develop, and hence only the spatial fluctuation is present (Bouche et al.
Reference Bouche, Roig, Risso and Billet2014). Thus, it seems to be a general feature of localized flow disturbances randomly distributed over space. This interpretation is theoretically founded since it has been demonstrated that a superimposition of such disturbances can generate a spectrum with a
 $-3$
slope in the range of wavelengths in between the minimum and the maximum sizes of the disturbances (Risso Reference Risso2011).
Concerning the time fluctuation, the case at lower
 $Re$
is clearly different from those at larger
 $Re$
. At
 $Re=120$
, the energy of the time fluctuation is very low and the spectrum of
 $u_{x}^{\prime }$
is not far from a
 $-5/3$
slope, which is the signature of the inertial subrange of the turbulence of the incident flow. This is consistent with the interpretation that the flow through the array of spheres is still stable and that the small time fluctuations are a residual trace of the incident flow. At larger
 $Re$
, turbulence develops within the array of spheres, and the spectra of
 $u_{x}^{\prime }$
at
 $Re=340$
or 850 clearly exhibit a
 $-3$
slope.
The spectra of the total fluctuation are simply the sum of the two contributions. At
 $Re=120$
, the spectrum of
 $u_{x}$
is dominated by the spatial fluctuation at large scales, where it follows a
 $-3$
slope, and by the time fluctuation at small scales, where it follows the
 $-5/3$
slope of the residual incident turbulence. Increasing the Reynolds number, the contribution of the time fluctuation increases and becomes dominant at all available wavelengths. At
 $Re=340$
or 850, the spectrum of the total fluctuation again shows a
 $-3$
slope, but it is now due to the time fluctuation. This leads to a major conclusion. Since both the spatial and the time fluctuations follows a
 $-3$
slope, the total fluctuation shows a
 $k^{-3}$
spectral subrange whatever is the dominant contribution.
It has been shown in § 4 that the PDFs become independent of the Reynolds number when normalized by the standard deviation of the fluctuations. In order to assess whether the spectra can also be independent of
 $Re$
, we need first to make them dimensionless, which requires an estimation of the integral length scale
 $\unicode[STIX]{x1D6EC}$
of the fluctuations. Because the statistical convergence of the time fluctuation is better and it represents the largest contribution of the total fluctuation (except for the largest scales at
 $Re=120$
),
 $\unicode[STIX]{x1D6EC}$
has been determined from the spectrum of
 $u^{\prime }$
measured in the far-field region by the classic relation:
 $\unicode[STIX]{x1D6EC}=S_{xx}(0)/\langle u_{x}^{\prime 2}\rangle$
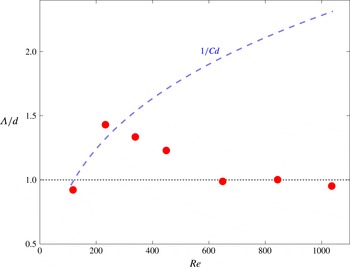
. The symbols in figure 9 show the evolution of
 $\unicode[STIX]{x1D6EC}/d$
as a function of
 $Re$
. Without considering the case
 $Re=120$
, which is not totally controlled by the agitation generated by the spheres, the integral scale of the time agitation is observed to decrease with
 $Re$
before reaching a constant value equal to
 $d$
for
 $Re\geqslant 600$
.
Figure 10 compares the spectra obtained for all Reynolds numbers in the range from 120 to 1040. Each spectra is normalized by using its own variance,
 $\langle u^{2}\rangle$
,
 $\langle \overline{u}^{2}\rangle$
or
 $\langle {u^{\prime }}^{2}\rangle$
, and the integral length scale
 $\unicode[STIX]{x1D6EC}$
estimated from the time fluctuations. The spectra obtained in the array of spheres are represented by thin continuous lines, except the case
 $Re=120$
, which is represented by a thin dashed line and will not be further commented upon.
Integral length scale of the fluctuations obtained from the spectrum of the time fluctuation as a function of the Reynolds number. The (blue) dashed line shows the value of
 $1/Cd$
calculated by using the Schiller & Naumann (Reference Schiller and Naumann1933) correlation.

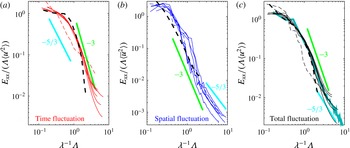
Normalized longitudinal one-dimensional wavenumber spectra of time (a), spatial (b) and total (c) fluctuations. Thin dashed (coloured) lines:
 $Re=120$
. Thin (coloured) lines:
 $Re=230$
, 340, 450, 650, 850 and 1040. Thick dashed (black) lines: LES results by Riboux et al. (Reference Riboux, Legendre and Risso2013). Thick (blue) line in (c): experimental results in a swarm of rising bubbles at
 $Re=770$
by Riboux et al. (Reference Riboux, Risso and Legendre2010).

Regarding the spatial fluctuation (figure 10
b), the normalization also allows a collapse of the spectra, but a certain scatter remains. In the range of wavelengths that correspond to the time-averaged flow disturbances generated by a sphere and its wake (
 $0.5\leqslant \unicode[STIX]{x1D706}/\unicode[STIX]{x1D6EC}\leqslant 5$
), the spectra broadly follow a
 $-3$
slope. However, small bumps are superimposed on the
 $-3$
slope, which are more marked at moderate Reynolds numbers and almost disappear for
 $Re\geqslant 500$
. For fixed spheres at moderate Reynolds number, the random character of the flow is probably not strong enough to make the signature of the wakes completely fade, which could explain the presence of these bumps. At larger
 $Re$
, the turbulence generated within the array of spheres may modify the spatial heterogeneities so that smoother spectra of the spatial fluctuation are obtained. At smaller wavelengths (
 $\unicode[STIX]{x1D706}/\unicode[STIX]{x1D6EC}\leqslant 0.5$
), all spatial spectra follow a
 $-5/3$
slope, but at a level, with the present normalization, which depends on the Reynolds number. No physical interpretation of this behaviour has been found so far.
The normalized spectra of the time fluctuation (figure 10
a) nicely superimpose on a master curve, indicating that they are independent of the Reynolds number. The spectra of the total fluctuation (figure 10
c), which are the sum of those of the time and spatial fluctuations, thus also nicely gather on a master curve that is independent of
 $Re$
.
We now compare the results obtained in the array of spheres with those obtained in a bubble swarm. Let us begin by considering the integral length scale. For a real bubble swarm with a bubble Reynolds number between 540 and 770, Riboux et al. (Reference Riboux, Risso and Legendre2010) reported that
 $\unicode[STIX]{x1D6EC}\propto d/C_{d}$
. Here, the drag coefficient of a sphere moving at constant velocity in a fluid at rest is estimated by using the correlation of Schiller & Naumann (Reference Schiller and Naumann1933):
 $C_{d}=24/Re(1+0.15\,Re^{0.687})$
. The corresponding values of
 $d/C_{d}$
are represented by a dashed line in figure 9. It regularly increases from 1.3 to 2.4 when
 $Re$
increases from 230 to 1040. The evolution of
 $\unicode[STIX]{x1D6EC}$
observed here is thus different from the scaling proposed by Riboux et al. (Reference Riboux, Risso and Legendre2010). Nevertheless, the experimental investigation of a bubble swarm by Mendez-Diaz et al. (Reference Mendez-Diaz, Serrano-García, Zenit and Hernández-Cordero2013) has not confirmed the validity of the scaling in
 $d/C_{d}$
for a larger range of Reynolds numbers (
 $70\leqslant Re\leqslant 1000$
). In the absence of a reliable law for
 $\unicode[STIX]{x1D6EC}$
, it cannot be concluded whether the integral length scale measured in the array of spheres is determined by the same mechanism as that of a real bubble swarm or not. However, after normalization by the measured values of the variances and of the integral length scale, the wavenumber spectra in the array of spheres can be compared with those of a bubble swarm.
In figure 10, the spectrum of the total fluctuation measured in a real bubble swarm (Riboux et al.
Reference Riboux, Risso and Legendre2010) is represented by a thick blue line, while the spectra of the time, spatial and total fluctuations computed by LES (Riboux et al.
Reference Riboux, Legendre and Risso2013) are represented by thick black dashed lines. The agreement of the present results with a real bubble swarm is remarkably good over the whole range of wavelengths available. The agreement is also good with the LES results for wavelengths larger than
 $\unicode[STIX]{x1D6EC}/2$
, i.e. below the cutoff of the simulated spectrum due to the limited spatial resolution of the computation. The conclusion that has been drawn from the comparison of the PDFs is thus confirmed. When normalized by using their variances and their integral length scale, the structure of the fluctuations induced by an array of fixed solid spheres or a bubble swarm is similar.
6 Frequency spectra of velocity fluctuations
After having analysed the distribution of the energy of the fluctuations over the wavenumber domain, we now consider its distribution over the frequency domain. Frequency spectra are obtained as follows. We first consider a time series of the velocity fluctuation
 $u_{z}(t)$
(or
 $u_{x}(t)$
) in a given location of a high-speed PIV velocity field record. The frequency spectrum corresponding to this particular location is computed by means of discrete Fourier transform. Then, spectra obtained in all locations of the same measurement region and in all various measurement regions are averaged. We thus obtained the average frequency spectrum
 $S_{zt}$
(or
 $S_{xt}$
) of the fluctuation for each Reynolds number. It is worth mentioning that, by definition, the frequency spectrum of the total fluctuation
 $u(t)$
is the same as the frequency spectrum of the time fluctuation
 $u^{\prime }(t)$
. The frequency range available is from
 $8\times 10^{-3}$
Hz to 25 Hz for the lowest investigated Reynolds number, and from
 $17\times 10^{-3}$
Hz to 50 Hz for the largest Reynolds number.
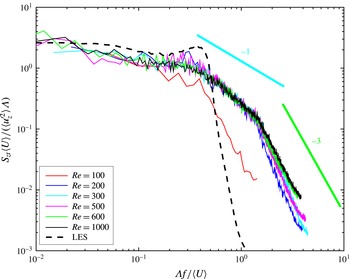
Figure 11 shows the spectra
 $S_{zt}$
of the vertical velocity fluctuations for various Reynolds numbers from 100 to 1000. The spectra
 $S_{xt}$
of the horizontal fluctuation, which show very similar trends, are not reported here. To allow the comparison between the results obtained at different
 $Re$
, the spectra are made dimensionless: the frequency
 $f$
is multiplied by the time scale
 $\unicode[STIX]{x1D6EC}/\langle U\rangle$
and the power spectral density is normalized by
 $\langle u^{\prime 2}\rangle \unicode[STIX]{x1D6EC}/\langle U\rangle$
. This normalization is equivalent to that used for wavenumber spectra when the length scales are converted into time scales in dividing by the average flow velocity
 $\langle U\rangle$
through the array of spheres. Except again the case
 $Re=100$
, all the normalized spectra show a similar evolution that involves three subranges: at low frequencies (
 $\unicode[STIX]{x1D6EC}f/U\leqslant 0.4$
), the spectrum is almost flat; at intermediate frequencies (
 $0.4\leqslant \unicode[STIX]{x1D6EC}f/\langle U\rangle \leqslant 2$
), it follows a
 $-1$
slope; at large frequencies (
 $\unicode[STIX]{x1D6EC}f/\langle U\rangle \geqslant 2$
), it follows a much steeper slope. Thanks to the normalization, the results of all Reynolds numbers nicely collapse onto a master curve, except in the third subrange, where the slope increases with
 $Re$
to eventually converge to
 $-3$
for
 $Re\geqslant 600$
. Both frequency and wavenumber spectra thus exhibit a
 $-3$
slope at large frequencies: the first for
 $\unicode[STIX]{x1D6EC}/\unicode[STIX]{x1D706}\gtrsim 1$
and the second for
 $\unicode[STIX]{x1D6EC}f/\langle U\rangle \gtrsim 2$
.
Normalized frequency spectra of the vertical velocity fluctuations for various Reynolds numbers. The thick dashed line shows corresponds to LES of a bubble swarm for
 $Re=770$
and
 $\unicode[STIX]{x1D6FC}=0.02$
by Riboux et al. (Reference Riboux, Legendre and Risso2013).

The thick dashed line in figure 11 shows the LES frequency spectrum of Riboux et al. (Reference Riboux, Legendre and Risso2013) for
 $Re=770$
and a gas volume fraction
 $\unicode[STIX]{x1D6FC}=0.02$
, similar to that of the present solid spheres. At low frequencies, the LES spectrum shows a plateau similar to that of the array of spheres. Then, at the frequency where the
 $-1$
slope starts for the spheres, the LES shows a rounded peak that is followed by a rapid cutoff. Decreasing either the Reynolds number (by considering smaller bubbles) or the gas volume fraction, Riboux et al. (Reference Riboux, Legendre and Risso2013) observed that the peak becomes sharper. In contrast, increasing these parameters, led to a more rounded peak that eventually vanished. They concluded that, just above the onset of the instability of the steady flow through the swarm of bubbles, fluctuations are characterized by a single frequency. Then, as turbulence develops when increasing either the Reynolds number or the number of bubbles, a continuous spectrum of frequencies develops and the peak progressively vanishes. No peak is visible in the spectra of the fluctuations measured in the array of spheres, maybe because of the presence of the incoming turbulence at low
 $Re$
or maybe because the turbulence development is more sudden with solid spheres. However, the change of slope observed with the spheres at the frequency of the peak that is observed in the LES of a bubble swarm is probably not a coincidence. At larger frequencies, the reason for the presence of the
 $f^{-1}$
and
 $f^{-3}$
subranges is an open question, which could probably be addressed by a comprehensive investigation of the instability of the flow through a random array of obstacles by means of numerical simulations.
7 Concluding remarks
The liquid agitation generated by the flow through a random array of spheres with a solid volume fraction of 2 % has been reported for Reynolds numbers between 120 and 1040. Despite the fact that the spheres are fixed and the flow disturbance generated by a solid sphere is different from that generated by a bubble, the structure of the velocity fluctuations is similar to that of the bubble-induced agitation in a homogeneous swarm of rising bubbles. The energy of the fluctuations and their distribution between the horizontal and vertical components differ, but the PDFs and the spectra are similar, provided velocity fluctuations are normalized by their standard deviation and wavelengths by the integral length scale
 $\unicode[STIX]{x1D6EC}$
. The good agreement with previous results obtained both with a real bubble swarm and LES of a bubble swarm shows that the present flow configuration is a relevant experimental model of bubble-induced agitation at high Reynolds number. The essential phenomenon is the interaction of the flow disturbances generated by obstacles randomly distributed within a flow. For large enough volume fraction (
 $\unicode[STIX]{x1D6FC}\gtrsim 1\,\%$
) and Reynolds number (
 $Re\gtrsim 200$
), the structure of the agitation turns out to be very robust and weakly dependent on either
 $\unicode[STIX]{x1D6FC}$
or
 $Re$
. The understanding of the particular properties of this agitation requires one to distinguish two contributions to the fluctuations. The first, which has been called spatial fluctuation, comes from the strong spatial heterogeneity of the flow around the obstacles, and exists whatever the Reynolds number is. The second, which has been called time fluctuation, results from flow instability at large enough Reynolds number. In the present configuration, where the obstacles are fixed, it has been possible to separate these two contributions by use of both time and spatial averaging.
The spatial fluctuation brings a significant part of the total energy of the fluctuations. It is responsible for the asymmetry of the PDFs of the vertical fluctuations and for the predominance of the vertical fluctuations over the horizontal ones. Most of its energy comes from variations between regions that include wakes, where the time-averaged velocity is low, and regions that surround the wakes, where the time-averaged velocity is close to the bulk velocity. At this stage, it is important to recall that the wake of a sphere surrounded by many spheres is strongly attenuated compared to that of an isolated sphere, as is the case for a bubble in a swarm of bubbles (Risso & Ellingsen Reference Risso and Ellingsen2002; Roig & Larue de Tournemine Reference Roig and Larue de Tournemine2007). Risso et al. (Reference Risso, Roig, Amoura, Riboux and Billet2008) have shown that both the wake of a sphere or the wake of a bubble exponentially decay with the distance, and have almost vanished before 3 diameters. Spatial fluctuations are therefore dominant at scales comparable or larger than
 $d\approx \unicode[STIX]{x1D6EC}$
. At large scales (
 $\unicode[STIX]{x1D706}/\unicode[STIX]{x1D6EC}\geqslant 0.5$
), their spectrum evolves as the power
 $-3$
of the wavenumber – as predicted from the superposition of random disturbances (Risso Reference Risso2011) – whereas at lower scales, it is observed to evolve as the power
 $-5/3$
of the wavenumber.
A Reynolds number larger than 200 is necessary for the flow through the array of spheres to become unstable and for significant time fluctuations to develop. Increasing
 $Re$
from 230 to 650 leads to an increase of the energy of the time fluctuation and a decrease of its integral length scale from
 $\unicode[STIX]{x1D6EC}=1.5d$
to
 $d$
. From
 $Re=850$
, the energy of the time fluctuation converges towards a constant value, as well as its integral length scale (
 $\unicode[STIX]{x1D6EC}\approx d$
). Moreover, the fluctuations are almost isotropic, with a ratio
 $\langle u_{z}^{\prime 2}\rangle /\langle u_{x}^{\prime 2}\rangle \approx 1.15$
at large
 $Re$
. Apart from the evolution of its energy and length scale, the properties of the time fluctuation are remarkably independent of the Reynolds number. In contrast to the spatial fluctuation, the PDFs of the time fluctuation do not show any traces of the wakes and those of the vertical and horizontal fluctuations are identical. They are symmetric and well described by an exponential law. This strong deviation from a Gaussian behaviour marks a major difference with respect to classic developed shear-induced turbulence. A difference which is reinforced by a wavenumber spectrum that evolves as
 $k^{-3}$
and a frequency spectrum that shows a
 $f^{-1}$
subrange followed by a
 $f^{-3}$
subrange.
The major differences observed between the spatial and the time fluctuations show that it is vain to look for a single mechanism that explains all the properties of the bubble-induced turbulence. In particular, it is clear that a model for the energy of the total fluctuations should account for the contrasting evolutions of the two contributions with both the Reynolds number and the gas volume fraction. Also, the level of anisotropy or the asymmetry of the vertical PDFs are related to the spatial inhomogeneity of the flow around the obstacles, and should not be sought in a mechanism of turbulence production. Concerning the spectrum, the
 $-3$
slope is observed for both contributions. Its presence is therefore not dependent on which contribution is dominant, which explains why it is so commonly observed. To conclude, we would like to stress that the modelling of bubble-induced turbulence, especially by means of Reynolds averaged Navier–Stokes equations, should explicitly distinguish between these two contributions.