


Introduction
Hydraulic release events associated with glaciers have received significant attention from both experimental and theoretical perspectives. Such disturbances and subsequent morphological adjustments are known to have ice-dynamical manifestations and feedbacks, such as ice-surface uplift and velocity changes (Reference Iken, Rothlisberger, Flotron and HaeberliIken and others, 1983), and possible relationships to large-scale instabilities (Reference Kamb and EngelhardtKamb and Engelhardt, 1987). These broadly defined events arrive in a variety of forms. Some are associated with the development and collapse of subglacial tunnels, exemplified by Iceland’s jökulhlaups (Reference BjörnssonBjornsson, 1992). Others, more common in non-temperate ice, involve hydraulic rupture of a thermal dam at the glacier margin (e.g. Reference StoneStone, 1993; Reference Skidmore and SharpSkidmore and Sharp, 1999). Reference NyeNye (1976) and Reference Spring and HutterSpring and Hutter (1981), among others, have theoretically described outburst floods of the first type, which typically issue from lakes that are either subglacial (e.g. Reference BjörnssonBjornsson, 1992) or glacier-dammed (e.g. Reference ClarkeClarke, 1986) and tend to be cyclic in nature because they are dependent on recharging a storage reservoir. Little modelling work, however, has been devoted to floods of the second type. These may also be periodic, but occur in heterogeneous flow environments that are difficult to characterize and depend on complex interactions between surface, ice and bed. Release events are most commonly documented by proglacial stream hydrochemistry and suspended-sediment analysis, complemented by supraglacial observations (e.g. Reference Humphrey and RaymondHumphrey and Raymond, 1994; Reference Anderson, Fernald, Anderson and HumphreyAnderson and others, 1999; Reference Skidmore and SharpSkidmore and Sharp, 1999), but rarely have they been recorded subglacially Trapridge Glacier offers this unique opportunity.
Study area
Trapridge Glacier is a small, surge-type glacier in the St Elias Mountains, Yukon Territory, Canada, that supports a multifaceted field program featuring intensive instrumentation of the glacier bed. Sensors that operate year-round demonstrate strong seasonality in subglacial hydromechanical behaviour and have recorded anomalous adjustments sometimes correlated with outbursts from the glacier margin. Two events in particular have registered subglacial responses over tens to hundreds of metres. The first took place in 1990 and was observed and interpreted by Reference StoneStone (1993) and Reference Stone and ClarkeStone and Clarke (1996); the most recent occurred in 1995 (personal communication from J. L. Kavanaugh, 1999). In this paper we revisit the 1990 event equipped with a numerical model to test the hypotheses of Reference StoneStone (1993).
1990 event synopsis and interpretation
According to Reference StoneStone (1993), the 1990 event struck both mechanical and hydrological sensors within an area of 5000 m2 just before midnight on day 203 (Fig. 1). Its onset was marked by an abrupt reduction in subglacial water pressure according to five of six participating pressure sensors, and proceeded in a southwesterly direction. This was followed by an equally abrupt pressure rise to superflotation values, followed by a general decline over the next several days. Superimposed on this decline are diurnal cycles indicating that formerly unconnected sensors became connected to a common drainage system and to the glacier surface. Connections themselves are not rare beneath Trapridge, but they are usually confined to spatial scales less than a few tens of metres (Reference Murray and ClarkeMurray and Clarke, 1995). During the days prior to the event, elevated air temperatures (Fig. la), culminating in a seasonal temperature maximum on the afternoon of day 203, suggest high surface melt. There was no significant precipitation during that period. Proglacial stream stage registered an anomalously early daily maximum the day after the event, followed by a burst of dye that had been injected subglacially in 1985. Except under unusual circumstances, Trapridge proglacial streams carry little or no subglacial water because the frozen glacier margin constitutes a hydraulic barrier.
Observed surface and subglacial conditions surrounding the 1990 hydromechanical event, (a) Air temperature, (b) Selected subglacial water-pressure records, (c) Detail of (b) bracketing the event. The inset (after Reference StoneStone, 1993) indicates relative sensor positions.
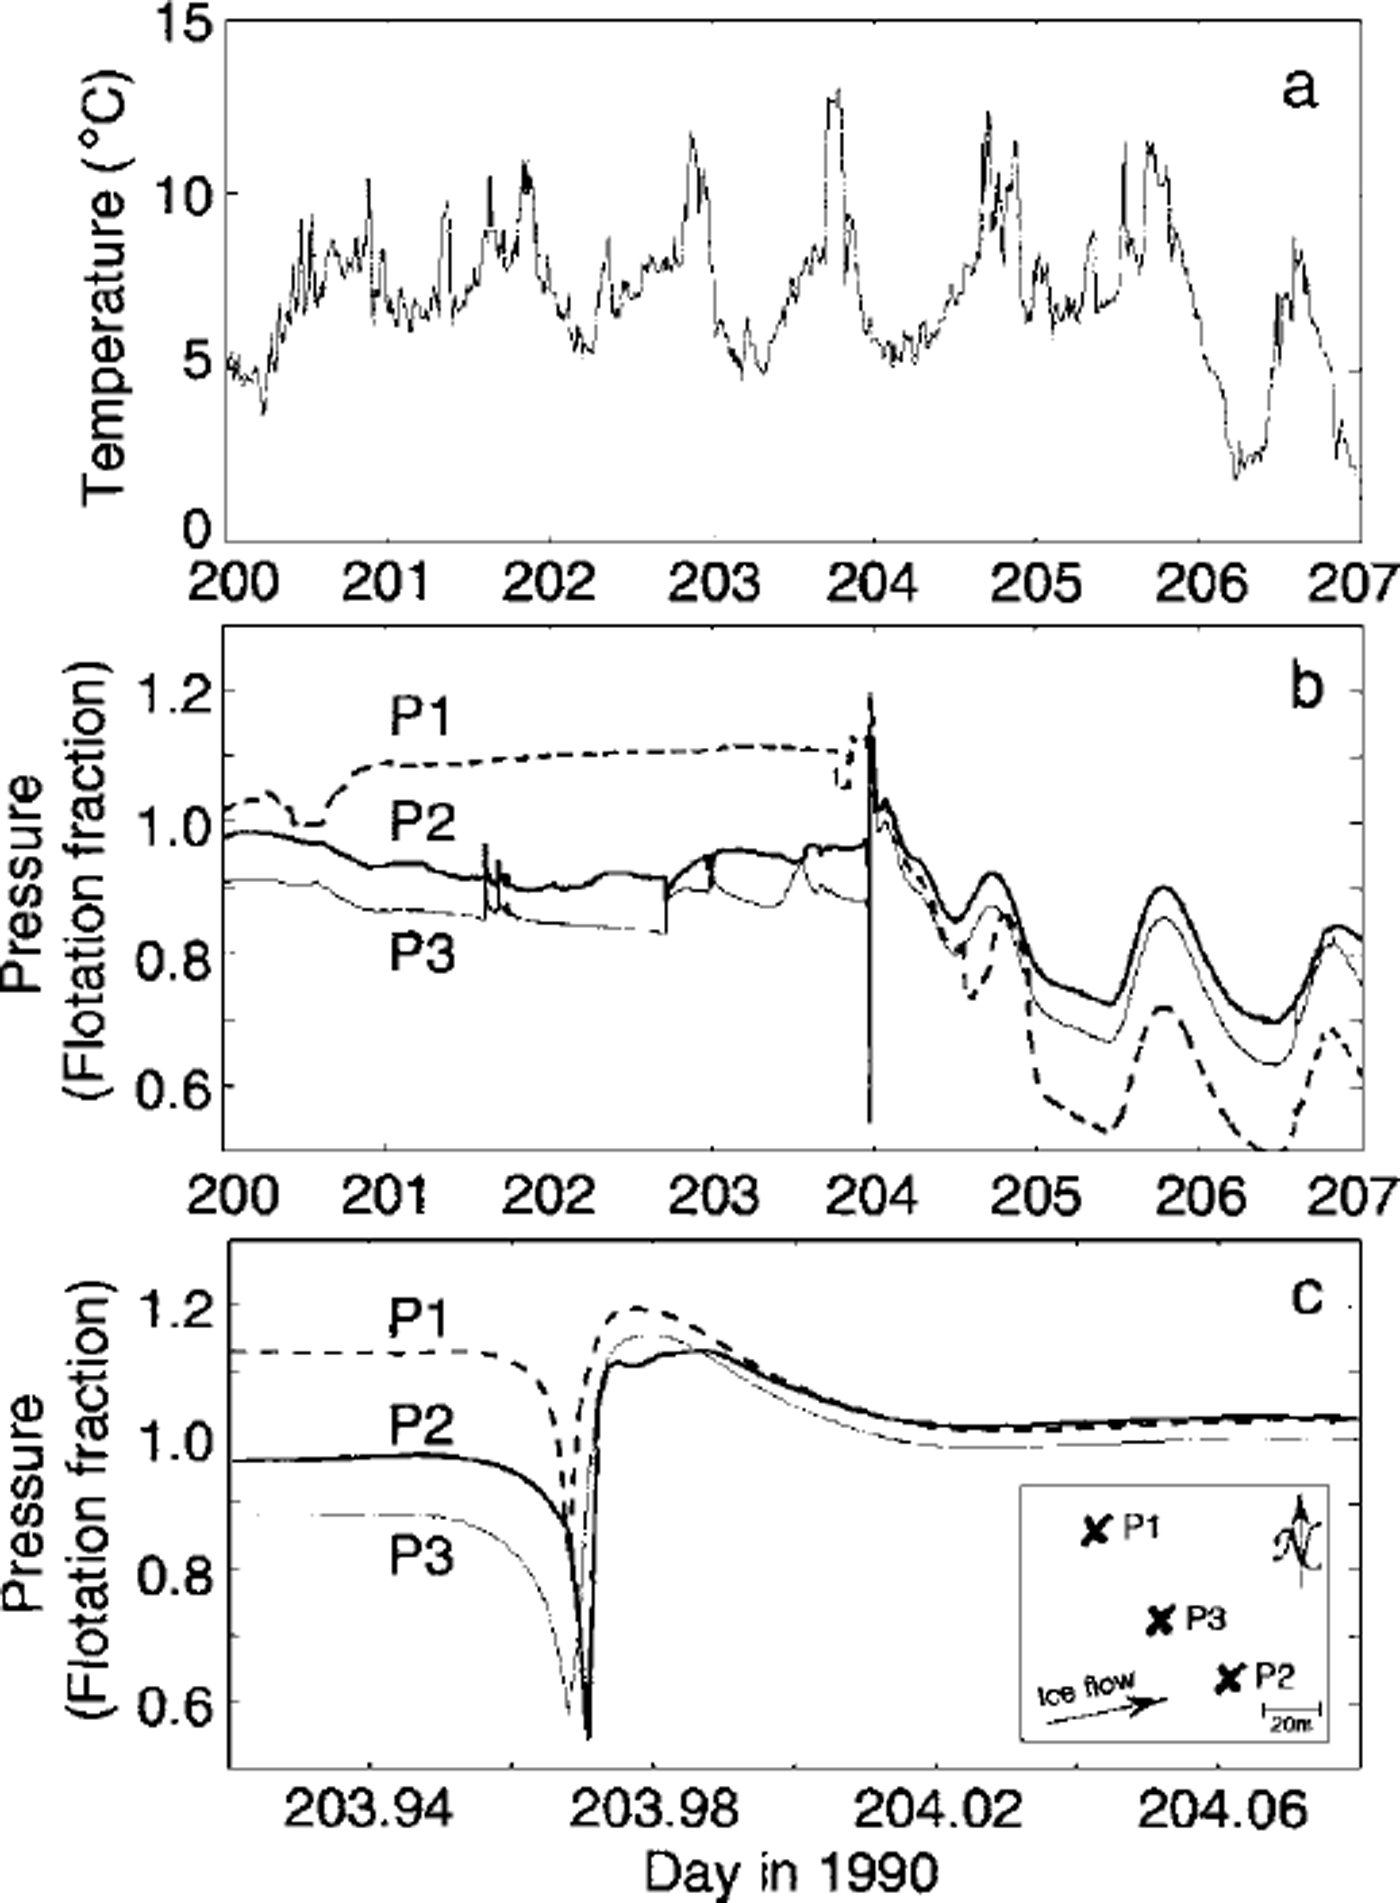
In light of these and other lines of evidence, Reference StoneStone (1993) attributed this temporary alteration of subglacial drainage structure to the sudden drainage of a crevasse, northwest of the study area, into the subglacial system. Such a large water pulse impinging on an inefficient drainage system would, lacking an escape conduit, hydraulically lift the glacier (as observed elsewhere (e.g. Reference Iken, Rothlisberger, Flotron and HaeberliIken and others, 1983)), thus reducing subglacial effective pressure in areas hydraulically isolated from the draining crevasse (manifest as the initial pressure drop recorded by most instruments). Thereafter, hydraulic gradients would drive water rapidly from the source area to these newly created regions of low potential, breaching hydraulic barriers and delivering the pulse observed in Figure 1b and c. The resulting relatively widespread hydraulic connections are maintained for several days before the source water is depleted. Records of subglacial turbidity and conductivity tell a similar story, and argue against other mechanisms such as downstream rupture or subglacial cavity formation. A more comprehensive discussion is given by Reference StoneStone (1993).
Conceptual Model of Glacier Hydrology
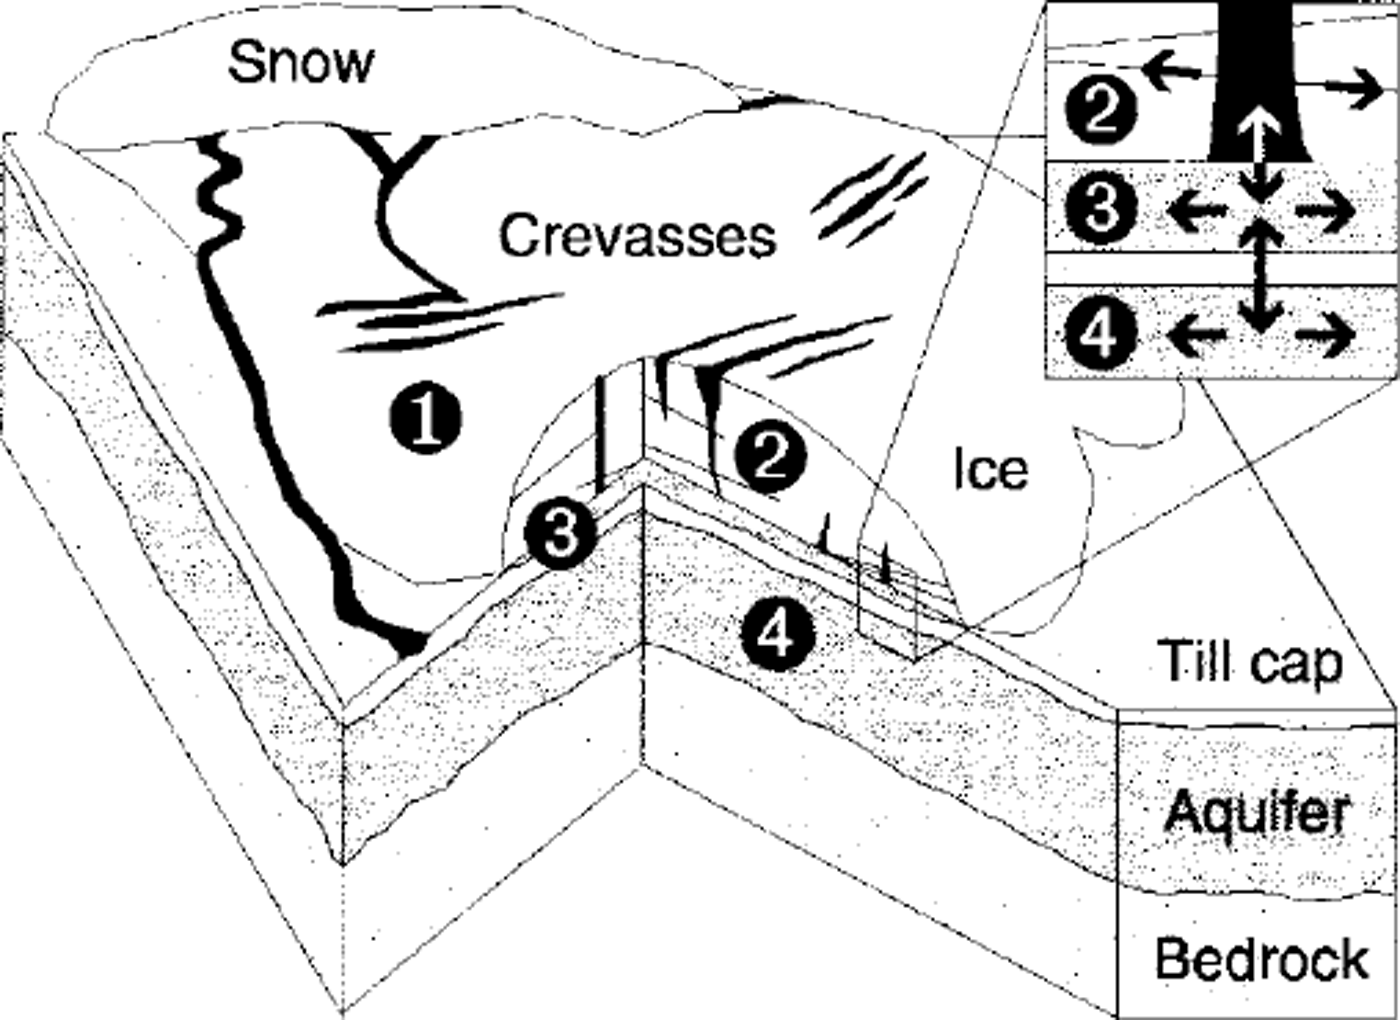
Mathematical elaboration of the model will not be given here; rather, we confine our discussion to its conceptual framework and note the essentials of its numerical implementation. To develop an integrated picture of glacier hydrology, we consider a model of four components illustrated in Figure 2, coupled by water exchange between neighbouring systems. Each system evolves in space and time according to independent governing equations with source terms that parameterize the intercomponent mass exchange. These equations are similar to the focal form of those presented by Reference ClarkeClarke (1996) to describe water flow in hydraulic circuits. For each pixel of our distributed model grid, we solve two-dimensional, vertically integrated, discrete representations of the equations using a Newton-Krylov solution method for non-linear systems (Reference KelleyKelley, 1995).
Conceptual model of glacier hydrology comprising four coupled systems. (1) Surface ablation and runoff. (2) England storage and transport. (3) Subglacial flow in the macroporous horizon. (4) Subsurface groundwater flow. The inset magnifies a cross-section through the macroporous horizon (system 3), indicating possible water-low paths within each layer (horizontal arrows) and exchange between systems (vertical arrows).
Surface hydrology
To compute ablation of snow and ice we use a temperature-index method developed by Reference HockHock (1999) that includes direct clear-sky solar radiation. This approach accounts for shading of the glacier due to surrounding topography and allows spatially variable melt by considering the effects of focal slope and aspect. In the absence of detailed mass-balance information for Trapridge Glacier, we use melt and radiation factors optimized for Storglaciären, Sweden, by Reference HockHock (1999), scaled to produce surface ablation estimates consistent with observations in our study area. These values are reported inTable 1.
Selected model parameters

Runoff routing is governed by spatial gradients in runoff depth and topographic slope after Reference Marshall and ClarkeMarshall and Clarke (1999). The fate of this water is geometrically determined: some enters the glacier through crevasses encountered on the surface, while the remainder runs off supraglacially to the forefield. The distribution of surface crevasses is predicted by a geometric calculation described later.
Englacial hydrology
Numerous field studies confirm that water’s journey from surface to bed can be a long and tortuous one, yet few models have included this complexity (see Reference Fountain and WalderFountain and Walder (1998) for a recent review). We attempt a compromise between modelling the detailed physics of englacial conduit formation and alarming oversimplification by treating the ice as a fractured medium. This allows englacial transport to occur in two horizontal dimensions via cracks, which have occasionally been observed during borehole-drilling, governed in a fashion similar to flow in a fractured aquifer (Reference Freeze and CherryFreeze and Cherry, 1979).
These cracks intersect englacial storage elements fed from the surface (open crevasses or moulins) or bed (basal crevasses), thus providing the necessary connection between the surface and bed. In our mathematical formulation, a cluster of morphologically distinct elements is combined to yield a lumped representation of englacial hydraulic head as a function of stored water volume. This pressure is not necessarily equilibrated with local subglacial water pressure, but is the source of hydraulic gradients that drive water toward the glacier sole. While geometric simplification of englacial storage is inevitable, our approach introduces some flexibility by including several (possibly overlapping) storage geometries and allowing water injected at the surface to migrate within the ice before conveyance to the bed.
Subglacial hydrology
Flow in the subsurface is dictated by conditions at the glacier sole and the underlying hydrostratigraphy. Numerous observations and experiments at Trapridge suggest that a thin layer of permeable saturated sediment (hereafter referred to as the "macroporous horizon") separates the ice from a hydraulically resistant till cap (e.g. Reference Fischer and ClarkeFischer and Clarke, 1994; personal communication from C. C. Smart, 1999). There is no evidence for Röthlisberger channels. Thus, drainage is dominated by flow through the macroporous horizon, rather than in a network of conduits. Accordingly, we use modified Darcian physics to describe basal water flow. Accompanying constitutive relationships capture distinctive non-linear features of the subglacial system and differentiate the modelled macroporous horizon from a traditional aquifer.
Sediment horizons in the exposed glacier forefield observed and described by Reference StoneStone (1993) define a layered subsurface model geometry consisting of a hydraulically resistant till cap underlain by a sandy groundwater aquifer (Fig. 2). Horizontal transport occurs in the macroporous horizon and in the groundwater aquifer, while vertical exchange is accomplished through the till cap. This framework was adopted by analogy to reduced flow in a system of inter-bedded aquifers and aquitards (Reference Chorley and FrindChorley and Frind, 1978).
Model inputs
Various stationary fields, time series and parameters are required to initialize and drive the model. These include digital elevation information, subsurface geometry, crevasse distribution, climate data and physical and numerical constants.
Digital elevation models of the glacier surface and bed are obtained as described by Reference Flowers and ClarkeFlowers and Clarke (1999). The sedimentology and inferred hydraulic characteristics of the forefield are extrapolated beneath the glacier, assuming that the till cap and groundwater aquifer are sub-parallel to the bed. While this assumption is an obvious oversimplification, we have dye-tracing evidence that the aquifer is laterally continuous over hundreds of metres. Variations in its thickness would certainly affect water exchange with the glacier bed, but unless these variations are mapped, we cannot justify increasing the geometric complexity of the model subsurface. The above information is used in the basic hydrological model, while the ablation routine further requires digital models of slope, aspect and elevation for the glacier and its surroundings (Reference HockHock, 1999).
Mapping accurate locations of every crevasse and moulin would be perilous and time-consuming. Alternatively, we have approximated crevasse distribution by analyzing the curvature of the digital ice-surface model, assuming convexity as a proxy for strain, and thus a reasonable indicator of crevasse habitat (Fig. 3). The outcome of this approach compares favourably with aerial photographs. This method works particularly well for Trapridge Glacier because surface crevasses comprise the majority of exposed englacial storage elements; there are no moulins, and boreholes freeze over within 24 hours of drilling. Figure 3 shows our derived crevasse map superimposed on the interpolated glacier surface, and locates model and field-study areas.
Digital representation of crevasse distribution estimated using ice-surface curvature. Solid cells host crevasses, providing englacial access for surface runoff. The expanded area identifies the 1990 field site (lightly shaded) in the context of our model grid and computed crevasse map. Modelled results in Figure 4 correspond to crevassed cell "c". Those in Figure 5 are from adjacent labelled cells. Subscripts indicate their relative positions ( e.g. SW is southwest).

The interval from day 200 to day 207 (19–26 July), 1990 is examined in this study because it brackets the event of interest on the eve of day 204. We therefore require input time series of air temperature and precipitation from this period to force the surface hydrology model; both quantities are monitored by our field-site meteorological station. Spatially distributed temperatures are computed using a constant lapse rate, while precipitation is applied uniformly over the model domain.
Physical and numerical model parameters have been optimized in a number of different tests on synthetic and real topography. Using 1997 climate data from May to October, we focused on replicating typical subglacial behaviour as recorded by many pressure transducers operating during that time. As a result of this exercise, we established a set of standard model parameters. Those relevant to this study are listed in Tablel.
Model adaptations
Release events are intrinsically idiosyncratic, because they represent a failure of the existing drainage system. Our model has been developed to study conventional soft-bed hydrology; thus it requires two important modifications in order to simulate release events. First we must accommodate both hydraulically connected and hydraulically isolated behaviour, and allow spatial and temporal transitions between these two states. Secondly, hydraulic uplift of the glacier must be parameterized.
One can imagine that over grid scales of 20–40 m, the areally averaged thickness of the macroporous horizon must exceed some finite value before hydraulic barriers are breached and communication is established with adjacent regions. This threshold is a function of subgrid attributes such as topographic irregularity and sediment distribution. To represent the connection process, we introduce a switch in the model whereby hydraulic conductivity is a non-zero function only when the saturated horizon is sufficiently thick. The nominal connected layer thickness has been calculated for Trapridge Glacier by statistical analysis of subgrid properties. To initialize the model, we assume that all cells are unconnected except those with a direct surface coupling, where a more mature drainage structure is expected.
Ice-dynamical feedbacks induce a rich variety of subglacial hydrological responses, yet without an ice-dynamics model, interactions between ice and bed cannot be freely determined. Consequently, we must parameterize hydraulic uplift based on hydrological and geometric variables alone. To do so we assume that uplift of the ice creates a subglacial volume increase that can be approximated by a modified two-dimensional Gaussian centred on the initiation point. The volume change at location (x’,y’) can then be expressed as

where a is a dimensionless scaling factor and the remaining unprimed variables refer to the origin of the uplift (x,y): V is subglacial volume, Pw is subglacial water pressure and Pi; is ice overburden pressure. Values of σx, σy and a must be empirically determined; based on the inferred spatial extent of two hydromechanical events at Trapridge Glacier, we take σ× = σy = Hi(x,y) where Hi, is ice thickness. For simplicity, we assume the change described by Equation (1) propagates instantaneously from points where subglacial water pressure exceeds ice flotation pressure.
Results and Discussion
To model the 1990 event and test the interpretation of Reference StoneStone (1993), we prescribe the opening of a valve cock that restricts flow between crevasses and the glacier bed. All our numerical experiments aiming to show an event that arises naturally from the continuous processes included in the model failed. Thus, we concluded that the onset of the observed event must have been extremely rapid ― caused by a switch rather than any semi-continuous process. In Nature this could be a rupture in basal ice connecting englacial storage to the bed, but whatever the cause, it must have been a coupled hydromechanical process.
The hydrological context of the event is summarized in Figure 4, with attention to individual components and their interactions. Figure 4a shows the areally averaged thickness of ice melted near a feeder crevasse as computed by the distributed ablation model. Global evolution of the volume of englacially stored water is shown in Figure 4b, and demonstrates its response to the diurnal melt cycle. Prior to the event, local storage was filled to capacity. The drainage episode itself, marked by a swift reduction in stored water volume (around day 204), depletes storage by approximately 50%, both globally and locally. Further drawdown is prevented by resistance from the overpressurized macroporous horizon.
Modelled evolution of multicomPonent hydrology through the event: results (a) and (c-e) are from crevassed location "c" (Fig 3), northwest of the 1990 field site, (a) Local melt rate of ice (water equivalent per unit time), (b) Global volume of englacially stored water relative to maximum capacity. Prior to the drainage event, local storage was full, ( c) Rate of water transport from englacial storage to the underlying subglacial system, ( d) Resulting subglacial water pressure, ( e) Water-exchange rate between macroPorous horizon and groundwater aquifer. Negative values indicate water delivery to the aquifer.

The pulse of released water delivered to the subglacial system (Fig. 4c) overshadows all subsequent englacial-subglacial exchange, and the resulting rise in water pressure (Fig. 4d) triggers hydraulic uplift of the surrounding ice, allowing the disturbance to cascade into neighbouring regions. Formerly latent areas of the bed are activated, thereby improving hydraulic connectivity, stimulating water transport and facilitating widespread subglacial de-pressunzation. The efficacy of this process maintains low pressures even in areas perpetually charged by the surface, as shown in Figure 4d after day 204.
As a hydraulic buffer, the underlying groundwater aquifer helps dissipate the impact of the flood by accepting a large influx of subglacial water (Fig. 4e). Before the event, poorly connected, high-pressure conditions at the bed give rise to steady seepage into the aquifer, whereas reduced subglacial water pressures following the event produce an exchange reversal, and groundwater upwelling ensues. An aquifer that is too efficient or well coupled to the glacier bed can prevent hydrological events altogether by expediting the removal of excess water. Beneath Trapridge Glacier, stratigraphic layer thicknesses and conductivities (as listed in Table 1) define a system that provides enough resistance to allow hydromechanical events, yet in mid-melt season suffices to evacuate the daily input of surface melt. Our modelling studies, to date, suggest that the aquifer must be saturated in order to produce this range of behaviour.
Modelled subglacial reaction, distal from the source, is shown in Figure 5 over several days (Fig. 5a) and over several hours (Fig. 5b) surrounding the event. These results are extracted from the study area identified in Figure 3, and are shown together in Figure 5 to illustrate the spatial variability of the response. Direct comparison of model output and instrument records is imprudent in this case, because at least two of the records shown in Figure 1 (which lack a perfect harmony themselves) were collected from an area smaller than one model gridcell, for which we have a single modelled result. However, Figure 5a and b demonstrate that we have captured the qualitative features of the event as illustrated by the data in Figure 1. The disturbance appears as a spike in the records and marks the transition between a stable, isolated system (characterized by high, steady water pressures) and a connected system that now interacts with its surroundings and with the glacier surface (indicated by diurnal cycling of water pressure).
Modelled subglacial and proglacial response to an en-glacial drainage episode, (a) Subglacial water pressure over several days surrounding the event. Locations of traces are shown in Figure 3 overlapping the 1990 instrument study area, (b) Detail of section in (a) surrounding the event, (c) Subglacial discharge from the glacier margin. Note the near-zero ambient discharge preceding the event.
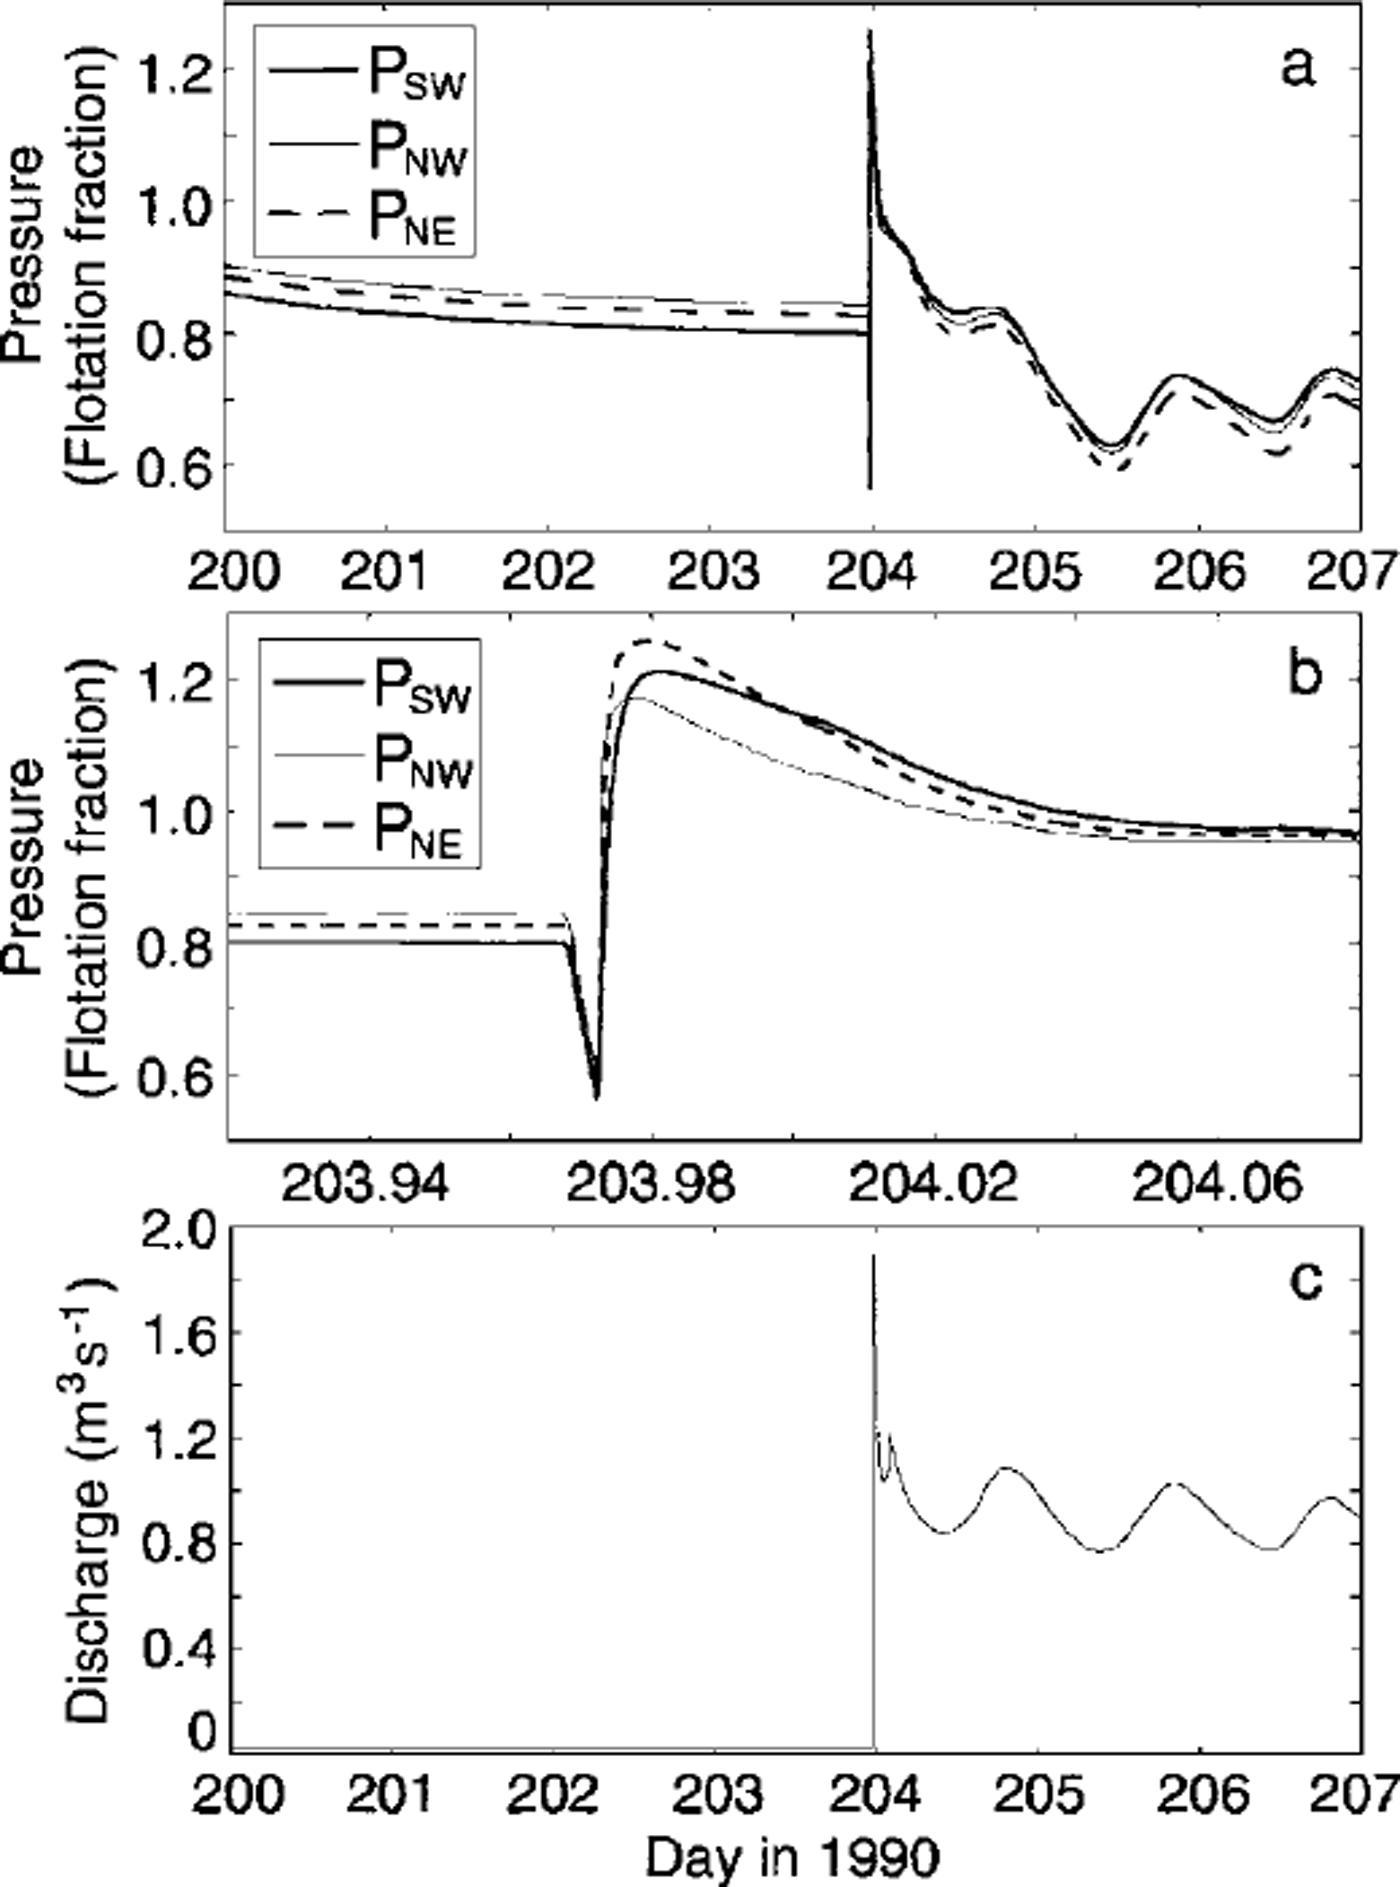
A closer look at the event onset (Fig. 5b) confirms that it begins with an initial pressure drop due to uplift of the ice, followed by a pulse that decays over a matter of hours. The linear pressure decline at the onset of the modelled event results from our assumption of instantaneous hydraulic jacking.
Figure 5c verifies that the modelled effects of this event ultimately propagate to the glacier margin, culminating in a hydraulic outburst. Preceding this, subglacial discharge is a small steady leak, owing to the largely disconnected glacier bed and loss to the groundwater aquifer. Afterward, elevated and diurnally varying discharge persists as the system remains connected to cope with the inundation of surface water.
Model sensitivities
To characterize the variability of results presented in Figure 5a and b we investigate the sensitivity of the model to three key parameters: the uplift scaling factor a used in Equation (1), dimensionless englacial crevasse volume Vc and crevasse location relative to the study area. Figure 6 summarizes results of these tests for point PNW (Fig. 3).
Sensitivity of modelled subglacial behaviour to selected parameters. All results are .for a common test point PNW (Fig. 3). (a) Variation with uplift scaling factor a (Equation (1) ) . (b) Variation with dimensionless crevasse volume Vc. Crevasses were full prior to drainage in each case. Vc = 1 corresponds to an absolute volume in each gridcell equal to 10–46 Vi, where Vi, is the total ice volume in the appropriate cell, (c) Detail of (b). (d) Effects of event-source location. Labels indicate source position relative to the study area (up, upstream; down, downstream; N, north; S, south).
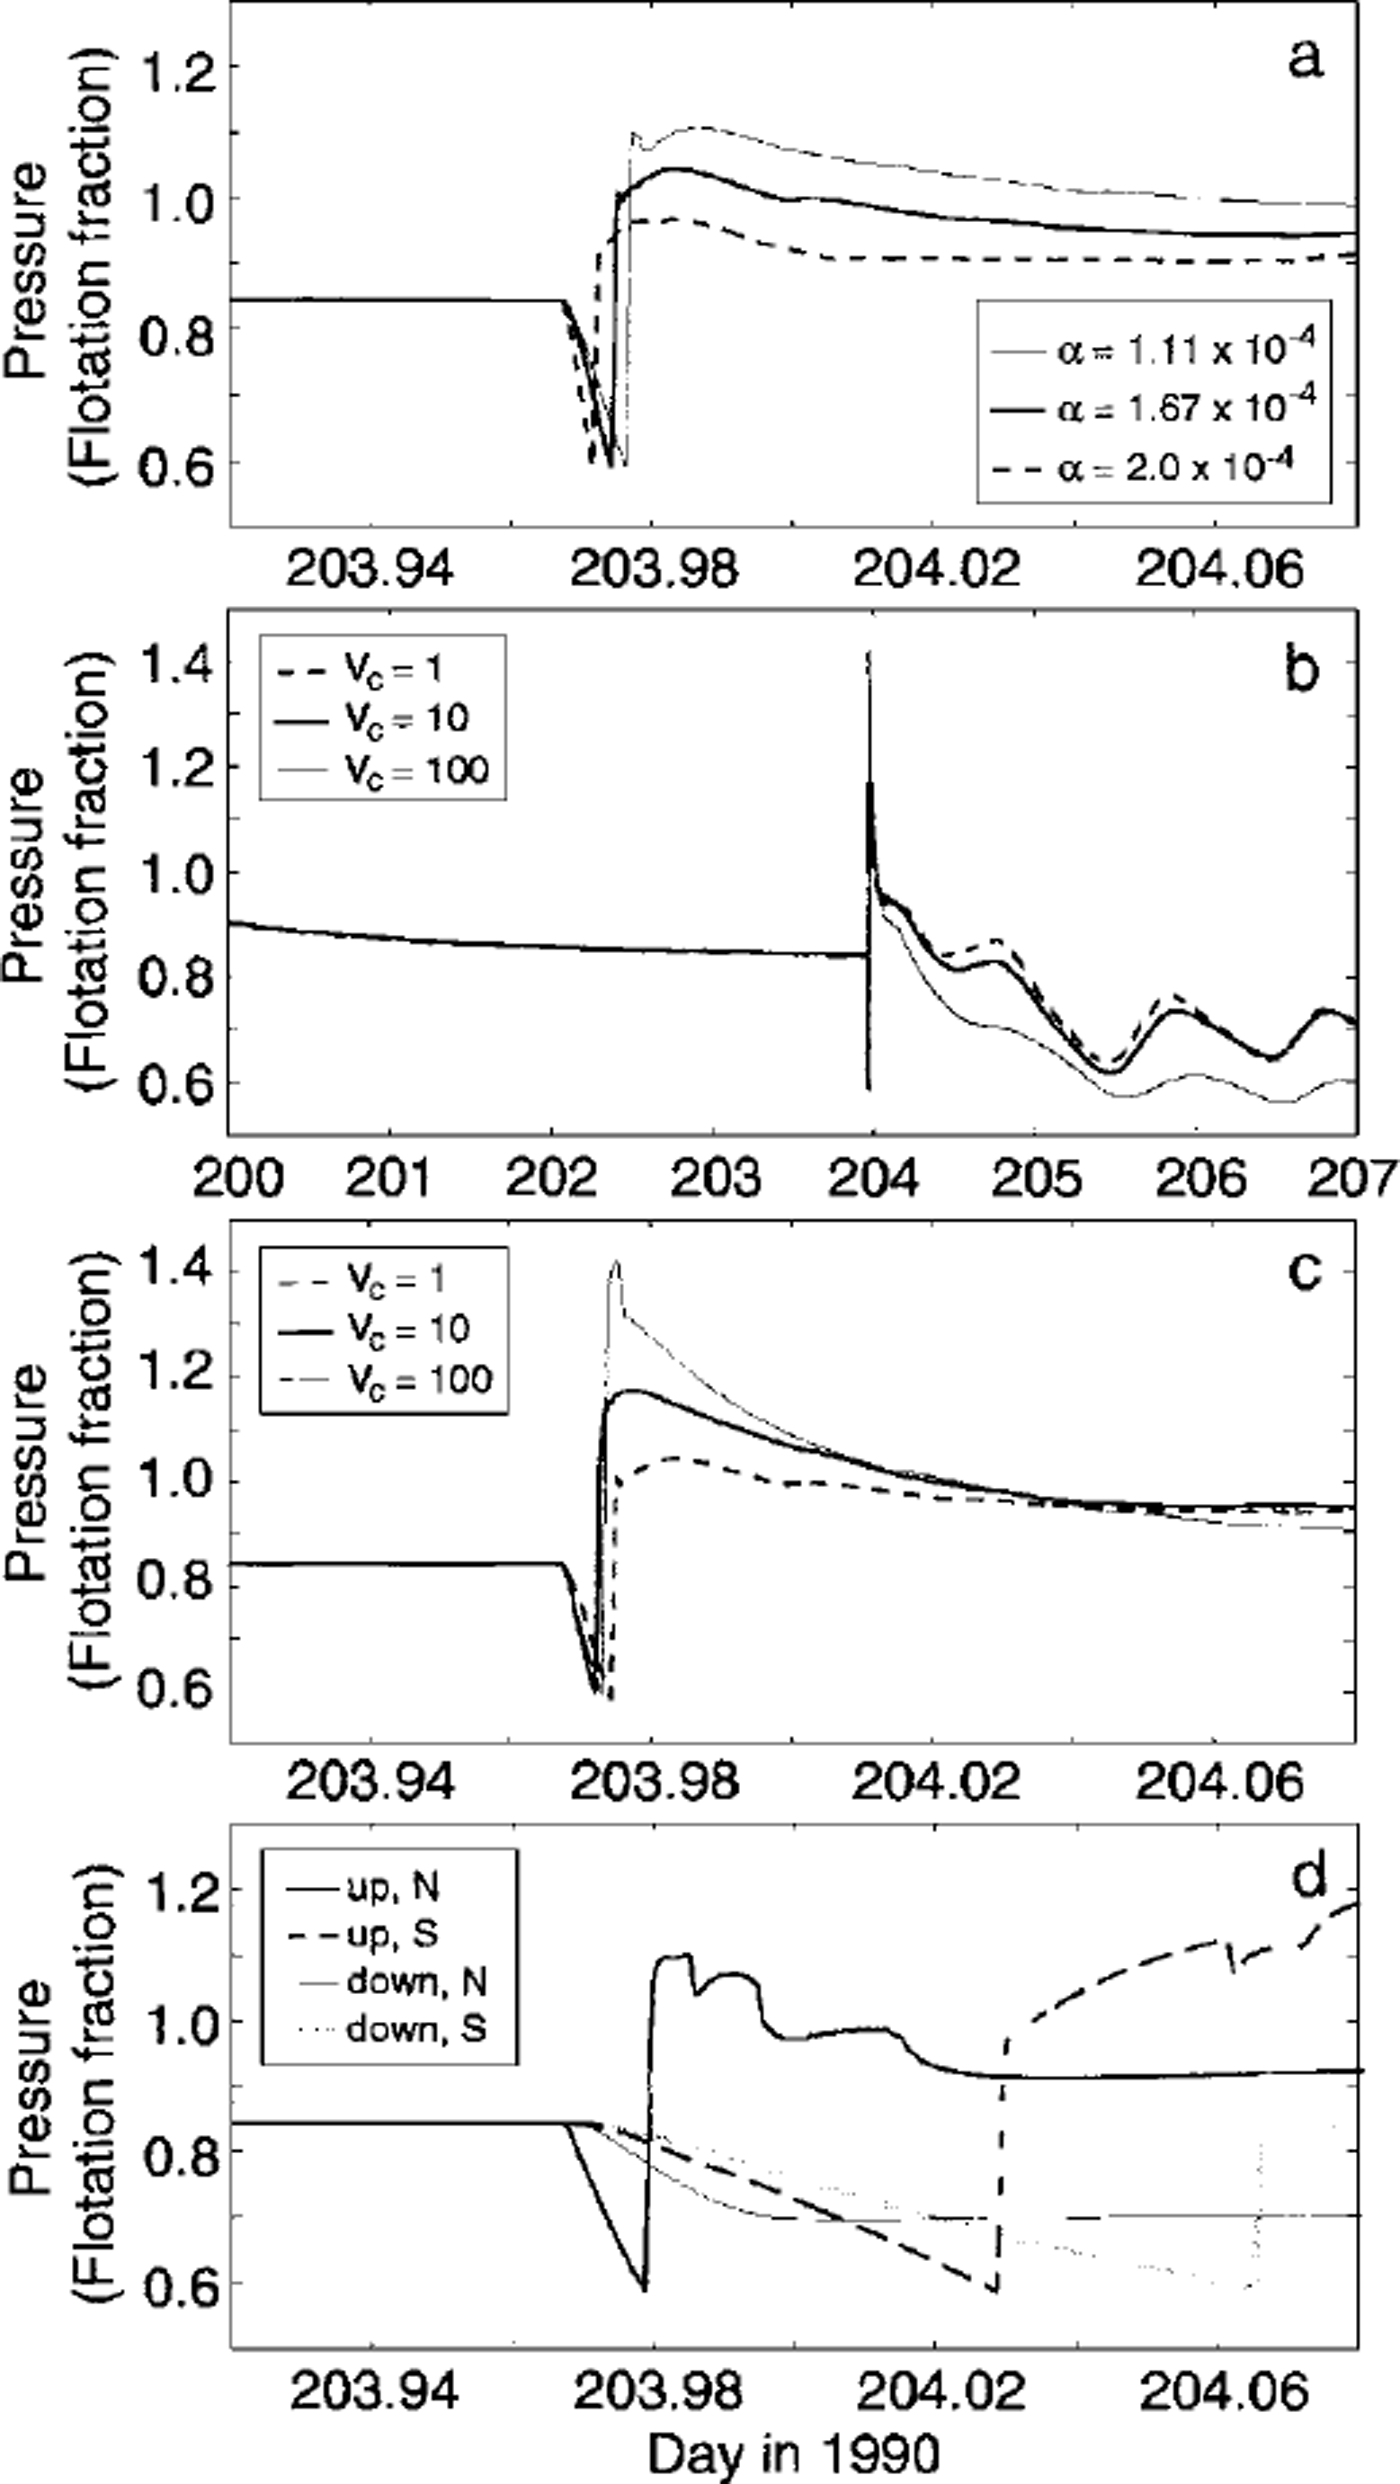
The value of a controls scaling between hydraulic uplift and water pressure (Equation (1)). This relationship dictates the timing and magnitude of response near to, and far from, the uplift inception point. As shown in Figure 6a, a conservative range of a elicits reaction times spanning the variance observed in the field data. Uplift is minimized for small values of a; therefore, higher pressures are ultimately attained, because a fixed volume of source water is forced through a constricted system. The absolute magnitude of a is not meaningful in itself, as it depends on prescribed initial estimates of subglacial volume. Changes due to small variations in a, however, emphasize the system’s sensitivity to volume perturbations.
Figure 6b and c illustrate the surprisingly modest importance of crevasse volume. Bounds can be placed on en-glacial storage capacity by scrutiny of subglacial diurnal signals, as in Figure 6b; for the case of maximum crevasse volume, diurnal variations are noticeably subdued. Crevasses too large to experience substantial pressure excursions in response to daily surface melt provide an unrealistically weak driving force for the subglacial system. Furthermore, sudden drainage of these crevasses gives rise to modelled pressures significantly higher than those observed (Fig. 6c). The accompanying cases shown in Figure 6c, testing crevasses of small and moderate size, both produce acceptable results in light of the data.
Adopting parameters a = 1.67 × 10⁻⁴ and dimensionless crevasse volume Vc = 10, we investigate the effects of event source location. For each case presented in Figure 6d, connections between crevasses and the glacier bed were restricted to quadrants either upstream or downstream and either north or south of the study area. These results appear wildly dissimilar and exhibit some noteworthy features. Drainage in the northern downstream quadrant is predictably reminiscent of a downstream rupture: monotonic pressure reduction is initiated as connections propagate up-glacier. Reference StoneStone (1993) ruled out this mechanism in his 1990 event interpretation because it fails to account for the high-pressure pulse observed after the initial decline. By comparison, downstream drainage on the south side produces a small but late pressure rise. In this case, the relative proximity of downstream crevasses to the south enables flow up-glacier to the study area (see Fig. 3 for crevasse locations relative to the test point).
Both upstream drainage tests yield results closer in character to the data. Pressure maxima exceed ice-flotation values, although arrival of the pulse is delayed as the separation between source and study area increases. Of the four tests, drainage from the northern upstream sector best reflects the form and timing of the observed records. These results have a debatable relationship to the data, as crevasse locations have been crudely predicted for modelling purposes and do not necessarily honour the glacier geometry of 1990. Yet if anything, they favour event initiation northwest of the instrumented area, as inferred by Reference StoneStone (1993).
Concluding Remarks
With extremely simple adaptations of our distributed glacier hydrology model we are able to mimic the signature of a hydromechanical event as recorded by subglacial sensors. Given the changing glacier geometry between the 1990 event and 1997 creation of surface and bed maps, the coarse resolution of the model (compared to individual sensor spacing) and the homogeneous theoretical treatment of a heterogeneous environment, the resemblance of modelled to observed subglacial behaviour is remarkable. This correspondence attests to the robust nature of a soft-bed hydrological response to an englacial drainage episode. Within the limits imposed by the required averaging of physical properties and processes, our numerical results substantiate Reference StoneStone’s (1993) conceptual interpretation of the 1990 event. Application of this integrated modelling approach to similar events on other glaciers could prove interesting given the importance attributed to particulars of glacier surface geography and subglacial geometry in dictating water storage and release. Additionally incorporation of model tracers would be useful in linking proglacial dye-tracing observations and the subglacial story.
Although the model is tailored to describe Trapridge Glacier, the results of this study illustrate some similarities in the transient hydrological behaviour of alpine glaciers that transcend differences in subglacial drainage morphology. The role of englacial and subglacial water storage (or lack thereof) is widely recognized as influential on the coupled interactions of glacier hydraulics and dynamics. In this study, charging of a storage reservoir was prerequisite to the release event. Others studies have shown that the absence of storage, particularly during storms, can give rise to similar subglacial disturbances (e.g. Reference Raymond, Benedict, Harrison, Echelmeyer and SturmRaymond and others, 1995). In either case, it is storage that regulates the timing of glacier hydrological response to external forcing. The character of this response, however, is largely controlled by the hydraulic connectivity of the glacier bed and its behaviour as a time-dependent switch. Finally, as observations and modelling attest, glacier hydraulics and dynamics can never be fully disentangled. This study corroborates others that have invoked dynamical responses, such as hydraulic uplift, to interpret observed glacier hydrological phenomena. The need to parameterize dynamical effects in hydrological models and vice versa will remain until a coupled framework is adopted.
Acknowledgements
We thank D. B. Stone for being a valuable and generous resource; his work was the initial inspiration for this project. R. Hock graciously offered software and support for implementing her ablation model, in addition to computing slope and aspect maps for us. The Geological Survey of Canada provided Yukon digital elevation models. Careful reviews were appreciated from R. LeB. Hooke and T. Schuler. This research was funded by the Natural Sciences and Engineering Research Council of Canada. Parks Canada kindly permitted our field studies in Kluane National Park, and the Arctic Institute of North America provided a base from which to launch our fieldwork.



