




No CrossRef data available.
Modeling the Size of Wars: From Billiard Balls to Sandpiles
Published online by Cambridge University Press: 12 March 2003
Abstract
Richardson's finding that the severity of interstate wars is power law distributed belongs to the most striking empirical regularities in world politics. This is a regularity in search of a theory. Drawing on the principles of self-organized criticality, I propose an agent-based model of war and state formation that exhibits power-law regularities. The computational findings suggest that the scale-free behavior depends on a process of technological change that leads to contextually dependent, stochastic decisions to wage war.Early drafts of this paper were prepared for presentation at the University of Michigan, the University of Chicago, Ohio State University, Yale University, the University of Pennsylvania, and Cornell University. I am grateful to the participants in those meetings and to Robert Axelrod, Claudio Cioffi-Revilla, Fredrik Liljeros, and the editor and the anonymous reviewers of this journal for excellent comments. Laszlo Gulyas helped me reimplement the model in Java and Repast. Finally, I would like to acknowledge the generous support of the John M. Olin Institute for Strategic Studies. Nevertheless, I bear the full responsibility for any inaccuracies and omissions.
Information
- Type
- Research Article
- Information
- Copyright
- © 2003 by the American Political Science Association
Since Richardson's (1948, 1960) pioneering statistical work, we know that casualty levels of wars are power law distributed. Power laws tell us that the size of an event is inversely proportional to its frequency. Among earthquakes, for example, there are many with few casualties, fewer large ones, and very few huge disasters. Among wars, doubling the severity in terms of casualties leads to a decrease in frequency by a constant factor regardless of the size in question. This remarkable finding is among the most accurate and robust to be found in world politics.This pattern has important consequences for both theory and policy. With respect to the latter, regularities of this type help us predict the size distribution of future wars and could therefore assist force-planning (Axelrod 1979). Focusing on war-size distributions also shifts attention from an exclusive reliance on micro-based arguments to a more comprehensive view of the international system. Given the decline of systems-level theorizing in international relations, this is a helpful corrective. As I show below, the implications of the power-law regularity challenge conventional equilibrium-based arguments, which currently dominate the field. Despite the importance of Richardson's law, scholars of international relations have paid little attention to it. Some recent confirmatory studies exist, but to my knowledge, few, if any, attempts have been made to uncover the underlying mechanisms. Drawing on recent advances in nonequilibrium physics, I argue that concepts such as “scaling” and “self-organized criticality” go a long way toward providing an explanation. Relying on the explanatory strategy utilized by physicists, I regenerate the regularity with the help of an agent-based model, called GeoSim, that traces transitions between equilibria. The formal framework itself belongs to a well-known family of models pioneered by Bremer and Mihalka (1977) that has not previously been used for this purpose. Thus, my goal is to modify existing theoretical tools to confront a well-known empirical puzzle.
RICHARDSON'S PUZZLE
In 1948, the English physicist and meteorologist Lewis F. Richardson published a landmark paper entitled “Variation of the Frequency of Fatal Quarrels with Magnitude” (Richardson 1948). Richardson divided domestic and international cases of violence between 1820 and 1945 into logarithmic categories μ = 3,4,5,6, and 7 corresponding to casualties measured in powers of 10. Based on his own updated compilation of conflict statistics, Richardson (1960) recorded 188, 63, 24, five, and two events that matched each category, respectively, the latter two being the two world wars. His calculations revealed that the frequency of each size category follows a simple multiplicative law: for each 10-fold increase in severity, the frequency decreased by somewhat less than a factor of three.
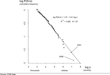
To investigate whether these findings hold up in the light of more recent quantitative evidence, I use data from the Correlates of War (COW) Project (Geller and Singer 1998) while restricting the focus to interstate wars. Instead of relying on direct frequency counts for each order of magnitude as did Richardson, my calculations center on the cumulative relative frequencies of war sizes N(S > s), where S is the random variable of war sizes. This quantity can be used as an estimate of the probability P(S > s) that there are wars of greater severity than s. Thus, whereas for small wars the likelihood of larger conflicts occurring has to be close to one, this probability approaches zero for very large events because it is very unlikely that there will be any larger calamities.
In formal terms, it can be postulated that the cumulative probability scales as a power law:

where C is a positive constant and D is a negative number.
1Power laws are also referred to as “1/f” laws since they describe events with a frequency that is inversely proportional to their size (Bak 1996, 21–24; Jensen 1998, 5). This is a special case with D = −1.

with the intercept logC and the slope coefficient D.

As can be readily seen in Figure 1, the linear fit is strikingly good (R2 = 0.985), confirming that the distribution follows a power law. The data points in the lower right-hand corner represent the world wars. The vast majority of all other wars reach considerably lower levels of severity, though without straying very far from the estimated line. The slope estimate (−0.41) implies that a 10-fold increase in war severity decreases the probability of war by a factor of 2.6 (=1/10−0.41).
This regularity appears to be robust. It can be shown that these findings generalize beyond the two last centuries covered by the COW data. Similar calculations applied to Levy's (1983) compilation of European great power wars from 1495 to 1965 yield a similarly straight line in a log–log diagram with an R2 of 0.99, though with a steeper slope (−0.57 instead of −0.41).2
The slope was estimated from severity 10,000 and above because Levy's (1983) exclusion of small-power wars would lead to undersampling for low levels of severity. Preliminary analysis together with Victoria Tin-bor Hui has yielded promising results for Ancient China, 659–221 BC, despite very incomplete casualty figures (for data, see Hui 2000). In this case, the slope becomes even steeper.
Given these strong results, it may seem surprising that so few scholars have attempted to account for what seems to be an important empirical law. In fact, the situation is not very different from the economists' failure to explain the power law governing the distribution of city sizes, also known as Zipf's law. Using urban population data from many countries, researchers have established that the rank of city size typically correlates astonishingly well with city size.3
Since rank is closely linked to the cumulative density function, this relationship is equivalent to the power laws reported in Figure 1.
Richardson's law remains an equally acute embarrassment. Although the law has been known for a long time, the vast majority of researchers have paid scant attention to it. For example, Geller and Singer (1998) make no mention of it in their comprehensive survey of quantitative peace research dating back several decades (see also Midlarsky 1989 and Vasquez 1993). Those scholars who have focused explicitly on the relationship between war severity and frequency have observed an inverse correlation but have typically not framed their findings in terms of power laws (e.g., Gilpin 1981, 216; Levy and Morgan 1984). To my knowledge there are extremely few studies that address Richardson's law directly.4
Among the exceptions, we find Cioffi-Revilla and Midlarsky (n.d.), who suggest that the power-law regularity applies not only to interstate warfare but also to civil wars (see also Weiss 1963 and Wesley 1962).
Given the discrepancy between the strong empirical findings and the almost-complete absence of theoretical foundations on which to rely to account for them, we are confronted with a classical puzzle. This scholarly lacuna becomes all the more puzzling because of the notorious scarcity of robust empirical laws in political science or international relations. Despite decades of concerted efforts to find regularities, why have so few scholars followed in the footsteps of Richardson, who, after all, is considered to be one of the pioneers of the systematic analysis of conflict? Postponing consideration of this question to the concluding section, I instead turn to a literature that appears to have more promise in accounting for the regularity.
SCALING AND SELF-ORGANIZED CRITICALITY
Natural scientists have been studying power laws in various settings for more than a decade. Usually organized under the notion of self-organized criticality (SOC), the pioneering contributions of Per Bak and others have evolved into a burgeoning literature that covers topics as diverse as earthquakes, biological extinction events, epidemics, forest fires, traffic jams, city growth, market fluctuations, firm sizes, and, indeed, wars (for popular introductions, see Bak 1996 and Buchanan 2000). Alternatively, physicists refer to the key properties of these systems under the heading of “scale invariance” (Stanley et al. 2000).
Self-organized criticality is the umbrella term that connotes slowly driven threshold systems that exhibit a series of meta-stable equilibria interrupted by disturbances with sizes scaling as power laws (Jensen 1998, 126; Turcotte 1999, 1380). In this context, thresholds generate nonlinearities that allow tension to build up. As the name of the phenomenon indicates, there must be elements of both self-organization and criticality. Physicists have known for a long time that, if constantly fine-tuned, complex systems, such as magnets, sometimes reach a critical state between order and chaos (Buchanan 2000, chap. 6; Jensen 1998, 2–3). What is unique about SOC systems, however, is that they do not have to be carefully tuned to stay at the critical point where they generate the scale-free output responsible for the power laws.5
Yet it is not required that SOC holds for any parameter values. As least to some extent, the question of sensitivity depends on the particular domain at hand (Jensen 1998, 128).
Using a sandpile as a master metaphor, Bak (1996, chap. 3) constructed a simple computer model that produces this type of regularity (see Bak and Chen 1991 and Bak, Tang, and Wiesenfeld 1987). If grains of sand trickle down slowly on the pile, power law-distributed avalanches will be triggered from time to time. This example illustrates the abstract idea of SOC: A steady, linear input generates tensions inside a system that in turn lead to nonlinear and delayed output ranging from small events to huge ones.
Whereas macro-level distributions emerge as stable features of scale-free systems, at the micro level, such systems exhibit a strong degree of path dependence (Arthur 1994; Pierson 2000). To use the sandpile as an illustration, it matters exactly where and when the grains land. This means that point prediction often turns out to be futile, as exemplified by earthquakes. This does not mean, however, that no regularities exist. In particular, it is important to distinguish complex self-organized systems of the SOC kind from mere chaos, which also generates unpredictable behavior (Axelrod and Cohen 1999, xv; Bak 1996, 29–31; Buchanan 2000, 14–15).
All this is interesting, but do these insights really generalize to interstate warfare? Though useful as a diagnostic, the mere presence of power laws does not guarantee that the underlying process is characterized by SOC. Like any other class of explanations, such accounts ultimately hinge on the theoretical and empirical plausibility of the relevant causal mechanisms. This is precisely the weakness afflicting the few attempts that have so far been made to explain why wars are power law distributed. Recently, Turcotte (1999, 1418–1420) has observed that Richardson's result resembles a model of forest fires (see also Roberts and Turcotte 1998). Computational models of such phenomena are known to produce slope coefficients not unlike the one in Figure 1. If forest fires start when lightning ignites sparks that spread from tree to tree, Turcotte (1999, 1419) suggests, “ a war must begin in a manner similar to the ignition of a forest. One country may invade another country, or a prominent politician may be assassinated. The war will then spread over the contiguous region of metastable countries” (see also Buchanan 2000, 189).
Though suggestive, this analogy cannot serve as an explanation in its own right, because at the level of mechanisms, there are simply too many differences between forests and state systems. Nevertheless, Turcotte's conjecture points in the right direction. The key to any explanation of war sizes depends on how wars spread, and we therefore need to explore what is known or suspected about this topic.
EXPLAINING THE SCOPE OF WARFARE
Accounting for the size of wars is equivalent to explaining how conflicts spread. Rather than treating large wars, such as the world wars, as qualitatively distinct events requiring separate explanations (e.g., Midlarsky 1990), it is preferable to advance a unified theory that explains all wars regardless of their size (e.g., Kim and Morrow 1992). Apart from the inherent desirability of more general explanations, the stress on SOC encourages us to search for scale-invariant explanations.
Although most of the literature focuses on the causes of war, some researchers have attempted to account for how wars expand in time and space (Siverson and Starr 1991). Most of these efforts center on diffusion through borders and alliances. Territorial contiguity is perhaps the most obvious factor enabling conflict to spread (Vasquez 1993, 237–40). Evidence indicates that states exposed to “warring border nations” are more likely to engage in conflict than those that are not so exposed (Siverson and Starr 1991, chap. 3). Geopolitical adjacency in itself says little about how warfare expands, however. The main logic pertains to how geopolitical instability changes strategic calculations by altering contextual conditions: “An ongoing war, no matter what its initial cause, is likely to change the existing political world of those contiguous to the belligerents, creating new opportunities, as well as threats” (Vasquez 1993, 239; see also Wesley 1962). Henceforth, I will refer to this mechanism as context activation.
The consensus among researchers is that alignment also serves as a primary conduit of conflict by entangling states in conflictual clusters (see Vasquez 1993, 234–37). In fact, the impact of “warring alliance partners” appears to be stronger than that of warring border nations (Siverson and Starr 1991). Despite the obvious importance of alliances, however, I consider only contiguity. Because of its simplicity, the alliance-free scenario serves as a useful baseline for further investigations. Drawing on Vasquez' reference to strategic context, I assume that military victory resulting in conquest changes the balance-of-power calculations of the affected states. The conqueror typically grows stronger while the weaker side loses power. This opens up new opportunities for conquest, sometimes prompting a chain reaction that will stop only when deterrence or infrastructural constraints dampen the process (e.g., Gilpin 1981; Liberman 1996).
What could turn the balance of power into such a period of instability? The list of sources of change is long, but I highlight one crucial class of mechanisms relating to environmental factors. Gilpin (1981, chap. 2) asserts that change tends to be driven by innovations in terms of technology and infrastructure. Such cases of technological change may facilitate both resource extraction and power projection. In Gilpin's words, “technological improvements in transportation may greatly enhance the distance and area over which a state can exercise effective military power and political influence” (57).
As Gilpin (1981, 60) points out, technological change often gives a particular state an advantage that can translate into territorial expansion. Even so, “international political history reveals that in many instances a relative advantage in military technique has been short-lived. The permanence of military advantage is a function both of the scale and complexity of the innovation on which it is based and of the prerequisites for its adoption by other societies.” Under the pressure of geopolitical competition, new military or logistical techniques typically travel quickly from country to country until the entire system has adopted the more effective solution. It is especially in such a window of opportunity that conquest takes place.
Going back to the sandpile metaphor, it is instructive to liken the process of technological change to the stream of sand falling on the pile. As innovations continue to be introduced, there is a trend toward formation of larger political entities thanks to the economies of scale. Context activation, in turn, provokes “avalanches” as contingent chains of war decisions. If the SOC conjecture is correct, the wars erupting as a consequence of this geopolitical process should conform with a power law.
MODELING GEOPOLITICS: GEOSIM
How can we move from models of sandpiles and forest fires to more explicit formalizations of war diffusion? Because the power law in Figure 1 stretches over two centuries, it is necessary to factor in Braudel's longue durée of history. But such a perspective raises the explanatory bar considerably, because this requires a view of states as territorial entities with dynamically fluctuating borders rather than as fixed billiard balls (Cederman 1997, 2002; Cederman and Daase 2003). Levy's data, focusing on great power wars in Europe, for example, coincide with massive rewriting of the geopolitical map of Europe. In early modern Europe, there were as many as 500 independent geopolitical units in Europe, a number that decreased to some 20 by the end of Levy's sample period (Tilly 1975, 24; cf. also Cusack and Stoll 1990, chap. 1).
It therefore seems hopeless to trace macro patterns of warfare without problematizing the very boundaries of states. Fortunately, a family of models exists that does precisely that. Bremer and Mihalka (1977) introduced an imaginative framework of this type featuring conquest in a hexagonal grid, later extended and further explored by Cusack and Stoll (1990). Building on the same principles, the current model, which was originally coded in Pascal (Cederman 1997) and is here implemented in the Java-based toolkit Repast (see http://repast.sourceforge.net), differs in several respects from its predecessors (see also Cederman 2001a). These models are all agent-based. Agent-based modeling is a computational methodology that allows scientists to create, analyze, and experiment with, artificial worlds populated by agents that interact in non-trivial ways and that constitute their own environment (see Axelrod 1997; Epstein and Axtell 1996).
Most importantly, due to its sequential activation of actors interacting in pairs that hardwires the activation regime, Bremer and Mihalka's framework is not well suited for studying the scope of conflicts. In contrast, the quasi-parallel execution of the model presented here allows conflict to spread and diffuse, potentially over long periods of time. Moreover, in the Bremer–Mihalka configuration, combat outcomes concern entire countries at a time, whereas in the present formalization, they affect single provinces at the local level (see Cederman 1997, 82–83). Without this more fine-grained rendering of conflicts, it is difficult to measure the size of wars accurately.
The standard initial configuration consists of a 50 × 50 square lattice populated by about 200 composite, state-like agents interacting locally. Because of the boundary-transforming influence of conquest, interactions among states take place in a dynamic network rather than directly in the lattice. In each time period, the actors allocate resources to each of their fronts and then choose whether or not to fight with their territorial neighbors. Half of each state's resources is allocated evenly to its fronts and the remaining half goes to a pool of fungible resources distributed in proportion to the neighbors' power. This scheme assures that military action on one front dilutes the remaining resources available for mobilization, and this dilution in turn creates a strong strategic interdependence that ultimately affects other states' decision-making. The Appendix describes this and all the other computational rules in greater detail.
For the time being, let us assume that all states use the same “grim-trigger” strategy in their relations. Normally, they reciprocate their neighbors' actions. Should one of the adjacent actors attack them, they respond in kind without relenting until the battle is won by either side or ends with a draw. Unprovoked attacks can happen as soon as a state finds itself in a sufficiently superior situation vis-á-vis a neighbor. Set at a ratio of three to one, a probabilistic threshold defines the decision criterion for such attacks.
Context activation is implemented as an increased alertness to geopolitical changes in case of conflict in a state’s immediate neighborhood. Due to the difficulties of planning an attack, actors challenge the status quo with a probability per period as low as 0.01. If fighting involves neighboring states, however, the contextual activation mechanism prompts the state to enter alert status, during which unprovoked attacks are attempted in every period. This mechanism of contextual activation captures the shift from general to immediate deterrence in crises (Huth 1988, chap. 2).6
As a way to capture strategic consistency, states retain the focus on the same target state for several moves. Once it is time for a new campaign, the mechanism selects a neighbor randomly.
When the local capability balance tips decisively in favor of the stronger party, conquest results, implying that the victor absorbs the targeted unit. This is how composite actors form. If the target was already a part of another multiprovince state, the latter loses its province. Successful campaigns against the capital of composite actors lead to their complete collapse.7
Because the main rationale of the paper is to study geopolitical consolidation processes, the current model excludes the possibility of secession (although this option has been implemented in an extension of the model; see Cederman 2002).
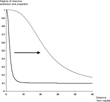
Territorial expansion has important consequences for the states' overall resource levels. After conquest, the capitals of conquered territories are able to “tax” the incorporated provinces. As shown in Figure 2, the extraction rate depends on the loss-of-strength gradient, which approaches one for the capital province but falls quickly as the distance from the center increases (Boulding 1963; Gilpin 1981, 115; cf. Cederman 1997, 129). Far away, the rate flattens out around 10% (again, see Appendix for details). This function also governs power projection for deterrence and combat. Given this formalization of logistical constraints, technological change is modeled by shifting the threshold to the right, a process that allows the capital to extract more resources and project them farther away from the center. In the simulating runs reported in this paper, the transformation follows a linear process in time.

Together these rules have four consequences. First, the number of states decreases as the power-seeking states absorb their victims. Second, as a consequence of conquest, the surviving actors increase in territorial size. Third, decentralized competition creates emergent boundaries around the composite actors. Fourth, once both sides of a border reach a point at which no one is ready to launch an attack, a local equilibrium materializes. If all borders are characterized by such balances, a global equilibrium emerges. Yet such an equilibrium is likely to be temporary because decision-making always involves an element of chance, and, in addition, technological change affects the geopolitical environment of the states.
AN ILLUSTRATIVE RUN
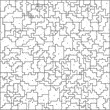
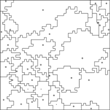
The experimental design features two main phases. In the initial stage until time period 500, the initial 200 states are allowed to compete without technological change. Figure 3 shows a sample system at this point. The lines indicate the states' territorial borders; the dots, their capitals. Because of some cases of state collapse, the number of states has actually gone up to 205.

After the initial phase, technological change is triggered and increases linearly for the rest of the simulation until time period 10,500. At the same time, the war counting mechanism is invoked. The task of operationalizing war size involves two problems. First, spatiotemporal conflict clusters have to be identified as wars. Once they have been identified, their severity needs to be measured. Empirical studies usually operationalize severity as the cumulative number of combat casualties among military personnel (Geller and Singer 1998; Levy 1983). To capture this dimension, the algorithm accumulates the total battle damage incurred by all parties to a conflict cluster. The battle damage amounts to 10% of the resources allocated to any particular front (see Appendix).
The question of identification implies a more difficult computational problem. In real historical cases, subject matter experts bring their intuition to bear in determining the boundaries of conflict clusters. Although determining what constitutes a “case” is not always straightforward (Ragin and Becker 1992), wars tend to be reasonably well delimited (but see Levy 1983, chap. 3). In an agent-based model, in contrast, this task poses considerable problems because of the lack of historical intuition. The model therefore includes a spatiotemporal cluster-finding algorithm that distinguishes between active and inactive states. Active states are those that are currently fighting or fought in the last 20 time periods. The latter rule introduces a “war shadow” that blurs the measurement so that brief lulls in combat do not obscure the larger picture. A cluster in a specific period is defined as any group of adjacent fighting states as long as conflictual interaction binds them together. This allows for the merger of separate conflicts into larger wars. The temporal connection is made by letting states that are still fighting in subsequent periods retain their cluster identification. Once no more active state belongs to the conflict cluster, it is defined as a completed war and its accumulated conflict count is reported.
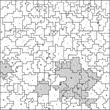
Figure 4 illustrates the sample system at time period 3,326. The three highlighted areas correspond to conflict clusters that remained local. Whereas most conflicts involve two or three actors, some engulf large parts of the system.

The technological diffusion process starts as soon as the initial period is over, as indicated by the states with capitals marked as rings rather than filled squares in Figure 4. These states have experienced at least one shift of their loss-of-strength gradient. This process has dramatic consequences over the course of the simulation. Figure 5 depicts the final configuration of the sample run in time period 10,500. At this stage, only 35 states remain in the system, some of which have increased their territory considerably. Smaller states manage to survive because, as a rule, they have fewer fronts to defend and are in some cases partly protected by the boundary of the grid.

Having explored the qualitative behavior of the model, I can address the question of whether the model is capable of generating robust power laws.
REPLICATIONS
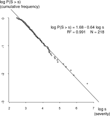
Let us start by exploring the output of the illustrative run. Based on the same type of calculations as in the empirical case, Figure 6 plots the cumulative frequency against corresponding war sizes. It is clear that the model is capable of producing power laws with an impressive linear fit. In fact, the R2 of 0.991 surpasses the fit of the empirical distribution reported in Figure 1.8
This analysis excludes war events that fall below 2.5 on the logarithmic scale, because the clustering mechanism puts a lower bound on the wars that can be detected.


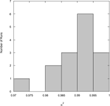
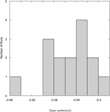
The choice of the sample system is not accidental. In fact, it represents a larger set of systematic replications with respect to linear fit. More precisely, the illustrative run corresponds to the median R2 value of a pool of 15 artificial histories, which were generated by varying the random seed that governs all stochastic events, including the initial configuration. Each replication lasted from time zero all the way to time period 10,500. As reported in line 1 in Table 1, regression analysis of these series yields R2 values ranging from 0.975 to 0.996, with a median of 0.991, corresponding to the sample run. The table also reveals that although the linear fit and the size range of this run are typical, its slope is far below the median of −0.55. As a complement, Figures 7 and 8 summarize the replication findings graphically. The former histogram confirms that the linear fit of all the runs falls around the median at 0.991. The slope distribution, shown in Figure 8, is somewhat more scattered, but it is not hard to discern a smoother distribution describing the general behavior of the system.


These findings are encouraging. Yet establishing the presence of power laws in a small set of runs is not the same thing as highlighting their causes. Therefore, I now turn to a set of experiments that will help identify the underlying causes of the regularities.
WHAT DRIVES THE RESULTS?
The previous section showed findings based on one specific set of parameters. Table A1 (Appendix) reminds us that there are many knobs to turn. Indeed, the calibration process is rather difficult. Given that war has been a rare event in the Westphalian system, the trick is to construct a system that “simmers” without “boiling over” into perennial warfare. Here I describe a series of experiments that suggest that technological change and contextual activation, rather than other factors, are responsible for the production of power laws.
The easiest way to establish the result relating technological change is to study a set of counterfactual runs with fewer, or no, such transformations. Reflecting a loss-of-strength gradient shifted 10 steps instead of 20, the runs corresponding to line 2 in Table 1 indicate that the linearity becomes somewhat less impressive, with a median R2 of 0.980 and a less expansive size range of 3.7. Furthermore, the median slope becomes as steep as −0.62. Once the process of technological change is entirely absent, the scaling behavior disappears altogether, as indicated in line 3. With a representative R2 of 0.941 and a range of 1.4, the linear fit falls well short of what could be expected from even imperfect power laws. Experiments with systems lacking contextual activation show that power-law behavior is unlikely without this mechanism. In these runs, the linearity drops to levels even lower than without technological change (see Table 1, line 4).
These experiments confirm that technological change and contextual decisionmaking play crucial roles in generating progressively larger conflicts. However, the findings say little about the general robustness of the scale-free output. It is thus appropriate to investigate the consequences of varying other dimensions of the model. Keeping all other settings identical to the base runs except for the dimension under scrutiny, lines 5 through 11 in Table 1 reveal that the power laws generated in the base runs are not artifacts of a unique parameter combination. Within bounds, these regularities do not seem to be very sensitive to changes in the “war shadow” of the war-counting mechanism (lines 5 and 6), the states' “trigger happiness” (line 7), the fungibility of resource allocation (line 8), the shape of the distance gradient (lines 9 and 10), or the size of the grid (line 11). The last section in the Appendix provides more precise information about these experiments.
Obviously, the point of the sensitivity analysis is not that the power laws hinge exclusively on technological change and the contextual activation mechanism. It is not hard to make the scale-free output vanish by choosing extreme values on any of the dimensions relating to lines 5 to 11 in Table 1, or other parameters for that matter. Because finding this intermediate range of geopolitical consolidation requires considerable parameter adjustment in the current model, the pure case of parameter insensitivity characterizing SOC cannot be said to have been fully satisfied. Yet the qualitative behavior appears to remain for a reasonably large range of values and dimensions. Ultimately, extensive empirical calibration of the these parameters and mechanisms will be required to reach an even firmer conclusion about the causes of Richardson's law.
In general terms, it is clear that scaling behavior depends on both a logistical “brake” slowing down the states' conquering behavior and an “acceleration effect,” in this case represented by the contextual activation mechanism. What self-correcting mechanisms could render the scale-free behavior even less sensitive to parameter variations? It should be noted that I have made a number of simplifying assumptions, which might render the computational power laws less robust than they are in the real world. First, attention must turn to alliances since, as noted above, they have been singled out in the theoretical and empirical literature on war diffusion. More generally, interaction has been restricted to contiguous neighbors. Relaxing that assumption would allow great powers to extend their reach far beyond the neighboring areas. Such a mechanism would help explain how large conflicts spread.
At the structural level, it would be necessary to consider secession and civil wars (see Cederman 2002). These constrains could slow down positive-feedback cycles of imperial expansion through implosion. The exclusive focus on local, contiguous combat assumes away far-reaching interventions by great powers both on land and at sea. Moreover, nationalism affects not only the extractive capacity but also the boundaries of states through national unification and secession.
CONCLUSION
Despite the complications introduced by parameter sensitivity, the GeoSim model in its present “stripped” form has fulfilled its primary purpose of generating power laws similar to those observed in empirical data. The current framework may well be the first model of international politics that does precisely that. In addition, technological change and contextually activated decision-making go a long way toward explaining why power laws emerge in geopolitical systems. Without these mechanisms, it becomes very hard to generate scale-free war-size distributions. These findings take us one step closer to resolving Richardson's original puzzle, first stated more than half a century ago. The computational reconstruction of this regularity should strengthen confidence in the conjecture that interstate warfare actually follows the principles of self-organized criticality. However, stronger confidence does not equal conclusive corroboration, which requires considerably more accurate portrayal of the causal mechanisms generating the phenomenon in the first place.
If we nevertheless assume that the SOC conjecture holds, important consequences for theory-building follow. By using the method of exclusion, we have to ask what theories are capable of generating regularities of this type.9
For a similar critique of conventional theorizing, see Robert Axtell (2000), who proposes a simple model to account for power law-distributed firm sizes in the economy.
At the level of general theorizing, Waltz (1979) epitomizes this transfer of analogies by stressing the prevalence of negative feedback and rationality in history. Yet if SOC is a correct guide to interstate phenomena such as war, it seems less likely that static frameworks such as that suggested by Waltz are the right place to start in future attempts to build systems theory. In fact, his sweeping anarchy thesis remains too vague to be particularly helpful in explaining particular wars or any aggregate pattern of warfare for that matter (Vasquez 1993).
This reasoning does not render realist analysis of warfare obsolete, but it does tell us that such theorizing needs to rest on explicitly spatiotemporal foundations. In fact, Gilpin's (1981) analytical sketch of war and change may offer a more fruitful point of departure than does Waltz's. Partly anticipating the SOC perspective, Gilpin (1981) advances a dialectical theory that interprets wars as releases of built-up tensions in the international system: “As a consequence of the changing interest of individual states, and especially because of the differential growth in power among states, the international system moves from a condition of equilibrium to one of disequilibrium” (14). Once the tension has been accumulated, it will sooner or later be released, usually in a violent way: “Although resolution of a crisis through peaceful adjustment of the systemic disequilibrium is possible, the principal mechanism of change throughout history has been war, or what we shall call hegemonic war” (15). Yet, rather than adopting an exclusively revolutionary approach to warfare, Gilpin realizes that most adjustments produce much smaller conflicts. By adopting an explicit nonequilibrium focus, Gilpin provides a more helpful analytical starting point for dynamic systems theorizing than does Waltz (see also Organski and Kugler 1980).
Viewed as a source of theoretical inspiration, then, the sandpiles of nonequilibrium physics may prove more useful as master analogies than either the billiard balls of classical physics or the “butterfly effect” of chaos theory. Earthquakes, forest fires, biological evolution, and other historically formed complex systems serve as better metaphors for the broad picture of world history than “ahistorical” pool tables or intractable turbulence. It may not be a coincidence that scholars trying to make sense of historical disruptions have been prone to use seismic analogies. According to Gaddis's (1992, 22) analysis of the end of the Cold War, “[W]e know that a series of geopolitical earthquakes have taken place, but it is not yet clear how these upheavals have rearranged the landscape that lies before us.”
Following in the footsteps of contemporary natural science, computational modeling enables theory in political science and international relations to move from such intriguing, yet very loose, analogies to detailed investigations of how causal mechanisms interact in time and space. System effects, though well understood by qualitative theorists (e.g., Jervis 1997), have not been integrated into a comprehensive theory. Most importantly, careful modeling may help us avoid the pitfalls of the simplistic analogizing that has so often haunted theory. For example, a seismic analogy supported by statistical parallels between wars and earthquake magnitudes could tempt realist “pessimists” to conclude that wars are as unavoidable as geological events. Yet such a conclusion does not follow from SOC at all, for democratic security communities can emerge. Whereas some areas of the world are prone to frequent outbreaks of interstate violence, in others, catastrophic events are virtually unthinkable. But unlike continental plates, the Pacific regions are socially constructed features of the international system. As conjectured by Kant, the emergence of democratic security communities over the last two centuries shows that the “laws” of geopolitics can be transcended (Cederman 2001a, 2001b).
If SOC provides an accurate guide to world politics, it can be concluded that disaster avoidance through the “taming” of Realpolitik by promoting defensive mechanisms or by avoiding “bandwagoning behavior” may be as futile as hoping that the “new economy” will prevent stock market crashes from ever happening. In the long run, we may be willing to pay the price of market upheavals to benefit from the wealth-generating effect of decentralized markets. In contrast, it is less obvious that the world can afford to run the risk of catastrophic geopolitical events, such as nuclear wars. The only safe way of managing security affairs is to transform the balance of power into a situation of trust, which is exactly what happened between France and Germany during the last half-century. Nuclear calamities would further vindicate Richardson's law, but few people would remain to appreciate the advances of social science should the ostensibly “impossible” turn out to be just another huge low-probability event.
Appendix: Detailed specification of the geosim model
The model is based on a dynamic network of relations among states in a square lattice. Primitive actors reside in each cell of the grid and can be thought of as the basic units of the framework. Although they can never be destroyed, they can lose their sovereignty as other actors come to dominate them hierarchically. In such a case, the result is a composite actor constituted by a capital and provinces.
All sovereign actors, whether primitive or composite, keep track of their geopolitical context with the help of a portfolio holding all of their current relationships. These can be of three types:
- Territorial relations point to the four territorial neighbors of each primitive actor (north, south, west, and east).
- Interstate relations refer to all sovereign neighbors with which an actor interacts.
- Hierarchical relations specify the hierarchical link between provinces and capitals.
Whereas all strategic interaction is located at the interstate level, territorial relations become important as soon as structural change happens. Combat takes place locally and results in hierarchical changes that are described below. The order of execution is quasi-parallel. To achieve this effect, the list of actors is scrambled each time structural change occurs. The actors keep a memory of one step and thus in principle make up a Markov process.
Tiggered by a model-setup stage, the main simulation loop contains five phases that are presented in the following. In the first phase, the actors' resource levels are calculated. In the second phase, the states allocate resources to their fronts, followed by a decision procedure, during which they decide on whether to cooperate or defect in their neighbor relations. The interaction phase determines the winner of each battle, if any. Finally, the structural-change procedure carries out conquest and other border-changing transformations.
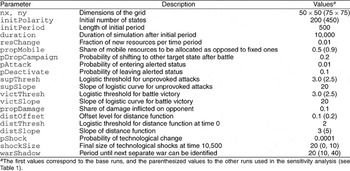
This Appendix refers to the parameter settings of the base runs reported in line 1 in Table 1. Table A1 provides an overview of all system parameters, with alternative experimental settings in parentheses. The last section of the Appendix, which is devoted to the sensitivity analysis reported in rows 5 through 11 in Table 1, details these settings.

Model Setup
At the beginning of each simulation, a square grid with dimensions nx = ny = 50 is created and populated with a preset number of composite actors: initPolarity = 200. The algorithm lets these 200 randomly located actors be the founders of their own composite states, the territory of which is recursively grown to fill out the intermediate space until no primitive actors remain sovereign.
Resource Updating
As the first step in the actual simulation loop, the resource levels are updated. The simple “metabolism” of the system depends directly on the size of the territory controlled by each capital. It is assumed that all sites in the grid are worth one resource unit. A sovereign actor i begins the simulation loop by extracting resources from all of its provinces. It accumulates a share of these resources determined by a distance-dependent logistical function dist (see Figure 2):

where distOffset = 0.1 sets the flat extraction rate for long distances, and distSlope = 3 the slope of the curve (higher numbers imply a steeper slope). Technological change governs the initial location of the threshold distThresh(t), which is a function of time t. To simulate technological development, the threshold of the distance function dist(d,t) is gradually shifted outward starting as a linear function of the simulation time, where

and distThresh = 2, initPeriod = 500, and duration = 10,000, the overall duration of the simulation run after the end of the initial period. The added displacement shockSize = 20 determines the final location of the threshold. This shift represents the state of the art of technological change with which each state catches up with a probability pShock = 0.0001 per time period. This probability is contextually independent of the strategic environment.
In addition, the battle damage is cumulated for all external fronts (see the interaction module below). Finally, the resources res(i, t) of actor i in time period t can be computed by factoring in the new resources (i.e., the nondiscounted resources of the capital together with the sum of all tax revenue plus the total battle damage) multiplied by a fraction resChange = 0.01. This small amount assures that the resource changes take some time to filter through to the overall resource level of the state:

Resource Allocation
Before the states can make any behavioral decisions, resources must be allocated to each front. Whereas unitary states possess up to four fronts, composite ones can have many more relations. Resource allocation proceeds according to a hybrid logic. A preset share of each actor's resources is considered to be fixed and has to be evenly spread to all external fronts. Yet this scheme lacks realism because it underestimates the strength of large actors, at least to the extent that they are capable of shifting their resources around to wherever they are needed. The remaining part of the resources, propMobile = 0.5, is therefore mobilized in proportion to the opponent's local strength and the previous activity on the respective front. Fungible resources are proportionally allocated to fronts that are active (i.e., where combat occurs), but also for deterrent purposes in anticipation of a new attack. Allocation is executed under the assumption that only one new attack might happen (see Cederman 1997, 117–21).
For example, a state with 50 mobile units could use them in the following way assuming that the five neighboring states could allocate 10, 15, 20, 25, and 30, respectively. If the previous period featured warfare with the second and fourth of these neighbors, these two fronts would be allocated 15/(15 + 25) × 50 = 18.75 and 25/(15 + 25) × 50 = 31.25. Under the assumption that one more war could start, the first, third, and fifth states would be allocated, respectively, 10/(15 + 25 + 10) × 50 = 10, 20/(15 + 25 + 10) × 50 = 20, and 30/(15 + 25 + 10) × 50 = 30.
Formally, resource allocation for state i starts with the computation of the fixed resources for each relationship j. A preset proportion of the total resources res is evenly spread out across the n fronts:

The remaining part, mobileRes=propMobile*res, is allocated in proportion to the activity and the strength of the opponents. To do this, it is necessary to calculate all resources that were targeted against actor i:

The algorithm of actor i′s allocation can thus be summarized:

DECISIONS
Once each sovereign actor has allocated resources to its external fronts, it is ready to make decisions about future actions. This is done by recording the front-dependent decisions in the corresponding relational list. As with resource allocation, this happens in parallel through double-buffering and randomized order of execution. The contextual activation mechanism ensures that the actors can be in either an active or an inactive mode depending on the combat activity of their neighbors. Normally, the states are not on alert, which means that they attempt to launch unprovoked attacks with a low probability, pAttack = 0.01. If they or their neighboring states become involved in combat, however, they automatically enter the alerted mode, in which unprovoked attacks are contemplated in every round. Once there is no more action in the neighborhood, an alerted state reenters the inactive mode with probability pDeactivate = 0.1 per time step.
All states start by playing unforgiving “grim trigger” with all their neighbors. If the state decides to try an unprovoked attack, a randomly chosen potential victim j′ is selected. In addition, a battle-campaign mechanism stipulates that the aggressor retains the current target state as long as there are provinces to conquer unless the campaign is aborted with probability pDropCampaign = 0.2. This rule guarantees that the states' target selection does not become too scattered.
The actual decision to attack depends on a probabilistic criterion p(i,j′) that defines a threshold function that depends on the power balance in i′s favor (see below). If an attack is approved, the aggressor chooses a “battle path” consisting of an agent and a target province. The target province is any primitive actor inside j′ (including the capital) that borders on i. The agent province is a province inside state i (including the capital) that borders on the target. In summary, the decision algorithm of a state i can be expressed in pseudo-code.

The precise criterion for attacks p(i,j′) remains to be specified. The model relies on a stochastic function of logistic type in which the local power balance plays the main role:

where dist(d,.) is the time-dependent distance function described above and d and d′ are the respective distance from the capitals of i and j to the battle site (here the temporal parameter is suppressed to simplify the exposition). This discounting introduces distance dependence with respect to power projection. Hence, the probability can be computed as

where supTresh = 3.0 is a system parameter specifying the threshold that has to be transgressed for the probability of an attack to reach 0.5, and supSlope a tunable parameter that determines the slope of the logistic curve, which is set to 20 for the runs reported in this paper.
INTERACTION
After the decision phase, the system executes all actions and determines the consequences in terms of the local power balance. The outcome of combat is determined probabilistically. If the updated local resource balance bal(i,j′) tips far enough in favor of either side, that side wins the battle. In the initial phase, the logistical probability function q(i,j′) has the same shape as the decision criterion with the same threshold set at victThresh = 3 and with an identical slope, victSlope = 20:

This formula applies to attacking states. In accordance with the strategic rule-of-thumb that stipulates that an attacker needs to be about three times more powerful than a defender to prevail, the threshold of the latter is set to 1/victThresh = 1/3.
Each time step in a battle can generate one of three outcomes: It may remain undecided, or one or both sides could claim victory. In the first case, combat continues in the next round due to the grim-trigger strategy in the decision phase. If the defending state prevails, all action is discontinued. If the aggressor wins, it can advance a territorial claim, which is processed in the structural change phase.
The interaction phase also generates battle damage, which is factored into the overall resources of the state (see above). If state j attacks i, the costs incurred by j amount to propDamage = 10% of j′s locally allocated resources, or 0.1*res(j,i). The total size of a war is the cumulative sum of all such damage belonging to the same conflict cluster.
STRUCTURAL CHANGE
Structural change is defined as any change in the actors' boundaries. This version of the framework features conquest as the only structural transformation, but extensions include both secession and voluntary unification (see Cederman 2002). Combat happens locally rather than at the country level (cf. Cusack and Stoll 1990). Thus structural change affects only one primitive unit at a time. The underlying assumption governing structural change enforces states' territorial contiguity in all situations. As soon as the supply lines are cut between a capital and its province, the latter becomes independent. Claims are processed in random order, with executed conquests locking the involved units to avoid territorial anomalies.
The units affected by any specific structural claim are defined by the target(i,j) province. If it is
- a unitary actor, then the actor is absorbed into the conquering state.
- the capital province of a composite state, then the invaded state collapses and all its provinces become sovereign.
- a province of a composite state, then the province is absorbed. If, as a consequence of this change, any of the invaded states' other provinces become unreachable from the capital, these provinces regain sovereignty.
Sensitivity Analysis
This section contains a brief description of the sensitivity analysis (see Table 1). I start by testing whether the granularity of the cluster-finding algorithm makes a difference. Lines 5 and 6 in Table 1 correspond to runs with the warShadow of the war-counting mechanism set to 10 and 40 steps, respectively, as opposed to the 20 steps used in the base runs. The linear fit does not change significantly in response to these tests, but the slope of the regression line in log–log space varies somewhat with the size of the smallest war that can be detected. As would be expected, the finer the granularity, the steeper the line: As opposed to a median slope of −0.55 in the base system, the coefficients become −0.60 and −0.50 with war shadows of 10 and 40, respectively.
Does the location of the decision-making threshold for unprovoked attacks influence the output? Line 7 in Table 1 reflects a series of runs in a system with the threshold supThresh and victTresh set to 2.5 rather than to 3. To prevent these runs from degenerating into one big conflict cluster, I chose a lower level of technological change of 10, but otherwise the settings were identical to those in the base runs. Again, fairly impressive power laws emerge, in these cases with a median R2 of 0.984. The continued sensitivity analysis reported in line 8 increases the resource fungibility propMobile from 0.5 to 0.9 in the routine for resource allocation. As indicated in Table 1, this change does little to alter the scaling behavior of the model.
Another set of tests pertains to distance dependence. Robustness checks with a higher level of long-distance offset, distOffset =0.2 (line 9), and a steeper slope, distSlope =5 (line 10), produce outcomes similar to those in the base model. Finally, the findings reported in line 11 indicate that the size of the grid does not appear to affect the process significantly. In fact, with an expanded 75 × 75 grid and initPolarity =450, the scaling behavior reaches an even higher level of accuracy, with a median R2 of 0.993 and a wider median range of 4.6. The slopes become somewhat steeper in these larger systems.
References
Arthur W. Brian
1994
Increasing Returns and Path Dependence in the Economy
Ann Arbor
University of Michigan Press
Axelrod Robert
1997
The Complexity of Cooperation: Agent-Based Models of Competition and Collaboration
Princeton, NJ
Princeton University Press
Axelrod Robert
Cohen Michael D.
1999
Harnessing Complexity: Organizational Implications of a Scientific Frontier
New York City
Free Press
Axtell Rorbert
2000
The Emergence of Firms in a Population of Agents
Working Paper 99-03-019.
Santa Fe, NM
Santa Fe Institute
Bak Per
1996
How Nature Works: The Science of Self-Organized Criticality
New York
Copernicus
Bak Per
Chao Tang
Kurt Wiesenfeld
1987
Self-Organized Criticality: An Explanation of 1/f Noise
Physical Review Letters
59
381-84Google Scholar
Boulding Kenneth E.
1963
Conflict and Defense
New York
Harper and Row
Bremer Stuart A.
Michael Mihalka
1977
Machiavelli in Machina: Or Politics among Hexagons
Problems of World Modeling
Karl W. Deutsch
Boston
Ballinger
Buchanan Mark
2000
Ubiquity: The Science of History … or Why the World Is Simpler Than We Think
London
Weidenfeld and Nicolson
Cederman Lars-Erik
1997
Emergent Actors in World Politics: How States and Nations Develop and Dissolve
Princeton, NJ
Princeton University Press
Cederman Lars-Erik
2001
Modeling the Democratic Peace as a Kantian Selection Process
Journal of Conflict Resolution
45
470
502Google Scholar
Cederman Lars-Erik
2001
Back to Kant: Reinterpreting the Democratic Peace as a Macrohistorical Learning Process
American Political Science Review
95
15
31Google Scholar
Cederman Lars-Erik
2002
Endogenizing Geopolitical Boundaries with Agent-Based Modeling
Proceedings of the National Academy
99
suppl. 3
7296-303Google Scholar
Cederman Lars-Erik
Christopher Daase
2003
Endogenizing Corporate Identities: The Next Step in Constructivist IR Theory
European Journal of International Relations
Forthcoming
Cioffi-Revilla Claudio
Midlarsky Manus I.
2003
Highest-Magnitude Warfare: Power Laws, Scaling, and Fractals in the Most Lethal International and Civil Wars
Toward a Scientific Understanding of War: Studies in Honor of J. David Singer
Paul F. Diehl
Ann Arbor
University of Michigan Press
Cusack Thomas R.
Richard Stoll
1990
Exploring Realpolitik: Probing International Relations Theory with Computer Simulation
Boulder, CO. Lynnie Rienner
Epstein Joshua M.
Robert Axtell
1996
Growing Artificial Societies: Social Science From the Bottom Up
Cambridge, Mass
MIT Press
Gaddis John Lewis
1992
The Cold War, the Long Peace, and the Future
The End of the Cold War: Its Meaning and Implications
Michael J. Hogan
Cambridge
Cambridge University Press
Geller Daniel S.
Singer J. David
1998
Nations at War: A Scientific Study of International Conflict
Cambridge
Cambridge University Press
Gilpin Robert
1981
War and Change in World Politics
Cambridge
Cambridge University Press
Hui Victoria Tin-bor
2000
Rethinking War, State Formation, and System Formation: A Historical Comparison of Ancient China (659–221 BC) and Early Modern Europe (1495–1815 AD)
Ph.D. diss.
Columbia University
Huth Paul K.
1988
Extended Deterrence and the Prevention of War
New Haven
Yale University Press
Jensen Henrik Jeldtoft
1998
Self-Organized Criticality: Emergent Complex Behavior in Physical and Biological Systems
Cambridge
Cambridge University Press
Jervis Robert
1997
System Effects: Complexity in Political and Social Life
Princeton, NJ
Princeton University Press
Kim Woosang
Morrow James D.
1992
When Do Power Shifts Lead to War?
American Journal of Political Science
36
896
922Google Scholar
Krugman Paul
1995
Development, Geography, and Economic Theory
Cambridge, MA
MIT Press
Levy Jack S.
1983
War in the Modern Great Power System, 1495–1975
Lexington
Kentucky University Press
Levy Jack S.
Morgan T. Clifton
1984
The Frequency and Seriousness of War
Journal of Conflict Resolution
28
731-49Google Scholar
Liberman Peter
1996
Does Conquest Pay? The Exploitation of Occupied Industrial Societies
Princeton, NJ
Princeton University Press
Midlarsky Manus I.
1989
Handbook of War Studies
Boston
Unwin Hyman
Midlarsky Manus I.
1990
Systemic Wars and Dyadic Wars: No Single Theory
International Interactions
16
171-81Google Scholar
Organski A. F. K.
Jacek Kugler
1980
The War Ledger
Chicago
University of Chicago Press
Pierson Paul
2000
Increasing Returns, Path Dependence, and the Study of Politics
American Political Science Review
94
251-67Google Scholar
Ragin Charles C.
Becker Howard S.
1992
What Is a Case? Exploring the Foundations of Social Inquiry
Cambridge
Cambridge University Press
Richardson Lewis F.
1948
Variation of the Frequency of Fatal Quarrels with Magnitude
American Statistical Association
43
523-46Google Scholar
Richardson Lewis F.
1960
Statistics of Deadly Quarrels
Chicago
Quadrangle Books
Roberts D. C.
Turcotte D. L.
1998
Fractality and Self-Organized Criticality in Wars
Fractals
4
351-57Google Scholar
Siverson Randolph M.
Harvey Starr
1991
The Diffusion of War: A Study of Opportunity and Willingness
Ann Arbor
University of Michigan Press
Stanley H. E. et al
2000
Scale Invariance and Universality: Organizing Principles in Complex Systems
Physica A
281
60
68Google Scholar
Thompson William R.
2000
The Emergence of the Global Political Economy
London
Routledge
Tilly Charles
1975
Reflections on the History of European State-Making
The Formation of National States in Western Europe
Charles Tilly
Princeton, NJ
Princeton University Press
Turcotte Donald L.
1999
Self-Organized Criticality
Reports on Progress in Physics
62
1377-429Google Scholar
Vasquez John A.
1993
The War Puzzle
Cambridge
Cambridge University Press
Waltz Kenneth N.
1979
Theory of International Politics
New York
McGraw–Hill
Weiss Herbert K.
1963
Stochastic Models of the Duration and Magnitude of a Deadly Quarrel
Operations Research
11
101-21Google Scholar
Wesley James Paul
1962
Frequency of Wars and Geographic Opportunity
Journal of Conflict Resolution
6
387-89Google Scholar
Replication Results Based on 15 Runs of Each System
 You have Access
- 196
- Cited by
Comments
No Comments have been published for this article.