INTRODUCTION
Phospholipids (PLs) are vital and ubiquitous components of the cell membrane bilayer that delineates the confines of a cell and its subcellular compartments. The major classes of glycerophospholipids include: phosphatidic acid (PA), phosphatidylglycerol (PG), phosphatidylinositol (PI), cardiolipin (CL) and the aminoglycerophospholipids: phosphatidylcholine (PC), phosphatidylethanolamine (PE) and phosphatidylserine (PS) (Fahy et al. Reference Fahy, Subramaniam, Brown, Glass, Merrill, Murphy, Raetz, Russell, Seyama, Shaw, Shimizu, Spener, van Meer, Van Nieuwenhze, White, Witztum and Dennis2005). Considering that their hydrophobic chains can vary in length and degree of unsaturation, a wide variety of different molecular species of each phospholipid class are possible. This diversity allows the formation of highly specialised membranes with unique functions; also the alteration of the membrane lipid composition allows the cell to respond to environmental changes. The glycerophospholipid composition of membranes varies with cell type in multicellular organisms, and is different in the individual organelles in eukaryotic cells. The composition also depends on growth conditions, such as pH, temperature and the growth phase; lipids are also not equally distributed across the two leaflets of a membrane bilayer (Zachowski, Reference Zachowski1993). Furthermore, in higher eukaryotes bioactive precursors stored in PLs and released by phospholipases have been recognized as important factors in signal transduction and in the generation of lipid mediators, such as eicosanoids (James and Downes, Reference James and Downes1997; Six and Dennis, Reference Six and Dennis2000). Phospholipase-modified PLs are themselves important mediators in cellular processes such as apoptosis and membrane trafficking (Fadok et al. Reference Fadok, de Cathelineau, Daleke, Henson and Bratton2001; Ishii et al. Reference Ishii, Fukushima, Ye and Chun2004).
Trypanosoma brucei, the causative agent of African sleeping sickness, belongs to the order Kinetoplastida, which are considered part of the earliest diverging eukaryotic lineages (Michels et al. Reference Michels, Hannaert and Bringaud2000). As such, there is an historical precedence to regard T. brucei as a ‘model organism’ for the study of alternative mechanisms by which eukaryotes accomplish basic functions (Michels et al. Reference Michels, Hannaert and Bringaud2000). During their life-cycle they encounter vastly different environments and respond to these by dramatic morphological and metabolic changes, including adaptation of their lipid and energy metabolism (Michels et al. Reference Michels, Hannaert and Bringaud2000). Lipids constitute 11–18% of the dry weight of T. brucei and their distribution is consistent with the usual range of lipids found in eukaryotes, such as phospholipids, neutral lipids, sterols, fatty acids, plasmalogens, isoprenoids and sterols (Dixon and Williamson, Reference Dixon and Williamson1970; Dixon et al. Reference Dixon, Ginger and Williamson1971; Venkatesan and Ormerod, Reference Venkatesan and Ormerod1976; Patnaik et al. Reference Patnaik, Field, Menon, Cross, Yee and Butikofer1993; Smith, Reference Smith1993; Vial et al. Reference Vial, Eldin, Tielens and van Hellemond2003).
T. brucei contains all the major phospholipid classes, accounting for ~80% of membrane lipids (Patnaik et al. Reference Patnaik, Field, Menon, Cross, Yee and Butikofer1993). Trypanosomes do not utilise the intact phospholipids they scavenge from their hosts, but use their repertoire of metabolic and anabolic enzymes to synthesise their own phospholipids and glycolipids de novo as per their specific requirements (Dixon and Williamson, Reference Dixon and Williamson1970; van Hellemond and Tielens, Reference van Hellemond and Tielens2006). Until relatively recently most of the literature on T. brucei lipid metabolism involved myristate metabolism and its requirement for glycosylphosphatidylinositol (GPI) anchor biosynthesis (Buxbaum et al. Reference Buxbaum, Raper, Opperdoes and Englund1994, Reference Buxbaum, Milne, Werbovetz and Englund1996). With the completion of the T. brucei genome, several biosynthetic enzymes involved in de novo synthesis of phospholipids have been studied, including: sphingomyelin synthases, a phospholipase A1, the phosphatidylinositol synthase and enzymes of the Kennedy pathway involved in de novo PE and PC synthesis – this has been reviewed recently (Smith and Bütikofer, Reference Smith and Bütikofer2010).
Since many pathogens have developed unique membrane structures and specialised lipid biosynthetic pathways that differ from those of the host, the study of lipid metabolism could unravel novel drug targets for therapeutic intervention. As progress in research elucidates lipid metabolism in greater detail in parasites and hosts, and more enzymes involved in phospholipid metabolism are characterized, new targets are likely to emerge for the development of new anti-protozoan drugs. For example, it has been shown that a possible mechanism of action of the lysophospholipid analogues, miltefosine, edelfosine and ilmofosine, against Leishmania and Trypanosoma cruzi proceeds through the inhibition of PC biosynthesis (Urbina, Reference Urbina2006). Bisthiazolium compounds are choline analogues showing strong potency against the malaria parasite Plasmodium falciparum and they were shown to target PC biosynthesis from choline and ethanolamine (Le Roch et al. Reference Le Roch, Johnson, Ahiboh, Chung, Prudhomme and Plouffe2008).
In trypanosomes, as with other cells, older methods of PL analysis relied heavily upon thin layer chromatography to separate and identify various PL classes. Subsequently gas chromatography was employed to analyze the overall fatty acid composition (Godfrey, Reference Godfrey1967; Dixon and Williamson, Reference Dixon and Williamson1970). Later some T. brucei PL molecular species were identified by benzoyl derivatisation of the diradylglycerols derivatives followed by thin layer chromatography separation of diacyl, alkylacyl and alkenylacyl fractions prior to reverse phase chromatography/mass spectrometry (Patnaik et al. Reference Patnaik, Field, Menon, Cross, Yee and Butikofer1993). These older methods are time, labour and material expensive, which makes these multi-step analyses vulnerable to oxidation and other modifications during preparation. Although not used to study T. brucei lipid composition, fast atom bombardment MS has alleviated many of these disadvantages and allowed sensitive analysis of intact lipids (Chilton and Murphy, Reference Chilton and Murphy1986). The next generation of MS technology, electrospray ionization tandem mass spectrometry (ESI-MS-MS), allows ‘soft’ ionization of biomolecules without chromatographic separation or derivatization, and has the benefit of high sensitivity and reproducibility (Kerwin et al. Reference Kerwin, Tuininga and Ericsson1994; Brugger et al. Reference Brugger, Erben, Sandhoff, Wieland and Lehmann1997). ESI-MS-MS allows specific detection of the major PL classes and subclasses, and their molecular species, from the same sample. This methodology has proved an efficient tool for examining alterations in the cell's lipidome after cellular perturbations, either genetically or chemically. For instance, it has been used to analyze global changes in the PL content of sphingomyelin-deficient and alkylacyl/alkenylacyl PL-deficient Leishmania major (Zufferey et al. Reference Zufferey, Allen, Barron, Sullivan, Denny, Almeida, Smith, Turco, Ferguson and Beverley2003; Denny et al. Reference Denny, Goulding, Ferguson and Smith2004), and knock-outs or knock-downs of enzymes involved directly or indirectly in de novo lipid synthesis in T. brucei (Voncken et al. Reference Voncken, van Hellemond, Pfisterer, Maier, Hillmer and Clayton2003; Martin and Smith Reference Martin and Smith2006a, Reference Martin and Smithb; Richmond and Smith Reference Richmond and Smith2007a, Reference Richmond and Smithb; Güler et al. Reference Güler, Kriegová, Smith, Luke and Englund2008; Signorell et al. Reference Signorell, Rauch, Jelk, Ferguson and Bütikofer2008; Gibellini et al. Reference Gibellini, Hunter and Smith2009 and reviewed in van Hellemond and Tielens, Reference van Hellemond and Tielens2006).
Here we report the lipidomes of commonly used laboratory strains BSF and PCF T. brucei, characterizing ~500 individual molecular phospholipid species. This will provide a useful tool to the community to aid future biochemical phenotyping of either genetically or chemically altered T. brucei.
MATERIALS AND METHODS
Materials
All solvents were analytical HPLC grade and from BDH. Glassware was used at all times after the introduction of solvent to the samples, except when loading samples into nanoflow tips. Glassware was solvent washed and positive displacement pipettes with glass tips were used to measure solvent quantities, where possible. Ethanol-1,1,2,2-d4-amine (d4-ethanolamine) were from CDN Isotopes. The non-natural phospholipid standards 1,2-diheptadecanoyl-sn-glycero-3-phosphate, PA (17:0/17:0); 1,2- dipentadecanoyl-sn-glycerol-3-phosphoethanolamine PE (15:0/15:0); 1,2-dimyristoyl-sn-glycero-3-[phospho-rac-(1-glycerol)], PG (14:0/14:0); 1,2-diheneicosanoyl-sn-glycero-3-phosphocholine, PC (21:0/21:0); 1,2-dimyristoyl-sn-glycerol-3-[phospho-L-serine], PS (14:0/14:0); 1-dodecanoyl-2-tridecanoyl-sn-glycero-3-phospho-(1′-myo-inositol), PI (12:0/13:0); and 1,2 dipalmitoyl-sn-glycerol, DAG (16:0/16:0), were purchased from Avanti Polar Lipids.
T. brucei cell culture
Bloodstream form (BSF) trypanosome cultures (strain 427, MITat 1.2) were maintained in HMI-9 media at pH 7·5, supplemented with 10% heat-inactivated foetal calf serum (PAA Labs) and 10% Serum Plus (JRH Biosciences). Cells were grown in Cell star tissue culture flasks with air filter lids (Greiner) and incubated in a humidified 37°C incubator with 5% CO2. The BSF in vitro culture cell line used throughout this study is from the long-term cultures of ‘single marker’ cells that express a tetracycline repressor and T7 RNA Polymerase (Wirtz et al. Reference Wirtz, Leal, Ochatt and Cross1999). This transgenic parental cell line was maintained under neomycin (G418) drug pressure at a final concentration of 2·5 μg/ml. Cultures were normally maintained below a cell density of 2×10⁶/ml before lipid extraction. Procyclic form (PCF) trypanosome cultures were maintained in supplemented SDM-79 media at pH 7·4 which contained 15% heat-inactivated foetal calf serum as a lipid source, 2 g/L NaHCO3, 2·5 mg/ml haemin and 1x Glutamax (Invitrogen). Cells were grown in non-tissue culture treated flasks (Falcon) in a humidified 28°C incubator with 5% CO2. The PCF in vitro culture cell line used throughout these studies is from the long-term cultures of ‘double marker’ cells that express a tetracycline repressor and T7 RNA polymerase. This transgenic parental cell line was maintained under neomycin (G418) and hygromycin drug pressure at final concentrations of 15 μg/ml and 50 μg/ml, respectively. Cultures were normally maintained below a cell density of 2×10⁷/ml before lipid extraction.
Lipid extraction
Lipids were extracted according to the method of Bligh and Dyer (Bligh and Dyer, Reference Bligh and Dyer1959). To detect minor mass constituents a relatively high concentration of cells was used; when better resolution between individual molecular species peaks was desired, the sample was diluted with more solvent. Normally, 108 cells were harvested, washed twice in TDB, (25 mm KCl, 400 mm NaCl, 5 mm MgSO4, 100 mm Na2HPO4, NaH2PO4, 100 mm glucose) and resuspended in 100 μl TDB in a glass vial prior to lipid extraction. A mixture of the internal standards (50 pmoles of each, except PI which was 20 pmoles) was added prior to removal of the lower cholorform rich phase. This allowed normalization of the data obtained from the high-resolution mass spectra and to ensure correct fragmentation of individual phospholipids species.
The lipid-rich lower phase was washed by mixing it with 225 μl of upper phase from a blank sample. The resultant lower phase was transferred to a new vial and dried under nitrogen. The lipids were resuspended with chloroform/methanol (1:2 v/v) to the desired volume (10–40 μl), just prior to ESI-MS-MS analysis. The vials were centrifuged at 5000×g for 1 min. Samples were usually processed and analyzed the same day, but if short-term storage was necessary the lipids were stored dried under a nitrogen atmosphere at 4°C.
High-resolution mass spectrometry
An aliquot of the total lipid extract was analyzed with both an electrospray ionisation mass spectrometer (LCT, Micromass) and a QStar mass spectrometer (Applied Biosystems) both equipped with nanoelectrospray sources. Samples were loaded into thin-wall nanoflow capillary tips (Waters) and analyzed in both positive and negative ion mode.
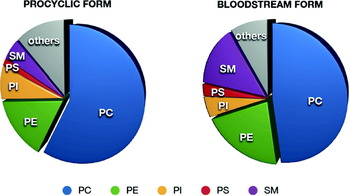
Phospholipid composition of PCF and BSF T. brucei. PC, phosphatidylcholine; PE, phosphatidylethanolamine; PI, phosphatidylinositol; PS, phosphatidylserine; SM, sphingomyelin. “Others” include: inositol phosphoceramide, phosphatidic acid, phosphatidylglycerol, cardiolipin, PIPs, lyso-PC and lyso-PE.

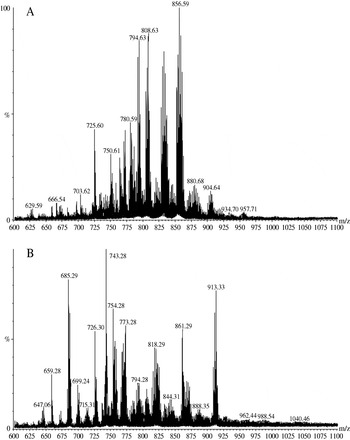
High resolution survey scans in positive (A) and negative (B) ion mode of total lipid extracts from BSF T. brucei.

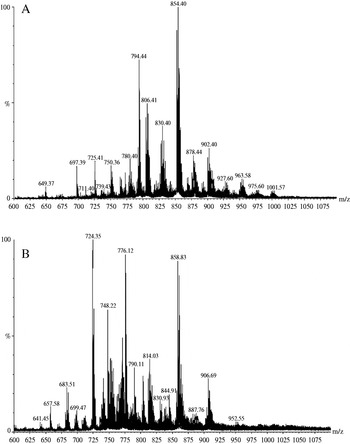
High resolution survey scans in positive (A) and negative (B) ion mode of total lipid extracts from PCF T. brucei.

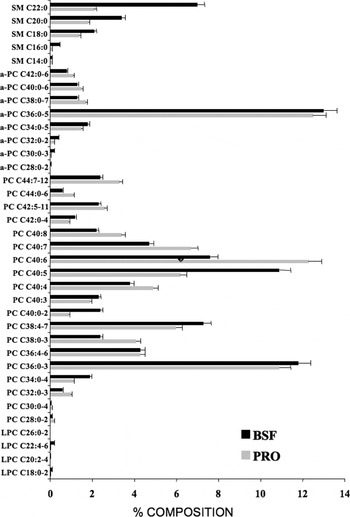
Molecular composition of choline-containing PLs in T. brucei. Precursor ion scanning for m/z 184 specifically detected [M+H]+ PC and SM ions from PCF and BSF trypanosome total lipid extracts see Figs. S1 and S2. Molecular species are plotted against their relative percentage based upon TIC, PCF (BLACK) and BSF (GREY). Peak assignments are based on MS-MS daughter ion spectra performed as stated in the Material and Methods, and each peak is annotated in Tables S1 and S2.

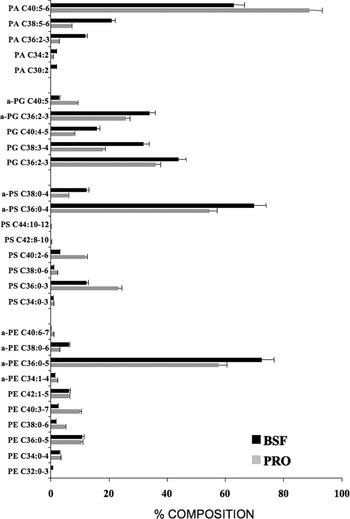
Molecular composition of PE, PS, PA and PG species in T. brucei. Precursor ion scanning for m/z 196 specifically detected [M−H]− PE ions from PCF and trypanosome total lipid extracts see Fig. S3. Molecular species are plotted against their relative percentage based upon TIC, PCF (BLACK) and BSF (GREY). Peak assignments are based on MS-MS daughter ion spectra performed as stated in the Material and Methods section, and a letter annotates each peak series, which are annotated in Tables S3–S6.

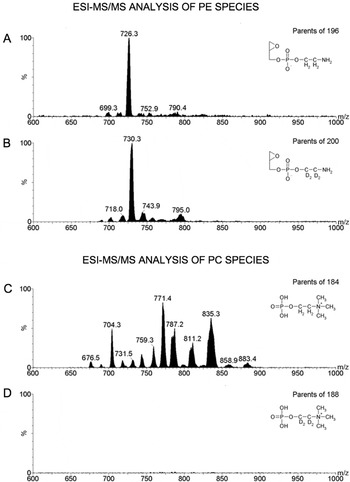
T. brucei have no N-methyltransferases capable of converting PE to PC. ESI-MS/MS spectra of the following molecular species; PE (A); (d4)-PE (B); PC (C); (d4)-PC (D), in BSF T. brucei labelled with (d4)-ethanolamine. Data were normalised to the largest peak and vertical axes linked in order to directly compare the intensities of non-deuterated vs. deuterated phospholipid species. Also shown are the molecular structures of the relevant collision-induced fragments.

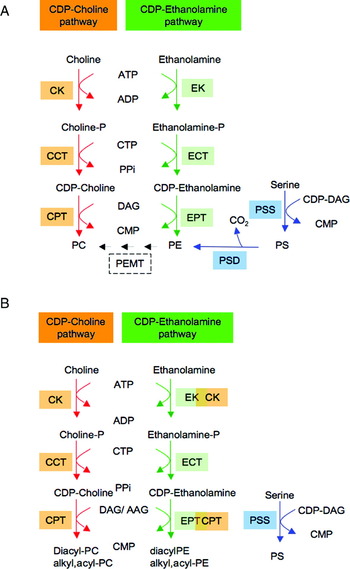
De novo synthesis of PE, PS and PC in mammals (A) and T. brucei (B). Intermediates: Cho, choline; Cho-P, phosphocholine; CDP-Cho, cytidine-diphosphocholine; PC, phosphatydylcholine; Etn, ethanolamine; Etn-P, phosphoethanolamine; CDP-Etn, cytidine-diphosphoethanolamine; PE, phosphatidylethanolamine; DAG, diacylglycerol; AAG, alkylacylglycerol. Enzymes: CK, choline kinase (Tb927.5.1140); CCT, phosphocholine cytidylyltransferase (Tb10.389.0730); CPT, choline phosphotransferase (Tb10.389.0730, Tb10.6k15.1570); EK, ethanolamine kinase (Tb11.18.0017, Tb927.5.1140); ECT, phosphoethanolamine cytidylyltransferase (Tb11.01.5730); EPT, ethanolamine phosphotransferase (Tb10.389.01-40, Tb 10.6k15.1570); PSD, phosphatidylserine decarboxylase (Tb09.211.1610); PSS, phosphatidylserine synthase.

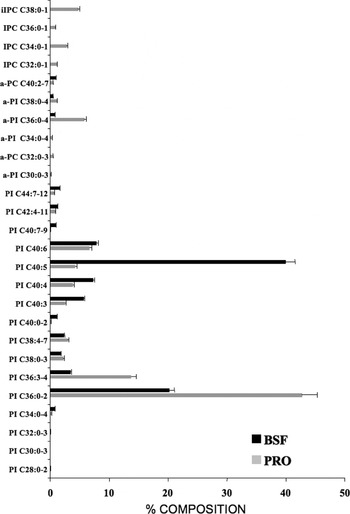
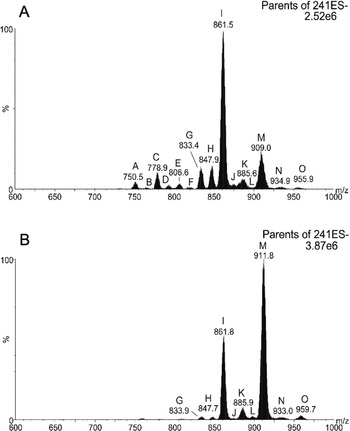
Molecular composition of inositol-containing PLs in T. brucei. Precursor ion scanning for m/z 241 specifically detected [M−H]− PI and IPC ions from PCF and BSF trypanosome total lipid extracts, see Fig. S5. Molecular species are plotted against their relative percentage based upon TIC, PCF (BLACK) and BSF (GREY). Peak assignments are based on MS-MS daughter ion spectra performed as stated in the Material and Methods section, and each peak series is annotated by a letter, which are annotated in Tables S7 and S8.

Each spectrum encompasses at least 50 repetitive scans (400–2000 m/z). Spectra were processed using Micromass software; a high-resolution peak list was generated and normalized to the masses of the non-natural internal standards. Isotope ions were eliminated, i.e. due to naturally occurring 13C (1·1%). The resulting high-resolution data were normalized using the internal standards. These data have been annotated to the corresponding phospholipid species in Supplementary Tables 1–8 (see Appendix), the accurate masses correspond to the mean (±0·05 m/z) of 4 separate determinations using the two different instruments.
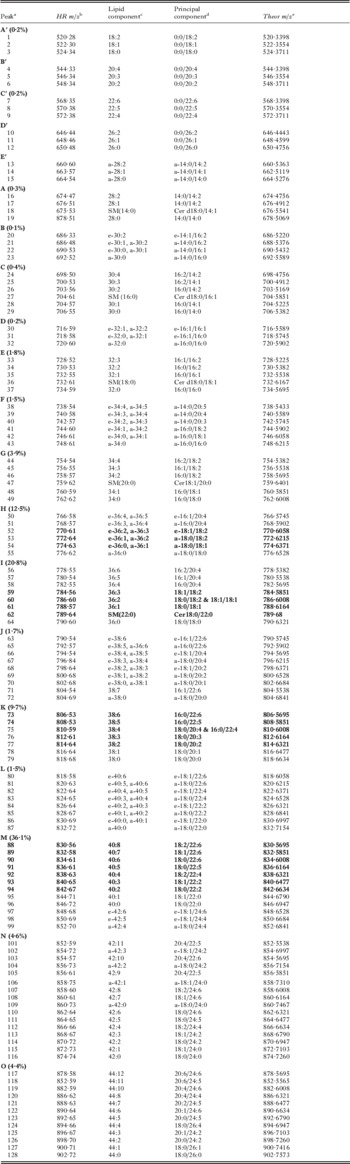
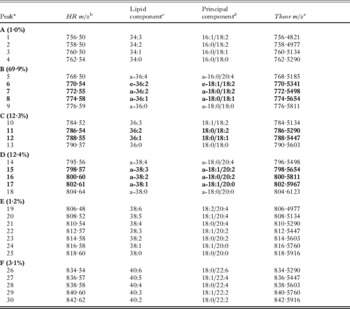
Mass spectrometry analysis of PC and SM molecular species in the procyclic form of T. brucei

a All of the molecular species detected within a series are grouped by a letter are contained within the lowest and highest mass range and refers to the corresponding peaks in Fig. 4A. The percentages in parentheses correspond to the relative percentage based upon TIC. The peaks containing the most abundant PC/SM species are in bold.
b HR [M+H]+ ions, mass over charge values (high resolution survey scan) ±0·05 m/z were obtained as described in Materials and Methods.
c Peak identities refer to total number of carbon atoms and double bonds. e=plasmenyl (alkenylacyl); a=plasmanyl (alkylacyl).
d Precise fatty acyl constituents and their positions are not discernable in positive ion mode; however, where possible, the most likely fatty acid candidates for the sn-1 and sn-2 constituents of the molecular species presented were deduced from the available literature. Only the principal component is given, in some instances as many as 5 individual species, with different combinations of acyl chains result in the same total number of carbon atoms and double bonds.
e Theoretical monoisotopic masses were obtained were possible for LIPIDMAPS, otherwise they were calculated using http://www.sisweb.com/referenc/tools/exactmass.htm.
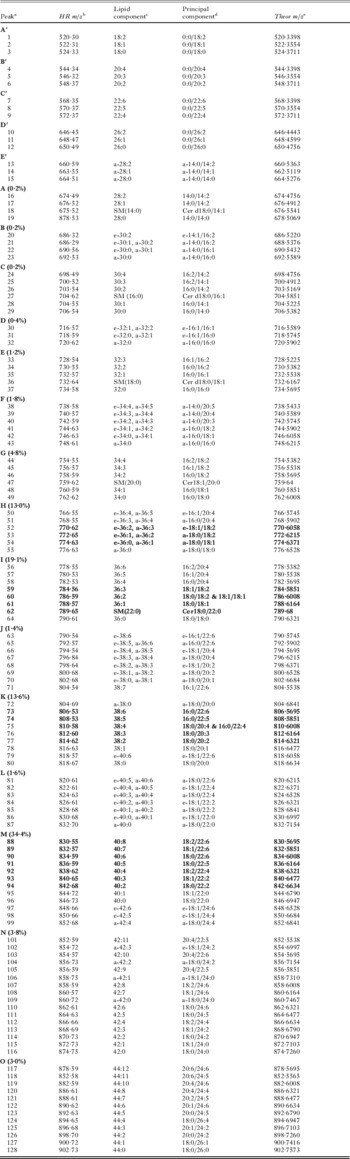
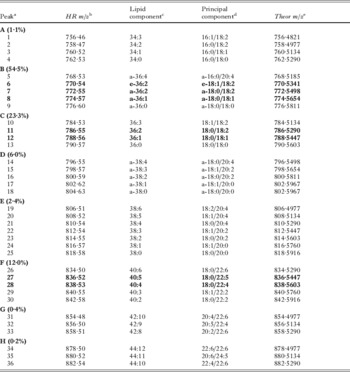
Mass spectrometry analysis of PC and SM molecular species in the bloodstream form of T. brucei

a All of the molecular species detected within a series are grouped by a letter are contained within the lowest and highest mass range and refers to the corresponding peaks in Fig. 4B. The percentages in parentheses correspond to the relative percentage based upon TIC. The peaks containing the most abundant PC/SM species are in bold.
b As in Table S1.
c As in Table S1.
d As in Table S1.
e As in Table S1.
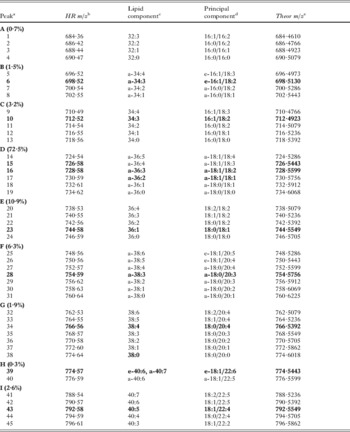
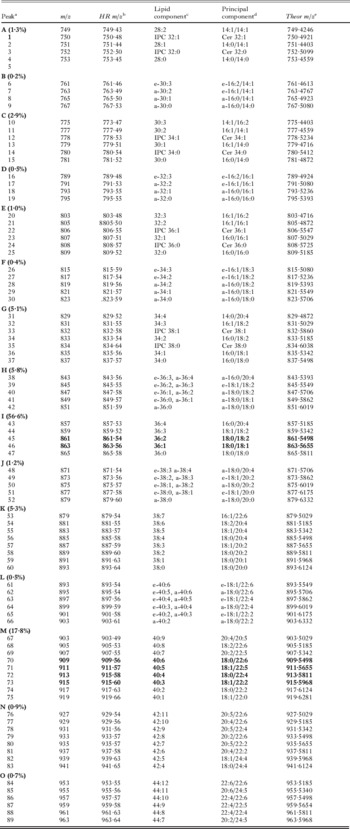
Mass spectrometry analysis of PE molecular species in procyclic T. brucei

a All of the molecular species detected within a series are grouped by a letter are contained within the lowest and highest mass range and refers to the corresponding peaks in Fig. 5A. The percentages in parentheses correspond to the relative percentage based upon TIC. The peaks containing the most abundant PE species are in bold.
b HR[M−H]− ions mass over charge values (high resolution survey scan) ±0·05 m/z were obtained as described in Materials and Methods. (high resolution survey scan) ±0·05 m/z were obtained as described in material methods.
c As in Table S1.
d Precise fatty acyl sn-1 and sn-2 constituents were deduced from daughter ion scanning, only the principal component is given, in some instances there are as many as 5 individual species, with different combinations of acyl groups, resulting in the same total number of carbon atoms and double bonds.
e As in Table S1.
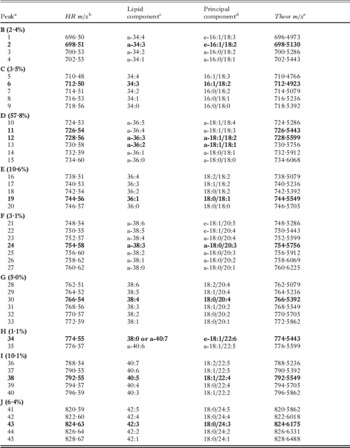
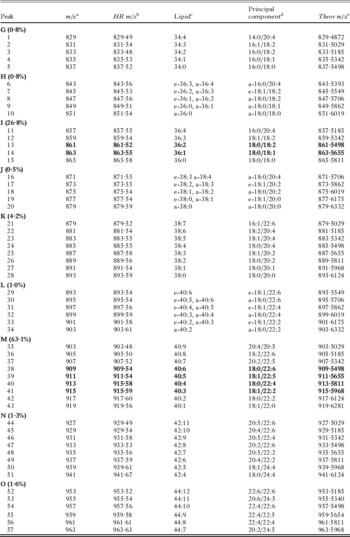
Mass spectrometry analysis of PE molecular species in bloodstream T. brucei
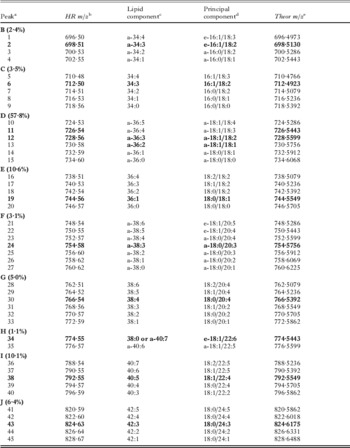
a All of the molecular species detected within a series are grouped by a letter are contained within the lowest and highest mass range and refers to the corresponding peaks in Fig. 5B. The percentages in parentheses correspond to the relative percentage based upon TIC. The peaks containing the most abundant PE species are in bold.
b As in Table S3.
c As in Table S1.
d As in Table S3.
e As in Table S1.
Mass spectrometry analysis of PS molecular species in procyclic T. brucei

a All of the molecular species detected within a series are grouped by a letter are contained within the lowest and highest mass range and refers to the corresponding peaks in Fig. 7A. The percentages in parentheses correspond to the relative percentage based upon TIC. The peaks containing the most abundant PS species are in bold.
b As in Table S3.
c As in Table S1.
d As in Table S3.
e As in Table S1.
Mass spectrometry analysis of PE molecular species in bloodstream T. brucei

a All of the molecular species detected within a series are grouped by a letter are contained within the lowest and highest mass range and refers to the corresponding peaks in Fig. 7B. The percentages in parentheses correspond to the relative percentage based upon TIC. The peaks containing the most abundant PS species are in bold.
b As in Table S3.
c As in Table S1.
d As in Table S3.
e As in Table S1.
Mass spectrometry analysis of PI molecular species in procyclic T. brucei

a All of the molecular species detected within a series are grouped by a letter are contained within the lowest and highest mass range and refers to the corresponding peaks in Fig. 8A. The percentages in parentheses correspond to the relative percentage based upon TIC. The peaks containing the most abundant PI species are in bold.
b As in Table S3.
c As in Table S1.
d As in Table S3.
e As in Table S1.
Mass spectrometry analysis of PI molecular species in bloodstream T. brucei

a All of the molecular species detected within a series are grouped by a letter are contained within the lowest and highest mass range and refers to the corresponding peaks in Fig. 8B. The percentages in parentheses correspond to the relative percentage based upon TIC. The peaks containing the most abundant PI species are in bold.
b As in Table S3.
c As in Table S1.
d As in Table S3.
e As in Table S1.
Nano-electrospray ionization tandem mass spectrometry (nano-ESI-MS-MS)
An aliquot of total lipid extract was analyzed with a Micromass Quattro Ultima triple quadrupole mass spectrometer equipped with a nanoelectrospray source. Samples were loaded into thin-wall nanoflow capillary tips (Waters) and analyzed by ESI-MS-MS in both positive (for phosphatidylcholine (PC), sphingomyelin (SM), phosphatidylserine (PS) and phosphatidylethanolamine (PE)), and negative ion mode (for PI, phosphatidylglycerol (PG), phosphatidic acid (PA), PS and PE). Capillary/cone voltages were 0·7 kV/50 V and 0·9 kV/50 V for positive ion and negative ion modes, respectively. Tandem mass spectra (MS-MS) were obtained using argon as the collision gas (~3·0 mTorr) with collision offset energies as follows: 35 V, PC in positive ion mode; 25 V, PE in positive ion mode; 22 V, PS in positive ion mode; 50 V, PE in negative ion mode; 28 V, PS in negative ion mode; 45 V, PI in negative ion mode; and 50 V, all glycerophospholipids detected by precursor scanning for m/z 153 in negative ion mode. MS-MS daughter ion scanning was performed with a collision-offset energy of 35 V. In positive ion mode, ions in the PC, PE, and PS spectra were annotated based on their [M+H-NMe3]+ for PC, and the corresponding fragment ions [M-140] and [PA-H] daughter ions for PE and PS respectively, and compared with that of their theoretical values. In negative ion mode, PL class peaks were assigned according to their [lyso-H]−, [lyso-H20-H]−, [lysoPA-H]−, or [lysoPA-H20-H]− daughter ion derivatives. FAs were assigned based on their [M−H]− values. Saturated and unsaturated FAs were assumed to be esterified to the sn-1 and sn-2 position of PLs, respectively. Each spectrum (600–1000 m/z) encompasses at least 50 repetitive scans, each of 4 s duration. Spectra were normally processed by subtraction of background and smoothed using Micronass processing algorithms unless otherwise indicated. The internal standards were used to ensure efficient ionization and fragmentation and as a control for sample variability.
Stable isotope labeling of bloodstream form T. brucei
2·5×107T. brucei bloodstream-form cells at a density of 0·5×106 cells/ml were incubated overnight at 37°C in HMI-9 media supplemented with 1 mm d4-Etn. Total lipids were extracted and processed using a nano-ESI-MS-MS as described earlier. [M−H]− adducts of unlabelled PE and (d4)-labelled PE were monitored by parent ion scanning for m/z 196 and 200, respectively. [M+H]+ adducts of unlabelled PC and (d4)-labelled PC were monitored by parent ion scanning for m/z 184 and 188, respectively.
RESULTS AND DISCUSSION
Phospholipid composition
Quantification of the phospholipids in bloodstream and procyclic T. brucei shows the most abundant glycerophospholipid classes are PC and PE representing 45–60% and 10–20%, while PI, PS, PG and CL represent minor glycerophospholipid classes (Fig. 1). These values compare well with previous quantifications of phospholipids in T. brucei (Patnaik et al. Reference Patnaik, Field, Menon, Cross, Yee and Butikofer1993). T. brucei also contain sphingolipids, such as sphingomyelin (SM), inositol phosphorylceramide (IPC) and ethanolamine phosphorylceramide (10–15% in total).
High-resolution mass spectra were collected both in positive and negative ion mode for BSF and PCF T.brucei total lipid extracts (Figs 2 and Fig. 3, respectively). In the positive ion mode, ions represents [M+H]+ and [M+Na]+ of PC, SM and to a minor extent PE and PS species, while in the negative ion mode, ions represent [M−H]− of PI, PE, PS, PG and PA species. Peak lists from these data were normalized using the added non-natural internal standards. After averaging, these data were used to clarify some of the phospholipid identities given in Tables S1–S8 (see Appendix). ESI-MS-MS was also employed to separate and characterize the major PL classes and their molecular species from total lipid extracts of T. brucei. Together these two sets of data allow the identity of ~500 individual molecular phospholipid species to be determined.
Fatty acid composition of PL
Analysis of the acyl content of the various phospholipids suggests that the intrinsic acyl-CoA specificity of the acyltransferases involved in diacyl and ether-linked phospholipid de novo synthesis and the availability of de novo synthesised acyl-CoAs are major factors in producing the final molecular composition of the phospholipids species. The major ether-linked PE and PC species and the diacyl linked PC, PE, PI and PS species contain almost exclusively sn-1 C18:0. This implies both the acyltransferases that service dihydroxyacetone-phosphate and glycerol-3-phosphate have either a specificity for C18:0-CoA or are exposed exclusively to C18:0-CoA. The sn-2 position of these lipid species are almost exclusively unsaturated acyl groups, with ether-linked lipids containing predominately C18:2, while diacyl lipids contain mainly C18:2 and C22:4, with minor C20:4.
In T. brucei procyclic forms, the relative amounts of diacyl glycerophospholipids containing highly unsaturated fatty acyl chains showed a decrease compared to bloodstream forms, in the order of PC>PE>>PI. T. brucei parasites also contain significant proportions of sn-1 ether-linked glycerophospholipids, especially in PE (73–84%) and PS (60–88%).
Choline PL composition
In positive ion mode, [M+H]+ ions of PC and SM are detected by colliding ions with argon to create various fragment ions and, in the case of choline-containing PLs like PC and SM, an intense m/z 184 fragment is produced. Thus, a positive ion precursor scan for m/z 184 detects all PC and SM [M+H]+ ions and their natural isotopes, each represented as a m/z signal in a spectrum. Colliding ions from the mono-isotopic signals produces specific daughter ion fragments which are used to correctly assign the m/z signal to a molecular species that contains a certain number of FA carbons and which have an associated degree of unsaturation. In positive ion mode, individual FAs cannot be discerned and thus the FA moiety is represented as a sum of FAs in the form x:y, where ‘x’ is the total number of FA carbons and ‘y’ is total number of double bonds in both FA chains. As portrayed in this report, a peak in the spectrum consists of a series of molecular species of a particular class of PL with the same number of carbon atoms, but with different masses due to heterogeneity in their state of unsaturation.
The pool of PC and SM lipids in both PCF and BSF lipid extracts of T. brucei is comprised of numerous molecular species (Fig. S1 A and B, respectively, see Appendix). Annotation of these species is provided in Tables S1 and S2, respectively. Analysis of the ions in the spectra (Fig. 4) revealed that the T. brucei PC pool contains molecular species from both the diacyl and ether PL subclasses. The ratio between diacyl and ether PC in both PCF and BSF cells was roughly 3:1. These subclasses of phospholipids in T. brucei, as with other eukaryotes, are defined by their sn-1 fatty acyl bond and are referred to as either one of the following types: (1) diacyl; (2) plasmanyl (a, alkylacyl); or (3) plasmenyl/plasmalogen (e.g. alkenylacyl). It is important to note that, in both life cycle stages, for nearly every diacyl PC series there appears to be an alkylacyl/alkenylacyl PC counterpart. These results contrast with those from a previous study, which reported that the only ether-linked PC species in BSF T. brucei was PC (e/a-36:2 – reported as e/a-18:0/18:2, Patnaik et al. Reference Patnaik, Field, Menon, Cross, Yee and Butikofer1993). PC (e/a-18:/18:2) is indeed the most abundant ether PC in BSF trypanosomes, but heterogeneity does exist since e/a-PC with other FA chain lengths were detected. A drawback to identifying PLs by ESI-MS-MS is that it is not possible to differentiate between alkyl and alkenyl sn-1 linkages in many instances without their prior chromatographic separation. For instance, an ether-linked a-18:1 and a vinyl ether-linked e-18:0 possess equivalent masses. For the m/z 822 PC species in Table S1 (see Appendix), for example, the presence of sn-2 22:4 with ether-linked e/a-18:y could therefore indicate the existence of two species with identical masses, PC (a-18:1/22:4) and/or PC (e-18:0/22:4).
Relative molar composition of PC molecular species was calculated by integrating the relative area of the peaks of each series. Such percent composition analysis showed that, in BSF trypanosomes for instance, the four main series in the PC spectrum comprised 34·4%, 19·1%, 13·6%, and 13·0% of total PC in the cell, and they originated from signals in the 40:y, 36:y, 38:y, and e/a-36:y series, respectively (Fig. 4, Table S2, Appendix). The major peak areas from these series are mostly comprised of the following species of PC: m/z 834, 40:6; m/z 836, 40:5; m/z 838, 40:4; m/z 786, 36:2; m/z 788, 36:1; m/z 790, 36:0; m/z 810, 38:4; m/z 812, 38:3; m/z 814, 38:2; m/z 774, a-36:1 and/or e-36:0; m/z 772, a-36:2 and/or e-36:1. Analysis of the spectra also revealed that T. brucei possesses PC (42:y) and PC (44:y), unusual species that most likely contain long-chain polyunsaturated FAs (PUFAs) and highly unsaturated FAs (HUFAs) at the both the sn-1 and sn-2 positions (Fig. S4, peaks N and O). The most abundant PUFAs and HUFAs in T. brucei, whose combinations could mostly satisfy the FA requirements in PC (42:y) and PC (44:y), are 22:4, 22:5, 22:6, 20:2, 20:3, 20:4, and 20:5 (Fig. 4). It is also possible that the FA 24:1 may be a constituent of these species as this FA has been reported to exist in PLs of T. brucei [20]. PC (42:y) and PC (44:y) have not been detected before in T. brucei but they have been noted in another kinetoplastid, Leishmania major (Zufferey et al. Reference Zufferey, Allen, Barron, Sullivan, Denny, Almeida, Smith, Turco, Ferguson and Beverley2003; Denny et al. Reference Denny, Goulding, Ferguson and Smith2004).
Comparisons of the PC profile from PCF and BSF total lipid extracts (Fig. 4) showed that there were minor alterations in the prominence of FA unsaturation states in some series. For instance, analysis from a multitude of runs (>8) showed that the PC (40:6) signal in PCF cells was consistently more intense than the PC (40:5) signal, whereas in BSF cells the situation is reversed (see Figs 4, S4A and B, and compare Tables S1 and S2, Appendix). A similar pattern was observed for the PC (44:n) species.
It is noteworthy that the relative amounts of SM in PCF cells is significantly lower compared to the SM levels in BSF cells (Figs 1 and 4). This is observed by comparing peaks C, E, and G in the BSF and PCF spectra (Figs S4A and B, respectively Appendix). This is due in part to the ceramide which is normally used in conjunction with PC to form SM, by the sphingomyelin synthases, is now also being used to form inositol phosphoceramide (IPC) from PI in PCF trypanosomes (Fridburg et al. Reference Patnaik, Field, Menon, Cross, Yee and Butikofer2008; Sutterwala et al. Reference Patnaik, Field, Menon, Cross, Yee and Butikofer2008).
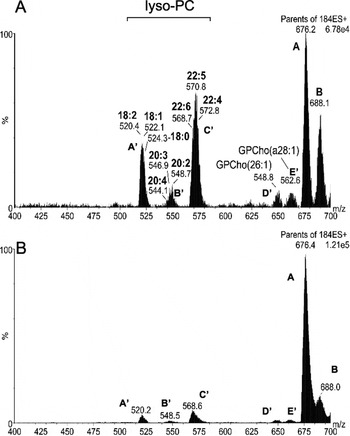
Another PL component in T. brucei membranes is lyso-PC, which is synthesized from the action of a novel phospholipase A1 in this organism (Richmond and Smith, Reference Richmond and Smith2007a, Reference Richmond and Smithb). Detection of lyso-PC was achieved only after restricting the scanned mass range in the 184 m/z precursor ion scans to exclude the mass range in which the major PC ions fall (Fig. S2). Analysis of the lyso-PC spectra revealed distinct lyso-PC species (Fig. 4); the most abundant species contain one of the following sn-2 FA constituents: 18:0, 18:1, 18:2, 20:2, 20:3, 20:4, 22:4, 22:5 and 22:6. The levels of lyso-PC are higher in BSF than in PCF trypanosomes. Also, PCF cells appeared to contain more lyso-PC (-/22:6), whereas the major BSF lyso-PC species was (-/22:5).
PE composition
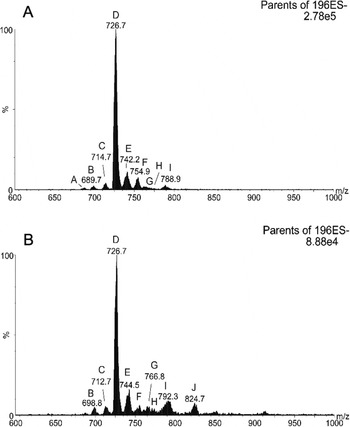
In negative ion mode, ions of PI, PA, PG, PS and PE species are efficiently detected. Collision-induced dissociation of PLs containing an ethanolamine-phosphate head group produces a unique fragment ion of m/z 196, and precursor scanning for this ion from total lipids extracted from PCF and BSF cells selectively detected [M−H]− ions of PE (Figs S6A and B, annotated species in Tables S3 and S4, respectively). The striking feature about this class of phospholipid is the dominating presence of the ether PE series e/a-36:y (Fig. 5). The principal signal within this series specifically represents the m/z 726 [M−H− ion (Figs S6A and B, Appendix). From daughter ion scanning the species was deduced to be PE (e-18:1/18:2) instead of either PE (a-18:0/18:3) or PE (a-18:1/18:2); this result is consistent with the previous finding that there is 2–4 times as much alkenylacyl PE than alkylacyl PE in T. brucei (Patnaik et al. Reference Patnaik, Field, Menon, Cross, Yee and Butikofer1993). As with PC, it was originally reported that 100% of all the alkylacyl and alkenylacyl PE in BSF T. brucei was from just one molecular species, PE (e/a-18:0/18:2), which is certainly by far the major species. However, daughter ion scanning of the PE spectra ions from the ESI-MS-MS method revealed multiple ether lipid species in both the PCF and BSF parasite stages (Fig. 5 and annotated in Tables S3 and S4 respectively).
The relative abundance of diacyl PE in BSF cells is slightly higher than in PCF cells (36% vs. 19%, respectively). This is most likely due to the increased availability of host PUFA resulting in PE species with longer acyl chains, particularly the 40:y and 42:y series (Fig. 5).
PE can also be detected in positive ion mode by scanning for the neutral loss of m/z 141. However, the results from negative mode give more accurate reflections of the true abundances of ether PE series (Brugger et al. Reference Brugger, Erben, Sandhoff, Wieland and Lehmann1997). This is also true for T. brucei where ether PE species in PCF and BSF parasites make up 81% and 64% of total PE in the cell, respectively; these values correlate well with those obtained previously (Patnaik et al. Reference Patnaik, Field, Menon, Cross, Yee and Butikofer1993). However, in positive ion mode, the m/z 141 neutral loss scans show the combined relative abundances of all the diacyl species (>87%) far exceeded that of all the ether lipid species (data not shown), thus giving an inaccurate reflection of the true PE status of a T. brucei cell, and confirming that analyzing PE in negative ion mode is preferable.
PE cannot be converted into PC in T. brucei
PC and PE are the two major phospholipid classes in eukaryotic cells and their metabolism is highly interconnected. They are both synthesised de novo through branches of the Kennedy pathway (Kennedy and Weiss, Reference Kennedy and Weiss1956; Kanfer and Kennedy, Reference Kanfer and Kennedy1963; recently reviewed in Gibellini and Smith, Reference Gibellini and Smith2010). PE can also be converted into PC by three subsequent SAM dependent methylations of the ethanolamine headgroup. However, in T. brucei the methyltransferase genes could not be found (http://www.tritrypdb.org). This surprising absence of PE methylation was experimentally confirmed by stable isotope labelling of bloodstream-form T. brucei with the PE precursor d4-ethanolamine followed by analysis of PE and PC molecular species by ESI-MS/MS (Fig. 6).
PE and PC that incorporate the deuterium-labelled ethanolamine can be easily distinguished from their non-labelled counterparts because they produce fragments at higher m/z: 200 m/z for the deuterated ethanolamine-phosphate-glycerol-H2O instead of 196 m/z and 188 m/z for the deuterated phosphocholine instead of 184 m/z in positive ion mode (Figs 6 A–D respectively).
The d4-ethanolamine is readily taken up by the parasite by an as yet unknown transporter, and incorporated into d4-PE, and its molecular species profile is virtually super-imposable with the one of the unlabelled PE (Fig. 6A and B). However, the complete absence of d4-PC species (Fig. 6D), demonstrates that there is no conversion of d4-PE to d4-PC. The spectrum including the cellular species of PC is shown in Fig. 6C as a comparison. This indicates that there is no methylation of PE under these conditions, thus all T. brucei choline is scavenged from its host, and thus they are auxotropic for choline. Given the fact that they can not take up choline, as they do not process a choline transporter (experimentally verified with radio- and stable-isotope labelled choline, T. K. Smith, unpublished observations), suggests that all T. brucei choline comes from endocytosed choline containing phospholipids such as PC, lyso-PC and SM, some of which (probably a large proportion) will be endocytosed as low density lipoprotein particles (Overath and Engstler, Reference Overath and Engstler2004).
A search in the genomic database for trypanosomatid pathogens, the Tri-TrypDB (http://tritrypdb.org/), revealed that the PE N-methyltransferase genes are also absent in T. cruzi, but are present in Leishmaina species; their presence has been experimentally confirmed in Leishmania major (T. K. Smith, unpublished observation), while in Plasmodium falciparum they have plant-like N-methyltransferase genes (Pessi et al. Reference Pessi, Choi, Reynolds, Voelker and Mamoun2005).
PS composition
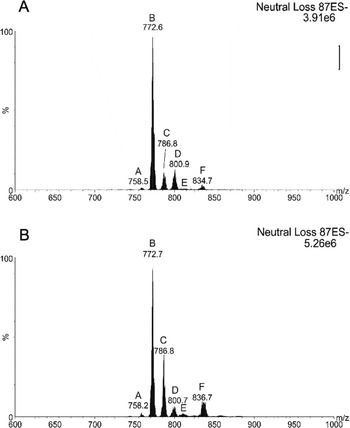
The molecular composition of PS species in T. brucei has not been determined before, but it accounts for ~3% of the total PL in T. brucei. Scanning for a neutral loss of m/z 87 from collision-induced dissociation of ions in negative mode specifically identifies PS molecules (Figs S4 A and B, Appendix). The PS pool in PCF and BSF T. brucei contains a variety of diacyl and ether molecular species (Tables S5 and S6 respectively, see Appendix), the latter of which is 60–77% in the alkylacyl subclass (Fig. 5). The most intense signal stems from m/z 772 (Figs. S4 A and B), which represents the [M−H]− ion of PS (a-18:0/18:2). Nearly a quarter (~24%) of all PS species are of the diacyl series 36:y in BSF trypanosomes but this level is decreased to ~12% in PCF cells (Fig. 5), along with a significant decrease in the amount of series 40:y, probably due to a lack of host PUFA as discussed for the PE species. These two observed differences probably account for most of the increase in diacyl PS in BSF compared to PCF trypanosomes (Patnaik et al. Reference Patnaik, Field, Menon, Cross, Yee and Butikofer1993).
PS can also be detected in positive ion mode by scanning for the neutral loss of m/z 185. Performing this scan from total lipids in BSF and PCF parasites revealed more molecular species of PS than did the m/z 87 neutral loss scan (data not shown). However, as with the alternative PE scan, the intensities of the diacyl and ether PE signals did not match the known abundances of those subclasses. Ether PS makes up 81–88% and 61% of all PS in PCF and BSF cells, respectively (Fig. 5), but the neutral loss m/z 185 scan in the BSF, for example, only showed a cumulative ether PS content of approximately 10% of total PS (data not shown).
PE cannot be formed by decarboxylation of PS in BSF T. brucei
A possible alternative route to the Kennedy pathway for the biosynthesis of PE is the decarboxylation of PS. The contributions of the two pathways to the cellular pattern of PE are organism and cell-type dependent. PS decarboxylation is actually the sole route for PE biosynthesis in E. coli (Kanfer and Kennedy, Reference Kanfer and Kennedy1963) and the major one in S. cerevisiae, although in yeast the Kennedy pathway is also active (Dowhan, Reference Dowhan1997). In mammalian cells, the relative contributions of these pathways to PE formation is cell-type dependent, with PS decarboxylation prevailing in BHK21 and CHO cells and the Kennedy pathway prevailing in most mammalian tissues, and cultured glioma cells (Vance, Reference Vance2008) (Fig. 7A).
The relative contribution of the PS decarboxylation pathway to PE in BSF T. brucei has been assessed by us using stable isotope labelling, with d3-serine and subsequent analysis by ESI-MS/MS (Gibellini et al. Reference Gibellini, Hunter and Smith2009). The d3-serine is readily incorporated into d3-PS, but it was unable to form any d3-PE from d3-PS via decarboxylation – thus highlighting the importance of the Kennedy pathway in the biosynthesis of PE in bloodstream-form T. brucei (Gibellini et al. Reference Gibellini, Hunter and Smith2008). This was confirmed by the genetic validation, via a conditional knockout, of the ECT gene in which PS decarboxylation was not unregulated to compensate for the loss of the de novo synthesized PE (Gibellini et al. Reference Gibellini, Hunter and Smith2009). These findings are in contradiction with previous work (Menon et al. Reference Menon, Eppingerl, Mayor and Schwarz1993; Rifkin et al. Reference Rifkin, Strobos and Fairlamb1995), which indicated that bloodstream form T. brucei was able to synthesise PE from PS via decarboxylation. This difference may be due to variations in the experimental conditions, while the stable-isotope labelling experiments were conducted under steady-state conditions with ample levels of serine, the radiolabelling experiments were conducted over a short period of time (1 hour), as well as in serine-free media, which may trigger differential usage of the sparingly available serine which is also required for protein synthesis. One also has to consider if the freshly synthesised PS will be decarboxylated preferentially over the pre-existing pool of PS, and if it is in the correct cellular location, i.e. available to the PS decarboxylase.
Despite our lack of observable PS decarboxylase activity, preliminary results from the laboratory suggest that the putative T. brucei PS decarboxylase gene (Tb09.211.1610) appears to be essential in the bloodstream form of the parasite (T. K. Smith, unpublished observations).
In procyclic forms, decarboxylation of PS to PE occurs to a limited extent but it is insufficient to compensate for the disruption of the CDP-ethanolamine branch of the Kennedy pathway (Signorrell et al. Reference Signorell, Rauch, Jelk, Ferguson and Bütikofer2008). Together, these findings raise the question, what is the role/function of the PS decarboxylase? Possibly it is highly regulated and/or has a very specific, but as yet unknown function.
The absence of the PE methylation pathway and the irrelevance of PS decarboxylation as a contributor to the steady-state molecular composition of PE, indicate that phospholipid metabolism and its regulation are different and less complex in BSF T. brucei (Fig. 7), than in higher eukaryotes including man. T. brucei selectively carries out PC and PE formation via the CDP-choline and CDP-ethanolamine branches of the Kennedy pathway (Gibellini et al. Reference Gibellini, Hunter and Smith2008), whereas in yeast, PC and PE are synthesised primarily by PE methylation and PS decarboxylation (Carman and Han, Reference Carman and Han2009); that is, pathways involving CDP-DAG. Also, in mammalian cells, PS decarboxylation is a major route for PE biosynthesis (Vance, Reference Vance2008) and PE methylation activity is abundant in hepatocytes (Walkey et al. Reference Walkey, Yu, Agellon and Vance1998). The less convoluted interconnections between phospholipid biosynthetic pathways make the African trypanosome a desirable system for studying lipid metabolism and the fluxes required to maintain lipid homeostatis (Fig. 7B). At the same time the absence of alternative ‘salvage’ routes for the biosynthesis of PC and PE renders both branches of the Kennedy pathway attractive potential drug targets. Recently we have genetically validated the ethanolamine branch of the Kennedy pathway as a drug target (Gibellini et al. Reference Gibellini, Hunter and Smith2009), and preliminary data on genetic validation of the choline kinase (Young, Gibellini and Smith, unpublished observations), suggests the choline branch of the Kennedy pathway could also be successfully targeted.
Inositol PL composition
PI molecular species were detected from precursor ion scanning for m/z 241 in negative ion mode (Fig. S5A and B, Tables S7 and S8, see Appendix). There are significant differences in the inositol PL composition of PCF and BSF trypanosomes (Fig. 8). In PCFs, the largest peak area is composed of molecular species in the 36:y series of PI whereas in BSFs it is the 40:y series. Daughter ion scanning showed that the 40:y series is mostly made up of PI (18:0/22:4–22:6). The significant decline of these molecular species in PCF cells could reflect the significant decrease in demand to synthesise glycosylphosphatidylinositol in this form of the parasite compared to BSF cells, as well as the formation of inositol phosphoceramide (IPC) in PCF, which varies in amounts from 5–15% of total inositol PLs (Fig. 8). Furthermore, diacyl and ether PI species containing shorter FAs were present in PCF PI (Fig. S5A and B, Tables S7 and S8, see Appendix), whereas these molecular species and IPC were not detected in the BSF analysis.
It was previously thought that BSF trypanosomes only contained diacyl PI (Patnaik et al. Reference Patnaik, Field, Menon, Cross, Yee and Butikofer1993), but the data generated from this study showed that the diacyl subclass constitutes 80% and 90% of total PI in PCF and BSF trypanosomes, respectively, and that ether lipids are certainly present in both PCF and BSF cells (Fig. 8).
Despite IPC being a major sphingolipid in other trypanosomatids (Kaneshiro et al. Reference Kaneshiro, Jayasimhulu and Lester1986; Bertello et al. Reference Bertello, Goncalvez, Colli and de Lederkremer1995; Uhrig et al. Reference Uhrig, Couto, Colli and de Lederkremer1996; Zhang et al. Reference Zhang, Pompey, Hsu, Key, Bandahuvula and Saba2007), and it being observed previously in PCF T. brucei (Güther et al. 2008), its role remians unclear. However, IPC has been observed at high concentrations (~50% of the total inositol PLs) in purified mitochondria (Güler et al. Reference Güler, Kriegová, Smith, Luke and Englund2006), suggesting a significant role/synthesis in this organelle. Interestly, we have also recently observed IPC formation in stumpy BSF, and this has been associated with the up-regulation of one of the four sphingomyelin synthases responsible for IPC formation (Kabani et al. Reference Kabani, Fenn, Ross, Ivens, Smith, Ghazal and Matthews2009; Milna et al. Reference Milna, Pan, Wansadhipathi, Bruce, Shams-Eldin, Schwarz, Steel and Denny2009).
Other acidic PLs
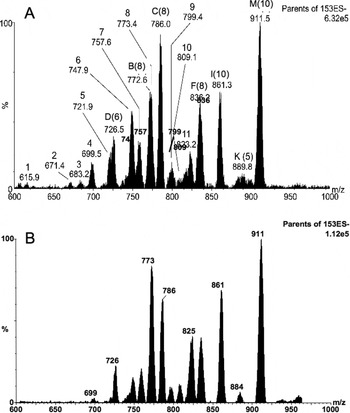
PA, which is an important molecule in protein and membrane transport, has the simplest polar headgroup (a phosphate) among the PL classes and readily forms [M−H]− ions. As in other eukaryotic cells PA is present in only modest quantities in T. brucei, and it can only be detected by precursor ion scanning for m/z 153 in negative ion mode, which detects negative ions from all glycerophospholipids (Fig. S6, see Appendix). Detection of lyso-PA [M−H]− and its associated FA ions formed from collision-induced dissociation of PA [M−H]− ions confirmed its presence among the more abundant PLs. The molecular species variation among PA appears to be very similar to the species distribution of the other PLs, and they exist as both diacyl and ether lipid subclasses (Fig. 5). As with the other PLs in T. brucei, some PA contains long-chain highly unsaturated molecular species, which by MS-MS showed to be mostly PA (16:0/22:6) (719 m/z), PA (16:0/22:5) (721 m/z), PA (18:0/22:6) (747 m/z) and PA (18:0/22:5) (749 m/z).
PG is also a minor component in both BSF and PCF T. brucei membranes and the neutral headgroup of PG precludes its specific detection but it can be most easily detected with other PLs by scanning for m/z 153 in negative ion mode (Fig. S6, see Appendix). Collision-induced decomposition of 757, 759 and 809 m/z showed that ether PG is also present in these cells. PG is also a minor component in both BSF and PCF T. brucei membranes and serves as a precursor for the synthesis of cardiolipin, which is an essential lipid component of mitochondria T. brucei membranes (Dixon and Williamson, Reference Dixon and Williamson1970) where it maintains the membrane potential. Previously we have also observed cardolipin species in purified PCF mitochondria (Güler et al. Reference Güler, Kriegová, Smith, Luke and Englund2008), along with several other phospholipids including very minor amounts of ethanolamine phosphoceramide (Sutterwala et al. Reference Sutterwala, Hsu, Sevova, Schwartz, Zhang, Key, Turk, Beverley and Bangs2008), and significant amounts of PIP2 and PIP3. (T. K. Smith, unpublished observation). These will be discussed and fully characterized in subsequent work on the lipidomes of individual organelles from T. brucei and other protozoa.
CONCLUSION
MS technology adapted to nanoflow mode has made it possible to efficiently detect all the major T. brucei PLs in one liquid sample of total lipid extract. Overall, the results presented here for the composition of diacyl PC, PE and PI agree with those obtained using older methods that were not suitable for routine analysis. In addition, we have elucidated for the first time the molecular species composition for PS, PA and PG. These analyses also show that the T. brucei PL pools exhibit greater heterogeneity in their alkylacyl and alkenylacyl species than previously thought. The most significant contrast between PCF and BSF PL composition is the inositol-containing PLs, i.e. the formation of the non-mammalian like sphingolipid IPC, in the PCF.
Though relatively little information is still known about lipid biosynthesis in T. brucei and other kinetoplastids, the remarkable variation in PL molecular species and the large quantities of HUFAs present in T. brucei PLs testify to the competency of this obligate parasite to control its own fatty acid and thus lipid composition despite being reliant upon lipid precursors from its hosts.
The simplified aminophospholipid metabolism, i.e. the lack of interconversion of PS to PE to PC, is in direct contrast to that in humans and other mammals (compare Fig. 7A and B). This puts the parasite at a distinct disadvantage, as it also appears that these de novo pathways are essential and thus contain promising drug targets. The lack of cross-talk between these de novo phospholipid pathways also makes T. brucei an ideal organism in which to study metabolic fluxes in these pathways.
ACKNOWLEDGEMENTS
We also wish to acknowledge access to the mass spectrometry facilities both at the University of St Andrews and the University of Dundee.
FINANCIAL SUPPORT
Research in the author's laboratory is supported in part by a Wellcome Trust Senior Research Fellowship (067441), and Wellcome Trust project grant (086658) and studentships from the Wellcome Trust, BBSRC and SUSLA.
ABBREVIATIONS
- PC
phosphatidylcholine
- PE
phosphatidylethanolamine
- PS
phosphatidylserine
- PI
phosphatidylinositol
- PA
phosphatidic acid
- PG
phosphatidylglycerol
- lyso-PC
lysophosphatidylcholine
- IPC
inositol phosphoceramide
- SM
sphingomyelin
- PL
phospholipid
- FA
fatty acid
- PCF
procyclic form
- BSF
bloodstream form
Appendix 1. SUPPLEMENTARY DATA
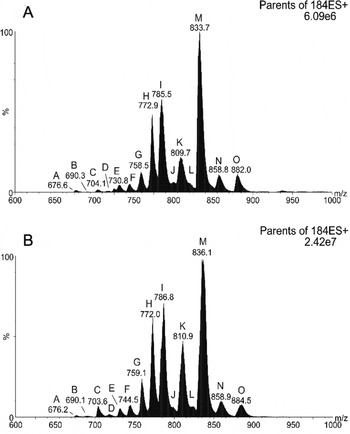
ESI-MS-MS positive ion spectra of choline-containing PLs in T. brucei. Precursor ion scanning for m/z 184 specifically detected [M+H]+ PC and SM ions from PCF (A) and BSF (B) trypanosome total lipid extracts. Peaks are plotted as their relative percent intensity (%) of the largest peak in the spectrum, and as a function of their mass/charge values (m/z). Peak assignments are based on MS-MS daughter ion spectra performed as stated in Material and Methods, and each peak series is annotated by a letter, which are annotated in Tables S1 and S2.

ESI-MS-MS positive ion spectra of lyso-PC in T. brucei. Precursor ion scanning for m/z 184 specifically detected [M+H]+ lyso-PC ions from BSF (A) and PCF (B) trypanosome total lipid extracts. Peaks are plotted as their relative percent intensity (%) of the largest peak in the spectrum, and as a function of their mass/charge values (m/z). The major lyso-PC signals were annotated based on their m/z value and MS-MS daughter ion spectra performed as stated in Material and Methods, and each peak series is annotated by a letter, which are annotated in Tables S1 and S2.

ESI-MS-MS negative ion spectra of PE in T. brucei. Precursor ion scanning for m/z 196 specifically detected [M−H]− PE ions from PCF (A) and BSF (B) trypanosome total lipid extracts. Peaks are plotted as their relative percent intensity (%) of the largest peak in the spectrum, and as a function of their mass/charge values (m/z). Peak assignments are based on MS-MS daughter ion spectra performed as stated in the Material and Methods, and each peak series is annotated by a letter, which are annotated in Tables S3 and S4.

ESI-MS-MS negative ion spectra of PS in T. brucei. Neutral loss scanning for m/z 87 specifically detected [M−H]− PS ions from PCF (A) and BSF (B) trypanosome total lipid extracts. Peaks are plotted as their relative percent intensity (%) of the largest peak in the spectrum, and as a function of their mass/charge values (m/z). Peak assignments are based on MS-MS daughter ion spectra performed as stated in Material and Methods, and each peak series is annotated by a letter, which are annotated in Tables S5 and S6.

ESI-MS-MS negative ion spectra of inositol-containing PLs in T. brucei. Precursor ion scanning for m/z 241 specifically detected [M−H]− PI and IPC ions from PCF (A) and BSF (B) trypanosome total lipid extracts. Peaks are plotted as their relative percent intensity (%) of the largest peak in the spectrum, and as a function of their mass/charge values (m/z). Peak assignments are based on MS-MS daughter ion spectra performed as stated in Material and Methods, and each peak series is annotated by a letter, which are annotated in Tables S7 and S8.

ESI-MS-MS negative ion spectra revealing PA and PG molecular species in T. brucei. Precursor ion scanning for m/z 153 in negative ion mode with a collision offset energy of 50 V specifically detected [M−H]− ions from glycerophospholipids in a total lipid extract from PCF (A) and BSF (B) trypanosome total lipid extracts. (upper panel). Peaks are plotted as their relative percent intensity (%) of the largest peak in the spectrum, and as a function of their mass/charge values (m/z). Fatty acid assignments are based on the most intense fatty acid signals in the MS-MS daughter ion spectra (lower panel). Saturated fatty acids were assumed to be in the sn-1 position. Peaks labeled with a letter refer to the peak series that describes it in previous figures, to which the number in parentheses refers. Since each class of PL is detected with different optimal offset collision efficiencies, the PL class peaks in this spectrum do not accurately represent their true abundance in the cell relative to other PL classes. e=alkenyl; a=alkyl.