1. Introduction
The Central Asian Orogenic Belt (CAOB) is a giant tectonic collage between the Siberian Craton and North China–Tarim cratons (Sengör, Natal'in & Burtman, Reference Sengör, Natal'in and Burtman1993; Jahn, Reference Jahn, Malpas, Fletcher, Ali and Aitchison2004; Windley et al. Reference Windley, Alexeiev, Xiao, Kröner and Badarch2007; Xiao et al. Reference Xiao, Windley, Huang, Han, Yuan, Chen, Sun, Sun and Li2009, Reference Xiao, Windley, Sun, Li, Huang, Han, Yuan, Sun and Chen2015). It was built up by multiple subduction/accretionary and collisional processes along with the closure of the Palaeo-Asian Ocean, and various tectonic units were involved, such as Precambrian microcontinents, ancient island arcs, fragments of oceanic islands and seamounts, accretionary complexes and passive continental margins (Mossakovsky et al. Reference Mossakovsky, Ruzhentsev, Samygin and Kheraskova1993; Sengör, Natal'in & Burtman, Reference Sengör, Natal'in and Burtman1993; Jahn, Reference Jahn, Malpas, Fletcher, Ali and Aitchison2004; Windley et al. Reference Windley, Alexeiev, Xiao, Kröner and Badarch2007).
Many studies have been carried out to understand the tectonic processes of the CAOB, but the timing of the final closure of the Palaeo-Asian Ocean is highly controversial, ranging from Late Devonian to Triassic (Xiao et al. Reference Xiao, Windley, Hao and Zhai2003; Lin et al. Reference Lin, Faure, Nomade, Shang and Renne2008; Charvet et al. Reference Charvet, Shu, Laurent-Charvet, Wang, Faure, Cluzel, Chen and De Jong2011; Xu et al. Reference Xu, Charvet, Chen, Zhao and Shi2013; Eizenhöfer et al. Reference Eizenhöfer, Zhao, Zhang and Sun2014, Reference Eizenhöfer, Zhao, Sun, Zhang, Han and Hou2015a,Reference Eizenhöfer, Zhao, Zhang, Han, Hou, Liu and Wangb; Shao, Tang & He, Reference Shao, Tang and He2014; Li et al. Reference Li, Zhou, Brouwer, Xiao, Wijbrans and Zhong2014, Reference Li, Brouwer, Xiao, Wang, Lee, Luo, Su and Zheng2017a,Reference Li, Brouwer, Xiao and Zhengb,Reference Li, Brouwer, Xiao and Zhengc; Liu et al. Reference Liu, Zhao, Han, Eizenhöfer, Zhu, Hou and Zhang2017). The Solonker Belt has been considered a Late Permian to Middle Triassic suture zone, with Early Palaeozoic subduction-accretionary rocks distributed to its north and south (Xiao et al. Reference Xiao, Windley, Hao and Zhai2003, Reference Xiao, Windley, Sun, Li, Huang, Han, Yuan, Sun and Chen2015; Li et al. Reference Li, Zhou, Brouwer, Xiao, Wijbrans and Zhong2014, Reference Li, Brouwer, Xiao and Zheng2017b,Reference Li, Brouwer, Xiao and Zhengc; Eizenhöfer et al. Reference Eizenhöfer, Zhao, Sun, Zhang, Han and Hou2015a,Reference Eizenhöfer, Zhao, Zhang, Han, Hou, Liu and Wangb; Liu et al. Reference Liu, Li, Feng, Wen, Neubauer and Liang2016). In contrast, some studies have regarded the Solonker Belt as a Permian extensional zone which was built on the Early Palaeozoic orogens (Chen et al. Reference Chen, Zhang, Guo, Li, Feng and Tang2012; Xu et al. Reference Xu, Charvet, Chen, Zhao and Shi2013; Shao, Tang & He, Reference Shao, Tang and He2014; Luo et al. Reference Luo, Xu, Shi, Zhao, Faure and Chen2016; Wang, X. C. et al. Reference Wang, Wilde, Xu and Pang2016).
The Yinshan–Yanshan Belt is situated to the south of the CAOB and has undergone polyphase deformation during the Mesozoic period, which might have genetic links with: (i) the closure of the Palaeo-Asian Ocean at c. 250–200 Ma (e.g. Cui & Wu, Reference Cui, Wu, Zheng, Davis and Yin1997; Wang, Zhou & Li, Reference Wang, Zhou and Li2011), (ii) the Jurassic closure of the Mongol-Okhotsk Ocean (Wang, Zhou & Li, Reference Wang, Zhou and Li2011; Zhang, J. et al. Reference Zhang, Li, Li, Qi and Zhang2014) or (iii) the westward indentation of the North China Plate due to the subduction of the Palaeo-Pacific Ocean (e.g. Faure, Lin & Chen, Reference Faure, Lin and Chen2012).
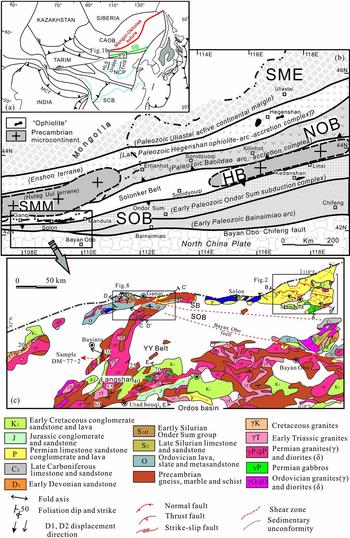
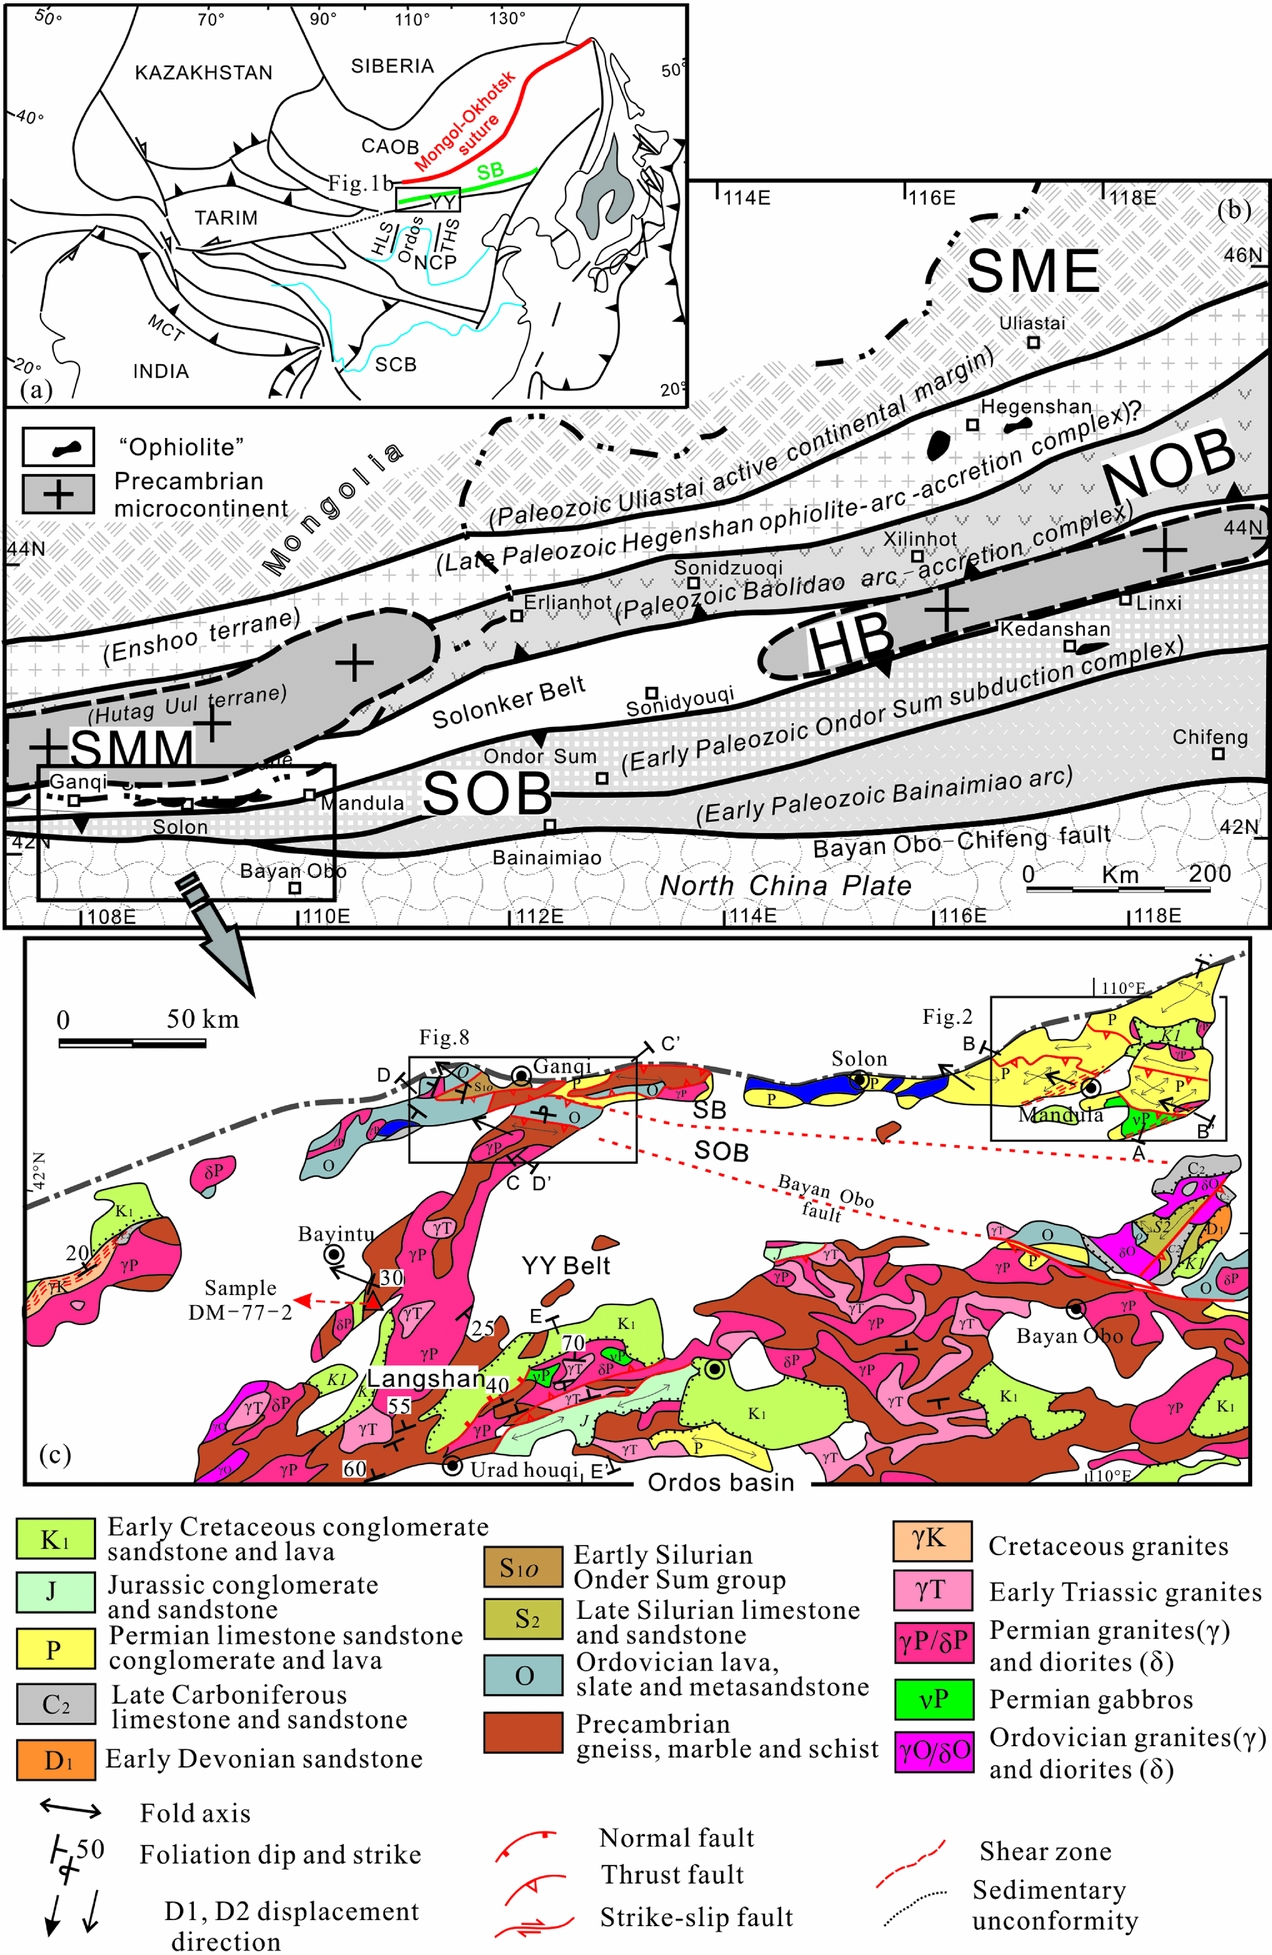
Some studies have examined the sedimentary, volcanic and metamorphic history in/adjacent to the Solonker Belt (e.g. Chen et al. Reference Chen, Jahn, Wilde and Xu2000; Xiao et al. Reference Xiao, Windley, Hao and Zhai2003, Reference Xiao, Windley, Sun, Li, Huang, Han, Yuan, Sun and Chen2015; Xu et al. Reference Xu, Charvet, Chen, Zhao and Shi2013; Song et al. Reference Song, Wang, Xu, Wang, Niu, Allen and Su2015; Eizenhöfer et al. Reference Eizenhöfer, Zhao, Sun, Zhang, Han and Hou2015a,Reference Eizenhöfer, Zhao, Zhang, Han, Hou, Liu and Wangb; Zhang, Wei & Chu, Reference Zhang, Wei and Chu2015; Zhang et al. Reference Zhang, Wei, Chu and Chen2016), but the scarcity of structural analysis greatly limits our understanding of the tectonic development of the Solonker Belt. In order to unravel the genetic mechanism of the Solonker Belt and its corresponding tectonic events, this paper deals with the superimposed deformation of the Solonker Belt, the Southern Orogenic Belt and the northern Yinshan Belt exposed in western Inner Mongolia (Fig. 1). In the following, two main questions will be addressed, namely (i) what is the bulk geometry and kinematics deduced from the structural analysis? And (ii) what are the timings of the deformation and their relationships with the regional geodynamic events?
(a) The location of the study area in the eastern Eurasian continent. (b) Tectonic division of western and central Inner Mongolia (the tectonic division marked in italic is after Xiao et al. Reference Xiao, Windley, Hao and Zhai2003 and Badarch, Cunningham & Windley, Reference Badarch, Cunningham and Windley2002; the tectonic division of the SOB and NOB, and the positions of the SME, SMM and HB are after Xu et al. Reference Xu, Charvet, Chen, Zhao and Shi2013). (c) Geological map of the study area in western Inner Mongolia (after NMBGMR, 1991; Zhou et al. Reference Zhou, Han, Zhang, Xu, Ren, Li and Su2013). HLS – Helanshan; THS – Taihangshan; NCP – North China plate; SCB – South China Block; CAOB – Central Asian Orogenic Belt; SME – Southern Margin of the Ergun block; NOB – Northern Orogenic Belt; HB – Hunshandake block; SOB – Southern Orogenic Belt; SMM – Southern Mongolia Microcontinent; SB – Solonker Belt. YY – Yinshan–Yanshan Belt.
2. Geological setting
The CAOB in Inner Mongolia is subdivided into several ENE-trending tectonic units, from south to north: the Southern Orogenic Belt, the Solonker Belt and the Northern Orogenic Belt. Several amalgamated microcontinents, including the Hunshandake block, the South Mongolia Microcontinent and the southern margin of the Ergun block, have been proposed to account for the present architecture (Fig. 1b; Xiao et al. Reference Xiao, Windley, Hao and Zhai2003, Reference Xiao, Windley, Huang, Han, Yuan, Chen, Sun, Sun and Li2009; Xu et al. Reference Xu, Charvet, Chen, Zhao and Shi2013).
The Southern Orogenic Belt is separated from the North China Craton by the Bayan Obo–Chifeng fault and extends at least for > 700 km from the Ganqi area in the west via Ondor Sum to the Chifeng area in the east (Fig. 1b). It is composed of the Ordovician to Lower Silurian Ondor Sum Group, which is predominantly composed of sericite quartz schists, chlorite-epidote schists, albite-chlorite-epidote schists and meta-basalts, and the Early Palaeozoic Bainaimiao arc magmatic rocks (De Jong et al. Reference De Jong, Xiao, Windley, Masago and Lo2006; Jian et al. Reference Jian, Liu, Kröner, Windley, Shi, Zhang, Shi, Miao, Zhang, Zhang, Zhang and Ren2008, Reference Jian, Liu, Kroner, Windley, Shi, Zhang, Zhang, Miao, Zhang and Tomurhuu2010; Xu et al. Reference Xu, Charvet, Chen, Zhao and Shi2013; Shi et al. Reference Shi, Faure, Xu, Zhao and Chen2013). Late Palaeozoic magmatic rocks overprinted the Early Palaeozoic Bainaimiao arc rocks (Zhang, S.-H. et al. Reference Zhang, Zhao, Kröner, Liu, Xie and Chen2009a,Reference Zhang, Zhao, Song, Hu, Liu, Yang, Chen, Liu and Liub, Reference Zhang, Zhao, Ye, Liu and Hu2014). The Solonker Belt extends from the Ganqi area to the Linxi area (Fig. 1b; Wang & Liu, Reference Wang and Liu1986; Xiao et al. Reference Xiao, Windley, Hao and Zhai2003, Reference Xiao, Windley, Sun, Li, Huang, Han, Yuan, Sun and Chen2015) and is composed of Upper Palaeozoic limestones, turbidites, volcaniclastic rocks, mafic rocks and rare amounts of ultramafic bodies (Wang & Liu, Reference Wang and Liu1986; Xiao et al. Reference Xiao, Windley, Hao and Zhai2003). The volcanic rocks and equivalent intrusions in the Solonker Belt have age ranges of c. 310–250 Ma (e.g. Jian et al. Reference Jian, Liu, Kroner, Windley, Shi, Zhang, Zhang, Miao, Zhang and Tomurhuu2010; Eizenhöfer et al. Reference Eizenhöfer, Zhao, Zhang and Sun2014). The North Orogenic Belt is defined by the lithological association of Lower Palaeozoic Baolidao arc plutons (e.g. Chen et al. Reference Chen, Jahn, Wilde and Xu2000; Jian et al. Reference Jian, Liu, Kröner, Windley, Shi, Zhang, Shi, Miao, Zhang, Zhang, Zhang and Ren2008), mélange rocks and Devonian molasse sandstones (Xu et al. Reference Xu, Charvet, Chen, Zhao and Shi2013).
The Yinshan–Yanshan Belt is an E–W-trending Mesozoic tectonic unit, 1000 km in length, in the north of the North China Craton. The basement rocks of the Yinshan–Yanshan Belt consist of Archaean and Palaeoproterozoic gneisses unconformably covered by Meso- to Neoproterozoic terrigenous clastic strata and carbonates (Kusky & Li, Reference Kusky and Li2003; Zhao, Sun & Wilde, Reference Zhao, Sun and Wilde2005; Faure et al. Reference Faure, Trap, Lin, Monie and Bruguier2007; Kusky, Windley & Zhai, Reference Kusky, Windley, Zhai, Zhai, Windley, Kusky and Meng2007). The basement rocks are unconformably overlain by Upper Palaeozoic and Mesozoic sedimentary rocks. Our study area occupies the northern Yinshan Belt, which is separated from the CAOB to the north by the Bayan Obo fault and bounded by the Ordos basin to the south (Fig. 1c; Zhang, J. et al. Reference Zhang, Li, Xiao, Wang and Qi2013, Reference Zhang, Li, Li, Qi and Zhang2014; Hu et al. Reference Hu, Gong, Wu, Liu and Liu2014). Below we will describe the lithology and structural feature of the Late Palaeozoic Solonker Belt (the Mandula area), the Early Palaeozoic Southern Orogenic Belt (the Ganqi area) and the northern Yinshan Belt (the Langshan range; Fig. 1c).
3. Geology and structural deformation
3.a. The Mandula area (the Solonker Belt)
3.a.1. Lithostratigraphy and magmatic rocks
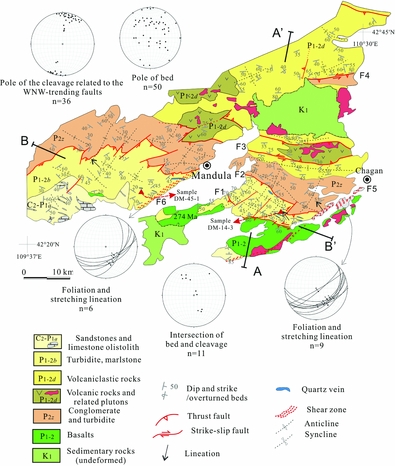
The Mandula area mainly exposes the Upper Carboniferous to Permian sedimentary and magmatic rocks. The southern part of the Mandula area is dominated by limestones and sandstones ascribed to the Upper Carboniferous to Lower Permian Amushan Formation (C2–P1a). However, these limestones are olistoliths sedimented into a siltstone-greywacke matrix, and thus the rocks are considered to have formed an olistostrome in Early Permian time (Shi, Reference Shi2013). The olistostrome is characterized by metre- to kilometre-sized blocks of limestone and sandstone. The long axis of the olistoliths mostly strikes NW–SE (Fig. 2). The Lower Permian Baotege Formation (P1b) and a basaltic lava unit crop out to the north of the olistostrome. The Baotege Formation is composed of well-stratified turbidite and marlstone with intercalations of volcanic layers. The basaltic lava was dated at 274 Ma (Chen et al. Reference Chen, Zhang, Guo, Li, Feng and Tang2012). In the north, the Lower–Middle Permian Dashizhai Formation (P1-2d) is composed of basaltic andesite, rhyolite, tuff, sandstone and silty mudstone (Zhang et al. Reference Zhang, Zhang, Tang, Wilde and Hu2008; Shao, Tang & He, Reference Shao, Tang and He2014). The Middle Permian Zhesi Formation (P2z) comprises lenticular limestone, conglomerate, sandstone and mudstone with a mixed fauna of Boreal and Tethyan domains (NMBGMR, 1991; Wang, Wang & Li, Reference Wang, Wang and Li2004).
Geological and structural map of the Mandula area and lower hemisphere projections of the measured structural data.

The Upper Palaeozoic sedimentary rocks in the Mandula area are unconformably covered by the Cretaceous sedimentary rocks comprising conglomerates and sandstones (Fig. 2).
3.b.2. Polyphase deformation
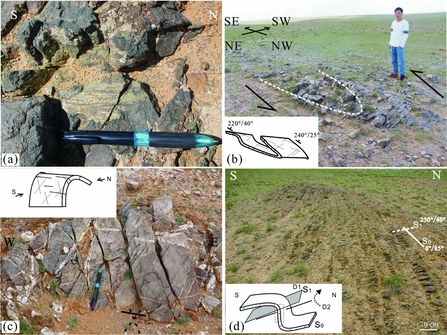
Our field observations show that the olistostrome geometrically overlies the lower basaltic lavas of 274 Ma. The olistostrome and the lavas northwards thrust upon the Lower Permian Baotege Formation (P1b) along the F1 fault (Figs 2, 3 A–A′). The F1 fault is an ESE-striking and SW-dipping thrust with a sinistral component. Immediately south of the fault, the basalts developed striae with a nearly N–S direction (Fig. 4a). Immediately north of the fault, the turbidite exhibits a SW-dipping cleavage, and the relationship between the bed and cleavage indicates an asymmetric fold. Drag folds are locally observed along the fault, indicating NE-directed thrusting with a left lateral strike-slip component (Fig. 4b).
Representative cross-sections through the Solonker tectonic zone (A–A′, B–B′, C–C′), the Southern Orogenic Belt (C–C′, D–D′) and the Langshan range (E–E′), illustrating the structural style of the Mesozoic tectonics. (The section locations are in Fig. 1c, Fig. 2 and Fig. 8). D1 and D2 refer to the deformation phases described in the text. SB – Solonker Belt; SOB – Southern Orogenic Belt.

Field pictures of the D1 stage deformation in the Mandula area. (a) N–S-trending striae in the basalts (Early Permian), immediately south of the F1 fault. Length of pen for scale is 15 cm. (b) Drag fold preserved in the folded turbidite (Baotege Formation, Early Permian, GPS: 42°23′22″N, 110°17′07″E); the strata are overturned to the north, indicating a northward thrust with left lateral strike-slip components, immediately north of the F1 fault. Height of man for scale is c. 175 cm. (c) Two sets of shear joints and a set of tensional joints developed in the Permian turbidite (Baotege Formation, Early Permian; GPS: 42°23′35″N, 110°16′33″E). Quartz veins of Middle Triassic ages fill the joints (see Section 4 in the text). Length of pen for scale is 15 cm. (d) Intersection of the bed and cleavage indicates two stages of deformation: the D1 of NNE–SSW contraction produced N-verging asymmetric folds and related cleavages (S1); the D2 of NW–SE contraction rotated the cleavage planes, found in the Lower and Middle Permian Dashizhai Formation (GPS: 42°39′28″N, 110°22′50″E).

The Lower Permian Baotege Formation tectonically overlies the Middle Permian Zhesi Formation (P2z) as a result of the F2 thrust fault. The F2 fault presents as geomorphologic valleys in the field, and the turbidite along the fault exhibits a WNW-trending cleavage. The Middle Permian Zhesi Formation develops open folds with predominant NE- or SW-dipping beds.
The F3 fault is a WNW–ESE-striking and NNE-directed thrust fault. It cross-cuts the Dashizhai Formation and results in the volcanic bodies forming pop-up structures along a SSW-directed antithetic thrust (Figs 2, 3 A–A′). The strata near the F3 fault are vertical and have developed a series of vertical, net-like joints.
The F4 fault developed in the sandstones of the Dashizhai Formation. The sandstones near the fault developed a vertical or NE-dipping cleavage. A sinistral strike-slip component is deduced from the drag folds in the sandstones.
There are small NE–SW-trending strike-slip faults in the Mandula area (Fig. 2), which dislocated the strata and accommodated the displacement of the abovementioned NNE-directed thrust faults.
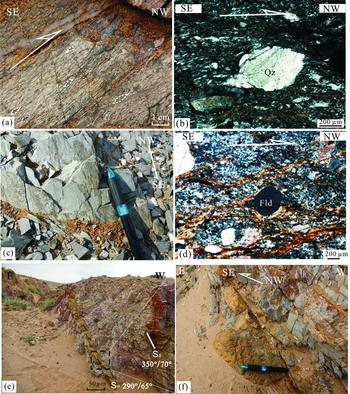
The Mandula area also has two main NE–SW-trending, SE-dipping thrust faults, the F5 and F6 faults, which cross-cut the sedimentary formations and the Permian igneous plutons (Figs 2, 3 B–B′). The F5 thrust fault, 1–2 km in width, presents as an intensively cleaved zone in the basaltic lavas and a mylonitic zone in the granitic plutons and the limestones (P2z) (Fig. 5a). Microscopic evidence in the mylonitic zone indicates a top-to-the-NW sense of shear (Fig. 5a, b). The F6 thrust fault, c. 1 km in width, cross-cuts the turbidite to produce the SE-dipping cleavage (Fig. 2). The striae on the F6 fault plane have a predominant NW–SE direction (Fig. 5c). Microscopic indicators of the F6 fault indicate a top-to-the-NW sense of displacement (Fig. 5d). In addition, NW- or SE-directed small thrust faults that cut the nearly WNW–ESE-trending folded strata are observed in places (Fig. 5e, f).
Photographs of NW- or SE-directed thrusts of the D2 stage of deformation in the Mandula area. (a) Mylonitic granites preserved in the F5 thrust faults (GPS: 42°25′08″N, 110°27′41″E). (b) Microfabrics show a top-to-the-NW shearing; Qz – quartz. (c) Foliated marlstones (the Baotege Formation, Early Permian) along the F6 fault. (d) Sigmoidal porphyroclast of feldspar showing a top-to-the-NW sense of shear in the mylonitic sandstones of the F6 fault; Fld – feldspar. (e) SE-directed thrust (D2) cross-cuts the N-dipping turbidite (D1), found in the Lower to Middle Permian Dashizhai Formation; the fault plane (SF) dips to the NW and the beds (S0) dip to N. (f) Fault breccias and mirror surface with pseudotachylite are observed close to the fault. Length of pen for scale is 15 cm.

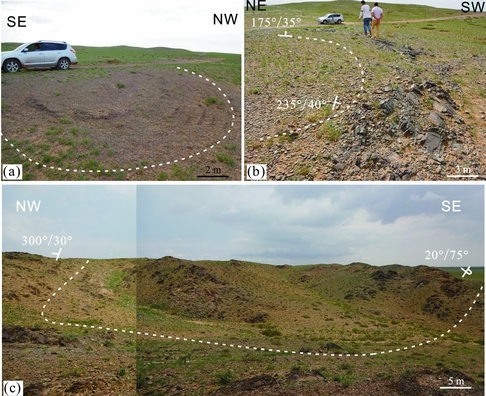
The strata in the Mandula area are intensively folded. The turbidite of the Baotege Formation has various dips (Figs 2, 6a, b). Two groups of shear joints and one group of E–W-trending tension joints are observed in the turbidite. In places, the joints are filled with white quartz veins (Fig. 4c). The volcanic beds of the Dashizhai Formation (P1-2d) mostly dip to the north or south. By contrast, the volcaniclastic rocks have various dips and sometimes the strata are overturned (Fig. 6c). The sandstones of the Zhesi Formation have various dips, but mainly dip to the NW or SE when close to the F5 and F6 thrust faults (Fig. 2). In most cases, the sandstones developed a pervasive cleavage with a predominant WNW–ESE trend. But W-dipping cleavage is observed in places, and the relationship to the bed implies rotation by a later stage of deformation (Fig. 4d).
Field photos of the superimposed folds in the Mandula area. (a) Dome structure in the siltstones (Baotege Formation, Early Permian; GPS: 42°24′38″N, 110°17′06″E). (b) Dome structure in fine-grained turbidite (Dashizhai Formation, Early and Middle Permian). (c) Superimposed fold (dome) preserved in the Permian volcaniclastic rocks (Dashizhai Formation, Early and Middle Permian; GPS: 42°39′30″N, 110°21′56″E). The strata dipping to the NE is overturned. The wavelength of the fold is c. 100 m, which is larger than folds observed in the siltstones (a) and (b).

3.a.3. Interpretation
Our field observations indicate that the two NE–SW-trending, SE-dipping thrust faults (F5, F6) cross-cut the WNW–ESE-trending thrust faults (F1–F4; Table 1). Thus, two stages of deformation can be concluded. The D1 deformation is responsible for the development of the WNW–ESE-trending, NE- or NNE-directed thrust faults and the WNW–ESE-trending folds. Although the mineral stretching lineation cannot be seen in most cases, the cleavage can be recognized along the WNW–ESE-trending faulted zone, restricted to the areas near the faults, with predominant NNE or SSW dips (Fig. 2). The WNW–ESE-trending folds and the predominant NNE- or SSW-dipping cleavage in the faulted zones suggest the D1 stage of deformation is characterized by NNE–SSW contraction. The D2 deformation developed the NE–SW-trending, SE-dipping thrust faults and the NE–SW-trending folds, indicating a NW–SE contraction. The D2 deformation reworked the D1 folds and bent the fold axes (Fig. 2, see projection of intersection of bed and cleavage). Because of the superimposed deformation, the strata in the Mandula area are characterized by dome-and-basin or mega arrowhead-shaped structures (e.g. Ramsay & Huber, Reference Ramsay and Huber1987; Deng, Koyi & Nilfouroushan, Reference Deng, Koyi and Nilfouroushan2016), especially in the turbidite and fine-grained volcaniclastic rocks (Figs 6, 7).
The main thrust faults in the Mandula and Ganqi areas

Block diagrams showing the fold interference patterns created by the two stages of deformation in the Mandula and Ganqi areas.

3.b. The Ganqi area
3.b.1. Lithostratigraphy and magmatic rocks
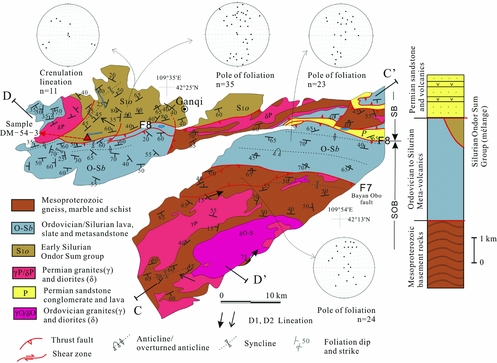
The Ganqi area is mainly occupied by the Mesoproterozoic basement rocks, Ordovician arc-related meta-volcanic and meta-sedimentary rocks, the Ordovician to Silurian Ondor Sum Group composed of sericite quartz schist, iron-bearing quartzite and meta-volcanic rocks, and the Lower Permian Baotege Formation (Fig. 8). The Mesoproterozoic rocks in the southern Ganqi area are composed of gneiss, marble and meta-sedimentary rocks that were intruded by the Ordovician diorite and Permian granite (NMBGMR, 1991). The Ordovician meta-volcanic rocks mainly consist of basalt, andesite and dacite. The Ondor Sum Group has undergone greenschist-facies metamorphism and was interpreted as a subduction-related complex (Xu et al. Reference Xu, Charvet, Chen, Zhao and Shi2013). The sericite quartz schist yielded a detrital zircon peak age of 444 Ma (Xu et al. Reference Xu, Xu, Li and Li2016). The Ordovician to Silurian meta-volcanic rocks and subduction-related complex are defined as the Southern Orogenic Belt (Xu et al. Reference Xu, Charvet, Chen, Zhao and Shi2013). The Baotege Formation in the Ganqi area is a succession of turbidites with intercalations of volcanic beds, which belong to the Solonker Belt.
Geological and structural map of the Ganqi area and lower hemisphere projections of the measured structural data.

3.b.2. Polyphase deformation
The Ganqi area has undergone a nearly N–S contraction due to the Early Palaeozoic orogeny (Xu et al. Reference Xu, Charvet, Chen, Zhao and Shi2013). Here we choose the foliation as the reference surface (S1) to the study the geological architecture. In places, the bedding of the meta-sedimentary rocks is consistent with the foliation (S0-1).
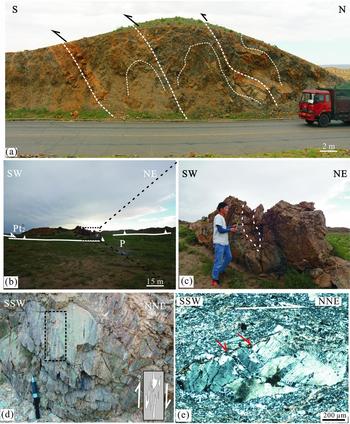
From south to north, the Mesoproterozoic basement rocks, the Southern Orogenic Belt and the Solonker Belt formed as NNE-verging imbricated thrust nappes. The Mesoproterozoic basement rocks were thrust upon the Ordovician meta-volcanic rocks of the Southern Orogenic Belt through a NW–SE-striking and SW-dipping thrust (F7 fault, comparable to the Bayan Obo fault). Above the F7 fault, we observed a series of antithetic faults in the Mesoproterozoic amphibolites (Figs 3 C–C′, 9a). Immediately north of the F7 fault, the foliation of the Ordovician meta-volcanic rocks predominantly strikes WNW–ESE, nearly vertical, and the meta-volcanic rocks are characterized by NNE-verging tight isoclinal folds.
The Mesoproterozoic and Lower Palaeozoic rocks overthrust to the NNE upon the Permian volcaniclastic rocks to form a kilometre-scale klippe (Figs 3 C–C′, 9b). Moreover, the rocks in the klippe are overturned and intraformational folding is observed (Fig. 9c). The minimum distance between the klippe and the root zone is c. 15 km.
Field photos of structures related to the NNE-directed thrust in the Ganqi area. (a) The banded amphibolites include imbricated S-verging asymmetric fold sheets (GPS: 42°16′56″N, 107°38′49″E). The thrusts among the sheets are antithetic faults of the main thrust F7 (Bayan Obo fault). (b) Macroscopic view of the klippe (GPS: 42°21′40″N, 107°38′08″E). The klippe is composed of Mesoproterozoic marbles and clastic rocks. The underlying rocks are the Permian folded volcaniclastic rocks and turbidites. (c) Enlarged view of one klippe showing the marble developed intraformational folds. Height of man for scale is c. 175 cm. (d) The intensively sheared Ordovician meta-volcanic rocks near the F8 fault. The white shear bands are stretched calcites filling in the amygdaloidal structures. Length of pen for scale is 15 cm. (e) Oblique fractured porphyroblast suggests a top-to-the-NNE shearing, from the Ordovician meta-volcanic rocks of (d).

The Ordovician meta-volcanic rocks were thrust above the Ondor Sum Group and the Permian volcaniclastic rocks of the Baotege Formation by the F8 fault (Fig. 3 C–C′). The meta-volcanic rocks near the F8 fault developed WNW–ESE-trending, nearly vertical foliation, and the amygdaloidal structures with calcite infillings are sheared to form shear bands (Fig. 9d). In the microscopic view, the nearly vertical stretching lineation is defined by elongated phenocrysts, and the kinematic indicators suggest a top-to-the-NNE sense of shear (Fig. 9e).
Like the Mandula area, the Ganqi area also has a group of NE–SW-trending faults. Some of the faults display transpressional features.
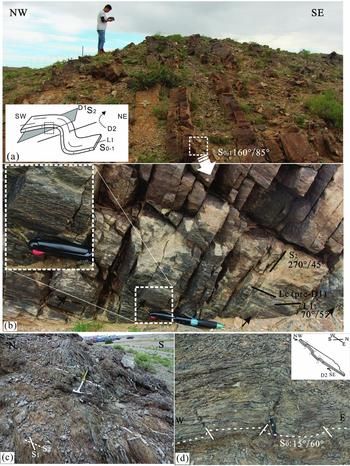
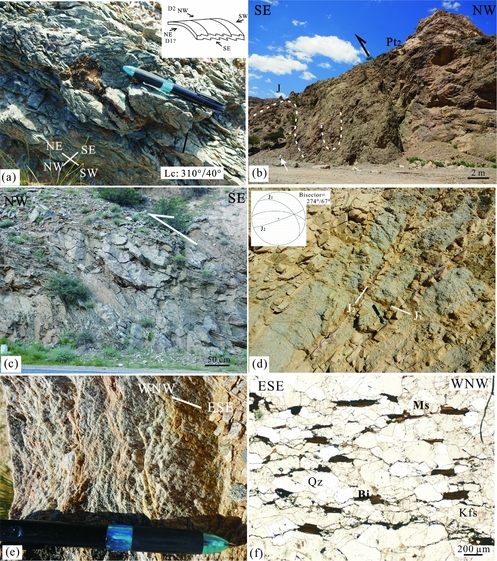
The Mesoproterozoic meta-sedimentary rocks have predominant beds/foliations dipping to the NW or SE, but also have NNE or SSW dips (Fig. 8). As seen in outcrop, the Mesoproterozoic meta-sedimentary rocks developed crenulation in the bedding plane (here named as pre-D1). The pre-D1 crenulation was overlain by a NE–SW slicken lineation caused by interlayer sliding (Fig. 10a, b), and the beds developed a cleavage that now dips to the west. Both the cleavage and the NE–SW slicken lineation indicate the early stage (D1) of NNE-verging asymmetric folding. Subsequently, the early structures were rotated by the later stage (D2) of deformation so that the beds are now overturned to the SE and the cleavage dips to the west (Fig. 10a, b). The Ordovician meta-volcanic rocks also have some foliations dipping to the NW or SE (Fig. 3 D–D′).
Superimposed folds in the Ganqi area. (a) The meta-sedimentary rocks bear multiple stages of structures (GPS: 42°17′10″N, 107°38′35″E). The current strata (S0-1) are overturned, dipping to the SE. (b) On the basal surface, the crenulation lineation (Lc) represents the pre-D1 fabric, which is overprinted by striae lineation (L1, marked by black arrows and see enlarged inset) caused by interlayer sliding of the D1 folding. The cleavage (S2) is produced by the D1 NE- or NNE-verging folds but was rotated by the D2 stage of NW–SE contraction (see text for more detailed explanations). (c) The sericite schist rocks (S1, reference surface) in the Ondor Sum Group are refolded and produce the S2 cleavages which are filled by quartz veins. (d) The N-dipping (D1) sericite quartz schist was overprinted by a kink band structure (D2), found in the Ondor Sum Group. Length of pen is 15 cm, length of hammer is 25 cm and height of man is c. 175 cm for scale.

The Ordovician and Silurian Ondor Sum Group is the subduction mélange corresponding to the Early Palaeozoic subduction event; it becomes difficult to distinguish the deformation related to the Early Palaeozoic subduction-related fabrics from the late-stage structures. All the foliations of the Ondor Sum Group plotted in a large range around N–S (Fig. 8). The folded sericite schist, striking E–W, developed a S-dipping cleavage that was filled by quartz veins (Fig. 10c). However, the sericite quartz schist of the Ondor Sum Group in places developed kink bands, resulting from a NW–SE contraction (Fig. 10d). The crenulation lineation of the early stage (D1 or Pre-D1) sometimes dips to the NW or SE (Fig. 11a).
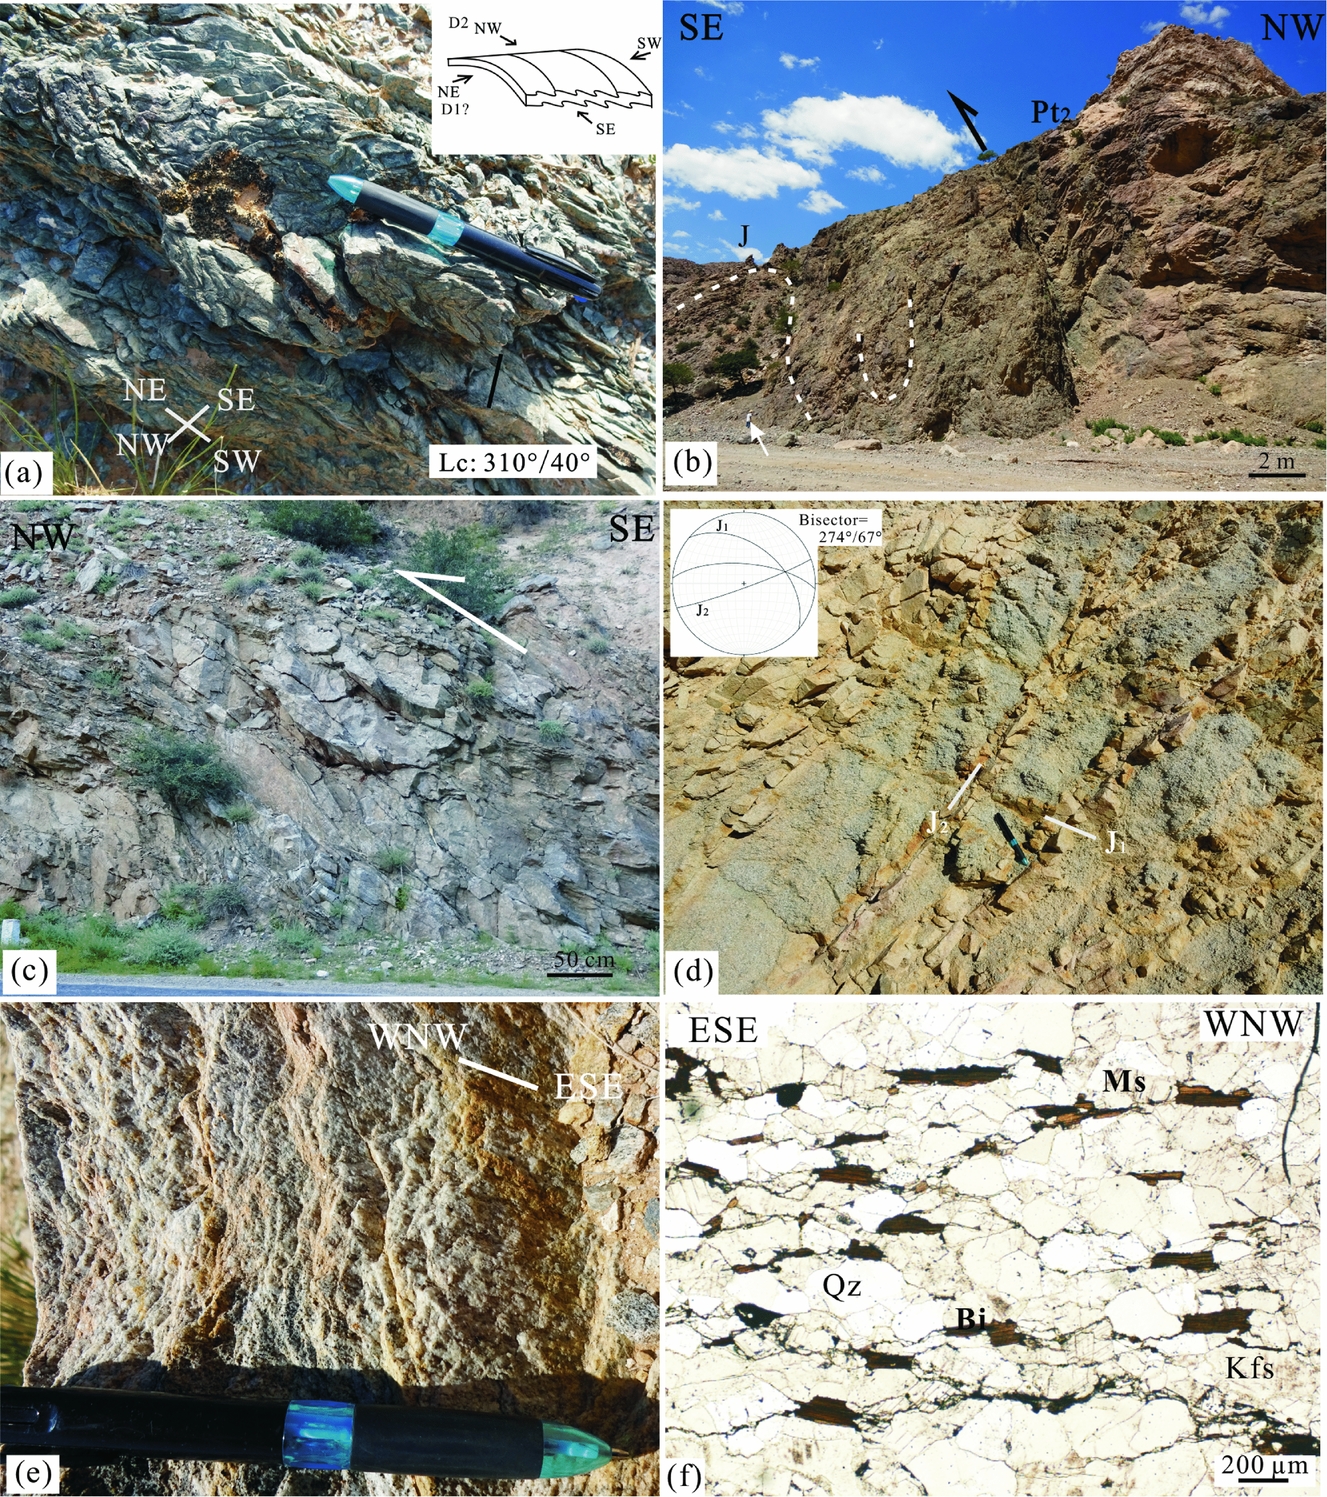
Field photos in the Ganqi area and the Langshan range. (a) The crenulation lineation is inclined by the D2 stage of NW–SE contraction, found in the sericite quartz schist of the Ondor Sum Group, Ganqi area. (b) The Mesoproterozoic gneissic complexes thrust onto the Jurassic conglomerates through a high-angle fault; the high-angle thrust is probably reversed from a normal fault linked with Early Jurassic extension, found on the southeastern side of the Langshan range (GPS: 41°18′33″N, 107°29′28″E). (c) Outcrop-scale sigmoidal structures in the Mesoproterozoic meta-sedimentary rocks imply a series of NW-verging imbricated sheets. (d) Conjugate joints in the Permian plutons are filled with coarser-grained granitic veins. The bisector of the two sets of joints indicates a nearly E–W contraction. (e) The gneissic biotite granites on the western side of the Langshan range (foliation dip: 110°/25°). (f) The WNW–ESE stretching lineation is defined by the oriented biotite and quartz; Bi – biotite; Ms – muscovite; Qz – quartz; Kfs – K-feldspar. Length of pen is 15 cm and height of man is c. 175 cm for scale.
3.b.3. Interpretation
In addition to the deformation of the Ordovician–Silurian rocks inherited from the Early Palaeozoic event, two main deformation stages can be identified according to the superimposed structures. The first stage of deformation (D1) developed the NNE-directed thrusts, klippe above the Permian rocks and the NNE (N)- or SSW (S)-dipping foliations, implying a nearly NNE–SSW contraction. The second stage of deformation (D2) reworked the early structures. The D2 stage of deformation resulted from a NW–SE contraction as suggested by the NW- and SE-dipping foliation and the small NW-trending transpressional faults. The NNE- or SSW-dipping foliations (D1) were refolded by the later approximately orthogonal contraction (D2) to form the fold interference patterns (Fig. 7).
3.c. The Langshan range (the northern Yinshan Belt)
3.c.1. Lithostratigraphy and magmatic rocks
The NE–SW-trending Langshan range is c. 80 km in width. The basement rocks comprise Neoarchaean to Palaeoproterozoic gneiss, and Meso- to Neoproterozoic meta-sedimentary and meta-volcanic rocks (Hu et al. Reference Hu, Gong, Wu, Liu and Liu2014). Upper Palaeozoic sandstone, limestone and volcanic rocks are locally exposed. The Mesoproterozoic basement rocks are unconformably overlain by Jurassic and Cretaceous sequences (Fig. 1c; NMBGMR, 1991). The Jurassic sequences, the Shiguai Group, of more than 1 km thickness, are composed of conglomerate, sandstone and shale (NMBGMR, 1991), and the Cretaceous strata, of more than 2.5 km thickness, are composed of conglomerate, sandstone and shale. The Langshan range consists of magmatic rocks of Early Permian (294–272 Ma), Late Permian (260–254 Ma) and Middle–Late Triassic (245–227 Ma; Wang, Z. Z. et al. Reference Wang, Han, Feng and Liu2015, Reference Wang, Han, Feng, Liu, Zheng and Kong2016; Feng et al. Reference Feng, Brown, Han, Wang, Łuszczak, Liu, Zhang and Ji2017) ages. The Triassic igneous rocks are characterized by biotite-granite and biotite-, K-feldspar-granite (NMBGMR, 1991).
3.c.2. Polyphase deformation
Here we present a transverse section from SE to NW to show the framework of the Langshan range (Fig. 3 E–E′). The Mesoproterozoic rocks near the Ordos basin were thrust to the southeast by a high-angle thrust fault, over the Jurassic conglomerates and sandstones (Fig. 11b). The Jurassic strata were folded into a series of NE-trending open folds. Northwardly, in the central part of Langshan range, the Mesoproterozoic rocks were intruded by large amounts of Permian and Triassic gneissic granites (Fig. 3 E–E′). The foliation of the gneissic granite mostly dips to the north. Further to the northwest, the Mesoproterozoic meta-sedimentary rocks are characterized by NW-directed imbricated sheets (Fig. 11c).
The main tectonic line changes to NNE-trending on the western side of the Langshan range. Large volumes of Permian granites and minor gneissic biotite-granite plutons distribute along the western side of the Langshan range. The Permian plutons developed two sets of joints, along which the crystals recrystallized to become coarser (Fig. 11d). The gneissic biotite-granite plutons with predominant ESE-dipping foliations bear WNW-directed stretching lineations defined by oriented biotite and muscovite (Fig. 11e, f).
All the deformed rocks are unconformably covered by the Cretaceous sedimentary rocks (Fig. 3 E–E′).
3.c.3. Interpretation
The deformation in the Langshan range is related to two stages of deformation. The first stage (D1) developed the nearly E–W-striking foliation in the Permian granitic rocks and the locally ductile deformation of the Triassic gneissic granites, indicating a nearly NNE–SSW contraction. The second stage (D2) developed the SE-directed thrust fault and NE-trending folds in the Jurassic strata and the NW-directed imbricated sheets in the Mesoproterozoic rocks, indicating a NW–SE contraction. The conjugate joints in the granitic plutons and the lineation in the gneissic biotite-granite suggest the contraction was WNW–ESE on the western side of the Langshan range, which is probably related to strain partitioning of the NW–SE contraction along the NNE–SSW-trending boundary faults, the Langshan fault (Zhang, J. et al. Reference Zhang, Li, Li, Qi and Zhang2014) or the Zuunbayan fault (Webb, Johnson & Minjin, Reference Webb, Johnson and Minjin2010). The NNE–SSW-trending boundary fault might previously have been a strike-slip fault caused by the NNE–SSW contraction of the D1 stage.
To summarize, the study region (including the Solonker Belt, the Southern Orogenic Belt and the northern Yinshan Belt) underwent two stages of deformation during the Mesozoic period. In the Mandula area of the Solonker Belt, the D1 stage of deformation led to the development of the NNE-directed thrusts and a series of WNW–ESE-trending, NNE-verging folds (Table 1; Fig. 7). The D2 stage of deformation formed the NW-directed thrusts and NE–SW-trending folds. The sedimentary rocks were folded by the two nearly orthogonal contractions to form basin-and-dome or mega arrowhead-shaped fold patterns (Fig. 7; e.g. Ramsay & Huber, Reference Ramsay and Huber1987; Deng, Koyi & Nilfouroushan, Reference Deng, Koyi and Nilfouroushan2016). In the Ganqi area, the Mesoproterozoic rocks and the Early Palaeozoic meta-volcanic rocks are exposed as tectonic nappes thrust to the NNE over the Permian volcaniclastic rocks during the D1 stage. The rock foliation was refolded by the D2 stage of NW–SE contraction. In the Langshan range, the N- or NNE-dipping foliation of the Triassic gneissic granites suggests the D1 stage of deformation. The D2 stage of NW–SE contraction is responsible for the development of SE- or NW-directed thrusts in the Mesoproterozoic rocks and NE-trending folds in the Jurassic sedimentary rocks.
4. Dating of the quartz veins
We chose quartz vein samples for zircon dating to constrain the deformation age. The quartz veins are ore veins of hydrothermal origins with a significant amount of Au. In the field, the quartz veins cut the Permian strata along the joints (Fig. 4c), or intrude along the cleavages of asymmetric folds (Fig. 10c). Zircon grains were separated using conventional heavy liquid and magnetic techniques. The grains were then handpicked and mounted within epoxy resin discs, and then polished to expose their internal structures. The internal morphology of the zircons was examined using cathodoluminescence (CL) prior to U–Pb isotopic analyses. The CL imaging and U–Pb dating by laser ablation inductively coupled plasma mass spectrometry (LA-ICP-MS) were conducted at the Sample Solution Analytical Technology Co. Ltd Wuhan with analysed spot sizes of 32 μm. Detailed operating conditions for the laser and ICP-MS instrument followed Liu et al. (Reference Liu, Hu, Gao, Günther, Xu, Gao and Chen2008) and Lin et al. (Reference Lin, Liu, Chen, Zhou, Hu and Gao2015). The measured data are listed in the online Supplementary Material available at http://journals.cambridge.org/geo.
Hydrothermal zircon may directly precipitate or form through the alteration of magmatic zircon by aqueous fluids exsolved from highly evolved magmas (Schaltegger, Reference Schaltegger2007). Igneous zircon in hydrothermal environments is easily altered by aqueous fluid, causing secondary textures that cut across the primary growth zone (Corfu et al. Reference Corfu, Hanchar, Hoskin and Kinny2003; Hoskin, Reference Hoskin2005; Geisler, Schaltegger & Tomaschek, Reference Geisler, Schaltegger and Tomaschek2007). The secondary textures overprinting the primary zircon domains often present as patchy areas, sector zoning, a porous texture or as homogeneous without zoning (Hoskin, Reference Hoskin2005; McNaughton, Mueller & Groves, Reference McNaughton, Mueller and Groves2005; Lawrie et al. Reference Lawrie, Mernagh, Ryan, van Achterbergh and Black2007; Pelleter et al. Reference Pelleter, Cheilletz, Gasquet, Mouttaqi, Annich, El Hakour, Deloule and Féraud2007; Park et al. Reference Park, Song, Chung, Kang, Khulganakhuu and Yi2016). In addition, typical hydrothermal zircons contain fluid inclusions (e.g. Zhu et al. Reference Zhu, Zhang, Dai, Wang and Peng2017; Fig. 12).
Representative CL images and fluid inclusions of the analysed zircons. Ages (Ma) and analysed spots (circles) are marked on the zircons. Patchy texture overprints oscillatory zoning of primary zircons as shown in a1, a2, a3, b2, b4; zircons that are homogeneous without clear zoning are shown in a4, c2, c3; zircons with irregular morphology are b3, c1; zircons with contrasting mantle texture are a4, a5, c3, d1.
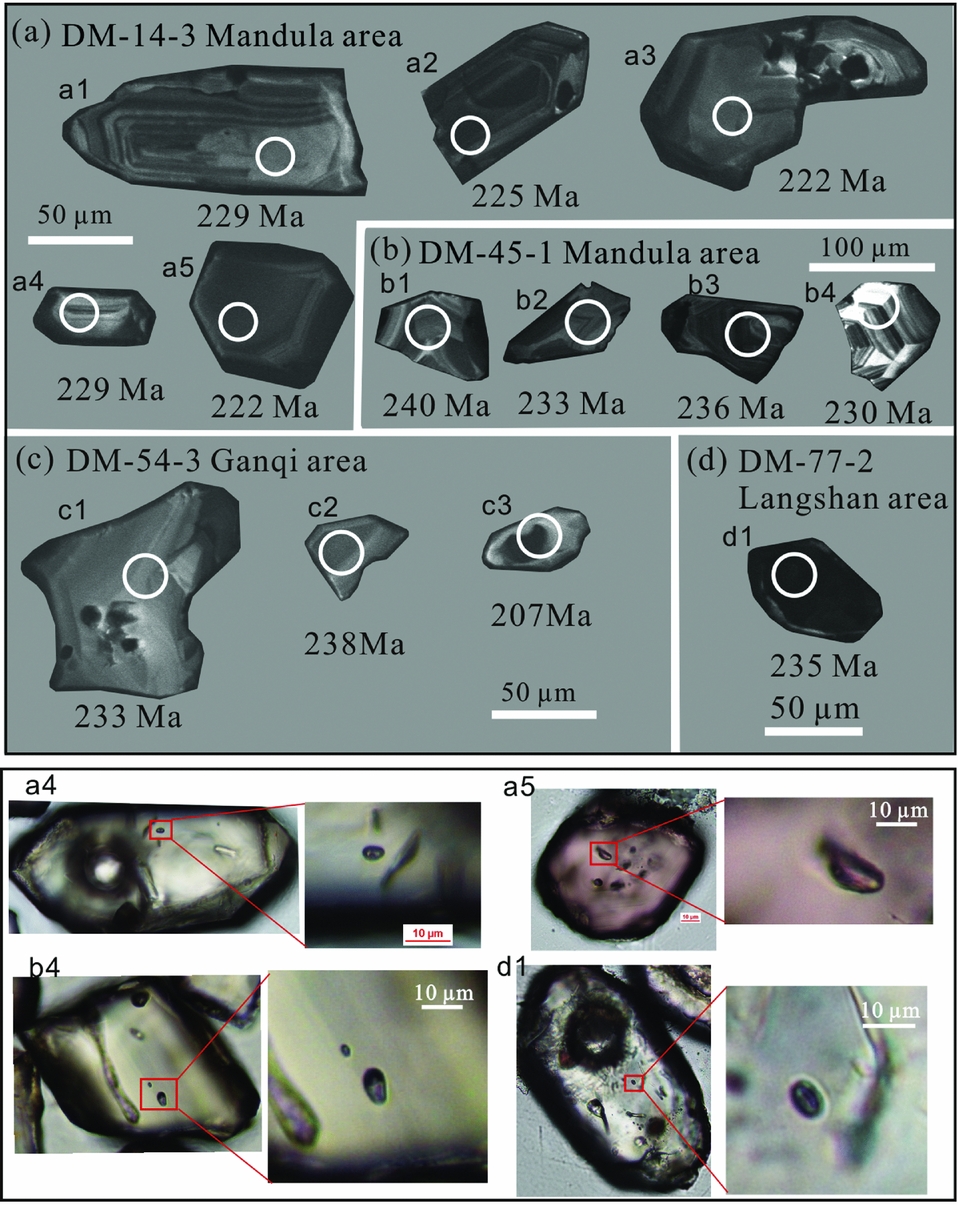
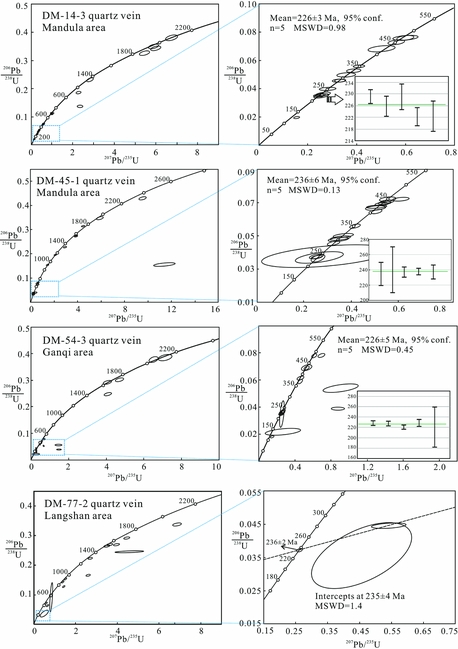
Sample DM-14-3 was taken in the Mandula area (Fig. 2). The quartz vein intruded the Permian turbidites which were folded by the D1 deformation (Fig. 4c). Zircon grains separated from sample DM-14-3 are yellow to light brown, translucent and have a sub-rounded, elongated grain morphology, ranging in length from 50 to 100 μm. Some zircon grains have inhomogeneous internal textures (Fig. 12). The well-developed magmatic oscillatory zoning is overlain by patchy sectors, corresponding to the reworking of hydrothermal fluids (Fig. 13a). Twenty-five spots were analysed and the youngest five grains yield a mean age of 226±3 Ma (MSWD = 0.98; Fig. 13a, b). The other grains with relatively older ages are considered as inherited zircons.
Zircon U–Pb concordia diagrams for the analysed quartz vein samples. Samples DM-14-3 and DM-54-3 have three discordant Cretaceous age grains probably caused by Pb loss, and sample DM-77-2 has only one grain of age 236±2 Ma (see age data in online Supplementary Material available at http://journals.cambridge.org/geo).

Sample DM-45-1 was also taken in the Mandula area (Fig. 2). The quartz vein intruded the Permian turbidites along joints. Zircon grains separated from sample DM-45-1 range from 50 to 150 μm in length. A total of 30 spots were analysed and the five youngest grains cluster at the age of 236±6 Ma (MSWD = 0.13; Fig. 13). The grains with Triassic ages show weak oscillatory zoning overlain by irregular sectors because of hydrothermal fluid reworking. The grains with ages in the range c. 310 Ma, 410–450 Ma and Precambrian ages are interpreted as inherited zircons.
Sample DM-54-3 was taken in the Ganqi area (Fig. 8). The quartz vein intruded the Lower Palaeozoic Ondor Sum Group along the cleavages of a D1 fold (Fig. 10c). The zircon grains are elongated to ellipsoidal in shape with grain sizes of 50–100 μm (Fig. 12). Most of the grains show misted structures without clear zoning. A total of 20 spots were analysed and five grains cluster at 226±5 Ma (MSWD = 0.45; Fig. 13). The grains with Palaeozoic and Precambrian ages are considered to be inherited zircons. Several grains plot away from the concordia curve, which is probably caused by Pb loss.
Sample DM-77-2 was taken on the western side of the Langshan range (Fig. 1c). In the outcrops, the Mesoproterozoic meta-sandstones trend WNW–ESE due to the D1 deformation and are cross-cut by the quartz vein. Zircon grains from sample DM-77-2 are ellipsoidal in shape with grain sizes of 50–100 μm. Some grains show homogeneous textures or dark inner cores (Fig. 12). Only one zircon grain yields a concordant Triassic age of 236±2 Ma. Several grains do not plot on the concordia curve, which is probably caused by Pb loss. Three zircon grains yield a lower intercept age of 235±4 Ma (MSWD = 1.4; Fig. 13).
5. Discussion
5.a. The timing of the D1 and D2 stages of deformation
The two shear joints apparently comprise conjugate joint sets with a nearly NNE–SSW direction of the acute angle bisector (Fig. 4c), which is consistent with the NNE–SSW contraction of the D1 deformation. The quartz veins filled the joints or the cleavages of the folded strata/foliations (Figs 4c, 10c). Thus, we consider that the formation age of the quartz veins is identical to or younger than the age of the D1 deformation. Some zircons obtained from the quartz veins show internal textures of patchy sectors or misted structures without clear zoning, which are features of zircons reworked by hydrothermal fluids. Therefore, the hydrothermal zircons represent the formation age of the quartz veins. These zircons generally yield Middle Triassic ages.
It should be noted that the dated zircon ages are not absolutely valid, because we cannot exclude the hydrothermal zircons from also being inherited ones, like the other zircons of older ages. The joints are of brittle deformation, which cannot be excluded from being the result of a much later stage of deformation. However, we note that there is a significant sedimentary hiatus during the Triassic Period (NMBGMR, 1991; Fig. 14). Furthermore, geothermal modelling by detrital apatite fission tracks in the Mandula area suggested that there were high rates of cooling (1.3°C/Myr) during Middle to Late Triassic times, which produced a c. 4 km tectonic exhumation (Li et al. Reference Li, Jolivet, Zhang, Li and Tang2016). The nearly N–S shortening events were also documented in the Yinshan Belt during 237–213 Ma (muscovite Ar–Ar ages, Gao, Reference Gao2010; Zhang, J. et al. Reference Zhang, Li, Li, Qi and Zhang2014) and the Yanshan Belt during 270–190 Ma (Wang, Zhou & Li, Reference Wang, Zhou and Li2011; Wang, Zhou & Zhao, Reference Wang, Zhou and Zhao2013). Our field observations show the Jurassic rocks did not undergo the D1 stage of NNE–SSW contraction. Thus, we tend to consider, based on the above compiled data, that the D1 stage of deformation happened in Middle Triassic time.
Synoptic table of the Late Permian to Early Cretaceous volcanic, plutonic and sedimentary rocks and tectonic events in the Mandula and Ganqi areas showing the timing of the two tectonic events.

The D2 stage of deformation may have happened during Late Jurassic time, because the Lower and Middle Jurassic sedimentary rocks of the Shiguai Group were folded by the D2 deformation and they were unconformably covered by the unfolded Lower Cretaceous strata of the Lisangou Formation (NMBGMR, 1991; Fig. 14). In addition, the Jurassic sediments, containing pebbles derived from crystalline basement, occur along a high-angle thrust fault at the mountain front (Fig. 11b). The high-angle thrust fault might be an inverted originally normal fault which was linked with a significant regional extension between the two stages (D1 and D2) of contraction (e.g. Meng et al. Reference Meng, Wei, Wu and Duan2014; Fig. 14).
5.b. Geodynamic implications
Some studies suggest that the final closure of the Palaeo-Asian Ocean occurred during Late Permian to Middle Triassic times (e.g. Eizenhöfer et al. Reference Eizenhöfer, Zhao, Zhang and Sun2014; Han et al. Reference Han, Zhou, Wang and Cao2015; Liu et al. Reference Liu, Li, Feng, Wen, Neubauer and Liang2016; Li et al. Reference Li, Brouwer, Xiao, Wang, Lee, Luo, Su and Zheng2017a,Reference Li, Brouwer, Xiao and Zhengb,Reference Li, Brouwer, Xiao and Zhengc). Our studies reveal that the D1 stage of NNE–SSW contraction is characterized by N- or NNE-directed thrusting and the inferred age of the NNE–SSW contraction is about Middle Triassic, which is consistent with the tectonic models for the closure of the Palaeo-Asian Ocean (Xiao et al. Reference Xiao, Windley, Hao and Zhai2003; Eizenhöfer et al. Reference Eizenhöfer, Zhao, Zhang and Sun2014; Han et al. Reference Han, Zhou, Wang and Cao2015; Li et al. Reference Li, Brouwer, Xiao, Wang, Lee, Luo, Su and Zheng2017a,Reference Li, Brouwer, Xiao and Zhengb,Reference Li, Brouwer, Xiao and Zhengc). Despite there being some other studies that argued that the closure of the Palaeo-Asian Ocean took place during Devonian time and the Solonker Belt switched into a rifting stage, producing limited ocean basins during Permian time (Xu et al. Reference Xu, Charvet, Chen, Zhao and Shi2013; Chen et al. Reference Chen, Zhang, Guo, Li, Feng and Tang2012; Shao, Tang & He, Reference Shao, Tang and He2014; Luo et al. Reference Luo, Xu, Shi, Zhao, Faure and Chen2016), the discovery of Lower Mesozoic blueschists in East Inner Mongolia confirmed the existence of a convergent event between the limited ocean basins (Chu et al. Reference Chu, Zhang, Wei, Wang and Ren2013; Zhang, Wei & Chu, Reference Zhang, Wei and Chu2015; Zhang et al. Reference Zhang, Wei, Chu and Chen2016). The blueschists resulting from the closure of the embryonic, limited ocean basins are not typically of the high-pressure nature of deep subduction (Zhang, Wei & Chu, Reference Zhang, Wei and Chu2015; Zhang et al. Reference Zhang, Wei, Chu and Chen2016). In the case of the closure of the limited, narrow oceans, no self-sustaining subduction would likely develop owing to insufficient slab pull (Hall et al. Reference Hall, Gurnis, Sdrolias, Lavier and Müller2003; Gurnis, Hall & Lavier, Reference Gurnis, Hall and Lavier2004; Chenin et al. Reference Chenin, Manatschal, Picazo, Müntener, Karner, Johnson and Ulrich2017), and hence other Triassic geodynamic events, like the Dabie–Qinling orogeny (e.g. Dong et al. Reference Dong, Zhang, Neubauer, Liu, Genser and Hauzenberger2011; Huang et al. Reference Huang, Shi, Chen and Li2015; Li et al. Reference Li, Jolivet, Zhang, Li and Tang2016) are necessary to be employed to interpret the large scale of the nearly N–S contraction between the northern Yinshan Belt, the Southern Orogenic Belt and the Solonker Belt.
Our studies suggest that the Late Jurassic deformation (D2) is characterized by a NW–SE contraction. Some other regions adjacent to our study area also documented the Late Jurassic contraction. For example, in the Yanshan Belt, to the east of the study area, the contraction during Middle–Late Jurassic time turned to be NW–SE directed (Davis et al. Reference Davis, Zheng, Wang, Darby, Zhang, Gehrels, Hendrix and Davis2001, Reference Davis, Darby, Zheng and Spell2002, Reference Davis, Meng, Cao and Du2009; Wang, Zhou & Li, Reference Wang, Zhou and Li2011); the Helanshan area, to the south of the study area, formed NNE-trending folds during Late Jurassic to Early Cretaceous times (e.g. Darby & Ritts, Reference Darby and Ritts2002; Huang et al. Reference Huang, Shi, Chen and Li2015). The Late Jurassic NW–SE contraction was considered to be the far-field consequence of the convergence in the Mongol-Okhotsk Ocean in Far East Asia (Davis et al. Reference Davis, Zheng, Wang, Darby, Zhang, Gehrels, Hendrix and Davis2001) and the westward subduction of the Palaeo-Pacific Ocean (e.g. Zhu et al. Reference Zhu, Wang, Liu, Niu, Xie and Li2005, Reference Zhu, Liu, Niu, Xie, Wang and Xiang2009; Faure, Lin & Chen, Reference Faure, Lin and Chen2012; Huang et al. Reference Huang, Shi, Chen and Li2015). The horizontal compressional stress was transmitted from the subduction zones and tended to concentrate in an intracontinental ‘weak’ zone (i.e. the pre-existing fault zones, thermally weakened zones or mechanical contrasts between lithologies). The strains were concentrated in the Solonker Belt and the Yinshan–Yanshan Belt to develop the superimposed structures of the D1 and D2 stages of deformation (e.g. Deng & Koyi, Reference Deng and Koyi2015).
6. Conclusion
The Solonker Belt, the Southern Orogenic Belt and the northern Yinshan Belt underwent two stages of deformation during the Mesozoic period. The D1 stage of NNE–SSW contraction is responsible for the development of the WNW-trending folds and NNE-directed thrusts. The D2 stage of NW–SE contraction gives rise to the NE-trending folds and NW- or SE-directed thrusts. The primary strata/foliations are deformed by the two nearly orthogonal or oblique contractions to form the superimposed structures. Our new U–Pb zircon ages, along with other geological constraints, suggest the D1 stage occurred in Middle Triassic time and the D2 stage occurred in Late Jurassic time. The coeval geodynamic events of the study area led us to consider that the D1 deformation is related to the final closure of the Palaeo-Asian Ocean or limited, narrow ocean basins, and the D2 deformation is related to the subduction of the Palaeo-Pacific Ocean and the closure of the Mongol-Okhotsk Ocean.
Acknowledgements
J. Charvet and other anonymous reviewers are thanked for their beneficial comments to the earlier version of this paper. This study was supported by the National Natural Science Foundation of China (No. 41402192, No. 41472084), Major National Science and Technology Programs in the “Thirteenth Five-Year” Plan period (No. 2016ZX05024-006-002), and the China Postdoctoral Science Foundation (No. 2014M562080).
Supplementary material
To view supplementary material for this article, please visit https://doi.org/10.1017/S0016756818000183