Introduction
In today's competitive market, most products are used under an uncertain environment, which inevitably affect expected lifecycle of products or even cause product obsolescence (Cardin et al., Reference Cardin, Xie, Ng, Wang and Hu2016; Gopsill et al., Reference Gopsill, Snider, McMahon and Hicks2016; Li et al., Reference Li, Zhang and Chen2021a). As an effective solution, redesign is vital to product research and development process (Janz et al., Reference Janz, Sihn and Warnecke2005; Smith et al., Reference Smith, Smith and Shen2012; Uckun et al., Reference Uckun, Mackey, Do, Zhou, Huang and Shah2014). Driven by sufficient competitiveness in marketplace, the mission for product redesign is pursuing higher customer satisfaction (Zhang et al., Reference Zhang, Chu and Xue2019a).
Customer satisfaction depends on fulfilment level of customer requirements (CRs) (He et al., Reference He, Song, Wu, Xu, Zheng and Ming2017; Li et al., Reference Li, Zhang, Wang, Zheng, Tong and Eynard2020) that closely relates to the fulfilment level of design parameters (DPs) (Felfernig and Schubert, Reference Felfernig and Schubert2011; Jiang et al., Reference Jiang, Song, Li, Dai and Zhang2019; He et al., Reference He, Wu, Xiang, Goh and Wu2021). With the analysis of correlations between CRs and DPs by quality function deployment (QFD), the relative importance of each DP to CRs is calculated (Wang et al., Reference Wang, Yu, Wu, Meng and Lin2019a). In the product development process, customer satisfaction is sensitive to different fulfilment levels of CRs (Ye et al., Reference Ye, Jankovic, Kremer and Bocquet2014; Li et al., Reference Li, Chen and Zhao2021b). Motivated by this observation, the sensitivity of final customer satisfaction to the variations of DPs is worth exploring. Sensitivity of customer satisfaction toward a DP is defined as the relative fluctuation of customer satisfaction caused by unit change of the DP. Differ from the importance of DPs, sensitivity of customer satisfaction toward DPs focuses on fluctuation of customer satisfaction. Typically, realizing an important DP may contribute more to customer satisfaction. However, customer satisfaction may remain immobility even if the DP is further improved. To redesign obsolete products in a cost-effective manner, we concern DPs with highly sensitive impact on customer satisfaction as critical ones. In product redesign, designers should choose and address critical DPs for achieving optimal customer satisfaction with minimum modification cost. By injecting customer satisfaction sensitivity, the optimal improvement of customer satisfaction in product redesign can be achieved. However, a common principle of customer satisfaction modeling is establishing a linear additive value function that integrates the relative importance and fulfilment level of DPs, while not considering the sensitivity of customer satisfaction. A research gap still remains in the analysis and quantification of sensitivity of customer satisfaction to different DPs and mechanism by which it can be referred to redesign obsolescent product.
Motivated by the foregoing discussions and analysis, a product redesign method is proposed by involving cost concerns and sensitivity of customer satisfaction from the perspective of enterprise and customers, respectively. In this study, Kano model is used for classifying DPs and quantifying the sensitivity of customer satisfaction with DPs, thus expanding the application field of Kano model. Sensitivity indices in different DP categories are studied as DPs in different DP categories with the same fulfilment level can lead to different customer satisfaction (Florez-Lopez and Ramon-Jeronimo, Reference Florez-Lopez and Ramon-Jeronimo2012). Likewise, a correction index for each DP is constructed for adjusting their differences in customer satisfaction contribution in the same DP category. The proposed method is realized by a shared surplus model which characterizes the trade-off between two conflict concepts (Kraus and Yano, Reference Kraus and Yano2003). First, Kano indices (He et al., Reference He, Song, Wu, Xu, Zheng and Ming2017) is employed to determine the characteristics of each DP in different sensitivity categories, and based on which, the sensitivity index and correction index are defined and injected to analyze the sensitivity of customer satisfaction to the variations of DPs. Second, the linear additive value function of customer satisfaction proposed by Poel (Reference Poel2007), which only considered the relative importance and fulfilment level of DPs, is improved by injecting the sensitivity of customer satisfaction in different DP categories. Then, a DPs optimization model of maximizing shared surplus between customers and enterprise is established. Finally, a case study for redesign of an obsolete braking system of automobile is implemented to demonstrate the effectiveness of proposed methodology.
The contributions of this study are twofold as follows:
The sensitivity of customer satisfaction to DPs is quantified, and the customer satisfaction function is improved into a nonlinear additive value function. It explores the relationships between customer satisfaction and changes in related DPs. In addition, the improved customer satisfaction function can detect DPs that have more agile contributions to customer satisfaction and provide directions for designing evolution-adapted products.
(1) The sensitivity of customer satisfaction is incorporated into main evaluation benchmarks in the final redesign method. Based on a shared surplus model, this method enables the optimization of DPs for product redesign and the maximization of expected surplus between customers and enterprise. It identifies and chooses DPs with highly sensitive effect to redesign product in a high-satisfaction and cost-effective manner, therefore improves customer loyalty and profit margins.
(2) The remainder of this paper is organized as follows. In the section “Literature review”, related literature is reviewed. In the section “Methodology”, the proposed redesign methodology for the obsolete function is detailed. Section “Case studies” describes the case study, illustrating the effectiveness of developed methodology. Section “Conclusion" presents conclusions and future works.
Literature review
Product redesigns
After a period of marketing, existing products often need to be redesigned owing to internal and external influences, such as technology advancing and continuous evolution of CRs (Smith et al., Reference Smith, Smith and Shen2012; Zhu et al., Reference Zhu, Hu, Qi, He and Peng2017; Li et al., Reference Li, Zhang and Chen2021b). Driven by the motivation of functional obsolescence and changes of CRs, many objectives have been considered in product redesign, such as improving materials and structures for remanufacturing (Shin et al., Reference Shin, Kiritsis and Xirouchakis2015; Paras et al., Reference Paras, Wang, Chen, Curteza, Pal and Ekwall2018; Zhang et al., Reference Zhang, Zhang, Zhang and Qiu2021), seeking product innovations (Smith et al., Reference Smith, Smith and Shen2012; Dong et al., Reference Dong, Tan, Zhang, Peng and Shao2021; Wang, Reference Wang2021), reducing costs (Janz et al., Reference Janz, Sihn and Warnecke2005; Lee et al., Reference Lee, Lee and Seo2011; Zhang et al., Reference Zhang, Chu, Chen and Yan2019b), and reducing the environmental impacts (Bovea and Wang, Reference Bovea and Wang2007; Borchardt et al., Reference Borchardt, Wendt, Pereira and Sellitto2011; Yang et al., Reference Yang, Yu and Sekhari2011). However, final redesigned products based on these methods are not sufficiently competitive in marketplace, as customer requirements cannot be clearly identified and satisfied (Yan et al., Reference Yan, Chen and Khoo2002; Mukhopadhyay and Ameri, Reference Mukhopadhyay and Ameri2016), that is, critical DPs of these products cannot be well identified and improved for achieving customer requirements sufficiently and effectively (Jiang et al., Reference Jiang, Song, Li, Dai and Zhang2019).
Better customer satisfaction is the ultimate goal for product redesign. Products with low customer satisfaction will be eliminated by customers in the future at a high probability (Zhang et al., Reference Zhang, Chu and Xue2019b). To seek the maximization of redesign value, customer satisfaction has gained exponential traction in redesign research. Integrating the analytic network process and goal programming, Liu and Hsiao (Reference Liu and Hsiao2006) illustrated a product architecture optimization algorithm in product redesign with the aim of maximizing customer satisfaction. A novel reuse-oriented redesign method was reported by Du et al. (Reference Du, Cao, Chen and Wang2013), integrating the axiomatic design theory and QFD. They satisfied customers by realizing the functions of remanufactured product with the mapping process of CRs, function requirements, DPs, and process variables. Jiang et al. (Reference Jiang, Song, Li, Dai and Zhang2019) proposed an improved planning equation for customer satisfaction-oriented product redesign, helping obsolete machine tools reach their potential competitiveness. Based on online reviews, Zhang et al. (Reference Zhang, Chu and Xue2019b) constructed a structured preference model and target feature selection model with redesign index. With the evaluation of customer satisfaction and product features, the to-be-improved features were identified. To advance accuracy of existing sentiment analysis methods in product redesign, Zhu et al. (Reference Zhu, Qi, Hu and Huang2021) proposed an integrated customer hearing and product redesign system, in which product redesign strategies are obtained by using online user-generated content. These product redesign methods considering customer satisfaction contribute a lot to customer loyalty and extension of product life cycle.
However, similar to the relation between CRs and customer satisfaction, the sensitivity of customer satisfaction is diverse to different DPs. Without analyzing and applying the sensitivity of customer satisfaction, these redesign research bypasses an opportunity for redesigning product under a cost-efficient way. To the best of our knowledge, research on product redesign that involved the sensitivity of customer satisfaction is still limited.
Customer satisfaction modeling
Customer satisfaction modeling has received significant attention by academics and practitioners. Early research on customer satisfaction focus on marketing and include the Swedish Customer Satisfaction Barometer (SCSB; Fornell, Reference Fornell1992), American Customer Satisfaction Index (ACSI; Fornell et al., Reference Fornell, Johnson, Anderson, Cha and Bryant1996), and European Customer Satisfaction Index (ECSI; Kristensen et al., Reference Kristensen, Martensen and Gronholdt2000). These studies explored the impact factors of customer satisfaction and the causal relationship among them through qualitative methods such as market investigation and questionnaires. Customer satisfaction degree cannot be directly obtained by the above models.
Owing to the development of product design theory, multidisciplinary theories and techniques are advanced and employed to quantitatively model customer satisfaction. As a vital step in product redesign, determining the relative importance of DPs is mostly achieved through QFD, which usually applies the house of quality (HoQ) for rating the importance factors of the existing product components. To cope with the uncertainties about human subjective perception and customer heterogeneity underlying the QFD problem, research on fuzzy QFD and group decision-making approaches has received many attentions (Zhang and Chu, Reference Zhang and Chu2009; Smith et al., Reference Smith, Smith and Shen2012), and made substantial progress. Kwong et al. (Reference Kwong, Won and Chan2009) developed a nonlinear customer satisfaction model based on a neuro-fuzzy approach, helping design teams understand customer perceptions of products. Chan et al. (Reference Chan, Kwong and Wong2011) established a customer satisfaction model based on genetic programming and related customer satisfaction to the design attributes, in which hierarchical trees were used to represent structures and a potential solution was depicted as a tree with branches. Aim to extract design attributes for affective design, Jiang et al. (Reference Jiang, Kwong, Siu and Liu2015) employed rough set theory and particle swarm optimization into adaptive neuro-fuzzy inference systems. This method filled the limitation of inputs excess and generated explicit customer satisfaction model with better modeling accuracy. Ranjan et al. (Reference Ranjan, Siddharth and Chakrabarti2018) proposed a method for calculating product novelty and usefulness of product creativity assessment, and they adopted requirement-satisfaction degree as a proxy for usefulness measurement. In addition, many current methods aggregate CRs by weighted average to be final customer satisfaction. Based on free-form written opinions, Farhadloo et al. (Reference Farhadloo, Patterson and Rolland2016) proposed a Bayesian approach for modeling the overall customer satisfaction based on relative importance of each product aspect. Bi et al. (Reference Bi, Liu, Fan and Cambria2019) proposed an ensemble neural network-based model to aggregate the effects of customers’ positive and negative sentiments toward the customer satisfaction dimensions on customer satisfaction. Wang et al. (Reference Wang, Wei, Zhang and Wang2019b) employed the Kano model to quantify customer satisfaction contribution of each CR by employing the Better-Worse coefficient analysis and selected high-sensitivity requirements for priority development. These models of customer satisfaction are explicit and objective to analyze the characteristics, relations, and variations between CRs and design attributes or parameters. However, the sensitivity of customer satisfaction to the variations of DPs is hardly discussed. In this study, Kano model is extended to classify DPs and quantify the sensitivity of customer satisfaction with DPs. An improved customer satisfaction function has been proposed by injecting the sensitivity of customer satisfaction in different DP categories.
Methodology
Assume that an obsolete product is P. Related CRs are pre-analyzed and extracted by designers. CRs are related to one or more engineering characteristics (ECs), and ECs have direct or indirect, functional or nonfunctional relationships with one or more DPs. We assume CRi (i = 1, 2, …, I), ECj (j = 1, 2, …, J), DPh (h = 1, 2, …, H) represent the ith CR, the jth EC, and the hth DP, respectively. This study proposes an improved individual customer satisfaction function by injecting the sensitivity of customer satisfaction in different DP categories. As noted, the improved function can be denoted as  $s_h = f\;( w_h^{\rm DP} , \;x_h, \;\tau _h) $
 $ ( h{\rm} = {\rm 1, \;2, \;} \ldots {\rm , \;}H) $, where sh is the level of customer satisfaction achieved by DPh,
 $w_h^{\rm DP}$ is the relative importance of DPh, xh represents the level of fulfilment of DPh, and τ h explains the final sensitivity index of DPh in different categories.
The procedure of calculating the relative importance of DPs is described in the section “Calculation of relative importance of DPs”; the sensitivity of customer satisfaction toward the variations of DPs is analyzed in the section “Analysis of sensitivity between DPs and customer satisfaction”; and the shared surplus model is formulated in the section “Formulation of the shared surplus model to determine target values of DPs”.
Calculation of relative importance of DPs
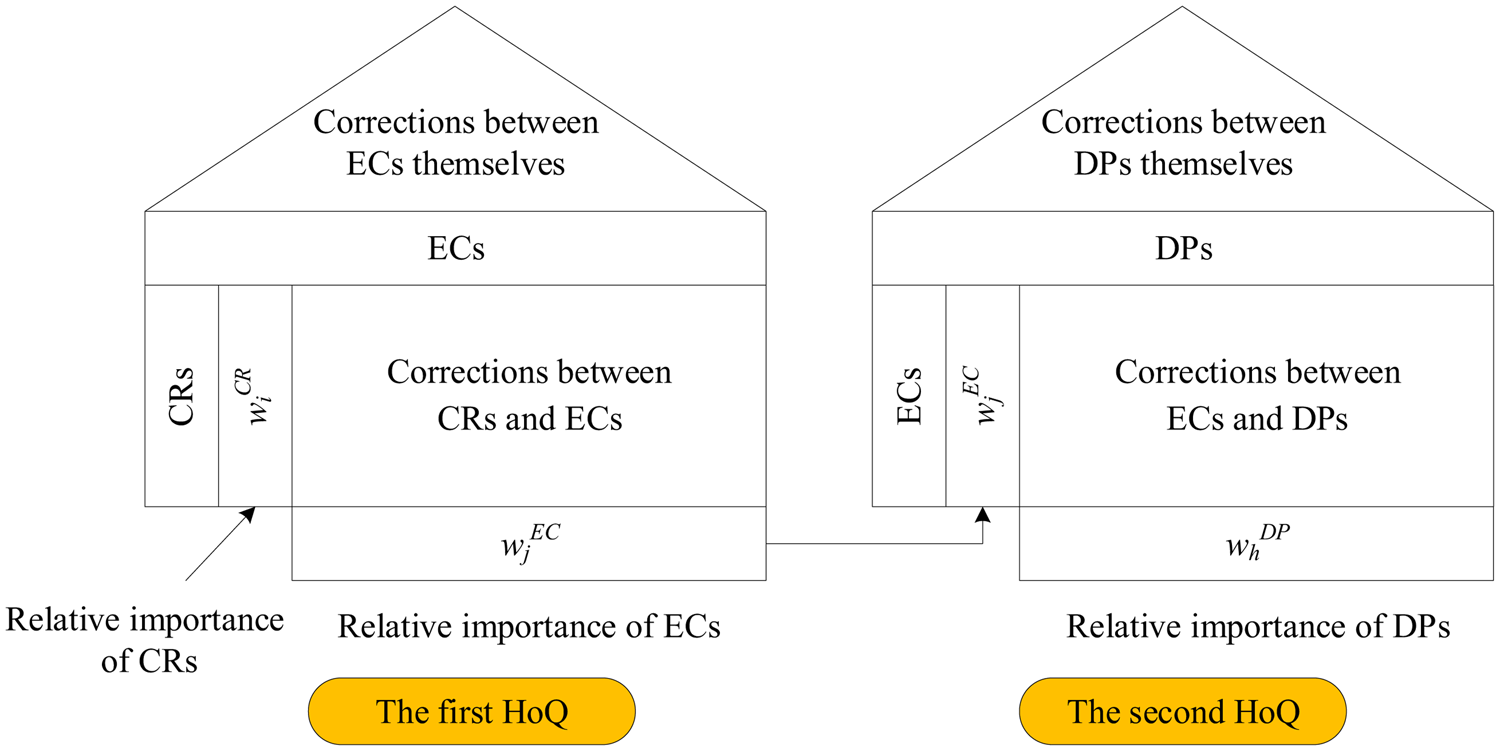
In the product redesign process, the weight of CRs, ECs, and DPs should be predetermined. As relevant research is relative mature, the weighting methods in Wang et al. (Reference Wang, Elhag and Hua2006) and Zhang and Chu (Reference Zhang and Chu2009) are used in this study. We only sketch the calculation process. Considering multiple mapping relationships among CRs, ECs, and DPs, a two-level HoQ of QFD is constructed to calculate relative importance of each DP. The procedure is shown in Figure 1.
Two-level HoQ for calculating relative importance of DPs.

With the usage of triangular fuzzy number (TFN), the relative importance of each CR, that is  $w_i^{\rm CR}$, is determined through FLLSM (Wang et al., Reference Wang, Elhag and Hua2006), FWLSM (Zhang and Chu, Reference Zhang and Chu2009), defuzzification (Geng et al., Reference Geng, Chu, Xue and Zhang2011), and normalization. Then, the relative importance of ECj and DPh, that is,
 $w_j^{\rm EC}$ and
 $w_h^{\rm DP}$ is obtained by similar methods through mapping the relationships on the HoQ in Figure 1.
Analysis of sensitivity between DPs and customer satisfaction
DPs in different categories with same fulfilment level may lead to different impacts on customer satisfaction, as well as in the same category. Therefore, the sensitivity of customer satisfaction toward the variations of DPs is analyzed in this section.
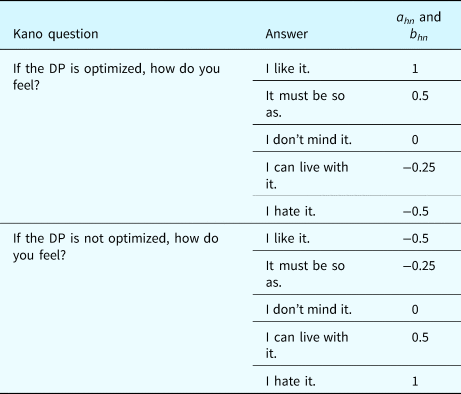
A Kano questionnaire is firstly designed to identify the sensitivity category of each DP, as shown in Table 1. According to the Kano questionnaire, evaluation results of each DP from customers can be obtained, which are noted as ehn = (ahn, bhn, whn). ahn and bhn are the evaluation results about negative and positive questions of DPh from the nth customer (n = 1, 2, …, N), respectively; whn is the evaluation of the importance of each DP from customer perspective.
Kano questionnaire and assignments of ahn and bhn

Customer satisfaction is actually customer perception when the DPs related to CRs are optimized. Customer dissatisfaction is the opposite one. Therefore, ahn and bhn can also be considered as dissatisfaction and satisfaction of the nth customer with DPh. Assignments of ahn and bhn are presented in Table 1, which are asymmetric to diminish the influence of negative evaluations (Lee et al., Reference Lee, Wang and Lin2012), because Xu et al. (Reference Xu, Jiao, Yang, Helander, Khalid and Opperud2009) argued that positive answers are considered to be stronger responses than negative ones. In addition, whn is assigned incrementally from 0.1 to 1 with the step of 0.1.
Each DP can be represented as  ${\rm DP}_h = ( \overline {a_h} {\rm , \;}\overline {b_h} )$, where
 $\overline {a_h}$ and
 $\overline {b_h}$ are the average satisfactions with negative and positive question, respectively.
 $\overline {a_h}$ and
 $\overline {b_h}$ are obtained according to Eqs (1) and (2).
 $$\overline {a_h} {\rm} = \displaystyle{{\sum\nolimits_{n{\rm = \ 1}}^N {w_{hn}a_{hn}} } \over N}{\rm , \;}h{\rm} = {\rm 1, \;2, \;}\ldots H,$$
 $$\overline {b_h} {\rm} = \displaystyle{{\sum\nolimits_{n{\rm = \ 1}}^N {w_{hn}b_{hn}} } \over N}{\rm , \;}h{\rm} = {\rm 1, \;2, \;}\ldots H.$$
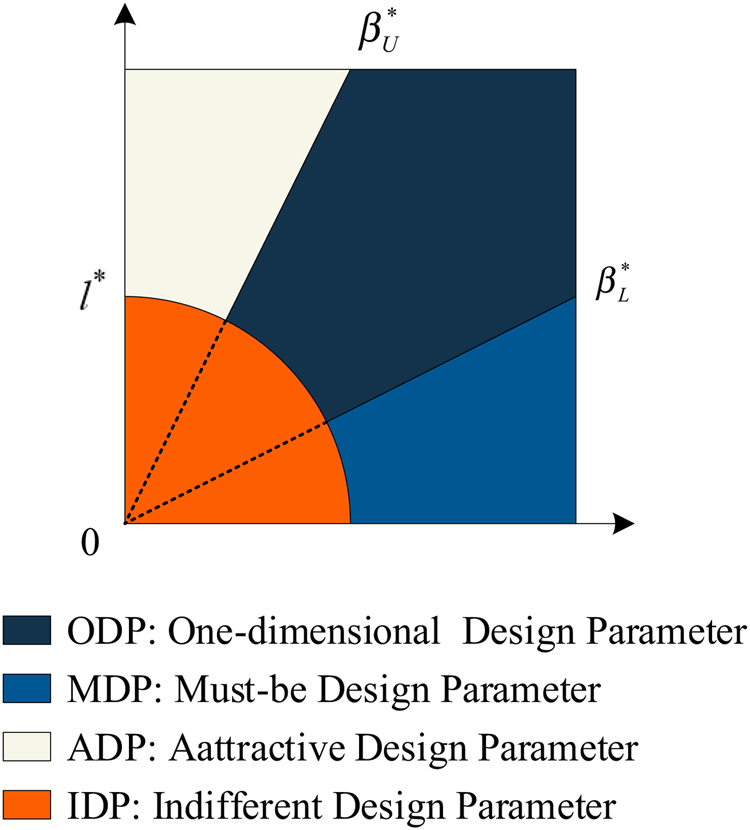
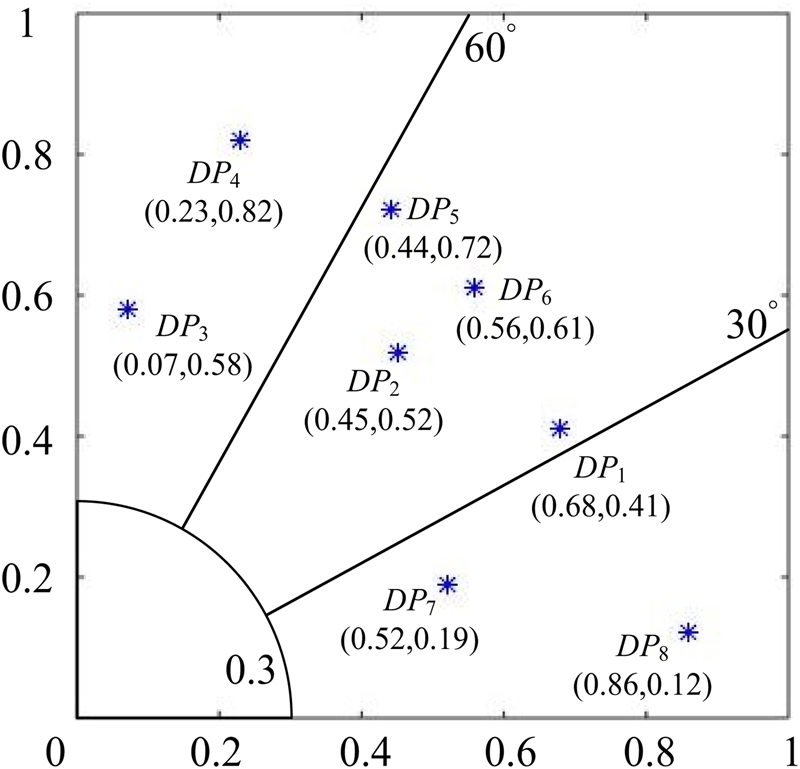
The value pair  $( \overline {a_h} {\rm , \;}\overline {b_h} )$ is plotted in a two-dimensional diagram, as shown in Figure 2. The characteristic of DPh can be represented as a vector
 $\overrightarrow {{\bf {DP}}_h} {\rm} = ( l_h, \;\beta _h)$, where
 $l_h{\rm} = \sqrt {{\overline {a_h} }^ 2{\rm} + {\overline {b_h} }^ 2} \ ( 0{\rm \le }l_h{\rm \le }\surd 2)$ and
 $\beta _{h\;}{\rm} = {\rm ta}{\rm n}^{- 1}{{\overline {b_h} } \over {\overline {a_h} }}\left({ 0{\rm \le }\beta_{h\;}{\rm \le }{\pi \over 2}} \right)$. The magnitude of
 $\overrightarrow {{\bf {DP}}_{\boldsymbol h}}$ denotes the overall impact degree of DPh on the customer satisfaction, and the angle between
 $\overrightarrow {{\bf {DP}}_{\boldsymbol h}}$ and the horizontal axis represents the relative level of satisfaction and dissatisfaction. l h and β h are collectively called Kano indices (He et al., Reference He, Song, Wu, Xu, Zheng and Ming2017).
Sensitivity categories.

According to locations of DP in the two-dimensional diagram as shown in Figure 2, DPs can be classified into four sensitivity categories, that is indifferent DPs (IDPs), must-be DPs (MDPs), one-dimensional DPs (ODPs), and attractive DPs (ADPs). A threshold value of magnitude, that is  $l^{\rm \ast }$, is introduced to differentiate DPs from influential and less influential ones. If
 $l_h \le l^{\rm \ast }$, DPh is considered as uninfluential, and it is defined as an IDP. Likewise, two threshold values of angle, that is
 $\;\beta _L^{\rm \ast }$ and
 $\beta _U^{\rm \ast }$, are introduced, where
 $\beta _L^{\rm \ast }$ is a lower threshold value of vector angle, and
 $\beta _U^{\rm \ast }$ is a higher one. If
 $l_h{\rm > }l^{\rm \ast }$ and
 $0{\rm < }\beta _h{\rm < }\beta _L^{\rm \ast }$, DPh is considered as an MDP. If
 $l_h{\rm > }l^{\rm \ast }$ and
 $\beta _L^{\rm \ast } {\rm < }\beta _h{\rm < }\beta _U^{\rm \ast }$, DPh is considered as an ODP. If
 $l_h{\rm > }l^{\rm \ast }$ and
 $\beta _h{\rm > }\beta _U^{\rm \ast }$, DPh is considered as an ADP.
 $l^{\rm \ast }$,
 $\;\beta _L^{\rm \ast }$ and
 $\beta _U^{\rm \ast }$ are collectively called Kano classifiers that are determined by designers according to enterprise or the empirical data.
In different DP categories, DPs with same fulfilment level can lead to different levels of customer satisfaction (Florez-Lopez and Ramon-Jeronimo, Reference Florez-Lopez and Ramon-Jeronimo2012). IDPs have no effect on the improvement of customer satisfaction; MDPs only improve customer satisfy action in a small amount; ODPs lead to a positive and linear level of customer satisfaction; ADPs result in a higher level of customer satisfaction than ODPs. Thus, according to the corresponding sensitivity characteristic, IDPs, MDPs, ODPs, and ADPs are assigned basic sensitivity indices  $\vartheta _h$, that is 0, 0.5, 1, and 2, respectively (Xu et al., Reference Xu, Jiao, Yang, Helander, Khalid and Opperud2009; Geng et al., Reference Geng, Chu, Xue and Zhang2011). Likewise, in the same DP category, different DPs with same fulfilment level can also create different levels of customer satisfaction. A correction index γ h is defined to adjust the basic sensitivity index based on Kano indices, which is inspired by the configuration index defined in Xu et al. (Reference Xu, Jiao, Yang, Helander, Khalid and Opperud2009) and He et al. (Reference He, Song, Wu, Xu, Zheng and Ming2017) that measured the CR's priority in product design. The correction index is illustrated in Eq. (3).
 $$\gamma _h{\rm} = \left({ 1 + \displaystyle{{\beta_h} \over \pi }} \right)l_h.$$
Given a specific β h, γ h is proportional to l h, which is consistent with the fact that a DP with higher overall impact degree on satisfaction is more likely to have a stronger impact on the sensitivity of customer satisfaction. Meanwhile, given a specific l h, γ h increases with the increase of β h, which reflects that the increase in sensitivity is associated with sensitivity categories in order of IDP, MDP, ODP, and ADP. The value of π is 180 degree. Thus, the final sensitivity index of DPh is obtained by Eq. (4).
 $$\tau _h{\rm} = \vartheta _h\gamma _h.$$
Formulation of the shared surplus model to determine target values of DPs
Normalize DPs
Due to technical limitations, values of DPs fall into a continuous range or several discrete values. In addition, as different DPs have different measuring methods, using raw technical values to evaluate customer satisfaction comprehensively is unreasonable. Thus, the specific technical values of DPs are transferred into fulfilment level of DPs by normalization.
Continuous DPs are further divided into positive and negative ones. The performance of positive DP is positively proportional to its target value, and vice versa with negative DPs. The specific technical value of each positive and negative DP can be normalized according to Eqs (5) and (6), respectively (Chen and Chuang, Reference Chen and Chuang2008).
 $$x_h{\rm} = \displaystyle{{( {X_h - X_{{\rm min}}} ) } \over {( {X_{{\rm max}} - X_{{\rm min}}} ) }}{\rm , \;\;}$$
 $$x_h{\rm} = \displaystyle{{( {X_{{\rm max}} - X_h} ) } \over {( {X_{{\rm max}} - X_{{\rm min}}} ) }}{\rm , \;\;}$$
where x h represents a fulfilment level of DPh; X h is a specific technical value of DPh; X max represents a maximal feasible technical value of DPh, which is an optimal attainable value in industry; X min represents a minimal feasible technical value of DPh, specified as an initial technical level of DPh.
For discrete DPs, a binary variable  $x_{ho}( o{\rm} = {\rm 1, \;2, \;\\ldots , \;}O)$ is introduced to assist normalization. For each discrete DP, there are O feasible discrete values and each of them has a fulfilment rating d ho. The fulfillment rating dho of each positive and negative descript DP is obtained according to
 $d_{ho}{\rm} = ( y_{ho} - a) /( y_{{\rm max}} - a)$ and
 $d_{ho}{\rm} = ( y_{{\rm max}} - y_{ho}) /( y_{{\rm max}} - a)$, where y ho represents improved fulfilment options of DPh; y max represents a maximal feasible technical value of DPh, which is an optimal attainable value in the industry; a represents an initial implementation level of DPh, which is lower than y ho. If the oth feasible value of DPh is selected for redesign, x ho equals to 1. Thus, the fulfilment level of DPh equals to the fulfilment rating of selected value, that is d ho, as illustrated in Eq. (7).
 $$x_h{\rm} = \mathop \sum \limits_o d_{ho}x_{ho}{\rm , \; if}\,DP_h\,{\rm is\;}\,{\rm a}\,{\rm discrete}\,{\rm DP}.$$
Formulate customer satisfaction
The overall customer satisfaction of redesigned product can be regarded as a mathematical aggregation of the fulfilment levels of DPs, represented as S (x 1, x 2, …, xH). S can be obtained by adding up the individual customer satisfaction of each DP, as illustrated in Eq. (8).
 $$S{\rm} = \sum\limits_{h{\rm = \ 1}}^H {s_h}. $$
Unlike the linear additive value function of customer satisfaction (Poel, Reference Poel2007) as shown in Eq. (9) that only considering the relative importance and fulfilment levels of DPs, this study proposes an improved individual customer satisfaction function in Eq. (10) by injecting the sensitivity of customer satisfaction in different DP categories introduced in the section “Analysis of sensitivity between DPs and customer satisfaction”.
 $$s_h{\rm} = w_h^{DP} \cdot x_h,$$
 $$s_h{\rm} = w_h^{DP} \cdot s( x_h) = \left\{{\matrix{ {w_h^{DP} ( x_h^{\tau_h} {\rm} + 0{\rm.5) , \;}} \hfill & {{\rm for\;}\,{\rm an}\,{\rm ADP}} \hfill \cr {w_h^{DP} \cdot \tau_hx_h{\rm , \;}} \hfill & {{\rm for\;}\,{\rm an}\,{\rm ODP}} \hfill \cr {w_h^{DP} ( x_h^{\tau_h} - 0{\rm.5) , \;}} \hfill & {{\rm for\;}\,{\rm an\;}\,{\rm MDP}} \hfill \cr { 0.5w_h^{DP} , \;} \hfill & {{\rm for\;}\,{\rm an}\,{\rm IDP}} \hfill \cr } } \right.$$
where s(x h) explains the sensitivity of customer satisfaction with the fulfilment levels of DPs in different categories. For ADPs, the 0.5 factor is given as customers will not be unsatisfied when ADPs are not fulfilled. In contrast to ADPs, the 0.5 factor is given as customers will be unsatisfied when MDPs are not fulfilled. For IDPs, the 0.5 factor is given as customer satisfaction will be positive but not change as xh increases.
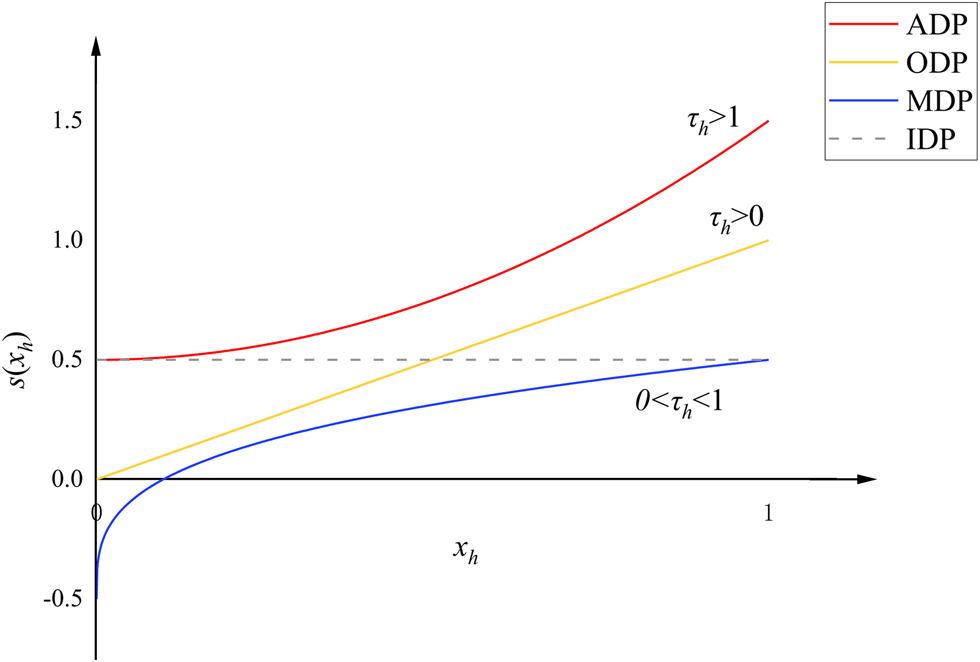
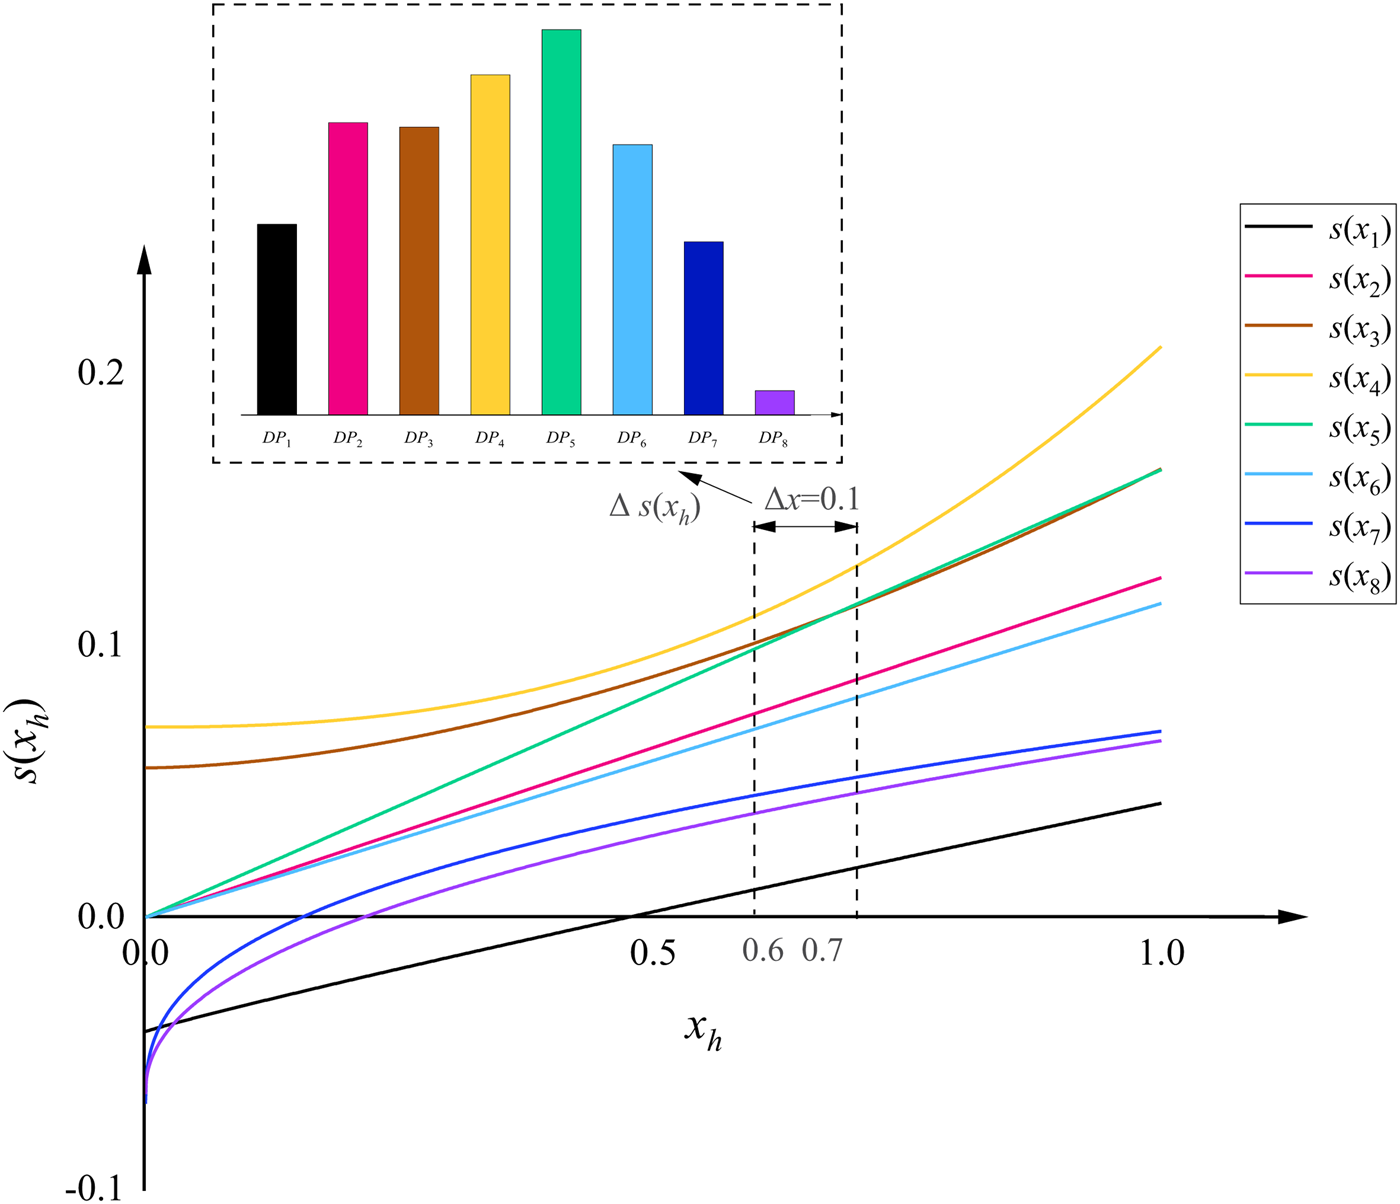
As shown in Figure 3, for ADPs, individual customer satisfaction increases exponentially with the increase of xh. For ODPs, the individual customer satisfaction is still proportional to xh, but the proportional coefficient is not just one. For MDPs, the increasing amount of customer satisfaction level will decrease gradually with the increase of xh. For IDPs, customer satisfaction will not change as xh increases. Owing to the consideration of customer satisfaction sensitivity at an early redesign stage, enterprise is enabled to satisfy customers more efficiently while cost less compared with those who do not consider the sensitivity.
Explanation of s(xh).

Formulate total engineering cost
To support product redesign, various resources must be invested, such as the redesign time, manufacturing cost, advanced equipment, and human resource that are usually measured by financial terms (such as engineering cost) at the redesign planning stage (Zhong et al., Reference Zhong, Zhou and Chen2014). Engineering cost depends on fulfilment levels of DPs, so it is regarded as the sum of cost required for fulfilling the corresponding level of each DP, as illustrated in Eq. (11).
 $$C = \sum\limits_{h{\rm = \ 1}}^H {c_hx_h{\rm , \;}} {\rm \;}$$
where c h is a cost coefficient for the unit fulfilment level of DPh. c h is a normalized value of estimated cost provided by design teams. It needs to be invested into the improvement of DPh if the fulfilment level reaches 1.
Formulate redesign model
Redesign aims to achieve an optimal trade-off between customer satisfaction and enterprise profit. Thus, an objective function based on the principle of shared surplus for product redesign (Jiao and Zhang, Reference Jiao and Zhang2005) is established in Eq. (12). Range limits and engineering constraints are shown in Eqs (12a)–(12e).
 $${\rm max}\,p{\rm} = \displaystyle{{\sum\nolimits_{h{\rm = \ 1}}^H {s_h} } \over {\sum\nolimits_{h{\rm = \ 1}}^H {c_hx_h} }}.$$
Subject to
 $$x_h{\rm} = \sum\limits_o {d_{ho}x_{ho}{\rm , \;for}\,{\rm the}\,{\rm discrete\;} {\rm DP}_h},$$
 $$\sum\limits_o {x_{ho}} = {\rm 1, \;for}\,{\rm the}\,{\rm discrete}\, {\rm DP}_h,$$
 $$x_{ho}\in {\rm { \ 0, \;1} \ , \;for}\,{\rm the}\,{\rm discrete}\, {\rm DP}_h,$$
 $$x_h{\rm} = \left\{{\matrix{ {\displaystyle{{( {X_h - X_{{\rm min}}} ) } \over {( {X_{{\rm max}} - X_{{\rm min}}} ) }}} \cr {\displaystyle{{( {X_{{\rm max}} - X_{\rm h}} ) } \over {( {X_{{\rm max}} - X_{{\rm min}}} ) }}} \cr } } \right.{\rm , \;for\;}\,{\rm the}\,{\rm continuous\;}\,{\rm and}\,{\rm positive\; DP}_h,$$
 $${\rm 0}< x_h{\rm \le }{\rm 1, }\;{\rm for}\,{\rm the}\,{\rm continuous}\, {\rm DP}_h,$$
 $$x_h^l {\rm < }x_h{\rm \le }x_h^u ,$$
 $$x_q{\rm} = f( x_h{\rm ) , \;}q\ne h.$$
Equation (12a) presents the normalization of the discrete DPs and (12b) imposes a constraint that only one feasible value is selected for each discrete DP. Equation (12c) defines that x ho is a binary variable. Equation (12d) concerns the normalization of continuous DPs, and Eq. (12e) defines xh of the continuous DPs to be from 0 to 1. However, for a certain DP, the competitive pressures may raise the minimum requirement of the fulfilment level, and the technical restrictions may prevent the fulfilment level from reaching 1. In addition, complex design relationships between DPs also limit the fulfilment level. Therefore, Eqs (12f) and (12g) present the extra boundary conditions of xh and engineering constraints between DPs, respectively.
Summary of the proposed method
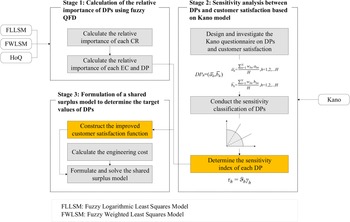
The proposed redesign process of P mainly comprises three stages: (1) calculation of relative importance of DPs using fuzzy-QFD; (2) sensitivity analysis between DPs and customer satisfaction based on Kano model; and (3) formulation of a shared surplus model to determine target values of DPs. The framework of the proposed product redesign method is depicted in Figure 4.
Framework of the proposed product redesign method.

Case studies
Two case studies are provided in this section to demonstrate the effectiveness and efficiency of proposed redesign methodology. They are the redesign of a braking system of automobile and redesign of a smartphone.
Case study 1: redesign of an automobile braking system
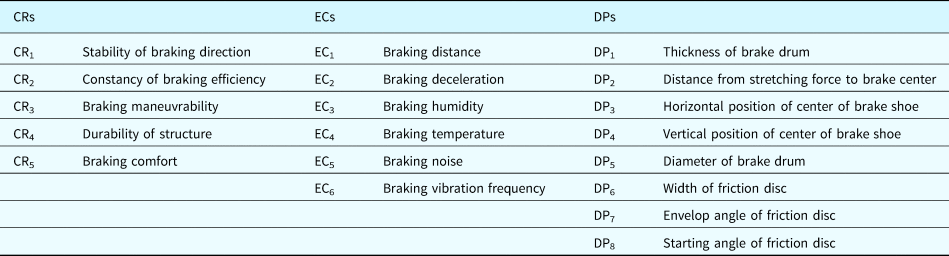
A good automobile braking system can significantly reduce possibility of traffic accidents. A case study for the redesign of an obsolete braking system of automobile is presented to demonstrate the effectiveness of the proposed approach. Collected by focus groups, online reviews, and individual interviews, five major CRs, six important ECs, and eight major DPs related to these CRs are listed in Table 2.
List of CRs, ECs, and DPs related to the braking system of automobile

Ten customers in different driving years weighted in [0.08, 0.11, 0.1, 0.075, 0.1, 0.1, 0.09, 0.12, 0.125, 0.1] are interviewed. Six designers with a weight vector of [0.21, 0.16, 0.14, 0.15, 0.19, 0.15] are invited to analyze correlations among CRs, ECs, and DPs. The relative importance of each CR, EC, and DP is calculated and given in Table 3.
Relative importance of each CR, EC, and DP

Determination of the sensitivity index of each DP
Kano questionnaire is designed as Table 1 for analyzing the sensitivity of customer satisfaction toward the variations of DPs. Based on survey results, the average satisfactions with negative and positive questions of each DP is plotted in a two-dimensional diagram. According to the enterprise and experience data, designers assigned  $l^{\rm \ast }$,
 $\;\beta _L^{\rm \ast }$ and
 $\beta _U^{\rm \ast }$ as 0.3, 30°, and 60°, respectively. According to the classification principle described in the section "Analysis of sensitivity between DPs and customer satisfaction”, the sensitivity category of each DP is determined as shown in Figure 5.
Sensitivity category.

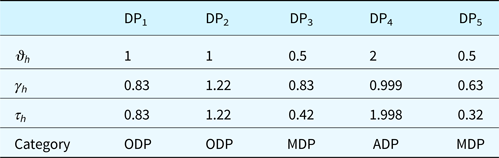
Based on sensitivity category, the basic sensitivity index  $\vartheta _h$ is obtained; and according to Eqs (3) and (4), the correction index γ h and final sensitivity index τ h of each DP are respectively calculated. The results are listed in Table 4.
Results of  $\vartheta _h$, γ h, and τ h

According to Eq. (10), the satisfaction function of each DP is illustrated in Figure 6. Obviously, corresponding improvements (s(xh)) of different DPs are significantly different when the fulfilment level of each DP increases from 0.6 to 0.7. Consistent with the sensitivity of customer satisfaction, the improvement of ADPs and ODPs has a greater impact on satisfaction than that of ODPs.
Customer satisfaction function of each DP.

Redesign model construction
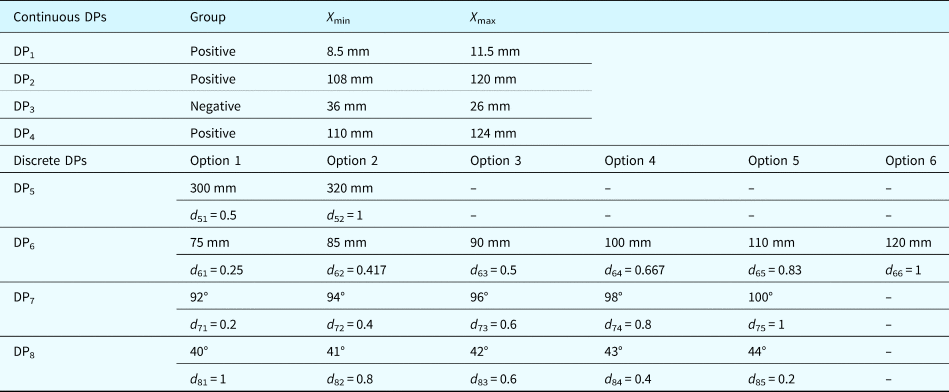
DP1, DP2, DP3, and DP4 are continuous DPs, and their specific technical values are normalized by Eqs (5) and (6). DP5, DP6, DP7, and DP8 are all discrete, and their corresponding normalized information is shown in Table 5. Let X = [x 1, x 2, x 3, x 4, x 5, x 6, x 7, x 8] denotes the fulfilment level of each DP. The initial implementation levels of DP5, DP6, DP7, and DP8 are {280 mm, 60 mm, 90°, 39}. The cost coefficient ch per unit fulfilment level of each DP is specified by the design team as {0.137, 0.132, 0.11, 0.125, 0.122, 0.118, 0.128, 0.128}.
Normalized information of DPs

Thus, combining the relative importance of DPs, sensitivity index determined in the section “Determination of the sensitivity index of each DP”, and cost coefficients, the redesign model is formulated in Eq. (13).
 $${\rm max}\,p = \displaystyle{{\matrix{0.084 \times 0.93x_1 + 0.142 \times 0.88x_2 + 0.11 (x_ 3^{ 1.71} + 0.5) \cr + 0.14(x_ 4^{2.41} + 0.5) + 0.147 \times 1.12x_ 5 + 0.11 \times 1.05x_ 6 \cr +0.137(x_ 7^{ 0.31} - 0.5) + 0.13(x_ 8^{0.45} - 0.5)} \over \matrix{ 0.137x_ 1 + 0.132x_ 2 + 0.11x_3 \cr + 0.125x_4 + 0.122x_5 + 0.118x_6 + 0.128x_7 + 0.128x_8.}}}$$
Subject to
 $$0.3{\rm \le }x_ 1{\rm \le } 1,$$
 $$0.25{\rm \le }x_ 2{\rm \le } 1,$$
 $$0{\rm.4}< x_ 3{\rm \le } 1,$$
 $$0.25{ \le }x_ 4{ \le } 1,$$
 $$x_{ho}\in {\rm { \ 0, \;1} \ , \;}h= {5, \;6, \;7, \;8},$$
 $$x_{ 51} + x_{ 52} = 1,$$
 $$x_{ 61} + x_{ 62} + x_{ 63} + x_{ 64} + x_{ 65} + x_{ 66} = 1,$$
 $$x_{ 71} + x_{ 72} + x_{ 73} + {x}_{ 74} + x_{ 75}= 1,$$
 $$x_{ 81} + x_{ 82} + x_{ 83} + x_{ 84} + x_{ 85}= 1,$$
 $$x_ 5 = \mathop \sum \limits_{o=1}^ 2 d_{5{\rm o}}x_{5{\rm o}},$$
 $$x_ 6 = \mathop \sum \limits_{o=1}^ 6 d_{6{\rm o}}x_{6{\rm o}},$$
 $$x_ 7 = \mathop \sum \limits_{o=1}^ 5 d_{7{\rm o}}x_{7{\rm o}},$$
 $$x_ 8 = \mathop \sum \limits_{o=1}^ 5 d_{8{\rm o}}x_{8{\rm o}},$$
 $${\rm If}\,x_ 5 = 0.5,\,{\rm then}\,x_ 6\in { {0.25, \;0.5, \;0.83} }, $$
 $${\rm If}\,x_ 5 = 1,\,{\rm then}\,x_ 6\in { {0.417, \;0.667, \;1} }, $$
 $$x_ 7 = x_ 8,$$
where Eqs (13a)–(13d) specify the boundary conditions for the fulfilment level of DP1 to DP4. The minimum fulfilment level is a value transformed from the average performance of major competitors in the industry. Equations (13e)–(13m) involve the normalization and relevant constraints of DP5 to DP8. Equations (13n) and (13o) specify the engineering constraints between DP5 and DP6. Equation (13p) shows the engineering constraint between DP7 and DP8.
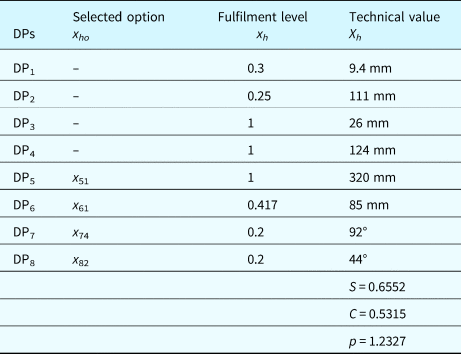
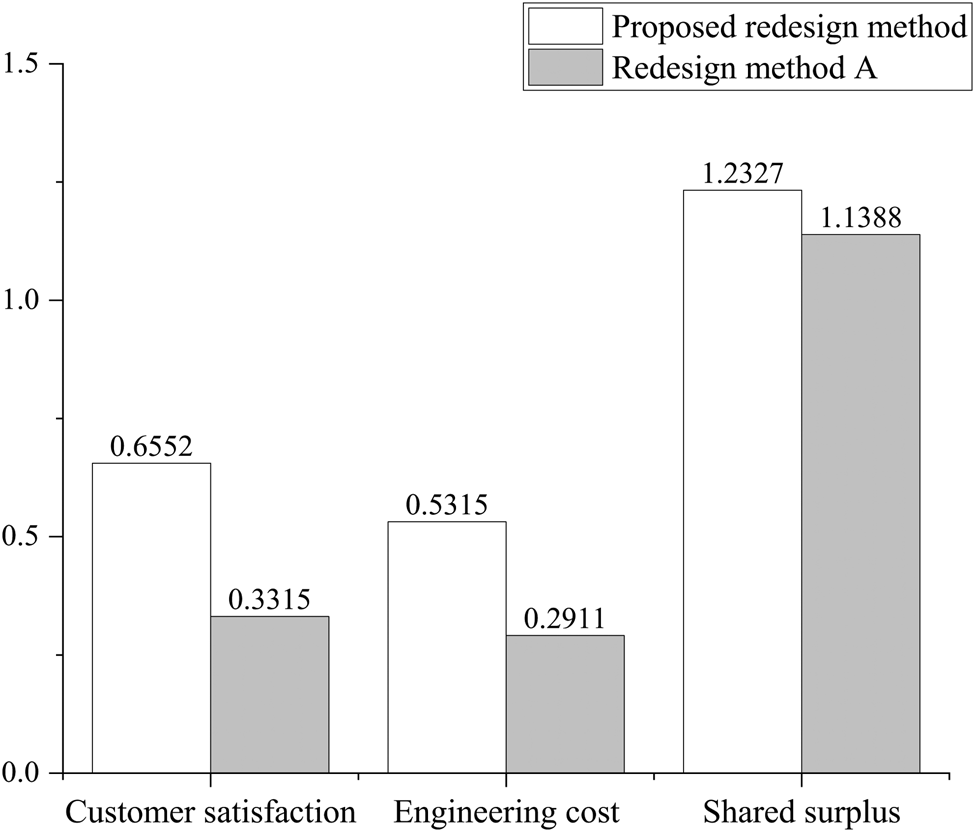
The redesign model is a mixed integer nonlinear programming model, and BONMIN solver in the MATLAB software is employed to solve the model and determine target values of DPs. As listed in Table 6, the results are consistent with the sensitivity characteristics of customer satisfaction for DPs in different categories. For the horizontal position of center of brake shoe (DP3) and the vertical position of center of brake shoe (DP4), the fulfilment levels both reach 1. When both brake shoe support ends do not interfere with each other, the vertical position of center of brake shoe should be as high as possible, and the horizontal position should be as narrow as possible. Within permitted safety scope, a higher fulfilment level of th ehorizontal and vertical position of center of brake shoe can result in higher braking maneuvrability and customer satisfaction. For the envelop angle of friction disc (DP7) and starting angle of friction disc (DP8), the fulfilment levels are only 0.2. As MDPs, higher fulfilment levels of these two DPs will cost higher while does not generate correspondingly higher customer satisfaction. Thus, appropriate fulfilment levels of envelop and starting angle of friction disc are valid enough to improve wear uniformity and braking efficiency. In the obtained scheme with an optimal trade-off between customers and enterprise, the overall customer satisfaction, engineering cost, and shared surplus value are derived in Table 6, namely 0.6552, 0.5315, and 1.2327, respectively.
Results of the redesign model

Case study 2: redesign of a smartphone
In order to verify the generality of the proposed method, we optimized redesign parameters for some functions of a smartphone. Collected by focus groups, online reviews, and individual interviews, five CRs, and four ECs and five DPs related to these CRs are listed in Table 7.
List of CRs, ECs and DPs related to the smartphone

Five decision makers weighted in [017, 0.25, 0.25 0.15, 0.18] are interviewed and invited to analyze the correlations among CRs, ECs, and DPs. The relative importance of each DP, that is w DP, is calculated as [0.218, 0.819, 0.204, 0.198, 0.191]. Thirty customers are invited to fill the Kano questionnaire to analyze the sensitivity of customer satisfaction toward the variations of DPs. Based on survey results, the average satisfactions with negative and positive questions of each DP are plotted in a two-dimensional diagram. Designers assigned  $l^{\rm \ast }$,
 $\;\beta _L^{\rm \ast }$, and
 $\beta _U^{\rm \ast }$ as 0.4, 30°, and 60°, respectively. According to the classification principle described in the section “Analysis of sensitivity between DPs and customer satisfaction”, the sensitivity category of each DP is determined as shown in Table 8. Based on sensitivity category, the basic sensitivity index
 $\vartheta _h$, correction index γ h, and final sensitivity index τ h of each DP are calculated and listed in Table 8, respectively.
Results of  $\vartheta _h$, γ h, and τ h

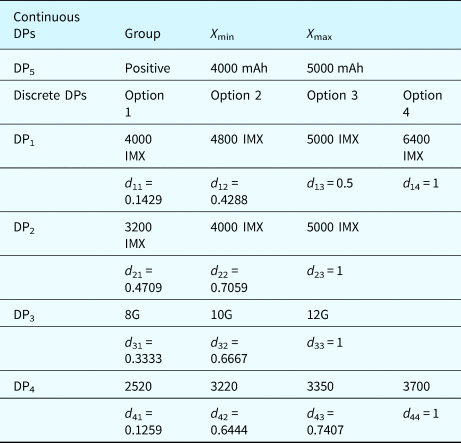
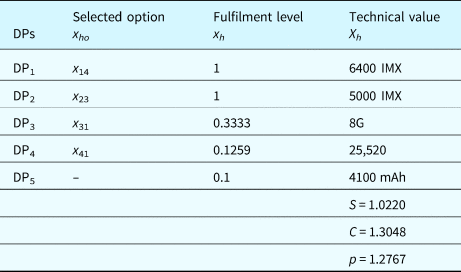
DP5 is continuous, and its specific technical values are normalized. DP1, DP2, DP3, and DP4 are discrete, and their corresponding normalized information is shown in Table 9. Let X = [x 1, x 2, x 3, x 4, x 5] denote the fulfilment level of each DP. The cost coefficient ch per unit fulfilment level of each DP is specified by the design team as [0.13, 0.445, 0.873, 0.743, 0.625]. Thus, combining the relative importance, sensitivity index, and cost coefficients of DPs, the redesign model is formulated. The results are provided in Table 10.
Normalized information of DPs

Results of the redesign model

From Table 10, the results of each DP, except for CPU score (DP4), are consistent with the sensitivity characteristics of customer satisfaction for DPs in different categories. For the rear camera pixel (DP1) and front-facing pixel (DP2), the fulfilment levels both reach to 1. The camera pixel directly influencing the shooting effect. In particular, the fulfilment level of CPU score (DP8) is only 0.1259. One possible reason for the relatively low improvement of DP8 is high cost of redesign. In the obtained scheme with an optimal trade-off between customers and enterprise, the overall customer satisfaction, engineering cost, and shared surplus value are derived in Table 10, namely 1.0220, 1.3048, and 1.2767, respectively.
Comparison analysis and discussion
One of the innovations of this study is proposing a novel shared-surplus function as the final optimization target for product redesign, so the differences between the comparison method and the proposed method were mainly focus on objective functions. Due to space constraints, a comparative analysis is not included in the main text to the second case.
Comparison with the redesign method without considering customer satisfaction
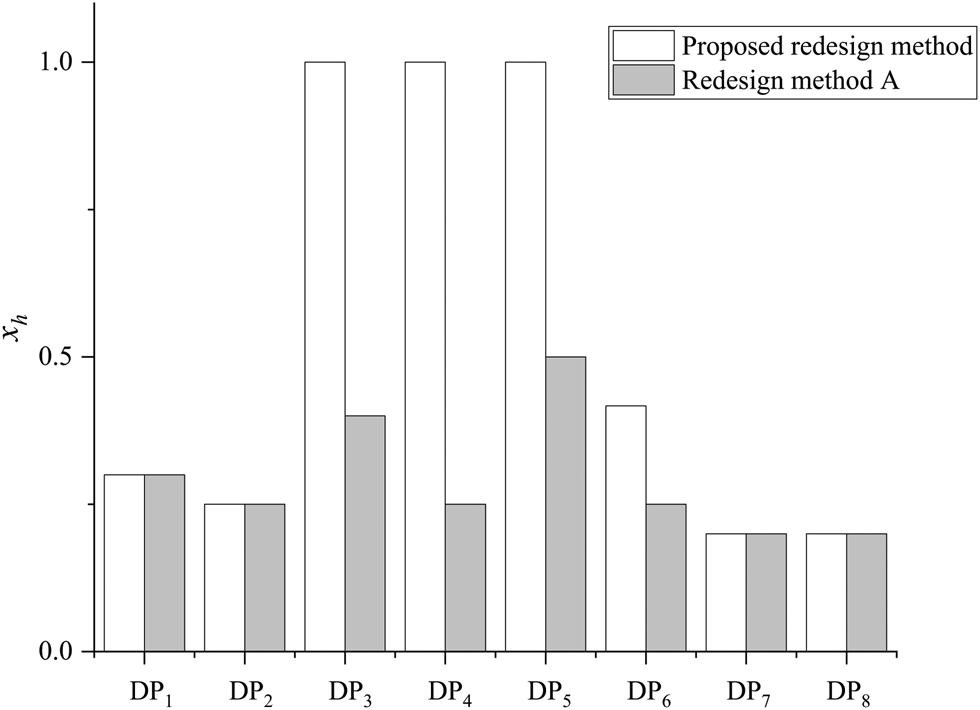
The traditional redesign process usually focuses on reducing cost, restoring performance, and even improving performance, rather than optimizing customer satisfaction. To verify the effectiveness and rationality of the proposed redesign method, a traditional method (we call it “redesign method A”) (Janz et al., Reference Janz, Sihn and Warnecke2005) is adopted to redesign the obsolete braking system of automobile. In redesign method A, the optimization objective of the proposed redesign method has been changed to the minimization of engineering cost, where customer satisfaction has not been considered. By redesign method A, the final fulfilment level of DPs is solved as [0.3, 0.25, 0.4, 0.25, 0.5, 0.25, 0.2, 0.2], and the comparison results are shown in Figure 7.
Comparison of the DPs with redesign method A.

Obviously, the fulfilment level of the horizontal position of center of brake shoe (DP3), the vertical position of center of brake shoe (DP4), the diameter of brake drum (DP5), and the width of friction disc (DP6) obtained by the proposed redesign method is higher than those obtained by redesign method A. In this study, the horizontal position of center of brake shoe (DP3) and the vertical position of center of brake shoe (DP4) are identified as ADPs, and the diameter of brake drum (DP5) and the width of friction disc (DP6) are identified as ODPs by sensitivity analysis. Among different DP categories, ODPs lead to a positive and linear level of customer satisfaction, ADPs result in a higher level of customer satisfaction than ODPs. When input force is constant, a larger diameter of brake drum (DP5) guarantees larger braking torque and stronger heat dissipation capacity. The width of the friction disc (DP6) affects friction area. The larger the friction area, the smaller unit pressure the friction disc has received, and the better wear characteristic it has. With higher fulfilment levels of these DPs, the redesigned product is enabled to gain higher customer satisfaction and become more competitive.
According to the optimized DPs in Figure 7, the relative customer satisfaction, engineering cost, and shared surplus are calculated and illustrated in Figure 8. The overall customer satisfaction and engineering cost of redesign method A are 0.3315 and 0.2911, respectively. Although the optimal solution obtained by redesign method A is more economical than that by the proposed redesign method, the latter one has higher customer satisfaction. The shared surplus value obtained by redesign method A is 1.1388 while the proposed redesign method can provide a larger shared surplus value of 1.2327, which indicates a better strategy for leveraging upon customer satisfaction and engineering cost.
Comparison of customer satisfaction, engineering cost, and shared surplus with redesign method A.

Comparison with the redesign method without considering customer satisfaction sensitivity
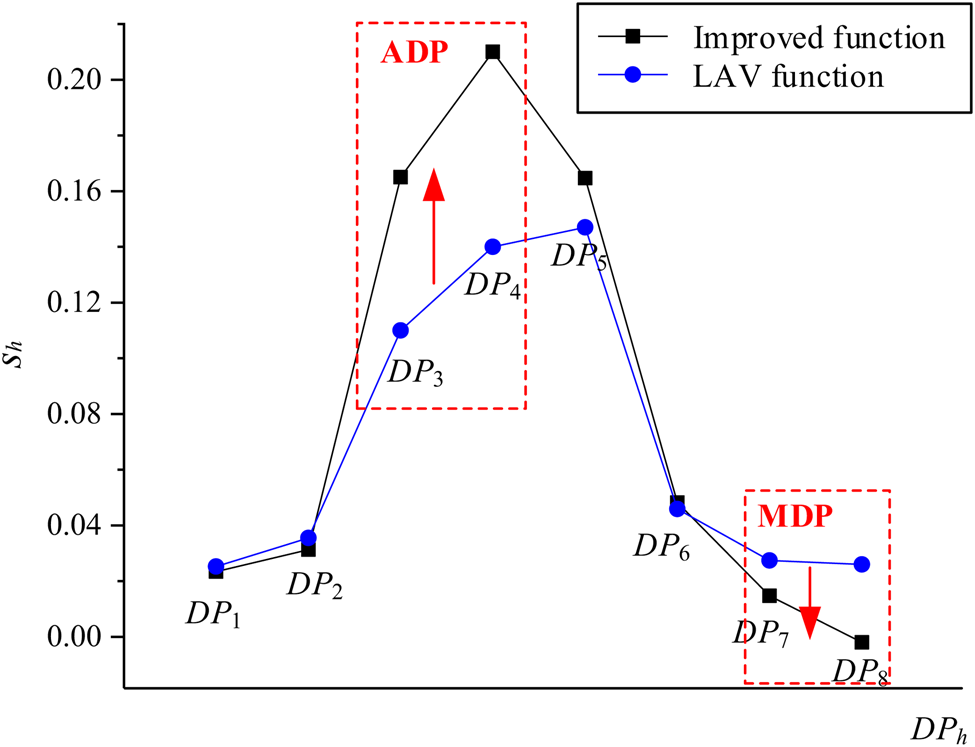
To illustrate the advantage of improved customer satisfaction function, the results of fulfilment level obtained by the proposed method, that is, X = [0.3, 0.25, 1, 1, 0.5, 0.417, 0.2, 0.2], is employed into a linear additive value (LAV) function (Poel, Reference Poel2007). The comparison results of individual customer satisfaction are shown in Figure 9.
Comparisons of the customer satisfaction for each DP.

The individual customer satisfactions of the horizontal position of center of brake shoe (DP3) and the vertical position of center of brake shoe (DP4) with the fulfilment level of 1 obtained by improved function and LAV function are 0.165 and 0.11, and 0.21 and 0.14, respectively. Likewise, the individual customer satisfactions of envelop angle of friction disc (DP7) and starting angle of friction disc (DP8) with the fulfilment level of 0.2 obtained by two functions are 0.01468 and 0.0274, and −0.002 and 0.026, respectively. Obviously, the individual customer satisfactions of the horizontal position of center of brake shoe (DP3) and the vertical position of center of brake shoe (DP4) obtained by the improved function are both higher than those by the LAV function, while those of envelop angle of friction disc (DP7) and starting angle of friction disc (DP8) are both lower. In this study, DP3 and DP4 are identified as ADPs, and DP7 and DP8 are identified as MDPs by sensitivity analysis. The intervention of sensitivity can effectively amplify the differences between individual customer satisfactions achieved by DPs in different categories with the same fulfilment level, especially for ADPs and MDPs. As applied pressure during braking, friction disc will be subject to wear and tear after a period of usage. Friction disc replacement is easy and common for customers, so the change of envelop angle and starting angle of friction disc (DP7 and DP8) are not primary contributors to the fluctuations of customer satisfaction. The improved function with sensitivity analysis can help designers recognize critical DPs that have great sensitive impact on customer satisfaction and enhance decision support of redesign.
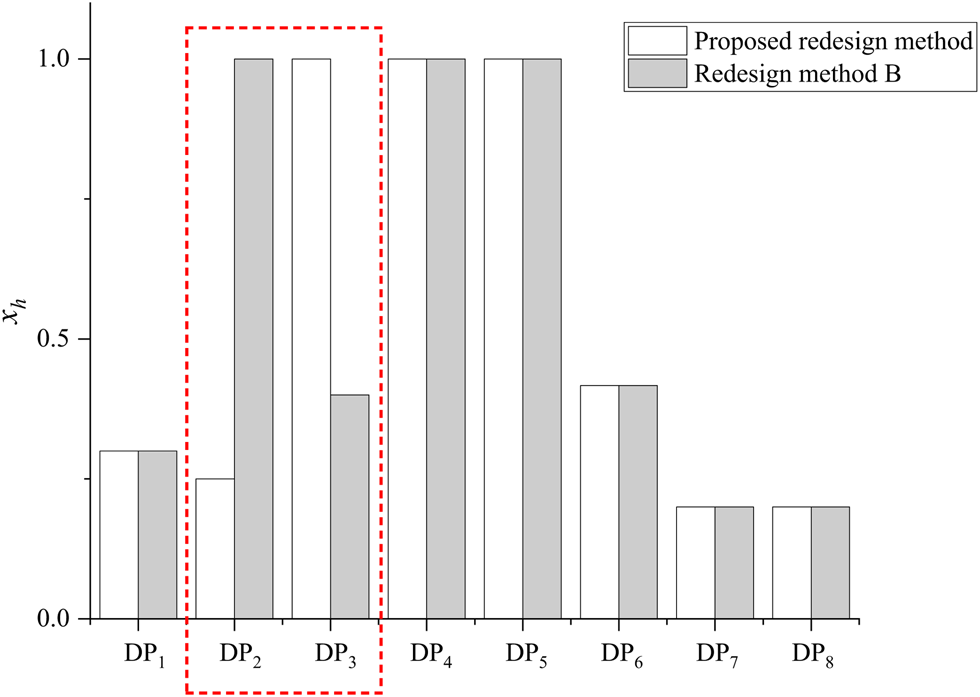
To demonstrate the efficiency and validity of the proposed redesign method, the improved customer satisfaction function in the shared surplus model is replaced by the LAV function to redesign the obsolete braking system of automobile, which does not consider the sensitivity of customer satisfaction (we call it “redesign method B”). By this method, the final fulfilment level of DPs is [0.3, 1, 0.4, 1, 1, 0.417, 0.2, 0.2], as shown in Figure 10. The fulfilment level of distance from stretching force to brake center (DP2) and the horizontal position of center of brake shoe (DP3) obtained by the two different redesign models are 0.25 and 1, and 1 and 0.4, respectively. Obviously, the fulfilment level of distance from stretching force to brake center (DP2) obtained by the proposed redesign method is lower than the one by redesign method B, while the fulfilment level of the horizontal position of center of brake shoe (DP3) is higher than the later one. In this study, distance from stretching force to brake center (DP2) is an ODP with relative high cost, and the horizontal position of center of brake shoe (DP3) is an ADP with the lowest cost. For ADPs, individual customer satisfaction increases exponentially with the increase of fulfilment levels of DPs. For ODPs, individual customer satisfaction is still proportional to the fulfilment levels of DPs, but the proportional coefficient is not just one. Balancing the fulfilment of distance from stretching force to brake center (DP2) and the horizontal position of center of brake shoe (DP3), the proposed redesign method achieved a higher customer satisfaction in a cost-effective manner.
Comparison of the DPs with the redesign method B.

The overall customer satisfaction and engineering cost of redesign method B are 0.5975 and 0.5645, respectively. As shown in Figure 11, the optimal solution obtained by redesign method B has lower customer satisfaction and is less economical than that by the proposed redesign method. The shared surplus value obtained by redesign method B is 1.0584 while the proposed redesign method can provide a larger shared surplus value of 1.2327. Thus, considering customer satisfaction sensitivity in product redesign is vital for enhancing the competitiveness of products. The proposed redesign method is more effective in modern frenetic competitive market.
Comparison of customer satisfaction, engineering cost, and shared surplus with redesign method B.

Summarization
From the results in the section “Comparison with redesign method without considering customer satisfaction sensitivity”, the intervention of sensitivity can effectively amplify the differences between individual customer satisfactions achieved by DPs in different categories with the same fulfilment level, especially for ADPs and MDPs. The improved function with sensitivity analysis can help designers recognize critical DPs that have a great sensitive impact on customer satisfaction and enhance decision support of redesign.
The applications for industrial case study on an automobile braking system and smartphone revealed the importance of a shared surplus redesign model. Using a shared surplus model, redesign cost may be higher than that of cost-focused models, but customer satisfaction increases significantly. The proposed redesign method can provide a larger shared surplus value, which indicates a better strategy for leveraging upon customer satisfaction and engineering cost. In this case, the product is more competitive in market. Thus, the redesign method proposed in this study is more desirable in promoting product competitiveness and enterprise competitiveness comprehensively.
Conclusion
Redesign has been recognized as an effective method to improve performance of obsolete functions. Customer satisfaction is a nonnegligible contributor to remain the market competitiveness. However, few studies taken the interactions between cost concerns and customer satisfaction as an optimization goal in the product redesign model. Previous studies on customer satisfaction also have their own shortcomings, that is lacking of sensitivity analysis of customer satisfaction with respect to the variations of DPs. To solve the above issues, this study improved the linear additive value function about customer satisfaction considering the sensitivity of customer satisfaction toward the variations of DPs, and established a redesign model considering interactions between customer satisfaction and engineering cost. This study is summarized as follows.
(1) A sensitivity index is defined based on Kano model for differentiating the impact of different DPs on customer satisfaction. Considering this sensitivity, traditional linear additive value function about customer satisfaction is improved.
(2) The sensitivity of customer satisfaction is incorporated into the main evaluation benchmarks in redesign model, and a shared surplus model is employed for measuring interactions between customer satisfaction and engineering cost.
(3) Redesign of an automobile braking system and smartphone are implemented as case studies to illustrate the proposed methodology. The comparison analysis with traditional customer satisfaction function and redesign method demonstrates that the proposed sensitivity-enhanced redesign method can effectively distinguish the criticality of the DPs and promote the rationality of the redesign scheme.
The proposed redesign model refines the relationships between customer satisfaction and DPs with different sensitivity categories and makes the obtained customer satisfaction more accurate. It helps designers determine target values of DPs under an optimal trade-off between customer satisfaction and engineering cost and then enhances competitiveness. However, it is worth noting that the sensitivity of customer satisfaction with respect to the variations of DPs is actually complicated. Future work should be focused on the further study. Moreover, because of the subjectivity and vagueness, the semantic evaluation adopted in the correlations between CRs and DPs is defective. Thus, future work can focus on relevant operating data to improve the correlation analysis.
Funding
This project was supported by the National Natural Science Foundation, China (No. 51505480, 72001203).
Kaixin Sha received the B.S. degree in Management Science from Nanjing University of Finance and Economics in 2020. She is currently a master candidate in Management Science and Engineering at China University of Mining and Technology. Her general research interests are customer satisfaction analysis and customer requirements modeling and analysis.
Yupeng Li received the B.S. degree in Industrial Engineering, the M.S. degree in Resource Development and Planning from China University of Mining and Technology, Xuzhou, in 2006 and 2009, respectively, and the Ph.D degree in Mechanical Engineering from Shanghai Jiao Tong University in 2015. He is currently the Associate Professor in School of Mines, China University of Mining and Technology. His research interests include product evolution control and operation management of manufacturing and service systems.
Zhihua Zhao received the B.S. degree in Industrial Engineering, the M.S. degree in Management Science and Engineering from China University of Mining and Technology, Xuzhou, in 2018 and 2021, respectively. His general research interests are product degradation and redesign.
Na Zhang received the B.S. degree in Industrial Engineering, and the Ph.D degree in Mechanical Engineering from Chongqing University in 2019. She is a Lecturer in School of Mines, China University of Mining and Technology currently. Her research interests include product design and design change management.
Appendix
Survey questions in the case study
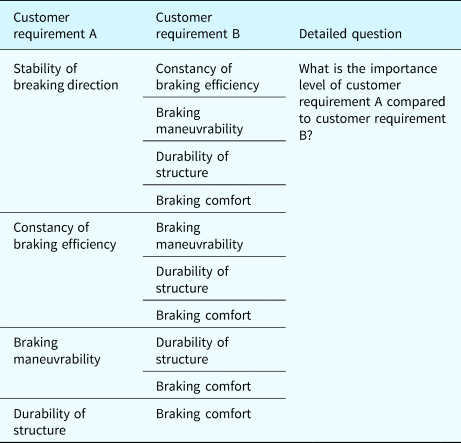
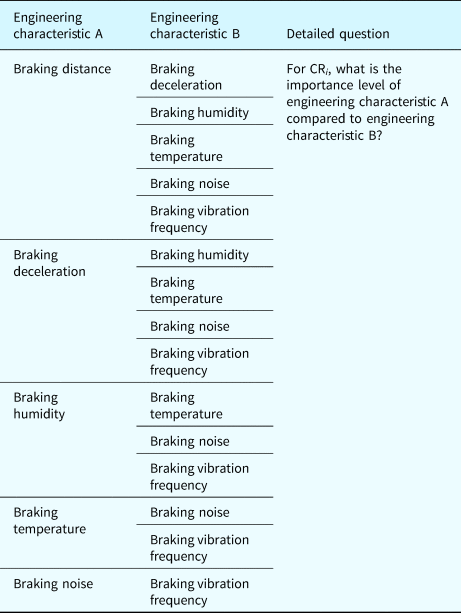
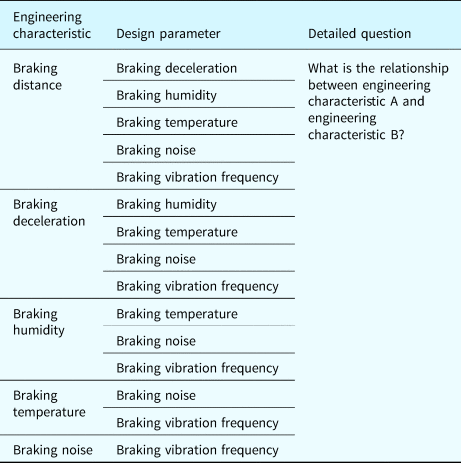
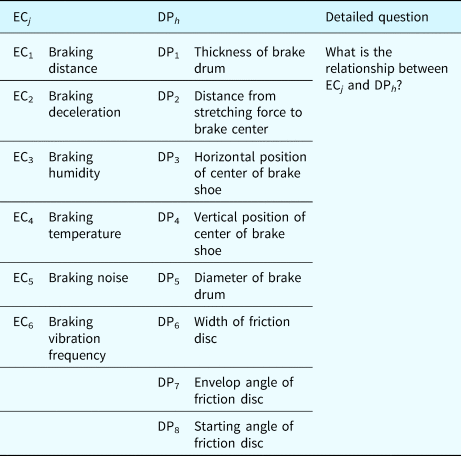
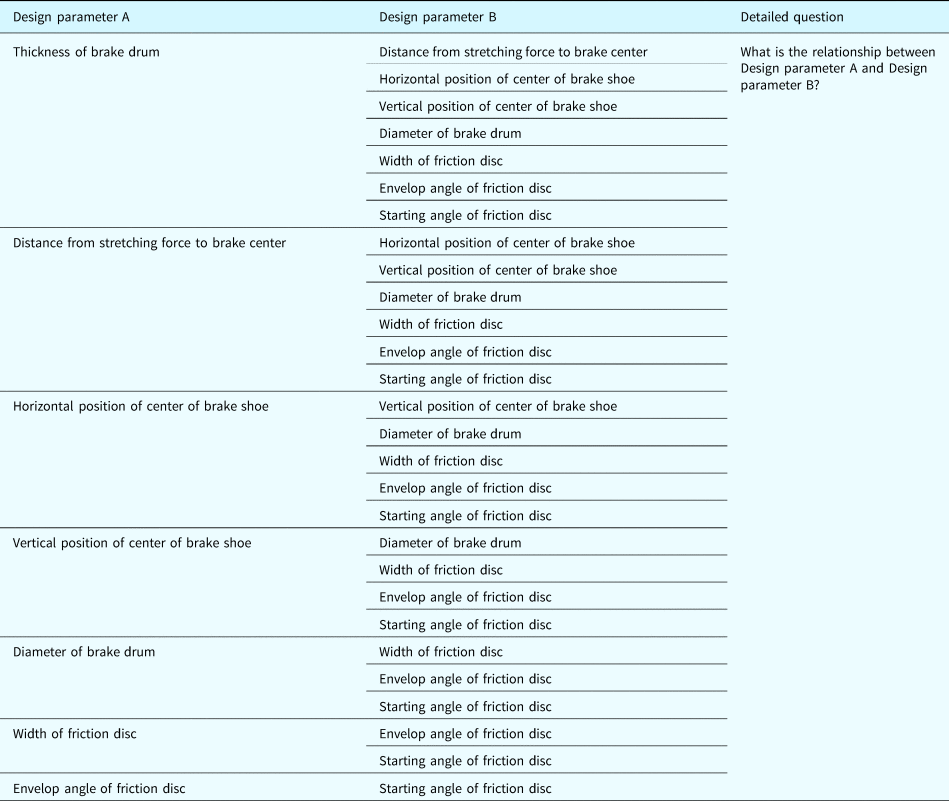
The answers for detailed question in Tables A1 and A2 are listed in Table A3. The answers for detailed question in Tables A4–A6 are listed in Table A7.
Importance pairwise comparison of CRs

Importance pairwise comparison of ECs to each CR

Importance comparison level

Relevance pairwise comparison of ECs

Relevance pairwise comparison between ECs and DPs

Relevance pairwise comparison of DPs

Relevance level