

This is a make-or-break moment for the European Union: the decisions we make today will determine whether Europe remains an area of stability, prosperity and freedom based on solidarity, responsibility and cohesion. (Jose Manuel Barroso, Reference Barroso2012)
There are endless reasons, mostly belonging to the order of geo-politics or of the international economy, why European integration may not be carried to a successful end. But if there is one single major reason why European integration might falter, of the EEC's own doing, it will be its failure to communicate directly with European society. (Ionescu Reference Ionescu1974: 19–20)
in the midst of the euro crisis sweeping across europe, public support for European integration seems more important than ever. The quote from Barroso above illustrates the problems European leaders will face in years to come, and the crucial choices they will have to make. Although the European Union (EU) has experienced crises in the past, the current situation breaks with past experiences in at least one vital respect: decisions can no longer be taken without popular consent. The days that European integration could be pushed forward without public scrutiny are over. During the past decades the EU has moved away from a largely elite-led diplomatic project to a system of multilevel governance in which member states share policy-making with supranational institutions, such as the European Commission (EC), the European Central Bank (ECB) and European Parliament (EP). This shift in the power balance between national governments and supranational institutions has not gone unnoticed by the public, especially not during the current crisis. At present, we are witnessing increased public contention over European matters in election and referendum campaigns, as well as party and media discourse (van der Eijk and Franklin Reference van der Eijk and Franklin2004; Hobolt Reference Hobolt2009; Hooghe et al. Reference Hooghe, Marks and Wilson2002; Kriesi et al. Reference Kriesi, Grande, Lachat, Dolezal, Bornschier and Frey2006, Reference Kriesi, Grande, Lachat, Dolezal, Bornschier and Frey2008; Steenbergen et al. 2007; Tillman Reference Tillman2004, Reference Tillman2012; de Vreese 2003; de Vries 2007; de Vries and Edwards 2009, to name a few). Questions are being raised about where the train of European integration is heading, who is in the driver's seat, and if member states are getting a return on investment. The permissive consensus that characterized European integration for decades has unravelled (Hooghe and Marks Reference Hooghe and Marks2009). Ghiţǎ Ionescu already outlined the crucial importance of connecting EU elites and institutions to the lives of everyday citizens for the survival of the European project in 1974 (see quote above).
Many journalists, pundits and politicians suggest that citizens are increasingly moving away from the European project. Similarly, academics have argued that the public in both East and West is becoming increasingly sceptical of European integration (Boomgaarden et al. Reference Boomgaarden, Schuck, Elenbaas and de Vreese2011; Eichenberg and Dalton Reference Eichenberg and Dalton2007; Harmsen and Spiering Reference Harmsen and Spiering2004; Hooghe and Marks Reference Hooghe and Marks2007; Markowski and Tucker Reference Markowski and Tucker2010, among others). Yet, a largely unexplored question is how fickle or predictable public opinion towards European integration actually is (for the two exceptions see Stoeckel 2013; de Vries and Steenbergen Reference de Vries and Steenbergen2013). While past research often implicitly assumes support for European integration to reflect fixed attitudes (for example, 50 per cent of European citizens view EU membership as ‘a good thing for their country’), recent contributions in public opinion research suggest that it might also be useful to think of attitudes as inherently variable, reflecting differential degrees of certainty and ambivalence (see Alvarez and Brehm Reference Alvarez and Brehm2002 for an overview). Indeed, European integration remains one of the most complex political issues that European publics face today. Much of the day-to-day debate involves highly technical questions that citizens may find difficult to grasp. Also, the integration process is multifaceted and can be presented from numerous policy angles. It should not be a surprise, then, that citizens may be deeply conflicted about the prospect of further integration. For example, they may like the idea in the abstract as it secures peaceful state cooperation, but at the same time may not have much appreciation for the actual policies that the EU pursues. Or they may like certain policies, such as environmental protection and standard setting, while objecting to others, such as the strengthening of the free market. Or they may like the majority of policies coming from Brussels, but object to the political process that yields them. In short, numerous reasons exist for why European citizens can be expected to be ambivalent (Stoeckel Reference Stoeckel2013; de Vries and Steenbergen 2013).
This contribution highlights the ambivalent nature of public opinion towards European integration. Attitudes marked by ambivalence are held with less certainty, are retrieved from memory with more difficulty and, on average, tend to be less stable over time (Alvarez and Brehm Reference Alvarez and Brehm2002; Zaller Reference Zaller1992). I show that ambivalence is higher in the West than in the Central and Eastern member states. This discrepancy, I argue, is probably due to the fact that as countries in the West have been EU members for a longer time the accumulated experience with membership has instigated debate about the positive and negative aspects of integration. In the East, membership of the EU is a fairly new phenomenon that was largely perceived as beneficial to the strengthening of the market economy and the democratic rule of law (see also Tverdova and Anderson Reference Tverdova and Anderson2004). Therefore, on average, opinions towards European integration are more unequivocal. The fact that ambivalence among West European citizens is best explained by uncertainty about the state of the economy and sense of national belonging underwrites the idea that response variation in support for European integration in the West is largely due to the ambiguous benefits of increased cooperation. In the East, by contrast, ambivalence towards European integration is more strongly fuelled by general factors, such as the political information that citizens possess and political parties provide.
These findings have three important consequences. First, this study calls for a revision of the current state of the art in the research on public opinion towards Europe. It shows that support for European integration is variable. As such, it does not suffice to establish merely the central tendency of support, may it be Eurosceptic or not; one should also establish the variance in support, that is to say the certainty with which this belief is held. A failure to do so would lull one into the false belief that Europeans hold clear-cut opinions that either favour or oppose integration. Second, the finding that citizens hold ambiguous rather than fixed opinions about Europe is important as ambivalent citizens may be more susceptible to elite discourse. Research in the US context has demonstrated that attitudes characterized by ambivalence are more vulnerable to persuasion, and more likely driven by considerations that are made salient at that moment through media or party cues (see, for example, Lavine et al. Reference Lavine, Huff, Wagner and Sweeney1998; Zaller Reference Zaller1992). Third and finally, the differences between East and West that I report lead to the expectation that as citizens in Central and Eastern Europe gain more experience with both the negative and positive consequences of European integration in years to come ambivalence is likely to be on the rise.
The remainder of this study is structured as follows. In the next section, I briefly review the degree and variability in support for European integration in East and West using recent public opinion data. Subsequently, I present the concepts of attitude ambivalence and response variation, after which I outline the main theoretical expectations regarding the factors that influence ambivalence towards European integration. After discussing the data, method and operationalization, the fifth section presents the empirical results. Finally, I conclude by drawing several general lessons from the analysis and elaborating on the important implications of this analysis for the recent political developments within the EU.
Public Support for European Integration in East and West
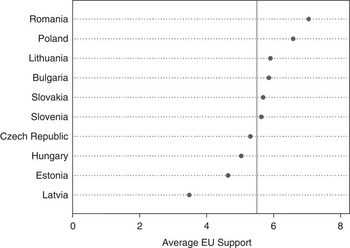
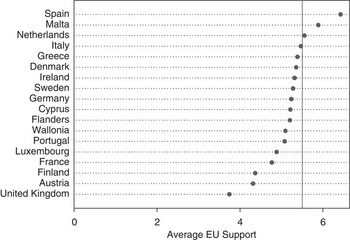
Until the late 1980s European integration was largely uncontested in the eyes of the general public. Recently, however, academics, journalists and politicians alike suggest that we have witnessed a drop in public support for European integration. In the early years, the European project was conceived as a technocratic and elite-driven project that allowed national elites to secure national interests. This period was characterized as the time of the ‘permissive consensus’ (Lindberg and Scheingold Reference Lindberg and Scheingold1970). As long as national elites could serve national interests through the establishment of European institutions, integration could be seen as nothing to worry about. Since the late 1980s, however, public support for European integration seems to have become less clear cut (Eichenberg and Dalton Reference Eichenberg and Dalton2007; Hooghe and Marks Reference Hooghe and Marks2007; de Vries and van Kersbergen 2007). The referendum outcomes in Denmark, Ireland in the early 1990s or the Netherlands and France in the mid-2000s, the ever-so-low turnout in the elections to the European Parliament as well as the levels of support for Eurosceptic parties in several national elections suggest a contemporary shift away from support for European integration (see, for example, Hobolt Reference Hobolt2009; Hobolt and Brouard Reference Hobolt and Brouard2011; de Vries 2007). Figures 1A and 1B provide an overview of the support for European integration in the East and West using data collected in the context of the 2009 European Parliamentary elections. The dots in the figures represent the average response in a country sample on an 11-point support for European integration scale where 0 indicates low and 10 high support. The vertical reference lines highlight the scale mid-point (5.5).
Average EU Support in Central and Eastern Europe
Notes: The dots represent the mean value of EU support in a country (on the y-axis), where 0 indicates low support and 10 high support. The vertical line depicts the middle of the scale (5.5).

Average EU Support in Western Europe
Notes: The dots represent the mean value of EU support in a country (on the y-axis), where 0 indicates low support and 10 high support. The vertical line depicts the middle of the scale (i5.5).

The first thing that stands out when reviewing the figures is that support for European integration is on average higher in the East than in the West. The average support in the East is 5.51, while it is 5.12 in the West, and this difference is statistically significant (p ≤ 0.001, two-tailed). We do, however, see quite some variation across countries. In the East, for example, the Romanians and Poles on average are very highly supportive of European integration, with mean values above 6, while the Latvians are much less supportive, with a mean value below 4. In the West, only the Spanish mean value exceeds 6 on an 11-point scale, while the British on average score below 4.
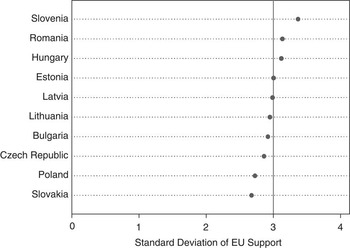
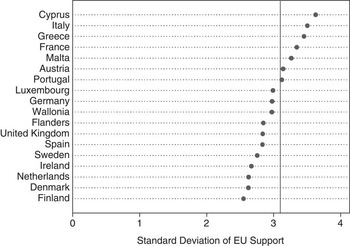
With the ever-growing importance of the EU to the lives of its citizens and the current euro crisis, the integration process itself has become increasingly contested. Consequently, it is important not only to explore the average support for European integration, but also to determine the certainty with which citizens hold these opinions. Therefore, Figures 2A and 2B provide an overview of the standard deviations in EU support across countries. The dots represent the standard deviations in each country, and the vertical reference line represents the average standard deviation across regions: that is, East versus West.
Standard Deviations in EU Support in Central and Eastern Europe
Notes: The dots represent the standard deviation of the 10-point EU support scale in a country (on the y-axis). The vertical line depicts the average value across all Central and Eastern European countries (3).

Standard Deviations in EU Support in Western Europe
Notes: The dots represent the standard deviation of the 10-point EU support scale in a country (on the y-axis). The vertical line depicts the average value across all Western European countries (3.12).

The figures indicate that on average the dispersion in support for European integration is slightly lower in the East, with 3.02, compared to 3.12 in the West, but this difference fails to reach statistical significance at conventional levels. At a glance the figures do suggest that standard deviations in the West display slightly more variation. Cyprus, Italy, Greece and France show standard deviations of about 3.5 or higher on a 10-point scale, while Finnish, Danish and Dutch citizens are much more in agreement, with standard deviations well below 3. These findings suggest that it may be too hasty to classify popular opinion towards European integration either as Eurosceptic or -enthusiast. A quick comparison to standard deviations in East and West of citizens’ left–right self-placements supports this idea. Although left–right ideology is also a sufficiently complex topic for citizens (Freire Reference Freire2006, Reference Freire2008), using the same 2009 European Election Survey (EES) data set shows that standard deviations in left–right self-placements in East and West are 2.82 and 2.66, respectively. These values are considerably lower than those we obtained for support for European integration, and these differences are statistically significant (p ≤ 0.001, two-tailed). Overall, these descriptive statistics highlight the importance of exploring the variability in attitudes towards European integration. This is especially pressing in the context of the current euro crisis, which should add to citizens’ uncertainties about Europe. Exploring and explaining attitude ambivalence concerning European integration is the topic I turn to next.
Attitude Ambivalence: A Missing Link
Public support for European integration has interested EU scholars for over 30 years now. Although we know a great deal about the determinants of support, we know very little about the extent to which European citizens actually hold clear-cut opinions. In the previous section, I demonstrated that attitude variability concerning European integration is widespread and high compared to other important political predispositions such as citizens’ left–right self-placements. The fact that support for European integration proves to be highly variable highlights the importance of not only establishing and explaining the central tendency of support, but also exploring its variance – or, put differently, examining the degree of ambivalence towards Europe. This raises the question of what exactly we mean when we talk about the ambivalence of attitudes.Footnote 1
For almost eight decades now, surveys have been the empirical backbone of public opinion research. Posing questions to a randomly selected subset of citizens is the essential tool that allows researchers a glimpse of the collective preferences of the mass public. But what exactly drives the survey response? For years, the answer to this question has been that survey responses are driven by a fixed, albeit unobservable, attitude plus random measurement error that is due to the imprecision of survey items (for example, Achen Reference Achen1975). The key assumption here is that the attitude is a fixed point on a continuum. Thus, any and all response variation is a case of measurement error.
Recently, however, many public opinion scholars have moved away from the notion that attitudes are fixed points. At least three strands of theory lead one to conceptualize attitudes as inherently variable qualities. First, the evaluative space model of Cacioppo et al. (Reference Cacioppo, Gardner and Berntson1997) calls attention to the possibility that individuals are ambivalent – that is, they simultaneously like and dislike an attitude object. In this theory, the complete attitude is not defined as a single point but as a pair of points that characterize the intensity of liking and disliking, respectively. This introduces an element of variability into the attitude.
Second, Feldman and Zaller have conceptualized attitudes as distributions of considerations (Feldman Reference Feldman1995; Zaller and Feldman Reference Zaller and Feldman1992). To the extent that considerations vary in their evaluative implications, this automatically introduces variability into the attitude concept. In the extreme case, the attitude may be characterized by considerations with opposing evaluative implications, in which case the attitude is again characterized by ambivalence. Feldman and Zaller explicitly link their characterization of attitudes to the survey response by introducing the idea of sampling. When an individual answers a survey question, they argue, that person will engage in ‘top-of-the-head’ responding. This means that she samples at best a few considerations. Since the individual may draw different samples at different times, the expressed opinion will not always come out as identical. Thus, response variation is a direct consequence of the nature of attitudes.
Third, in a similar vein, Alvarez and Brehm (Reference Alvarez and Brehm2002) argue that citizens possess multiple predispositions, which may either be conflicting (ambivalence) or reconciled (equivocation). In the case of ambivalence, response variability should be greater, whereas it should be smaller in the case of equivocation. In addition, Alvarez and Brehm see a key role for information. A lack of attitudinally relevant information induces uncertainty, which in turn increases response variation (see also Alvarez and Brehm Reference Alvarez and Brehm1995, Reference Alvarez and Brehm1997, Reference Alvarez and Brehm1998, Reference Alvarez and Brehm2002).
The three theoretical approaches outlined here share as a common element the concept that response variation does not merely reflect measurement error but, importantly, also reflects qualities of the underlying attitudes themselves. I adopt this perspective here as well. Indeed, it is precisely because of its attitudinal sources that response variability is of theoretical interest instead of being a phenomenon that is merely of methodological concern.
In the present context, response variability is important for understanding support for European integration. While past studies have often implicitly assumed that public opinion reflects fixed attitudes, I believe it to be useful to think of these attitudes as inherently variable, reflecting differential degrees of certainty and ambivalence. Attitudes characterized by ambivalence are held with less certainty, are retrieved from memory with more difficulty and, overall, tend to be less stable over time (Huckfeldt and Sprague Reference Huckfeldt and Sprague2000; Zaller Reference Zaller1992). What is more, the ambivalence of attitudes not only makes citizens more vulnerable to persuasion (Zaller Reference Zaller1992), but also makes them more driven by whatever considerations are salient at that moment (Lavine et al. Reference Lavine, Huff, Wagner and Sweeney1998). Summing up, European integration remains one of the most complex political issues that European mass publics face, so understanding ambivalence is of crucial scientific and societal importance. The extent of ambivalence among Europeans is not only increasingly relevant for understanding the nature of public opinion towards European integration, but also informs ongoing work on the behaviour in national and European elections or EU referendums as well as the success of extreme right- or left-wing parties in rallying Eurosceptic sentiment (see, for example, Hobolt 2009; Hobolt et al. Reference Hobolt, Spoon and Tilley2009; Tillman Reference Tillman2004, Reference Tillman2012; de Vries 2007; de Vries and Edwards 2009). Although it should no longer come as a surprise that citizens are conflicted about the scope and depth of integration, we also need to understand the determinants of differences in response variability between individuals and countries. The next section outlines some key hypotheses.
Determinants of Ambivalence Towards Europe: Political Information and Perceived Benefit
I expect ambivalence towards European integration to be based on general determinants of attitude variability towards different political objects in different contexts, such as political information (Alvarez and Brehm 2000; Harbers et al. Reference Harbers, de Vries and Steenbergen2013) as well as display specific features related to European integration as such. Let me review both sets of explanations in turn.
As highlighted in the previous section, scholars of attitude ambivalence often stress the importance of political information. In particular, the work by Alvarez and Brehm (Reference Alvarez and Brehm1995, Reference Alvarez and Brehm1997, Reference Alvarez and Brehm1998, Reference Alvarez and Brehm2002) carves out the key role of political information in understanding ambivalence. The information that citizens possess or that political actors, most notably political parties, provide affects ambivalence in that a lack of attitudinally relevant information induces uncertainty among the public and increases response variation. When making up their minds about politics, citizens tap into the political information available to them. In most political systems there is considerable variation in this respect among the public (delli Carpini and Keeter 1996; Converse Reference Converse1962, Reference Converse1964; Luskin Reference Luskin1987), and these differences affect the ways in which people take up and make use of information (Zaller Reference Zaller1992). When studying the moderating influence of political information, one can distinguish between individual and contextual factors. At the individual level, scholars often differentiate between several voter characteristics that might be indicative of higher levels of readily retrievable political information, such as political attentiveness, interest or knowledge (see, for example, Luskin Reference Luskin1987). Here I look at two sources: attention to the news as well as political knowledge. I expect that respondents who pay more attention to, and are more knowledgeable about, politics will exhibit lower levels of response variation. All these expectations are derived from the idea that when a person is more politically informed, she has a higher aptitude to form a more well-defined (crystallized) attitude about politics (McGraw and Pinney Reference McGraw and Pinney1990).
Yet, scholars argue that the availability of personal information alone may not be enough to reduce response variation; the context may also matter greatly (Zaller Reference Zaller1992). If political actors, such as parties or journalists, provide citizens with opposing views on a political matter, even the most politically informed and active citizens may have difficulty integrating various elite cues (Rosenberg Reference Rosenberg1988). In other words, a lack of cue integration most probably results in an increase of response variability.Footnote 2 Relating these insights to the case of support for European integration, I expect that highly informed citizens are less ambivalent, but that ambivalence in support for European integration increases when parties present citizens with strongly competing views on the matter. My first set of hypotheses relates to the effect of personal and contextual information on the extent of response variability:
Political Information Hypothesis (H1A): When citizens are more informed about politics, the level of response variation in support for European integration should decrease, all else being equal.
Party Conflict Hypothesis (H1B): Higher degrees of party conflict are positively related to response variation in support for European integration, all else being equal.
I expect response variation in support for European integration not only to be a function of political information, but also to be related to particular aspects of the integration process itself. Specifically, I hypothesize citizens to hold more unequivocal views about European integration when the perceived benefits of membership are largely undisputed. The literature on support for European integration that I reviewed earlier highlights an array of potential benefits of European integration, mostly focusing on utilitarian and identity concerns (see, for example, Gabel Reference Gabel1998a, Reference Gabel1998b; Hooghe and Marks Reference Hooghe and Marks2005). I build on this work to argue that when citizens are less ambiguous about the state of the economy in their countries or about their sense of national belonging they should display less variation in support for European integration. In the case of the economy, for example, I expect those citizens who view the economy as doing particularly badly or particularly well to forcefully oppose or support the integration process, respectively. Either way, their attitudes towards European integration should be less ambivalent. I expect those who possess dual identities, that is to say those citizens who identify both with the nation state as well as the EU, to be more ambivalent when it comes to Europe. Citizens who identify only with their nation state or feel solely European are more likely to hold clear-cut views on Europe: to oppose European integration when national identities are strong, and to support it when European identities are strong (Hooghe and Marks Reference Hooghe and Marks2005). In both cases, ambivalence towards European integration is expected to be low compared to those holding dual identifications.
When it comes to benefits, I also expect contextual differences: namely, differences between member states in the East compared to the West. I hypothesize ambivalence towards European integration to be lower in the East versus the West. This is a result of the perceived benefit from membership. In countries of Central and Eastern Europe, membership in the Union is a fairly new phenomenon that was largely associated with the strengthening of the market economy and the democratic rule of law (see also Tverdova and Anderson Reference Tverdova and Anderson2004). Although opposition towards European integration of course exists within the East, especially among ‘old regime’ parties opposing the transition to democracy, and their supporters (Beichelt Reference Beichelt2004; Harmsen and Spiering Reference Harmsen and Spiering2004; Herzog and Tucker Reference Herzog and Tucker2010; Marks et al. Reference Marks, Hooghe, Nelson and Edwards2006; Rohrschneider and Whitefield Reference Rohrschneider and Whitefield2007), on average the financial and political benefits of EU membership are most likely to be higher in the East than in the West (Tverdova and Anderson Reference Tverdova and Anderson2004). Consequently, I expect more unequivocal support among the Central and East European public. The overall positive evaluation of membership in the East also manifested itself in the ‘yes’ votes in the accession referendums prior to 2004 (Szczerbiak and Taggart Reference Szczerbiak and Taggart2009). Countries in the West, however, have been EU members for a longer time and the accumulated experience with European integration has instigated debates about the positive and negative consequences of membership (Eichenberg and Dalton Reference Eichenberg and Dalton2007; de Vries and van Kersbergen 2007). By consequence, then, response variation in support for European integration is expected to be more extensive within West European member states. My second set of hypotheses relates to the effect of the degree of ambiguity about the benefits of membership at both the individual and contextual levels, which affects the extent of response variability in support for European integration:
Benefit Hypothesis (H2A): When citizens hold more ambiguous views about the state of the economy or their sense of national belonging, the level of response variation in support for European integration should increase, all else being equal.
East versus West Hypothesis (H2B): Response variation in support for European integration is higher within Central and East European member states compared to West European member states.
Data, Methods and Operationalizations
Data
In order to test these two sets of hypotheses, I rely on cross-national data from the European Election Survey 2009 (EES 2009). I utilize this data set as it allows me to examine the determinants of ambivalence in support for European integration across all EU member states. The survey was conducted among representative samples of the electorates in all 27 EU member states and focused on electoral behaviour and political attitudes. In each country, a representative sample of around 1,000 individuals was drawn. The data cover all 27 EU member states, to wit: Austria, Belgium, Bulgaria, Cyprus, the Czech Republic, Denmark, Estonia, Finland, France, Germany, Greece, Hungary, Ireland, Italy, Latvia, Lithuania, Luxembourg, Malta, the Netherlands, Poland, Portugal, Romania, Slovakia, Slovenia, Spain, Sweden and the United Kingdom. Note that I treat Belgium as two separate political systems.
Model
I estimate Harvey's heteroskedastic regression model (Reference Harvey1976). This method informed the model of response variation discussed by Alvarez and Brehm (Reference Alvarez and Brehm1995, Reference Alvarez and Brehm1998, Reference Alvarez and Brehm2002). Let yi denote individual i's response on a question concerning support for European integration. Further, let xi be vector of covariates that drive the individual's average response tendency on the question. Furthermore, let εi denote deviations from the average response. Finally, let zi denote a vector of covariates that drive the size of the deviations. Then, the heteroskedastic regression model may be formulated in the following manner:
 $$ \displaylines{ & {{y}i}\, = \,{{x}{i}}^{{\rm{\zeta }}} {}\beta \, + \,{{{\epsilon}}i} \cr & {\epsilon}\, \sim \,N (0,\sigma {{i}^2} ) \cr & \sigma {{i}^ 2} \, = \,exp({{z}i}^{{\rm{\zeta }}} \gamma ) \cr} $$
Here β and γ are vectors of regression coefficients. Note that γ includes a constant. If all other elements of this vector are simultaneously 0, then the variance model reduces to exp(γ0) and we obtain the classical linear regression model with homoskedastic errors.
In the analysis, I include the following elements in xi: subjective social class, occupation, education, gender, urban residency, support for national democracy and national government approval. I also include country effects to allow for cross-national differences in support for European integration. The vector zi includes two contextual variables, namely, a dummy for Central and Eastern Europe and party conflict over European integration, as well as four individual variables such as political knowledge, attention to political news reporting, dual identity and ambiguous economic evaluations.
Operationalizations
The dependent variable is support for European integration and is measured on an 11-point scale that runs from 0 (‘unification has already gone too far’) to 10 (‘unification should be pushed further’).Footnote 3 Thus, higher values imply greater support.
I estimate both a mean and variance model of support for Europe. Although this article focuses on the determinants of attitude variability in support for European integration, it is important to estimate an accurate mean model. Three explanations dominate the literature: the utilitarian, identity and national cues perspectives. Utilitarian theory is reliant on self-interested or macro explanations of political attitudes and suggests that citizens are more likely to support integration if it results in a net benefit to their pocketbooks (Anderson and Reichert Reference Anderson and Reichert1995; Gabel Reference Gabel1998a, Reference Gabel1998b). Gabel (Reference Gabel1998b) demonstrates that those who directly benefit from these economic gains – for example, the highly educated, highly skilled or farmers – exhibit greater levels of support. I operationalized the utilitarian perspective by using three different variables: namely, respondents’ subjective class identification, occupation and level of education. In the mean model, I thus included a series of class and occupational dummy variables: lower middle class, middle class, higher middle class and higher class identification, professionals, higher administrative staff, clerical staff, sales staff, service personnel, skilled worker, semi-skilled worker, unskilled worker, farm personnel, farm owner, and student; a lower-class identification and not having worked was treated as the respective baseline category. For education, I included the International Standard Classification of Education (ISCED) education level, which is cross-nationally comparable. Higher values imply more education.
The second perspective highlights identity considerations as a decisive force shaping support for the EU (Carey Reference Carey2002; Hooghe and Marks Reference Hooghe and Marks2005; McLaren Reference McLaren2002). The authors propagating this perspective highlight that, with a shift in the process of European integration from a mostly economic to a more political project, the criteria for evaluating the EU include economic as well as symbolic political considerations, especially feelings of national identity. The problem with these findings is that they are plagued by endogeneity. In other words, do you support European integration due to having a higher level of identification with Europe, or the other way around? For this reason, the analysis does not include a European identity variable in the mean model stage, although I do include ambiguity in identification in the variance model. In order to explore the robustness of the mean model, I did run the models reported here including opinions towards immigration as an independent variable, which does not change the results.
The third perspective highlights the importance of domestic political cues (Anderson Reference Anderson1998; Sanchez-Cuenca Reference Sanchez-Cuenca2000). These authors have found that citizens are generally uninformed about European integration and therefore lack the sophistication to act in their self-interest or national identification. Rather than self-interest or identity, citizens may rely on assessments about their own political system, political parties and government when forming opinions about integration. From this perspective, support for European integration can be interpreted as a referendum on the national political system, the incumbent government and established national political parties (Anderson Reference Anderson1998). In order to tap into this domestic politics perspective I included two variables tapping into a respondent's evaluation of a government record (coded 0 ‘disagree’ and 1 ‘agree’) and satisfaction with national democracy (coded 1 ‘low’ through 4 ‘high’). Finally, the mean model includes several controls: a respondent's age and gender (coded as a dummy that takes on the value 1 for women) as well as 27 political system dummies, with Wallonia operating as the baseline category.
The variance model includes a composite scale consisting of four knowledge questions. In the 2009 European Election Survey, survey respondents were asked to answer several true–false questions about the EU. A correct response was coded 1, whereas a false response or don't know was coded 0. The four items compose a scale (H < 0.30 using a Mokken scaling analysis). Consequently, I added them into a single (unweighted) index.Footnote 4 Attention to news is operationalized by the number of days a respondent watches TV news a week, ranging from 0 days to 7 days. Respondents’ ambiguity about their sense of national belonging and the state of the economy is captured by two different measures. First, dual identification is a dummy variable that takes on a value of 1 when a respondent identifies with her own country as well as with Europe, and 0 when a respondent identifies either solely with her country or with Europe at large. Second, the ambiguity about the state of their national economy is operationalized as 0 for those respondents who, when asked about their retrospective evaluation of the economy, answered that it either clearly improved or clearly worsened, and those providing more middling or don't know answers were coded as 1. The variance model also includes two contextual determinants of ambivalence: a dummy for Central and Eastern Europe and a variable tapping into party EU conflict. Party conflict is operationalized as the standard deviation of respondents’ mean placements of all party positions on a 11-point EU scale. For each country, I then averaged the standard deviations over all parties. The greater the standard deviation is, the less parties are in agreement about European integration.
Empirical Results
Mean Model
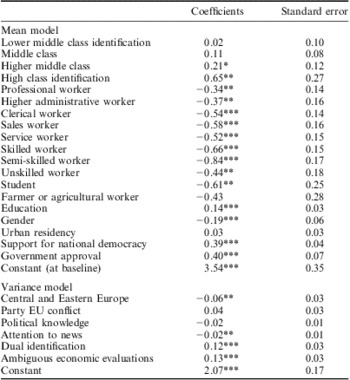
Although the emphasis in this study is on the variability of opinions towards European integration, I should spend a brief moment discussing the results from the mean model. Here, several individual differences manifest themselves, as can be seen in Table 1. The results show that both the utilitarian and domestic politics explanations play a central role in support for European integration. More highly educated people are more supportive of European unification than their less well-educated peers. Compared to people who have never worked (the baseline), professional, administrative and service personal, clerical and sales staff, students and blue-collar workers (skilled, semi-skilled and unskilled) are significantly less supportive of integration. Individuals with middle or higher class identification show higher levels of support for European integration compared to those with low class identification.
Heteroskedastic Regression Model of EU Support, Full Sample

Notes: Table entries are maximum likelihood heteroskedastic regression estimates and their robust standard errors. The analysis included country dummies treating Wallonia as the baseline. Working class serves as the baseline category for class identification and ‘never had a job’ is the baseline for occupation. Log-likelihood = −26572.758. ***significant at p ≤ 0.01; **at p ≤ 0.05; *at p ≤ 0.10 (one-tailed).
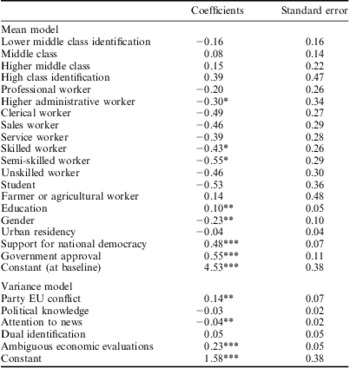
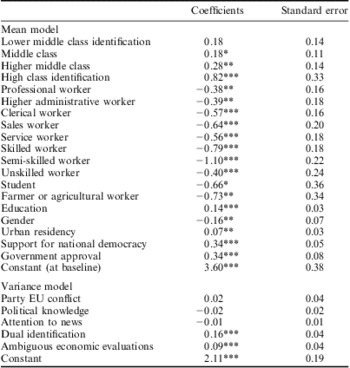
Tables 2A and 2B provide the same analysis, but now split the sample between Central Eastern and Western Europe. Although one ought to be slightly careful interpreting differences in statistical significance between both tables due to differences in sample size, splitting the sample does allow for a clear comparison between the East and West regions without having to add multiple interaction terms. When reviewing the differences between Tables 2A and 2B, it becomes clear that, while both education and domestic political evaluations are important determinants of EU support in both regions, occupation and class matter only in the West. This may not come as a surprise as literature on class voting in Central and Eastern Europe has shown that class identification is less important in the East compared to the West (for example, Evans Reference Evans2006; Tworzecki Reference Tworzecki2003). Cross-regional differences also manifest themselves in the baseline level of support for European integration – that is, the intercept. Here, I can note that the estimate obtained for the West is 3.60, and that the intercept in the East is almost 1-point higher at 4.53 on an 11-point scale.
Heteroskedastic Regression Model of EU Support, Central and Eastern Europe

Notes: Table entries are maximum likelihood heteroskedastic regression estimates and their robust standard errors. The analysis included country dummies treating the Czech Republic as the baseline. Working class serves as the baseline category for class identification and ‘never had a job’ is the baseline for occupation. Log-likelihood = −9051.005. ***significant at p ≤ 0.01; **at p ≤ 0.05; *at p ≤ 0.10 (one-tailed).
Heteroskedastic Regression Model of EU Support, Western Europe

Notes: Table entries are maximum likelihood heteroskedastic regression estimates and their robust standard errors. The analysis included country dummies treating Wallonia as the baseline. Working class serves as the baseline category for class identification and ‘never had a job’ is the baseline for occupation. Log-likelihood = −17501.941. ***significant at p ≤ 0.01; **at p ≤ 0.05; *at p ≤ 0.10 (one-tailed).
Variance Model
Most important for my purposes is the variance model. Let me review the model for both regions pooled together (see Table 1), as well as those for the two regions separately (see Tables 2A and 2B). I hypothesized that ambivalence towards Europe is both a function of political information and perceived benefit of membership. The evidence for the importance of political information is mixed (Hypotheses 1A and 1B). The variance model of the pooled analysis shows that, while I find a null effect for political knowledge, paying attention to political news decreases the level of ambivalence regarding European integration. Although I hypothesized that individuals with a large store of political knowledge would have better-crystallized attitudes towards European integration, I find no evidence for this expectation in either the pooled or the regional models. In the case of attention to politics news, I do find that those respondents that follow news more regularly display less response variation. However, when I review the two regional models, attention to news only decreases attitude ambivalence concerning European integration in Central and Eastern Europe. This seems to suggest that the information that citizens possess is more important in reducing attitude ambivalence in the East compared to the West.
The importance of information for attitude ambivalence towards Europe in the East is also illustrated by the effect of EU conflict among parties (Hypothesis 1B). While in the overall and West model, party EU conflict has no effect on ambivalence, in the East we find that increased party conflict makes citizens less certain about their EU preferences. When parties disagree about European integration, I find that citizens in Central and Eastern Europe display higher levels of response variation, and find no such effect in the West.
I also find East–West differences when it comes to the effect of perceived benefits on ambivalence towards European integration. While in the West both sources of ambiguity increase attitude ambivalence concerning European integration, in the East only the economy matters. These findings suggest that West European countries have been members for a longer time and that the accumulated experience with European integration has instigated debate about the positive and negative consequences of membership. This is less the case in the East, where political information matters as much as economic ambiguity (note that the coefficient for attention to news is smaller with 0.04 but the scale of this variable is 0–7, so overall the effects are of similar size), while national identification does not seem to matter. Yet, in the West the clearer the evaluations of the state of the economy are or the sense of national belonging is in the heads of respondents, the more able they will be to make up their minds about European integration.
These differences between East and West are confirmed by the pooled analysis provided in Table 1, which shows that ambivalence towards Europe is lower in the East compared to West. This finding is in line with Hypothesis 2B. The Central and Eastern Europe dummy is negatively signed and statistically significant. This regional difference also manifests itself when reviewing the baseline level of ambivalence regarding European integration – that is, the intercept. The intercept of 1.58 in the East is considerably lower than the 2.11-intercept in the West. The East–West discrepancy is probably due to the fact that countries in the West have been long-standing EU members, and that this accumulated experience with European integration may have led to more ambiguity about the benefits of membership. Since EU membership is a more recent phenomenon in the East, by 2009 citizens are still learning about the possible consequences.
Conclusion
Public support for European integration is discussed extensively these days among politicians, journalists and academics. These debates often centre on the extent to which the public can be described as sceptical or supportive of the European project. A factor that is largely neglected is the extent to which citizens actually hold clear-cut opinions when it comes to European integration. This is surprising, given that the integration process is sufficiently complex that citizens are likely to hold conflicting opinions. The European integration process is characterized by a complex division of power between various European institutions and between these institutions and national governments. Citizens may have particular difficulties understanding in which instances the EU is responsible for policy outcomes (see, for example, Hobolt and Tilley Reference Hobolt and Tilley2014; de Vries et al. 2011). Adding to this complexity is the fact that, for much of its history, European integration was conceived as a matter restricted to the realm of foreign policy, about which citizens throughout the democratic world tend to have limited knowledge (Holsti Reference Holsti1992). Not surprisingly, perhaps, evidence suggests that on average citizens are not well informed about EU politics and perceive that the consequences of European integration are often intangible and uncertain (Anderson Reference Anderson1998; Karp et al. Reference Karp, Banducci and Bowler2003).
This study adds to this body of work to show that support for European integration is indeed characterized by ambivalence. Moreover, this response variability is higher in the West compared to the Central and East European member states. Finally, I show that ambivalence among West European citizens is better explained by specific aspects of the integration process rather than general determinants of attitude ambivalence relating to information. This is probably due to the fact that citizens in West European member states have accumulated more experience with the positive and negative aspects of membership and are therefore more conflicted about the integration process. Yet, EU membership is on average less contested in the East, which is most probably a result of recent accession and possibly slightly more positive connotations associated with membership such as financial support and political stability.
Examining response variability and its determinants is not only insightful in and of itself, but it also provides us with important information about the way in which support for European integration may develop in the future. First, the findings for the West do seem to suggest that, as citizens in Central and Eastern Europe gain more experience with European integration in years to come, ambivalence could rise in this region. Second, the finding that citizens hold rather ambiguous attitudes about Europe is important, as ambivalent citizens may be more influenced by elite discourse. Research in the US context, for example, highlights that attitudes characterized by ambivalence are more driven by considerations that are made salient at that time through media or party cues (see, for example, Lavine et al. Reference Lavine, Huff, Wagner and Sweeney1998; Zaller Reference Zaller1992). Due to the fact that European integration is becoming more contested in party competition, and a touchstone of dissent for the extreme right and left, we can expect publics to be more susceptible to the information that parties provide (see de Vries Reference de Vries2007). These expectations are worth exploring in future work.