Introduction
Many of the world's poor depend directly on genetic, species and ecosystem biodiversity for their livelihoods. In many regions, farm animal genetic resources (FAnGR) are a vital component of this biodiversity (Anderson, Reference Anderson2003). In developing countries, some 70 percent of the world's rural poor (2 billion people) depend on livestock as an important component of their livelihoods (Hoffmann and Scherf, Reference Hoffmann, Scherf, Tewolde and Mosconi2005). Genetic erosion of domestic animal diversity has placed 20 percent of the world's breeds at risk of extinction (FAO, 2007). The FAO (1997, 2007) recommends the conservation and sustainable development of FAnGR focusing on the many ‘adaptive’ breeds that survive well in the low external input agriculture typical of developing countries.
Identification and characterization of the chicken genetic resources generally requires information on their adaptation to a specific environment, possession of unique traits of current or future economic value and socio-cultural importance, which are crucial inputs to decisions on conservation and utilization (Weigend and Romanov, Reference Weigend and Romanov2001). Most of the indigenous chickens have evolved through adaptation to various agroclimatic conditions. They possess gene combinations and special adaptations not found in other improved modern breeds (Egahi et al., Reference Egahi, Dim, Momoh and Gwaza2010). Variations in major morphological traits such as outline and feather contours, shank and ear-lobe colours, comb types are common among indigenous chicken populations (Teketel, Reference Teketel1986). These characteristics provide a basis for grouping according to their phenotypic and morphological appearances. According to CSA (2001), the chicken populations of Ethiopia in the year 2000 was estimated at 37.76 million. Three years later, estimates of the indigenous chicken populations were 36 million in 2003, excluding the whole Gambela Region (CSA, 2004). Currently, there are about 42 million chickens in the country, of which 96.6 percent are indigenous chickens (CSA, 2009), indicating the significance of local chickens as potential FAnGR in the country.
The unique adaptation features and morphological variations of Ethiopian indigenous chicken population have been recently reported by several scholars. Halima et al. (Reference Halima, Neser, van Marle-Koster and deKock2007b) reported the phenotypic variation of indigenous chicken populations in northwest Ethiopia. Similarly, studies conducted by Duguma (Reference Duguma2006) and Dana et al. (Reference Dana, Dessie, van der Waaij and van Arendonk2010) were focused on the characterization of indigenous chicken populations found at specific locations that may not necessarily represent the genetic resources of indigenous chickens distributed in the whole country in general and in southern region of Ethiopia in particular. Thus, the indigenous chicken populations in the southern Ethiopia are neither phenotypically nor genotypically properly characterized for a defined purpose at their habitation. Their genetic potential still remains undefined forming a major barrier for the development and implementation of suitable genetic improvement strategies at a national level. The fundamental objective of this work was thus to describe the phenotypic and morphological variations of indigenous chicken populations that are found in southern Ethiopia.
Material and methods
Description of the survey region
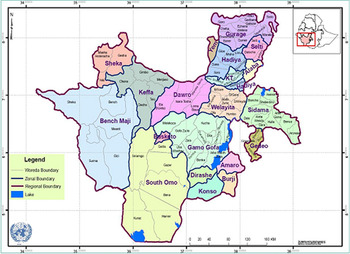
This study was carried out in Southern Nations, Nationalities and People's Regional State (SNNPRS) on 13 administrative zones and six special woredas (Figure 1). The region is located in the southern and south-western part of Ethiopia. Astronomically, it roughly lies between 4°43′–8°58′ north latitude and 34°88′–39°14′ east longitudes. It is bordered with Kenya in south and the Sudan in southwest. The total area of the region estimated to be 110,931.9 km2, which is 10 percent of the country and inhabited by a population size of about 16 million accounting nearly 20 percent of the total population of the nation. The population density of the region is 142 persons per km2 and is one of the most densely populated parts of the country. With less than one in ten of its population living in urban areas (8.9 percent) in 2008, the region is overwhelmingly rural (www.rippleethiopia.org/page/snnpr).
Map of Southern Nations Nationalities and Peoples Regional State (SNNPRS) displaying administrative zones and special woredas (districts) covered by the survey (retrieved at: www.rippleethiopia.org/page/snnpr).

Procedures of data collection and analysis
Sampling technique
This study was carried out using structured questionnaires and field surveys in 13 administrative zones and six special woredas found in the region for about four consecutive years between 2005 and 2009. The woredas found in each administrative zone were stratified according to the main agroclimatic zones, i.e. Kolla (lowland), Woina Dega (midland) and Dega (highland) with altitudinal ranges of <1500, 1500–2500 and >2500 m a.s.l, respectively. The field survey covered 54 woredas, 193 peasant associations (10 percent of the total) and 748 purposely but randomly selected households (HHs) (10 percent of the total) who keep five or more indigenous chickens within the HH. The number of chickens sampled for the study varies across zones depending upon the human and chicken population density of each administrative zone.
Morphological traits
A structured questionnaire was designed to collect data both on poultry production system of the region (Melesse and Negesse, unpublished data) and variations in basic phenotypic and morphological traits. Before the commencement of the survey, the questionnaires were pretested using sample HHs and appropriate adjustments were made on specific contents. The interviews were conducted at farmers' houses with the assistance of local agricultural extension officers drawn from each woreda.
Moreover, visual appraisal on the appearance of indigenous chicken populations and their typical morphological features were conducted together with the farmers, agricultural extension experts and two employee of this research project (graduate of public University in the field of General Agriculture). Special training was given to the project employees by researchers on basic phenotypic and morphological traits of poultry. Moreover, researchers were actively involved in all field survey activities throughout the study period.
To simplify the process of phenotypic evaluation, a copy of colour pictures showing the basic comb types and other morphological traits was used during each appraisal process. Furthermore, over 1000 pictures on indigenous chickens were taken during field visits from 39 market sites and villages of the surveyed regions. These pictures were used to crosscheck and validate the descriptions given by farmers from each HH. Moreover, a catalogue of basic plumage colours and feather patters is being prepared for future reference.
Phenotypic and morphological variations were studied based on feather morphology, feather distribution and patterns, plumage colours, shank colour, earlobe colour and comb types. Data were recorded for a total of 3770 indigenous chickens of both sexes following the FAO descriptors for chicken genetic resources (FAO, 1986, 2007). Moreover, a total of 1876 eggs were used for the evaluation of egg shell colours. Descriptions of comb types were based on illustrations presented by Somes (Reference Somes and Crawford2003), Ensminger (Reference Ensminger1992) and Roberts (Reference Roberts1997). Feather patterns and distribution on shank and feet as well as muff and beard features were described based on illustrations by Batty and Francis (Reference Batty and Francis1979) and Roberts (Reference Roberts1997).
Quantitative traits
During field visits, quantitative data were collected on live weight and shank length from both sex groups sampled from 13 administrative zones. These measurements were taken from 2340 adult chickens whose age was approximately 36 weeks or above. This age was chosen by considering the slow maturation of indigenous chickens to reach their adult age. The birds' age was determined by “recalling method” of interviewed farmers. (Women farmers can easily recall the age of their chickens because of the long time interval between two consecutive clutches in indigenous chickens.) Live body weight was taken using digital weighing balance to the nearest of 0.05 g (Model: DT 5k, LARK®). Shank length was measured from the top of the flexed hock joint to the bottom of the footpad using digital calipers to the nearest of 0.05 mm. The body weight shank ratio was then calculated as an index of bird density (Griffin et al., Reference Griffin, Renema, Robinson and Zuidhof2005).
Statistical analysis
Shell colour, comb type, shank colour, earlobe colour, plumage colours, feather distribution and morphology were analyzed using descriptive statistics and compared as percentages without application of statistical tests. General Linear Models Procedure of SAS® (SAS Institute, 1996) was used to analyze the analysis of variance of the quantitative data, fitting live weight, shank length and body weight shank length ratio as dependent variables, whereas sampling zones (the populations), indigenous chickens with various plumage colours and sex of the chickens as fixed factors. When differences were significant, comparisons of means were done by using Duncan's multiple range test. All statements of statistical differences in quantitative data were based on p < 0.05 unless noted otherwise.
Results
Flock size and distribution
A total of 7184 chickens were reported from 748 HHs in the surveyed areas, of which 40.2 percent were male and the rest (59.8 percent) were female chickens. Among them, 10.5 percent males and 18.7 percent females were reported as replacement stock for breeding purposes. Of the total chicken populations, 18.5, 51.9 and 29.6 percent were distributed in Dega, Woina Dega and Kolla agroclimatic zones, respectively. The largest proportion of chicken population was thus reported from Woina Dega agroclimatic zone. In the region, 48 percent of the chickens are kept mainly for sale to generate income whereas 23, 16 and 13 percent of them are used for home consumption, cultural ceremonies and gifts, respectively. Eggs from Indigenous chickens are mainly used for generating income (45 percent), hatching chicks (35 percent), eaten at home (17 percent) and for other purposes (3 percent).
Phenotypic and morphological variations in qualitative traits
Description of phenotypic traits in indigenous chickens
Egg shell colour
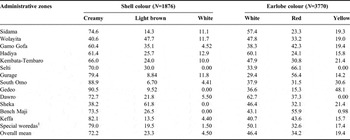
A total of 1876 eggs were observed during field survey, of which 72.2 percent had creamy shell colour. The rest of the eggs had light brown (23.3 percent) and white (4.5 percent) shell colours. As presented in Table 1, the highest proportion of creamy egg shells were observed in Gedeo administrative zone (90.5 percent) followed by south Omo (88.9 percent), Keffa (82.1 percent) and Gurage (79.4 percent) administrative zones. The highest proportion of light brown egg shells was observed in Sheka (61.8 percent) and Wolayita (47.7 percent) administrative zones.
Phenotypic variations in egg shell and earlobe colours of indigenous chicken populations in different administrative zones (in %)

1Mean values of six special woredas (Alaba, Amaro, Burji, Dirashe, Konso and Yem).
Earlobe colour
Of the investigated indigenous chicken populations, 46.4, 34.2 and 19.4 percent had red, white and yellow earlobe colours, respectively (Table 1). Indigenous chickens with the largest proportion of red earlobe colours (57–62 percent) was observed in Dawro, Hadiya and Sidama administrative zones with similar proportions; whereas the lowest in Gurage zone (29 percent). The indigenous chickens in Wolayita, Kembata-Tembaro and Sheka administrative zones as well as in those six special woredas showed red earlobes with similar proportions (46–48 percent). Likewise, the proportion of chickens with red earlobe colour in Keffa, Bench Maji, Gedeo, South Omo and Gamo Gofa administrative zones was more or less similar (37–41 percent). The highest proportion of earlobes with white colour was observed in chickens from Selti (66 percent) followed by Gurage and Bench Maji administrative zones with the same percentage values (56 percent).
Comb types
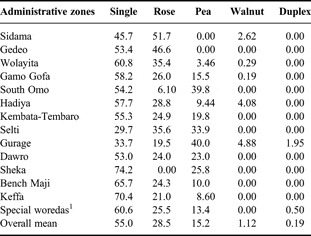
In general, 55 percent of the investigated chickens were single combed, followed by rose (28.5 percent) and pea (15.2 percent) combs. This figure shows that chickens found in rural areas of the region are mainly characterized by single and rose comb types, although the former appeared more frequently.
Of the total birds observed in Sheka, Keffa and Bench Maji administrative zones, about 74, 70 and 65 percent were single combed, respectively (Table 2). The distributions of single comb were similar across chickens found in Dawro, Kembata-Tebaro, Hadiya, south Omo, Gamo Gofa, Wolayita, Gedeo and Sidama administrative zones as well as special woredas, ranging from 45.7 to 60.8 percent. However, the proportion of rose comb in most studied zones appears to be variable, being highest in Sidama and Gedeo administrative zones. In Gurage and south Omo administrative zones, about 40 percent of the indigenous chickens possessed pea comb, whereas 5 and 2 percent of them had walnut and duplex combs, respectively.
Proportion of indigenous chicken populations showing different comb types across administrative zones (in %; N=3770)

1Mean values of six special woredas (Alaba, Amaro, Burji, Dirashe, Konso and Yem).
Shank colour
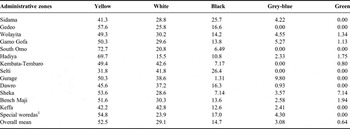
The phenotypic variation in shank colour of investigated indigenous chicken populations is presented in Table 3. About 52.5, 29.1 and 14.7 percent of the chicken populations had a yellow, white and black shank colours, respectively, indicating yellow as the dominant shank colour. The proportion of chickens having yellow shanks is 73 and 70 percent for South Omo and Hadiya zones, respectively, which is comparatively higher than those found in other zones (Table 3). The distribution of yellow shank was similar among chicken populations from Bench Maji, Sheka, Gurage, Kembata-Tembaro, Gamo Gofa, Wolayita, Gedeo administrative zones and the six special woredas with the range of 49–58 percent. The largest proportions of chickens with white shank were observed in Selti, Kembata-Tembaro and Keffa administrative zones with similar value (about 42 percent).
Phenotypic variations in shank colour of indigenous chicken populations from various administrative zones (%; N=3770)

1Mean values of six special woredas (Alaba, Amaro, Burji, Dirashe, Konso and Yem).
Description of feather morphology and plumage colours
Feather morphology and distribution
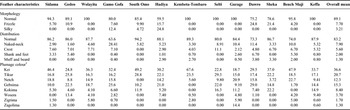
Variations in basic feather morphology, distribution and plumage colour characteristics of the investigated indigenous chickens are presented in Table 4. Of the total indigenous chicken populations, 89 percent were normal whereas the rest 7.7 and 3.2 percent had frizzle and silky feathers, respectively. The highest proportions of chickens with frizzle and silky feathers were reported in Dawro and Hadiya zones, respectively.
Variations in feather morphology, distribution and plumage colour of indigenous chicken populations in different administrative zones (N=3770)

Kei = Red plumage; Tikur = Black plumage; Netch = White plumage; Wosera = mixture of white and red with varying shades of multi-colours; Gebsima = mixtures of white and black with varying shades of multi-colours; Kokima = Grayish plumage, white or grayish strips on brown or reddish background; Zigrima = black and white spotted feathers on red background; Zagolima= white or red speckles on black background.
1Names of plumage colours are in Amharic, Official Working Language of Ethiopia.
About 83.2 percent of the chicken populations had normal feather distribution followed by Naked-neck (7.9 percent), crested (5.6 percent, Figure 3), shank and feet (2.0 percent) and muff and beard (1.3 percent). As a means of adaptation to the hot climate, about 28 percent of the chicken populations in Gamo Gofa administrative zone were found to be Naked-neck. The distribution of Naked-neck chicken population in Gurage, Dawro and Bench Maji administrative zones showed similar proportions (10–11 percent). It would be worthwhile to note that indigenous chickens with Naked-neck gene were observed throughout all zones and five special woredas found in the southern region. Among the six special woredas, the highest proportions of Naked-neck chickens were found in Yem, Amaro (each 23 percent), followed by Alaba (5 percent), Konso (4.4 percent) and Dirashe (3.3 percent).
Plumage colour
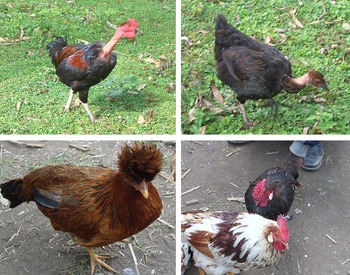
About 37 percent of the investigated chickens in southern Ethiopia was predominantly characterized by Kei (Red) plumage colour (Figure 2), followed by Tikur (Black), Gebsima (mixtures of white and black, Figure 2) and Netch (White) plumage colours at a proportion of 20.7, 15.3 and 12.3 percent, respectively (Table 4). The remaining 8.4, 3.7, 1.7 and 1.3 percent of the chicken population had Kokima (Grayish plumage, Figure 2), Wosera (mixture of white and red, Figure 2), Zigrima (black and white spotted feathers on red background) and Zagolima (white or red speckles on black background) plumage colours.
Variations in plumage colour phenotypes in indigenous chicken populations found in southern region of Ethiopia. Upper left: Kei (red plumage colour); upper right: Gebsima (mixture of white and black plumage colours); lower left: Kokima (Grayish plumage colour); lower right: Wosera (mixture of white and red plumage colours).

As presented in Table 4, about 68 percent of chickens from Kembata-Tembaro administrative zone were characterized by Kei plumage colours. Similarly, chicken populations in south Omo, Bench Maji and Sidama administrative zones had Kei plumage at comparable proportions (46–49 percent). The proportion of Kei plumage in chicken populations of Dawro, Hadiya, Gamo Gofa, Keffa, Wolayita and Sheka administrative zones was comparable ranging from 30 to 37 percent as well. The highest chicken populations with Gebsima plumage colour was noted in Dawro zone at 29 percent, followed by Gamo Gofa, Gedeo, Selti and Hadiya administrative zones at the proportion of 25.6, 22.5, 22.2 and 21 percent, respectively. Chickens with Tikur plumage were observed in Selti, south Omo, Gedeo, Kembata-Tembaro, Sheka and Hadiya administrative zones ranging from 22 to 29 percent. The largest proportion of chickens with Kokima and Wosera plumages was found in Sheka and Gedeo administrative zones, respectively.
Variations in morphological traits in major agroclimatic zones
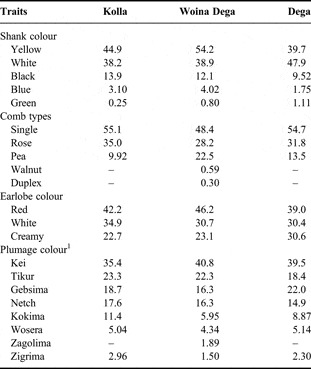
As presented in Table 5, yellow shank is the dominant colour in Kolla and Woina Dega agroclimatic zones, whereas white shank is most prevalent in Dega. Single comb was predominantly found in all agroclimatic zones appearing at comparable proportions. The highest proportion of duplex and walnut combs was only reported in the Woina Dega agroclimatic zone. Large proportions of chickens with red earlobes were found throughout all agroclimatic zones. The distribution of plumage colours across all agroclimatic zones was predominantly Kei with comparable pattern of occurrence. Chicken populations in Kolla and Dega agroclimatic zones were characterized by high proportion of Kei plumage followed by Tikur, Gebsima, Netch, Kokima and Wosera. In Dega, Gebsima is the second dominant plumage colour after Kei.
Variations in basic phenotypic and morphological traits in different agroclimatic zones (in %)

Kolla = lowland below 1500 m; Woina Dega= midland between 1500–2500 m and Dega = highland above 2500 m a.s.l.
Kei = Red plumage; Tikur = Black plumage; Netch = White plumage; Wosera = mixture of white and red with varying shades of multi-colours; Gebsima= mixtures of white and black with varying shades of multi-colours; Kokima = Grayish plumage, white or grayish strips on brown or reddish background; Zigrima = black and white spotted feathers on red background; Zagolima= white or red speckles on black background.
1Names of plumage colours are in Amharic, Official Working Language of Ethiopia.
Variations in quantitative traits
Live body weight
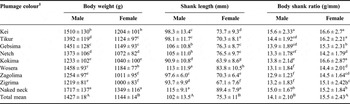
The average body weight of adult males and females varied significantly (p < 0.05) among the investigated indigenous chickens (Table 6). Both male and female Naked-neck chickens were significantly (p < 0.05) heavier than the rest of the investigated indigenous chicken populations. Moreover, the body weight of Kei, Gebsima and Wosera chickens was comparatively higher than those of other indigenous chickens. The highest body weight was obtained from both sexes of Naked-neck and the lowest from Zigrima chickens.
Adult live body weight and shank length of indigenous chicken populations (mean ± SD; N=2340)

Means within a column between indigenous chickens with different superscript letters are significantly (p < 0.05) different
Kei = Red plumage; Tikur = Black plumage; Netch = White plumage; Wosera = mixture of white and red with varying shades of multi-colours; Gebsima = mixtures of white and black with varying shades of multi-colours; Kokima = Grayish plumage, white or grayish strips on brown or reddish background; Zigrima = black and white spotted feathers on red background; Zagolima = white or red speckles on black background.
1Names of plumage colours are in Amharic, Official Working Language of Ethiopia.
Shank length and body weight shank ratio
As presented in Table 6, the shank lengths of Naked-neck and Wosera males were similar but significantly (p < 0.05) different for being longer than those of other indigenous chickens. In female chickens, the Naked-neck had the longest and Kokima the shortest shanks and were significantly different from those of other chickens. The body weight shank ratio (BW:SL) in Kei males was significantly (p < 0.05) larger than those of other chickens (Table 6). Kei, Kokima and Tikur females had similar BW:SL, which was significantly (p < 0.05) higher than those of other chickens. In general, the BW:SL of female chickens was significantly (p < 0.05) larger than that of male birds except for the Naked-neck chickens.
Discussion
Variations in phenotypic and morphological traits
Halima et al. (Reference Halima, Neser and van Marle-Koster2007a) reported 7.1 flock sizes per HH, which is in good agreement with the current findings. Dana et al. (Reference Dana, Dessie, van der Waaij and van Arendonk2010) reported an average indigenous chicken size of 3.5 per HH, which is twofold lower than the current study. An average flock size of 16 birds was reported in the central parts of Ethiopia (Tadelle, Reference Tadelle2003), which is twofold higher than that found in the current study. In north-western Ethiopia, Moges, Melesse and Dessie (Reference Moges, Melesse and Dessie2010) reported an average flock size of 13 birds per HH. Flock size in the region varies between seasons mainly because of the availability of feed, the occurrence of diseases, the presence of predators as well as the economic status of the owners reported by Melesse and Negesse (unpublished data) as a separate part of this study.
According to Ssewannyana et al. (Reference Ssewannyana, Ssali, Kasadha, Dhikusooka, Kasoma, Kalema, Kwatotyo and Aziku2008), 48 and 47 percent of the shell of eggs collected from indigenous chickens in Uganda were light brown and white colours, respectively, which is higher than those observed in the present study. Shell colour is primarily a breed characteristic, although there is often variation among individual hens in a particular flock even when all are of the same breed and variety. Egg shells of commercial breeds of chickens are white or brown. Breeds with white earlobes ordinarily lay white eggs, whereas breeds with red earlobes ordinarily lay brown eggs (Jacob, Miles and Mather, Reference Jacob, Miles and Mather2009).
According to Dana et al. (Reference Dana, Dessie, van der Waaij and van Arendonk2010), the proportion of indigenous chickens showing white earlobe was 40 percent, which is slightly lower than those reported in the current study. The same authors reported a large proportion of chickens with red earlobes, which is higher than those found in the current study. In agreement with the present findings, Duguma (Reference Duguma2006) reported the predominance of white earlobe in indigenous chickens from south-western, western and eastern parts of Ethiopia. In Nigeria, Egahi et al. (Reference Egahi, Dim, Momoh and Gwaza2010) reported a high proportion of indigenous chickens (about 73 percent) with white earlobes, which is higher than that observed in the current study. According to Ssewannyana et al. (Reference Ssewannyana, Ssali, Kasadha, Dhikusooka, Kasoma, Kalema, Kwatotyo and Aziku2008) the proportion of white and red earlobes in indigenous chickens in Uganda was almost the same (48 and 47 percent). It is apparent that earlobe colour is a breed-specific trait, although it could be affected by nutritional status of the birds. All standard chicken breeds that originated from Mediterranean regions (such as Leghorn or Ancona) exclusively possess white earlobes, whereas other breeds such as Rhode Island Red, New Hampshire. have earlobes with red colour.
Indigenous chicken populations possessing a high proportion of single comb were reported in other countries (Mcainsh et al., Reference Mcainsh, Kusina, Madsen and Nyoni2004; Badubi, Rakereng and Marumo, Reference Badubi, Rakereng and Marumo2006; Egahi et al., Reference Egahi, Dim, Momoh and Gwaza2010). According to Badubi, Rakereng and Marumo (Reference Badubi, Rakereng and Marumo2006), about 90 percent of the indigenous chickens in Botswana were single combed, whereas very low proportion of rose (4.9 percent) and pea (1 percent) combs. Moges, Melesse and Dessie (Reference Moges, Melesse and Dessie2010) reported that single and rose combs are the most prevalent comb types in north-western Ethiopia. In contrast, Halima et al. (Reference Halima, Neser, van Marle-Koster and deKock2007b) and Dana et al. (Reference Dana, Dessie, van der Waaij and van Arendonk2010) reported pea comb as a predominant type in other parts of Ethiopia. These discrepancies might have been caused by confusions that may arise between rose and pea combs (Dana et al., Reference Dana, Dessie, van der Waaij and van Arendonk2010). Pea comb is a breed characteristic found in Cornish, Brahmas, Ameraucanas, Buckeyes, Cubalayas and Sumatras and is sometimes called a triple comb (Somes, Reference Somes and Crawford2003). Rose and single are comb types most commonly found in chickens (Bell, Reference Bell, Bell and Weaver2002). When rose and pea combed birds are crossed, the comb is intermediate and given the name walnut comb. Rose comb and pea comb are dominant to single comb. Thus, in chicken populations with the highest proportion of pea comb, the occurrence probability of single comb would be very low. Comb type is the result of gene interaction, but comb size is associated with gonadal development and the intensity of light, either natural or artificial (Bell, Reference Bell, Bell and Weaver2002).
Dana et al. (Reference Dana, Dessie, van der Waaij and van Arendonk2010) and Halima et al. (Reference Halima, Neser, van Marle-Koster and deKock2007b) reported yellow shank as the most prevalent trait in indigenous chicken populations found in other parts of Ethiopia, which agrees with the current findings. According to Ssewannyana et al. (Reference Ssewannyana, Ssali, Kasadha, Dhikusooka, Kasoma, Kalema, Kwatotyo and Aziku2008), 42 percent of the indigenous chickens in Uganda had yellow shank, which is comparable to the present findings. Moreover, Dana et al. (Reference Dana, Dessie, van der Waaij and van Arendonk2010) reported 28 percent of indigenous chickens with white shanks, which is in line with the present findings (29.1 percent). However, Faruque et al. (Reference Faruque, Siddiquee, Afroz and Islam2010) reported white shank (35 percent) as the most predominant colour in Bangladesh native chickens. Moreover, 42.2 percent of Nigerian indigenous chickens had a black shank (Egahi et al., Reference Egahi, Dim, Momoh and Gwaza2010). The shanks and most of the feet are covered with scales of various colours (Bell, Reference Bell, Bell and Weaver2002). Yellow is due to dietary carotenoid pigments in the epidermis when melanic pigment is absent. Varying shades of black are the result of melanic pigment in the dermis and epidermis (Bell, Reference Bell, Bell and Weaver2002). When there is black pigment in dermis and yellow in epidermis, the shanks have greenish appearance. In the complete absence of both of these pigments, the shanks are white.
Melesse and Negesse (unpublished data) observed shortage of scavangable feed resources in the highland agroclimatic zone of the region, which might be a possible explanation for the predominance of white shank in this agroclimatic zone. Dana et al. (Reference Dana, Dessie, van der Waaij and van Arendonk2010) reported high proportion of white skin colour in those chickens from highland regions.
Fizzle gene is incompletely dominant autosomal gene, which causes the contour feathers to curve outward away from the body (Somes, Reference Somes and Crawford2003). It also causes a reduction in feather weight at slaughter (up to 40 percent). This gene will thus reduce the insulating properties of the feather cover because of reduced feather weight and makes it easier for the bird to dissipate heat effectively from the body by means of convection, making them suitable in hot climates (Horst, Reference Horst1989).
According to reports of Ssewannyana et al. (Reference Ssewannyana, Ssali, Kasadha, Dhikusooka, Kasoma, Kalema, Kwatotyo and Aziku2008), 75 percent of indigenous chickens in Uganda were normal feathered followed by those with crests (12 percent), Naked-neck (9 percent) and feathered shanks (4 percent), which are comparable with the results of this study. The Naked-neck gene is described as one of the major genes in indigenous chickens of the tropics that possess desirable effects on heat tolerance and adult fitness (Melesse, Reference Melesse2000; Maak et al., Reference Maak, Melesse, Schmidt and vonLengerken2003; Melesse, Maak and vonLengerken, Reference Melesse, Maak and vonLengerken2005). The homozygote state of Naked-neck gene reduces feather coverage by about 15–20 percent in heterozygous and by 30–40 percent in homozygous chickens (Yunis and Cahaner, Reference Yunis and Cahaner1999). Reduced feather coverage should improve and enhance heat dissipation and consequently alleviate the effects of heat on chickens reared in hot climates. In addition, reduced feathering saves on feather proteins, which may be used for egg or meat production (Ajang et al., Reference Ajang, Prijono and Smith1993). The total proportion of chickens carrying the Naked-neck gene in the populations that we studied was higher than those reported in other parts of Ethiopia (2 percent; Dana et al., Reference Dana, Dessie, van der Waaij and van Arendonk2010) and in Botswana (3.6 percent; Badubi, Rakereng and Marumo, Reference Badubi, Rakereng and Marumo2006). This major difference is expected as southern part of Ethiopia has been long known by the existence of Naked-neck chicken as native chicken population (Teketel, Reference Teketel1986; Melesse, Reference Melesse2000).
The plumage colours found in the current study are in agreement with previous reports by Missohou, Sow and Ngwe-Assoumou (Reference Missohou, Sow and Ngwe-Assoumou1998) for indigenous chicken populations in Senegal. Duguma (Reference Duguma2006) also found similar plumage colours in indigenous chickens from Horro, Tepi and Jarso parts of Ethiopia. In north-western Ethiopia, Kibret (Reference Kibret2008) reported 39 percent of the chicken populations having Kei plumage, which is comparable with the current findings. Moreover, in line with the present study, Dana et al. (Reference Dana, Dessie, van der Waaij and van Arendonk2010) reported Kei as the most prevalent plumage colour in those chicken populations from southern part of Ethiopia (Konso and Sheka areas), Oromia and Benshangul-Gumuz regions. In contrast to the present finding, 25.5 percent of indigenous chickens in the northwest parts of Ethiopia had Netch plumage colour followed by a grayish mixture (22.2 percent) and Kei (16.4 percent) (Halima et al., Reference Halima, Neser, van Marle-Koster and deKock2007b). According to Moges, Melesse and Dessie (Reference Moges, Melesse and Dessie2010), 54 percent of chicken populations investigated in north-western Ethiopia had Kei plumage, which is higher than the current findings.
In the literature, large variations in plumage colours across regions were found, which might be due to geographical isolation as well as periods of natural and to some extent, artificial selections. Furthermore, these variations could be due to limited exchange or transport of local chickens over long distances as it is commonly observed in large animals. Chickens and their products are mostly sold in the nearby markets for HH consumption purposes. Moreover, most farmers in the rural community produce replacement chickens from their own flocks. In the worst case, they may buy chickens from nearby markets if needed for replacement purposes.
Feather colours and feather patterns are the result of genetic differences (feather colour is sex-linked) and the presence of gonadotropic hormones (Bell, Reference Bell, Bell and Weaver2002). However, most of the important feather colours in fowl result from the presence of pigments (Stevens, Reference Stevens1991). The most important pigments are the melanins, which are the principal black and red pigments in feathers.
Based on field and market observations as well as interview with village community, chickens with Gebsima plumage were further categorized as black Gebsima (white spots on black background) and white Gebsima (black spots on white background). Similarly, chickens with Wosera plumage were classified as red Wosera (white spots on red background) and white Wosera (red spots on white background). Contrary to the present findings, Wosera plumage elsewhere in Ethiopia was described as a mixture of black and white whereas Gebsima as a grayish mixture (Tadelle, Reference Tadelle2003). Dana et al. (Reference Dana, Dessie, van der Waaij and van Arendonk2010) described the Gebsima chickens with wheaten strips on black background. The description of Zagolima and Teterima plumage colours given by Dana et al. (Reference Dana, Dessie, van der Waaij and van Arendonk2010) was somehow similar to those of the present study. However, the plumage colour description of Teterima is not reported in southern Ethiopia.
Variations in quantitative traits
The body weight ranges for males (1.22–1.72 kg) and females (1.0–1.35 kg) in the current study were in close agreement with those reported by Dana et al. (Reference Dana, Dessie, van der Waaij and van Arendonk2010) under field conditions. The adult body weight of male (2.1 kg) and female (1.4 kg) indigenous chickens in Uganda reported by Ssewannyana et al. (Reference Ssewannyana, Ssali, Kasadha, Dhikusooka, Kasoma, Kalema, Kwatotyo and Aziku2008) was higher than observed in the present study. As expected, the mature male chickens were significantly heavier than females and are in line with the reports of Halima et al. (Reference Halima, Neser, van Marle-Koster and deKock2007b) and Dana et al. (Reference Dana, Dessie, van der Waaij and van Arendonk2010). Body weights of Naked-neck females in the current study is in line with the findings of Melesse Reference Melesse2000 and Melesse, Maak and vonLengerken (Reference Melesse, Maak and vonLengerken2005) on the same type of adult female birds under intensive management (1.35 vs. 1.27 kg). The first work on the growth performance of Kei, Netch, Tikur, Gebsima, Kokima and Naked-neck chicken was reported by Teketel (Reference Teketel1986). Among these indigenous chickens, the Naked-neck chickens were found to be better in body weight than those of other indigenous chickens, which is in a good agreement with the present findings.
This Naked-neck gene reduces feather coverage around the neck region (Figure 3), which facilitates body heat dissipation during hot weather (Deeb and Cahaner, Reference Deeb and Cahaner2001). Thus, those chickens carrying this gene are likely more beneficial in the lowland areas of the country where the heat stress situation could be a major problem for small-scale poultry production. Nevertheless, as illustrated in Figure 3, it appears that there is a high possibility of interbreeding with other indigenous chickens resulting in heterogeneous type of Naked-neck gene. Moreover, interviewed HHs reported that consumers in urban markets have neglected live chickens carrying this gene because of cultural reasons that are possibly linked with the absence of feather coverage around the neck region. Dana et al. (Reference Dana, Dessie, van der Waaij and van Arendonk2010) also reported similar concerns from interviewed farmers. It is thus apparent that the future of the Naked-neck gene is at risk unless appropriate measures are taken towards its conservation at its habitat (in situ).
Some morphological variations in indigenous chicken populations found in the southern region of Ethiopia. Upper left: homozygous (NaNa) Naked-neck indigenous chickens; upper right: heterozygous (Nana+) Naked-neck indigenous chickens; lower left: Indigenous chicken with crested head; lower right: single and rose combed indigenous chickens with white earlobes.

The range of shank length in males (9.1–11.5 cm) in the present study is within the range to those reported by Halima et al. (Reference Halima, Neser and van Marle-Koster2007a) for indigenous male chickens (9.5–11.3) reared under intensive management. The shank length reported by Msoffe et al. (Reference Msoffe, Minga, Olsen, Yongolo, Juul-Madsen, Gwakisa and Mtambo2001) for adult scavenging indigenous chickens in Tanzania was much higher than those observed in the present study. The shank length of indigenous males in Botswana was 85 mm (Badubi, Rakereng and Marumo, Reference Badubi, Rakereng and Marumo2006), which was shorter than that observed in the present study (85 vs. 102 mm). The short shank length found in female than male chickens is in line with previous reports by Halima et al. (Reference Halima, Neser, van Marle-Koster and deKock2007b) and Dana et al. (Reference Dana, Dessie, van der Waaij and van Arendonk2010). The average shank length of females in the present study is comparable to those of indigenous chickens (70 vs. 75 mm) from Botswana (Badubi, Rakereng and Marumo, Reference Badubi, Rakereng and Marumo2006). Shank length is regarded as a good indicator of skeletal development, which is related to the amount of meat a chicken can carry. Thus, the present study suggests that the Naked-neck might possess a better bone strength, which could be associated with its active walking potential to cover longer distances in search of feed. In naturally hot climates, the Naked-neck broiler chickens exhibited greater weight gain compared with their fully feathered counterparts (Yalcin et al., Reference Yalcin, Testik, Ozkan, Settar, Celen and Cahaner1997).
The body weight shank ratio is an indicator of degree of fleshing in relation to body size. It usually increases with body size (Renema et al., Reference Renema, Robinson, Beliveau, Davis and Lindquist2007). The current study suggests that the indigenous chickens with Kei plumage might possess a useful genetic potential for table meat production under scavenging feed resource-based production system. However, the Naked-neck chickens, which showed better body weight and shank length, were inferior in their fleshing capacity in relation to their body size, suggesting their suitability for egg production purpose.
Conclusions
Based on field and market appraisals as well as interviews with smallholder HHs, single comb, yellow shank and red earlobes were the predominant phenotypic traits of indigenous chickens across all agroclimatic zones. The most prevalent plumage colour in all agroclimatic zones was Kei occurring at comparable proportions. The highest adult body weight was obtained from Naked-neck, followed by Kei, Gebsima and Wosera chickens. Similarly, Naked-neck and Wosera chickens had the longest shank whereas the body weight shank ratio in Kei males was larger than those of other indigenous chickens. The population of indigenous chickens studied showed heterogeneity in most morphological traits considered. Thus, an in-depth molecular evaluation using genetic markers should be undertaken to substantiate the level of genetic differentiation and relationships among indigenous chicken populations.
Acknowledgements
This project was supported by Norwegian Agency for Development Cooperation (NORAD). The authors would like to acknowledge the Norwegian Government and NORAD project coordinator. We further express our appreciation to the Bureau of Agriculture and Rural Development operating in all zones and Special Districts of Southern Nations, Nationalities and Peoples Regional State (SNNPRS) for their affirmative collaboration while conducting this survey. We earnestly thank all households who actively participated in the project.