1. INTRODUCTION
More often than not, industrialisation and modernisation are associated with economic prosperity via rising per capita GDP, real wages and life expectancy, even for middle-income countries (Komlos Reference Komlos1985, Reference Komlos1987; Floud et al. Reference Floud, Wachter and Gregory1990; Haines Reference Haines2004; Carson Reference Carson2005), such as Chile. However, these factors do not necessarily lead to better biological standards of living in the short or medium term. Economic historians have long been concerned with the impact of socio-economic processes on biological standards of living (Steckel and Floud Reference Steckel and Floud1997; María-Dolores and Martínez-Carrión Reference María-Dolores and Martínez-Carrión2011). It is well known, for instance, that in some cases periods of economic prosperity have coincided with stagnation, and even deterioration, of biological welfare. For example, the so-called «early-industrial growth puzzle», refers to increasing wages and per capita output during 19th-century industrialisation in Europe and the United States (i.e. «antebellum puzzle»), but became associated with a decline in the average physical stature of the population (Margo and Steckel Reference Margo and Steckel1983; Floud et al. Reference Floud, Wachter and Gregory1990; Komlos Reference Komlos1996, Reference Komlos1998; A’Hearn Reference A’Hearn2003; Haines Reference Haines2004; Komlos and Küchenhoff Reference Komlos and Küchenhoff2012). This is puzzling indeed in so far as height has been taken as a good indicator of biological well-being.
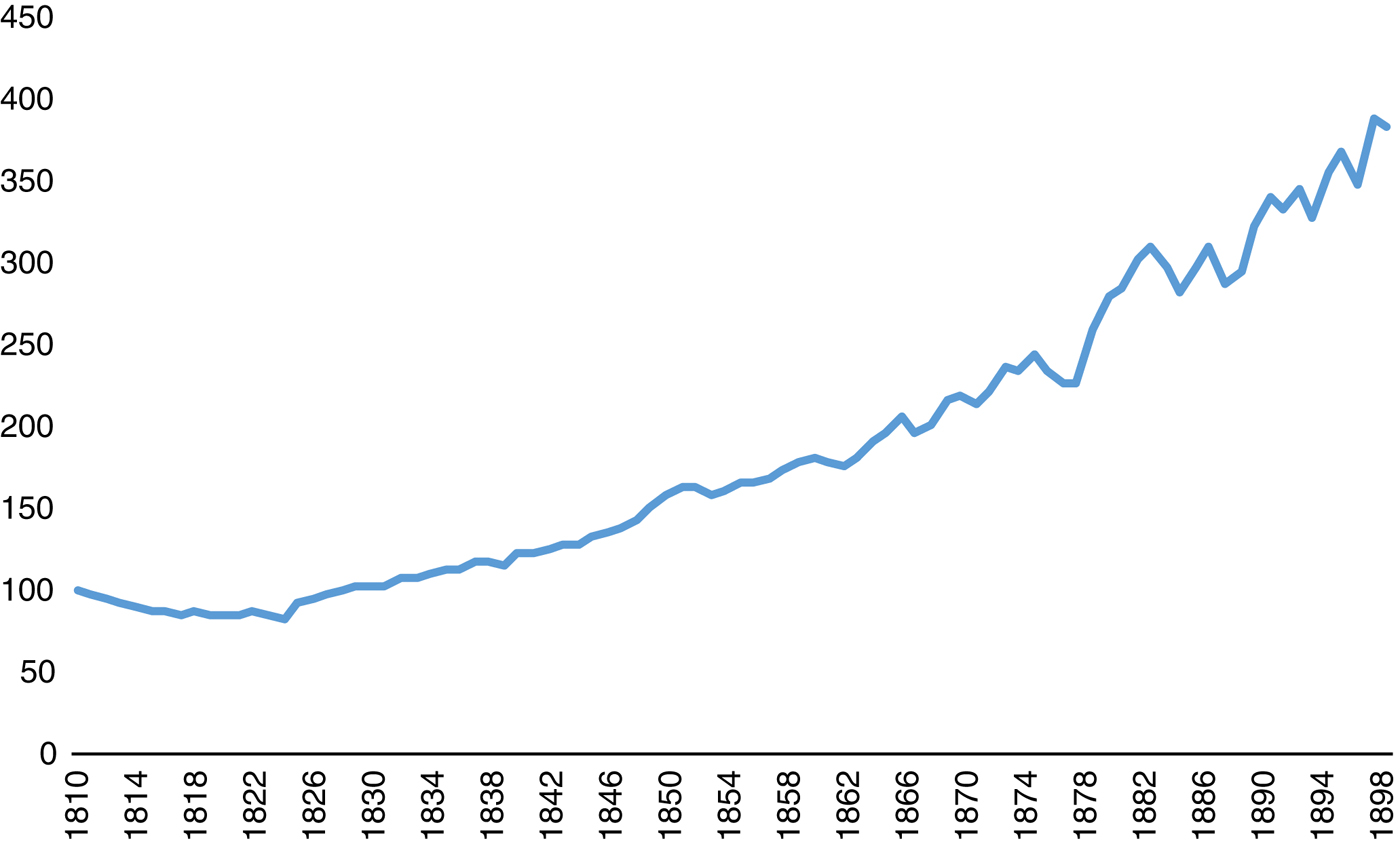
Although Chile did not undergo a successful industrialisation process, during most of the 19th century it enjoyed economic prosperity based on the exploitation of natural resources, characterised by booming exports (Figure 1), in particular from the 1840s, and strong GDP per capita growth (Figure 2), combined with some industrialisation during the second half of the century (Ortega Reference Ortega2005; Díaz et al. Reference Díaz, Lüders and Wagner2016). Based on these indicators, the evidence suggests that living standards improved in Chile during this periodFootnote 1. However, it is less clear whether or not this period of massive economic growth resulted in better biological standards of living. There are no published studies on adult height (or any other aspect of physical well-being) in 19th-century Chile, as there are for other Latin American (see below) and Iberian countries (e.g.María-Dolores and Martínez-Carrión Reference María-Dolores and Martínez-Carrión2011; Martínez-Carrión Reference Martínez-Carrión2016). The only available work on Chile is that of Núñez and Pérez (Reference Núñez and Pérez2015), but it deals with height in boys rather than in adult men, and with a later period (post-1880). Despite extensive research into biological standards of living in Latin America during the 19th century (Salvatore Reference Salvatore1998, Reference Salvatore2004, Reference Salvatore2007; Salvatore and Baten Reference Salvatore and Baten1998; López-Alonso and Porras-Condey Reference López-Alonso and Porras-Condey2003; Carson Reference Carson2005; Frank Reference Frank2006; López-Alonso Reference López-Alonso2007, Reference López-Alonso2016; Meisel and Vega Reference Meisel and Vega2007; Baten et al. Reference Baten, Pelger and Twrdek2009; Challú Reference Challú2009, Reference Challú2010; Twrdek and Manzel Reference Twrdek and Manzel2010; Monasterio Reference Monasterio2014; López-Alonso and Grajales-Porras Reference López-Alonso and Grajales-Porras2015), more work is needed on those countries that have received little or no attention, such as Chile. Furthermore, given the shortcomings of per capita GDP as an indicator of living standards, alternative measures such as anthropometric indicators are welcome, in particular for countries where other data are not available or reliable, such as Chile, for which not even real wages series exist before the 1880sFootnote 2.
Average annual Chilean exports per decade ($ million), 1844–1899
Source: Chile, Estadística Comercial, all numbers from 1844 to 1899.

Real per capita GDP index for Chile, 1810–1899 (1810=100)
Source: Díaz et al. (Reference Díaz, Lüders and Wagner2016).

Thus, the primary aims of this study are to provide the first estimates of Chilean height for adult males during the 19th century, to assess the evolution of height during this period, to identify and assess some of its determinants, and finally, to contrast this anthropometric indicator with the available data on the economic performance of the country during the same period (i.e. traditional indicators of economic growth, such as GDP and exports), following a similar structure to that of Baten et al. (Reference Baten, Pelger and Twrdek2009). We found that despite booming exports and an extraordinary per capita GDP growth, the bulk of the population did not benefit biologically from this economic boom. The article will also provide preliminary explanations behind movements in average height per decade of birth, as well as other key determinants of height in Chile, such as skin colour, social status and region of birth. We shall start, however, with the historical and economic background of the country for the period under study, to contextualise our results.
2. HISTORICAL BACKGROUND: THE 19TH-CENTURY CHILEAN ECONOMY
Chilean independence from Spain was consolidated in 1817. The new republic inherited income and land ownership inequality, a production matrix characterised by concentration on the production of a few staple products, restrictive commercial codes, a backward subsistence agricultural sector, poor transport facilities and miserable infrastructure overall, deficient specification of property rights, lack of democracy, and many other negative characteristics and institutions of the colonial economy and society (Ortega Reference Ortega2005). Thus, independence was followed by a complex process of state formation, characterised by the gradual introduction of liberal reforms, the creation of new institutions, codification of economic activity, investments in infrastructure, transition to capitalism, early industrialisation, among other important economic and political transformations. As part of this process, Chile was an exceptional case within Latin America, enjoying a smoother political and macroeconomic transition than most of its neighbours (Collier Reference Collier1987; Collier and Sater Reference Collier and Sater1998; Loveman Reference Loveman2001; Ortega Reference Ortega2005), although this does not mean that there were not internal conflicts and turbulent years (Collier Reference Collier1987; Collier and Sater Reference Collier and Sater1998; Loveman Reference Loveman2001; Ortega Reference Ortega2005).
This paper deals with the first nine decades of the independent republic, c.1810s-1890s. For most of this period Chile was a smaller country than it is today, reaching from the «Little North» to the Bio-Bio river in the south, the natural frontier with the Mapuche, plus the archipelago of Chiloé, as well as Valdivia (Carmagnani Reference Carmagnani2001). In the last quarter of the 19th century, however, the country increased dramatically in size. Chile fought the Pacific War (1879–1884), defeating Peru and Bolivia and thus acquiring the «Big North» (e.g. Antofagasta, Iquique, Arica). Chile also penetrated and conquered the Mapuche territory, expanding from Concepción to the Magallanes region between the 1860s and the 1880s. The «Big North» provided Chile with nitrate (thus enjoying a virtual world monopoly), which became the principal export product, and the primary source of tax revenue for decades, while the newly acquired southern provinces became the granary of the country.
During the first decades after independence, the economy relied heavily on the agricultural sector. Most products were consumed locally (high internal freights precluded any surplus being distributed to other markets), although some wheat and flour were exported, together with some tallow, jerked beef and hides (Couyoumdjian Reference Couyoumdjian1989; Correa Reference Correa2013). Fresh fruit and vegetables were produced locally, but never entered the international economy. Yet, in terms of contribution to total GDP, the agricultural sector was far more important than the mining sectorFootnote 3, and in turn most agricultural production before 1850 was destined for home consumption (Llorca-Jaña et al. Reference Llorca-Jaña, Robles, Navarrete-Montalvo and Araya2017). The early mining sector (c.1810s-1840s) was comparatively less important for output as a whole, but mining exports, in particular copper and silver (Llorca-Jaña and Navarrete-Montalvo Reference Llorca-Jaña and Navarrete-Montalvo2015; Irigoin Reference Irigoin2018) were more important than those of the agricultural sector. The export economy in Chile, as in most other Latin American republics, accounted for a small share of total GDP during the early decades that followed independence. The country did not have the strength to promote sustained economic growth (Prados de la Escosura Reference Prados de la Escosura2006; Bulmer-Thomas Reference Bulmer-Thomas2014), as may have been the case later on, especially during the nitrate era (c.1880–1930).
Despite its paramount contribution to GDP, the agricultural sector was noticeably backward, characterised by the predominance of large haciendas and low levels of productivity (Loveman Reference Loveman2001). Early independent Chile ‘remained a land of great estates’ belonging to private people; the land-tenure system was roughly the same as under Spanish rule (Collier Reference Collier1987; Bauer Reference Bauer1975). In turn, and in contrast to many other Latin American countries (Bértola and Ocampo Reference Bértola and Ocampo2012), there were no lands belonging to indigenous communities in Chile, while landholdings possessed by the church were also insignificant.
Independence released Chile from the burden of imperial trade. The country was now able to enjoy direct and legal trade with all nations. Previously, European manufactures reached Chile at exorbitant prices, while export prices were dictated by merchants from Lima and Cadiz (Ramírez Reference Ramírez1967; Rector Reference Rector1975; Carmagnani Reference Carmagnani2001). After independence, Chile’s terms of trade with the world improved rapidly (Rector Reference Rector1985; Couyoumdjian Reference Couyoumdjian1989; Llorca-Jaña Reference Llorca-Jaña2012, Reference Llorca-Jaña2014; Bulmer-Thomas Reference Bulmer-Thomas2014; Irigoin Reference Irigoin2018), and this coincided with a period in which world commodity markets were expanding. In addition to freedom of trade, foreign merchants were allowed to establish offices in Chile, soon dominating overseas trade (Salazar Reference Salazar2009; Llorca-Jaña Reference Llorca-Jaña2014).
Besides agriculture, mining and the industries that emerged in connection with mining, the non-export economy was far more heterogeneous than the export sector (Bulmer-Thomas Reference Bulmer-Thomas2014). Artisanal manufacturing was sustained in much of Chile, with goods made in small workshops or at home, in particular coarse woollen textiles, candles, soaps, shoes and soles, cigars and starch, at a level which would not be classified as industrial (Salazar Reference Salazar2009; Díaz Reference Díaz2017)Footnote 4. Most textile production, for instance, was undertaken by households all over the country, but mainly in rural areas. In turn, most non-household textile production took place in the south of the country (Llorca-Jaña Reference Llorca-Jaña2012).
Apart from this artisan production, according to Ortega (Reference Ortega2005), before 1880 there was a sizeable industrial sector, with some modern characteristics, constituting the first phase of a long, difficult, and eventually incomplete industrialisation process (Loveman Reference Loveman2001). This industrial sector emerged in the mid-19th century, its size increased in the 1860s and 1870s, and it was linked to the growth of urbanisation, transport modernisation and growing external demand. The most important of these early industrial sectors identified by Ortega were food processing, beverages, processed wood, furniture, paper and printing, chemicals, saddlery, tanneries, tobacco, lime, textiles, mineral smelting, and equipment. Shipbuilding was another economic activity developed after independence, but in particular after 1850, although Chilean shipyards were small by international standards, producing mainly fishing boats, at least until the end of the period covered by this paper (Véliz Reference Véliz1961; Rector Reference Rector1985; Salazar Reference Salazar2009). These industries were mainly located around Santiago-Valparaiso and near Concepción, and, to a lesser extent, the «Little North» (Ortega Reference Ortega2005).
While economic and export growth was limited before 1850 (Figures 1 and 2), during the 1850s-1890s a different story emerged. During this period Chilean economic growth, of exports in particular, has been classified as impressive, compared to previous periods in national history, but also compared to that of its neighbours (Meller Reference Meller1998; Loveman Reference Loveman2001; Bértola Reference Bértola2011). In both 1870 and 1900 Chile had the third largest per capita GDP in Latin America, only slightly inferior to the frontrunners Argentina and Uruguay (Maddison Reference Maddison1995; Bértola and Ocampo Reference Bértola and Ocampo2012). Figures 1 and 2 provide figures for total exports and real per capita GDP, respectively. Economic growth went hand in hand with an exuberant export market (Mayo Reference Mayo1979; Ortega Reference Ortega2005). Per capita GDP in the 1890s was more than twice as high as in the 1850s (Figure 2). The value of Chilean exports in the 1870s was eight times higher than in the 1840s (Figure 1), and in the 1890s twice as high as in the 1870s, led by the mining sector and agricultural products (Collier Reference Collier1987; Couyoumdjian Reference Couyoumdjian1989; Méndez Reference Méndez2004). Chile had been favoured in the «commodity lottery», since world demand for copper and nitrate was on the increase (Bulmer-Thomas Reference Bulmer-Thomas2014). This allowed for an increase in fiscal revenues and expenditure on public works, education and cultureFootnote 5.
While Chilean copper exports were important before 1840, they became paramount during the 1840s-1870s, as copper prices increased with industrialisation (Coatsworth Reference Coatsworth1998). They became even more significant than exports of silver and gold combined and reflect the discovery of new mines. During the 1840s-1860s there were massive increases in copper production, which reached a peak during the 1870s with over 45,000 tons produced annually. By the mid-19th century the country had become the top world producer and retained this position for over a quarter of a century (Przeworski Reference Przeworski1980). In turn, copper refining has been credited with the development of other industries in the country, such as coal mining, firebrick and ceramics manufacture, glass-blowing, and shipping services (Ortega Reference Ortega1982; Valenzuela Reference Valenzuela1992; Valenzuela Reference Valenzuela1995; Correa Reference Correa2013).
Like copper, Chilean silver production increased dramatically, to such an extent that in the 1850s the country was producing more silver than Peru and Bolivia (Collier Reference Collier1987; Bravo Reference Bravo2000; Gelman Reference Gelman2011; Bulmer-Thomas Reference Bulmer-Thomas2014). However, as in the copper industry, success was short-lived; silver production stagnated while its price declined sharply in the international market during the last quarter of the 19th century. A third dynamic mining sector was coal. In 1852 Chile produced just over 6,000 tons of coal, while in the second half of the 1870s the country produced over half a million tons per annum (Ortega Reference Ortega2005). Finally, after the Pacific War, nitrate dominated the Chilean export market. In 1880 Chile exported 224,000 tons; by 1900 this figure had reached 1.5 million tons (Cariola and Sunkel Reference Cariola and Sunkel1982).
This mining boom also coincided with other developments. Before 1850, the lack of a decent transport network was one of the main obstacles faced by the export sector (Coatsworth Reference Coatsworth1998). This situation started to change in the early 1850s, when steam engines, first in steamboats and later in railways and other industries, were introduced in Chile (Ortega Reference Ortega2005; Llorca-Jaña Reference Llorca-Jaña2012). That said, port facilities remained precarious for most of the period covered by this article, in particular before 1850 (Llorca-Jaña Reference Llorca-Jaña2012). In 1851 the country’s first railway came into operation. By the mid-1870s, thanks to all the railways that had been built, a national market had been created. As in most other countries, the telegraph was introduced alongside the railroads, initially connecting the main economic hubs and by 1877 it had been extended to 5,500 kms (Ortega Reference Ortega2005).
Finally, the internal road network also expanded, from 14,500 to 40,600 km between 1865 and 1875 (Ortega Reference Ortega2005; Correa Reference Correa2013). Before that, the internal road system was extremely precarious, characterised by a notorious lack of investment, the absence of a central government body in charge of public infrastructure and planning, and the lack of a water transport system (Llorca-Jaña Reference Llorca-Jaña2012; Sanhueza Reference Sanhueza2018). For example, turnpikes were almost unknown, as in most of the rest of Latin America (Bértola and Ocampo Reference Bértola and Ocampo2012). Even the road between the most important political and economic centres of the country, Santiago and Valparaiso, was in a calamitous state (Ortega Reference Ortega2005; Sanhueza Reference Sanhueza2018). Mules in particular, combined with oxcarts, were the principal means of transport, even for heavy products such as copper (Llorca-Jaña Reference Llorca-Jaña2012). All in all, the internal road and railway systems were a national disgrace before the 1850s, but they did improve later on, albeit slowly.
As the railway and road networks expanded, and external and internal demand for goods increased, agricultural production also increased significantly during the second half of the 19th century (Sepúlveda Reference Sepúlveda1959; Mamalakis Reference Mamalakis1976; Correa Reference Correa2013). Above all, it was increasing internal demand that absorbed the bulk of the production. To be able to supply internal and external markets, the sector modernised significantly, introducing machinery from abroad, better irrigation techniques, new organisational forms, all of which greatly increased productivity, and were accompanied by diversified production, marking the beginning of agrarian capitalism in Chile (Robles Reference Robles2003, Reference Robles2009). In all, the acreage under grain cultivation tripled between 1850 and 1875 (Mamalakis Reference Mamalakis1976; Loveman Reference Loveman2001), further increasing thereafter.
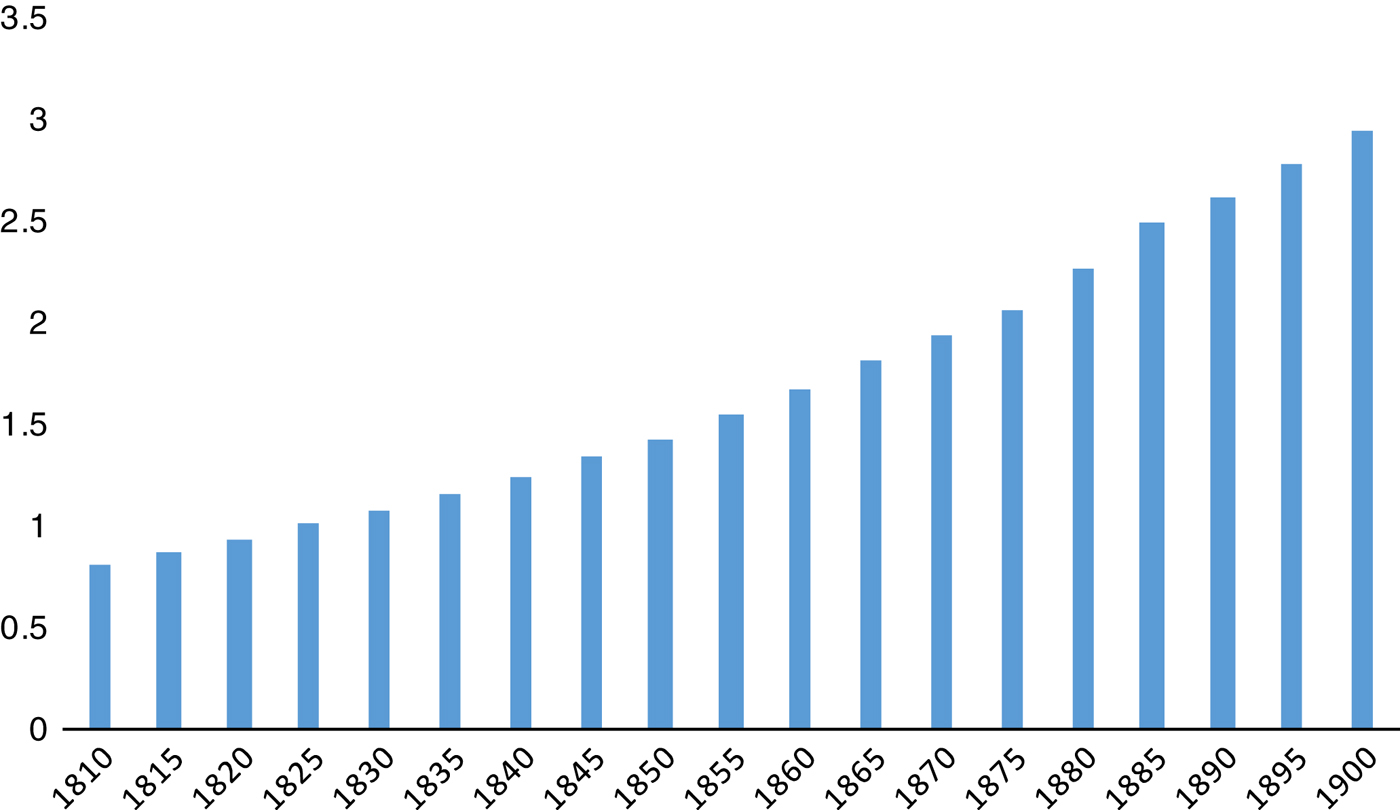
Finally, the population of the country was small, estimated at 0.8 million people circa 1810, growing quickly, to 1.4 million and three million in 1850 and 1900, respectively (Figure 3). The only period for which there are data regarding the skin colour of the population is 1813 (Chile 1813), when it was estimated that 74 per cent of the population was white, 9 per cent was mestizo, another 9 per cent indigenous and the remaining 8 per cent were either black or mulattos. Given that Chile expanded northward and southward, and also received immigrants, we are not in a position to determine how these shares changed over the rest of the period covered by this essay.
Chilean population (million people), 1810–1900
Source: Díaz et al. (Reference Díaz, Lüders and Wagner2016).

Regarding the geographical distribution of the population, based on national censuses for 1835, 1843, 1854, 1865, 1875 and 1885, we have divided the country into three large areas: North, Central Valley and South. The North was the least populated, accounting for between 10 per cent and 14 per cent of the national population, followed by the South (between 17 per cent and 25 per cent of all population). The most populated area was the Central Valley, in which between 61 per cent and 73 per cent of the population was concentrated, according to these six censuses. Finally, life expectancy was low, estimated at around 32 for most of the 1820s-1890s (Díaz et al. Reference Díaz, Lüders and Wagner2016).
3. DATA AND SOURCES ON STATURE
As is the case with most studies of Latin American anthropometry, our primary sources of information were military records, from which we collected data on the height of adult men in Chile during the 19th century. These records relate mainly to soldiers or low-ranking officers (rather than high-ranking military officers), who were representative of lower socio-economic groups, thus accounting for the bulk of the population in an unequal society such as Chile. In particular, we have resorted to an untapped collection, namely, 481 loose volumes from the Archivo Histórico del Ejército (Army’s Historical Archive, AHE, hereafter). This collection contains filiation sheets, contracts, claim sheets and medical records of members of the regular army and the militias, as well as of retired personnel. In total, our sample contains 3,283 records.
During the Independence Wars, local governments used forced enrolment (as did the militias), but for a short period of time onlyFootnote 6. From 1830 the army returned to using the system implemented in the colonial period (e.g. the first republican military ordinance largely reproduced Carlos III’s ordinance). Voluntary enrolment in all branches of the army was the norm for many decades. Fortunately, given the criticisms which have been made about samples using volunteers (Bodenhorn et al. Reference Bodenhorn, Guinnane and Mroz2017)Footnote 7, only a small proportion of our sample included volunteers. Why was this the case? First, the army was very small, if compared to militias. Between the 1830s and 1879, before the Pacific War, there were, on average, only 3,043 soldiers in the army, as opposed to over 43,000 in the militias. Second, in 1896 compulsory military service for the army was trialled, and four years later it was enforced, and the militias abolished (Hernández Reference Hernández1984; Delgado Reference Delgado2015). Therefore, from 1900 all soldiers included in our sample (who were mostly born during the 1880s and 1890s) were conscripts under universal conscription. The soldiers thus registered account for a staggering 73 per cent of the whole sample, since they entered the army after 1900. Of the remaining 27 per cent, we are not able to state exactly how many belonged to militias and how many to the army, since the name of the unit is difficult to track. Yet the militias, before being abolished, were far bigger than the regular army, and militias in turn used universal and compulsory conscription, except for public servants, from their inceptionFootnote 8. Thus, we estimate that 93 per cent of this remaining 27 per cent were members of the militias, which would take the share of those enrolled under universal conscription (either in the army post 1900 or in militias) to 98 per cent. All in all, the bulk of the soldiers included in our sample did so under universal conscription.
A common problem faced by researchers in anthropometric studies is the minimum height requirement (MHR) imposed by some armies. The sample could be truncated to the left, towards this MHR, and would not have a normal distribution, as would be expected, for the entire population of a given country. A truncated sample, therefore, would not be representative of the population under analysis (Salvatore and Baten Reference Salvatore and Baten1998; Komlos Reference Komlos2004). Another potential issue is heaping: an unusually high number of observations around rounded numbers (e.g. 160 or 165 cm). More often than not, the officials in charge of measuring recruits were tempted to round numbers up to certain heights. It is also common to find unusual numbers of soldiers measuring exactly the MHR (see Baten et al. Reference Baten, Pelger and Twrdek2009; Llorca-Jaña et al. Reference Llorca-Jaña, Navarrete-Montalvo, Droller and Araya-Valenzuela2018). Thus, the usual procedure in the literature is to start with a visual inspection of the data (Komlos and Kim Reference Komlos and Kim1990).
As can be seen from Figure 4, fortunately, we have no visual evidence of a truncated sample at any MHR. As mentioned above, most of our sample was composed of soldiers under compulsory enrolment. Early in this period the Chilean army adopted the colonial ordinances, which established a MHR of 5 feet (162.4 cm). When, in April 1839, the first army ordinance was promulgated, the MHR was kept at 5 feet. This ordinance was in force until 1869, while the 1869 decree also kept the MHR at the same level. In the last quarter of the century, the MHR was reduced to 160 cm, although we were not able to state the exact date when this change took place. Yet, despite these legal MHRs, there is no evidence of MHR in the histogram. Further, we also compute histograms by decade of birth, enrolment period, region of enrolment and army unit, and all of them show a reasonable distribution of soldiers’ height with no evidence of truncation at the MHR (results upon request), similar to that shown by Baten et al. (Reference Baten, Pelger and Twrdek2009) for Argentina, Brazil and Peru for a similar period. Only during the 1810s was the MHR enforced (see Table 2), and we have therefore ignored this data in our regressions. Figure 4 also includes a normal distribution and a kernel density estimation, both for visual comparison.
Histogram, distribution of adult male height in Chile, 1820s-1890s (in centimetres, 3,254 observations)
Source: See text.

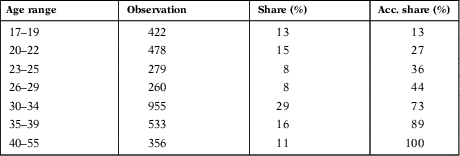
Another potential issue is the age range to be used. People continue growing until a certain age, maintain that height for several decades, and eventually start shrinking (from around 55 years old). Thus, it is important to avoid including people still growing or shrinking. Nowadays it is believed that people grow until 17–18 years of age, in particular in developed countries, but during the 19th century this limit was probably closer to 20 years (Salvatore and Baten Reference Salvatore and Baten1998). For 19th-century Latin America, the available works have taken the following age ranges: 16–39 (Grajales-Porras and López-Alonso Reference Grajales-Porras and López-Alonso2011); 17–52 (Baten et al. Reference Baten, Pelger and Twrdek2009); 20–50 (Frank Reference Frank2006), 22–49 (Salvatore Reference Salvatore1998); 23–55 (Carson Reference Carson2005). As can be seen, there is not a uniform range in the literature. Thus, we have taken the 17–55 range (see Table 1), to include as many observations as possible, although we shall test the 17–21 range in our regression analysis.
Distribution of age in Chilean soldiers per range, 1820–1899 (3,283 observations)

Source: See text.
4. GENERAL RESULTS
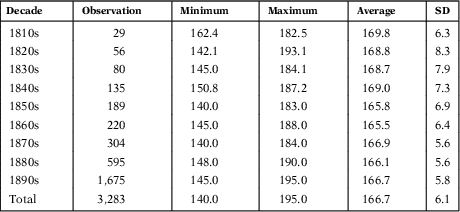
Table 2 shows the raw average height of Chilean soldiers per birth decade, as well as the number of cases included in our dataset, for those aged between 17 and 55. For the entire period, 1810–1899, the raw average height we found was 166.7 cm (with a SD of 6.11 cm), slightly lower than that already found for the colonial period in Chile (c.1730–1810), which was around 167 cm (Llorca-Jaña et al. Reference Llorca-Jaña, Navarrete-Montalvo, Droller and Araya-Valenzuela2018). This conclusion may seem surprising given that GDP per capita in this period was probably higher than in the colonial period.
Average raw height of Chilean soldiers per decade of birth

Source: See text.
Disaggregating per period, despite the low number of observations for the 1810s–1840s, it would be reasonable to conclude that the raw average height for these decades (169.0) was greater than in both the colonial period (167) and later in the 19th century. This would suggest that those born during the 1810s–1840s enjoyed some of the highest biological living standards in Chilean history, despite some being born during the political anarchy of the 1820s. This may appear surprising, given that the economic growth and the export boom described above took place after these decades (Figures 1 and 2).
Nonetheless, the data for the Chilean case is in line with that of Argentina. In a pioneering work, Salvatore (Reference Salvatore1998) estimated the average height of the Argentine population for c.1780–1840, finding two clear trends: firstly, a fall in height at the end of the colonial period (as also found by Llorca-Jaña et al. Reference Llorca-Jaña, Navarrete-Montalvo, Droller and Araya-Valenzuela2018 for Chile), and, secondly, an increase immediately after independence (as we also found for Chile), despite the political turmoil of the River Plate provinces. Likewise, for Peru, Twrdek and Manzel (Reference Twrdek and Manzel2010) found that the average height of the Peruvians increased marginally during the 1820s-1830s, but thereafter it stagnated (or declined) during the 1840s-1870s, despite the sizeable economic growth of the country led by the export sector (i.e. guano exports), during the 1840s-1870s.
Thereafter, during the 1850s and 1860s, there was a decline in average height in Chile (reaching the lowest levels of the century), and an increase during the 1870s. Yet, during the 1880s and 1890s stature declined again (if compared to the 1870s), which coincided with the first two decades of the so-called nitrate era, when the country experienced the highest export and economic growth of the century. Salvatore (Reference Salvatore2007) found that during the era of Argentine liberal progress (c.1880–1913), there were fewer improvements in Argentina’s biological welfare than could be expected based on alternative indicators such as per capita GDP. In the same vein, Baten et al. (Reference Baten, Pelger and Twrdek2009) found that average height remained nearly constant during the 19th century in Argentina. Likewise, for Mexico, the available evidence for this period accords with our findings: stagnation or deterioration of biological standards of living during episodes of economic growth. Carson, for instance, making use of prisoners’ records, found that the average height of Mexicans fell during the last decades of the 19th century. López-Alonso and Porras-Condey (Reference López-Alonso and Porras-Condey2003), in turn, found that despite the rapid economic growth of Mexico during 1870–1950, there was only a modest gain in the average height of the Mexican adult population. Also, López-Alonso (Reference López-Alonso2007), found that during the Porfiriato (1876–1910), the working class did not increase in height, despite economic growth. Finally, for Brazil, Frank (Reference Frank2006) found a fall in height, this time between the 1860s and the 1880s. The fall in Chilean stature during an economic boom thus fits within general findings for the region, and even elsewhere, such as in CanadaFootnote 9, Great Britain, the Netherlands and the United States (Komlos Reference Komlos1998; Haines Reference Haines2004). We venture an explanation for this situation in the next section, after the regression results.
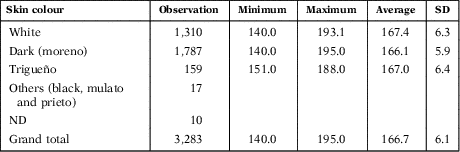
Table 3 shows average height per skin colour. In our regressions we tested the significance of this variable, but it seems clear that white people were taller than morenos, these being the two largest categories of our sampleFootnote 10. Also linked to genotype variables, and not shown here, we found that the average stature of those with either blue or green eyes was 168 cm; taller than the following eye colour category (pardos), whose average height was 166.7 cmFootnote 11. These findings suggest inequality in ethnic biological standards of living in Chile, as has also been found for other countries of the region, although to a lesser degreeFootnote 12. In the same vein, we computed height according to social status, which is a useful indicator of inequality in the biological standard of living (Steckel Reference Steckel1995). In 19th-century Chile, as during the colonial period, people from the upper social strata were referred to as «Don» and were recorded as such by the army until c.1880. Again, we found an important difference in stature; people registered as «Don» were almost 2-cm taller than the others. Although the data are not included here, we also assessed height according to occupation prior to joining the army, but only modest height differences were to be foundFootnote 13. Only professionals were clearly taller (167.8 cm), but they account for only 1.6 per cent of the sample. This combined evidence suggests inequality according to social class, as was the case for other Latin American countriesFootnote 14. This is important because height is strongly correlated to inequality, in particular for the poorer strata of society (Steckel Reference Steckel1995; Komlos Reference Komlos1998; Baten and Blum Reference Baten and Blum2014).
Raw average height per skin colour, 1810s-1890s

Source: See text.
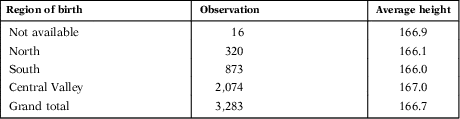
Finally, Table 4 contains raw average height per region of birth for soldiers. We have divided the geographical origins of soldiers into three large areas, in line with the national census data presented above: South, North, and Central Valley (Challú, Reference Challú2010, follows a similar procedure for Mexico). The shares of the South, North, and Central Valley were 27 per cent, 10 per cent and 63 per cent, respectively, close to the actual shares of the national censuses. Therefore, our sample is geographically representative of the whole of Chile (although the South is slightly over-represented). This caveat aside, the tallest of all were the inhabitants of the Central Valley, who were about 1-cm taller than those born in the South and the North. The lower height in the North is not surprising as it was the only region that had to import food. Fresh meat was consumed in the Central Valley and the South, while most of the meat consumed in the North was dried (charqui), which had a lower impact on height (see Baten et al. Reference Baten, Pelger and Twrdek2009).
Raw average height per birthplace, per macro-region, 1810s-1890s

Source: See text.
5. REGRESSION RESULTS AND DETERMINANTS OF HEIGHTS IN 19th-CENTURY CHILE
Next, we proceed with a regression analysis to estimate the mean height of the population, including different characteristics that may be related to adult height, and analyse how these variables affect the height of soldiers. As is often noted, there are potential empirical problems when estimating means of population height from a sample of soldiers, in particular due to MHR which truncates the distribution of the population of the observed sample. Visual inspection of the histograms shows no apparent truncation (Figure 4), and even histograms by decade of birth and enrolment show no signs of MHR (except for the 1810s, which were excluded). Finally, the mean height and standard deviation by decade of birth (Table 2) also point to the absence of truncation in the sample. We did observe some minor examples of heaping (at 160, 165 and 170 cm, for example), as is usually the case in these studies. We were confident enough with our sample to proceed with ordinary least squares regressions. Nonetheless we also performed a truncated regression at the highest known MHR and results are qualitatively and quantitatively similar.
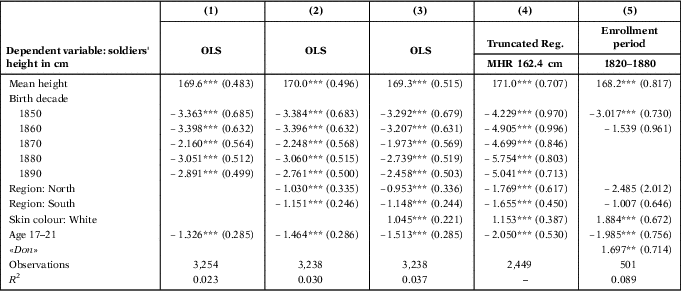
Column 1 in Table 5 shows regression results when the dependent variable is the soldier’s height in centimetres and the independent variables are indicator variables for the decade of birth and an indicator variable for soldiers aged 17–21. The estimated mean soldiers’ height was 169.6 cm, and younger soldiers were on average 1.3-cm shorter. We defined the birth decades as 1820s-1840s (reference category), 1850s, 1860s, 1870s, 1880s and 1890s; some decades were grouped due to the small number of observations. The regression results show that soldiers born in the 1850s and 1860s were on average 3-cm shorter than soldiers born prior to 1850. Moreover, cohorts born in the 1870s, 1880s and 1890s show stagnated heights, with some minor increases by the end of the 19th century. In column 2 we also included indicator variables for the geographic regions: North, Central Valley (reference category) and South. Results in column 2 show a mean height of 170 cm, and the birth decade indicators show a similar result to column 1. Both indicator variables for region of birth, North and South, show that soldiers were 1.1-cm shorter than soldiers born in the Central Valley region.
Regression results

Notes: Columns 1–3 ordinary least squares (OLS) regressions. Decade of birth is defined as 1820–1840 (the reference category), 1850, 1860, 1870, 1880 and 1890. Region dummies are defined as South, North and Central Valley (reference category). Skin colour is defined as White, Dark-Mestizo-Trigueño (reference category). Column 4 truncated regression at the minimum height requirement (MHR) 162.4 cm. Column 5 includes Don indicacor variable for soldiers enrolled before 1880. Robust standard errors in parentheses.
*** P<0.01
** P<0.05
Source: See text.
In column 3 in Table 5 we included indicator variables for skin colour White, while Dark-Mestizo-Trigueño constitute the reference category. As expected, we observed that white soldiers were on average 1-cm taller. In sum, column 3 shows consistent evidence that soldiers in the upper social strata were taller than the average population. In column 4 in Table 5 we present results for a truncated regression at the highest MHR used by the army (162.4). Although the inspection of the data suggests that MHRs were not enforced, we also include this procedure to bolster our results. As shown in column 4 of Table 5, where results are similar to those in column 3, we observe an average height of 171 cm, a drop in heights in 1850, with respect to soldiers born in 1830–1840, and thereafter stagnated heights throughout the 19th century.
Finally, in column 5 we include an indicator variable for people registered as «Don», a measure for socioeconomic background. We present regression results for soldiers enrolled between 1820 and 1880, since after 1880 the army records do not include this definition. As expected, «Don» soldiers are taller, as well as white soldiers, by about 1.7 cm. Moreover, decade indicator variables show a decrease in height for soldiers born in 1850 with respect to soldiers born between 1820 and 1840.
A comparison of results across specifications in Table 5 shows a mean height of around 170 centimetres (in particular columns 1–3), while soldiers born after 1850 were almost 3-cm shorter than those born before 1850. Height stagnated after 1850, with small to no improvements towards the end of the 19th century. There were geographical differences in stature, with soldiers coming from southern and northern regions measuring almost 1-cm shorter than soldiers from the Central Valley.
6. WHY ANOTHER CASE OF HEIGHT STAGNATION DURING AN EXPORT AND GDP BOOM PERIOD?
In this section we shall provide some plausible explanations behind the decadal movements of average height. Thus, in chronological order, the fact that the greatest average height during the 19th century was reached at the beginning of our period (1810s-1840s), when per capita GDP was lower than later in the century, is not entirely surprising. During this period the country enjoyed its lowest population density, people settled on the most fertile lands, from which food could be obtained with less physical effort. It is well-known that before industrialisation and modern economic growth, those countries self-sufficient in food, with productive land and low population density tended to have a relatively taller population (Steckel Reference Steckel1995; Komlos Reference Komlos2004)Footnote 15. Chile exemplifies these features up to the 1840s, as it was during the late colonial period (Llorca-Jaña et al. Reference Llorca-Jaña, Navarrete-Montalvo, Droller and Araya-Valenzuela2018). Furthermore, low population density helped to stop the propagation of disease (Steckel Reference Steckel1995; Komlos Reference Komlos1998), which was beneficial for the biological welfare of the population. Considering the close links between health and nutrition (López-Alonso Reference López-Alonso2015), it is worth mentioning that during the first half of the century there were no major outbreaks of either smallpox (which was the most feared disease at that time) or tuberculosis in the countryFootnote 16. This, ceteris paribus, would undoubtedly have improved the biological welfare of the population, given the fact that a disease-ridden environment has been signalled as a key determinant of height before the 20th century (Floud et al. Reference Floud, Wachter and Gregory1990; Baten and Blum Reference Baten and Blum2014). Moreover, it is also believed that lower population density facilitates, ceteris paribus, a larger number of cows and therefore better nutrition for a given population (Baten Reference Baten1999).
From the 1850s onwards, we observed a decline or stagnation in average height. During this later period there were many and deadly smallpox outbreaksFootnote 17, in particular in the years 1864, 1868, 1872, 1876 and 1880 (Illanes Reference Illanes1993)Footnote 18. There was also a cholera pandemic, which hit Chile between 1886 and 1888 (24,000 people died), a typhus epidemic (1865)Footnote 19, as well as an influenza outbreak in 1892–1893 (33,000 people died), and measles outbreaks at the end of the century (Cruz-Coke Reference Cruz-Coke1995; Aguilera and Zúñiga Reference Aguilera and Zúñiga2006).
As can be seen, the second half of the century was a dreadful time for public health in Chile, which surely impacted negatively on height and overall biological welfare. These outbreaks were even deadlier than they might have been given both the transport revolution taking place in Chile (i.e. the massive expansion of railways from the 1850s which brought people into closer and quicker contact than before), together with increasing (and related) commercialisation, as well as an increase in population and population density. Paradoxically, due to transport improvements (and increasing urbanisation), exposure to disease increased dramatically. It was only a matter of weeks before any of these deadly diseases spread over most of the country. The acceleration in population growth during the second half of the centuryFootnote 20 would also imply fiercer competition for scarcer resources, including food. Furthermore, when population growth was combined with increasing urbanisation, a breeding ground for the swift propagation of disease was created. For Chile in particular, the available data shows that the share of urban population was less than 30 per cent in 1865, increasing to 45 per cent in 1895, undoubtedly a significant and rapid growth (Díaz et al. Reference Díaz, Lüders and Wagner2016).
The last quarter of the 19th century, in particular, was a period of urban overcrowding, starvation, disease, social marginality and misery. Whole families usually lived in single rooms, through which an irrigation ditch passed, taking away waste and exposing the family to a wide range of diseases (Illanes Reference Illanes1993; Fernández Reference Fernández2015). Increasing urbanisation took place before the implementation of urban drinking water services, modern sewerage systems (vital to evacuate waste in urban areas)Footnote 21, and general basic sanitary measures, thus triggering recurrent health crises.
Health problems, as well as deficient food intake (Allende Reference Allende1939), quickly translated into high rates of mortality and morbidity. Mac-Clure (Reference Mac-Clure2012) estimated that the mortality rates for Chile during the late-19th century, in particular those of Santiago and Valparaíso, were substantially higher than in most of Europe and Argentina, affecting the poorer ranks of society and children in particularFootnote 22. In addition to the lack of a proper sewerage systemFootnote 23, a poor diet (low quantities of protein given to infants and toddlers, combined with the intake of food in bad conditions)Footnote 24, poor clothing, lack of drinking water and lack of basic hygiene habits, were the key determinants of these high mortality ratesFootnote 25. An 1893 study of the causes of infant mortality in Chile, undertaken by two Chilean practitioners, put the blame in particular on the urban ditches, the lack of sewerage, and the poor provision of drinking water, describing Santiago as «one of the unhealthiest cities in the world» (Sierra and Moore Reference Sierra and Moore1895)Footnote 26.
These poor living conditions gave birth to the so-called «Social Question» (Cuestión Social) in Chile (see Pinto Reference Pinto1994; Grez Reference Grez1998). Chroniclers of the time went so far as to maintain that the Chilean «roto» (e.g. working-class person) at the end of the 19th century was clearly slimmer and shorter than the rotos of the previous decades, due to miserable living conditions, mainly linked to increasing urbanisation. The case of Chile is in line with the available worldwide evidence linking the growth of early urbanisation with a fall in average height (Floud et al. Reference Floud, Wachter and Gregory1990; Steckel Reference Steckel1995; Haines Reference Haines2004)Footnote 27. Urbanisation meant not only overcrowding under unhealthy conditions but also the growth of a wage-labouring class (Komlos Reference Komlos1998; Haines Reference Haines2004), dependent mainly on their cash salaries (and some food given as part of their daily payment in some cases), who could not produce their own food, unlike those living in the rural areasFootnote 28. Before 1870 there was no public health service in Chile to assist those falling ill. Healthcare, restricted to a few, was in the hands of private charitable foundations, including the church. After 1870 a public national health service emerged (Urriola Reference Urriola2009)Footnote 29. The main advances in the history of world medicine had a limited impact in Chile, and this occurred mainly between 1850 and the First World War, when scientific evidence on germ theory and the existence of bacteria was finally accepted. The recognition of the importance of antisepsis, promoting better hygiene across the population (Mokyr and Stein Reference Mokyr and Stein1996), took longer in peripheral countries such as Chile.
Unfortunately, the classic studies on health and medicine for the 19th century do not provide much information on the nutritional status of the population (Aguilera and Zúñiga Reference Aguilera and Zúñiga2006; Yáñez Reference Yáñez2016, Reference Yáñez2017). There is a notorious absence of suitable data on the amount, variety or nutritional adequacy of the food intake of the population. Yet, based on general studies of workers’ income (e.g. Matus Reference Matus2012), we know that the diet of the low ranks of society was not particularly good, and that this factor was linked to poor nutrition and high child and adult mortality (Cruz-Coke Reference Cruz-Coke1928; Zárate Reference Zárate2013), the latter mainly due to tuberculosis (Mardones Reference Mardones1935)Footnote 30. Anthropometric historians usually compared the evolution of real wages to height. Unfortunately, for Chile there is a regrettable lack of wage data for the period 1810s-1870s. However, according to Matus (Reference Matus2012), during the first two decades of the nitrate boom (i.e. 1880s-1890s) there was a slight decrease in agricultural workers’ real wages in Chile, and the overall level of real wages, for the working class, was not enough to sustain a decent standard of living. Based on this evidence it is reasonable to conclude that GDP per capita increased faster in Chile than real wages did, at least during the 1880s-1890s. Future research should not only estimate real wages with precision, but also the average consumption of proteins and calories, in particular the intake of meat, milk, and legumes, all of which are key determinants of height (Mardones Reference Mardones1935). The scant available evidence suggests a low consumption of milk, legumes and meat for most of the population during the second half of the 19th century (Cruz-Coke Reference Cruz-Coke1928; González Reference González1935; Deichler Reference Deichler2016).
Chile underwent two civil wars (1851 and 1859), which should have impacted negatively on the biological welfare of the population, as most wars doFootnote 31. The fall in height in the central decades of the 19th century is also consistent with an increase in income inequality over this period. According to Rodríguez (Reference Rodríguez2017), during the 1850s, 1860s and 1870s, the Gini coefficient of personal income increased in Chile, reaching one of the highest levels in the republican history of the country. This is important because Steckel (Reference Steckel1995) has clearly established that increasing inequality is usually associated with lower adult height. Rodríguez (Reference Rodríguez2017) notes that before the 1850s inequality was lower than thereafter, mainly because of Chile’s low wealth and average income. There was also great inequality in land distribution; in particular Chile exhibited a predominance of large estates and poor working conditions for labourers. In periods of economic growth, inequality would have increased and, we believe, biological welfare would have declined. According to Rodríguez (Reference Rodríguez2017), the agricultural boom that followed the expansion of the Chilean frontier and transport improvements substantially increased the income of the richest landowners but put more pressure on agricultural workers’ conditions. Thus, only the economic elite was in a position to take advantage of the first globalisation and the nitrate boom. The richest landowners did profit (e.g. the richest 1 per cent took over one-third of the national income c.1870), but the vast majority of the population was sidelined from this process. In other words, the substantial profits generated by booming exports did not filter down to benefit working-class people, as Twrdek and Manzel (Reference Twrdek and Manzel2010) concluded when describing what also happened in Peru during the guano boom.
7. COMPARISONS WITH OTHER COUNTRIES
We follow these conclusions with two comparisons between adult height in Chile and other regions of the world. First, we compare Chile with other Latin American countries and Spain. Unfortunately, sound data are only available for Argentina, Mexico, Brazil, Colombia and Peru. In the first decades after independence from Spain, Chile´s position within Latin American countries and Spain was remarkably strong. Only Argentineans were taller than Chileans, and the average male height in both Argentina and Chile was well above that in Brazil, Peru, Mexico and Spain. However, by the end of the century, Brazil had surpassed Chile, while Spain and Mexico, although still lagging behind Chile, had significantly closed the gap. In relative terms, then, Chile’s position deteriorated within the Iberian and Latin American world during the second half of the 19th century. Nonetheless, and as advanced above, in Chile, as in the rest of the countries of the region, there was stagnation in height, despite booming exports and growing per capita GDP during the 1870s-1890s in most of the region (Kuntz Reference Kuntz2017).
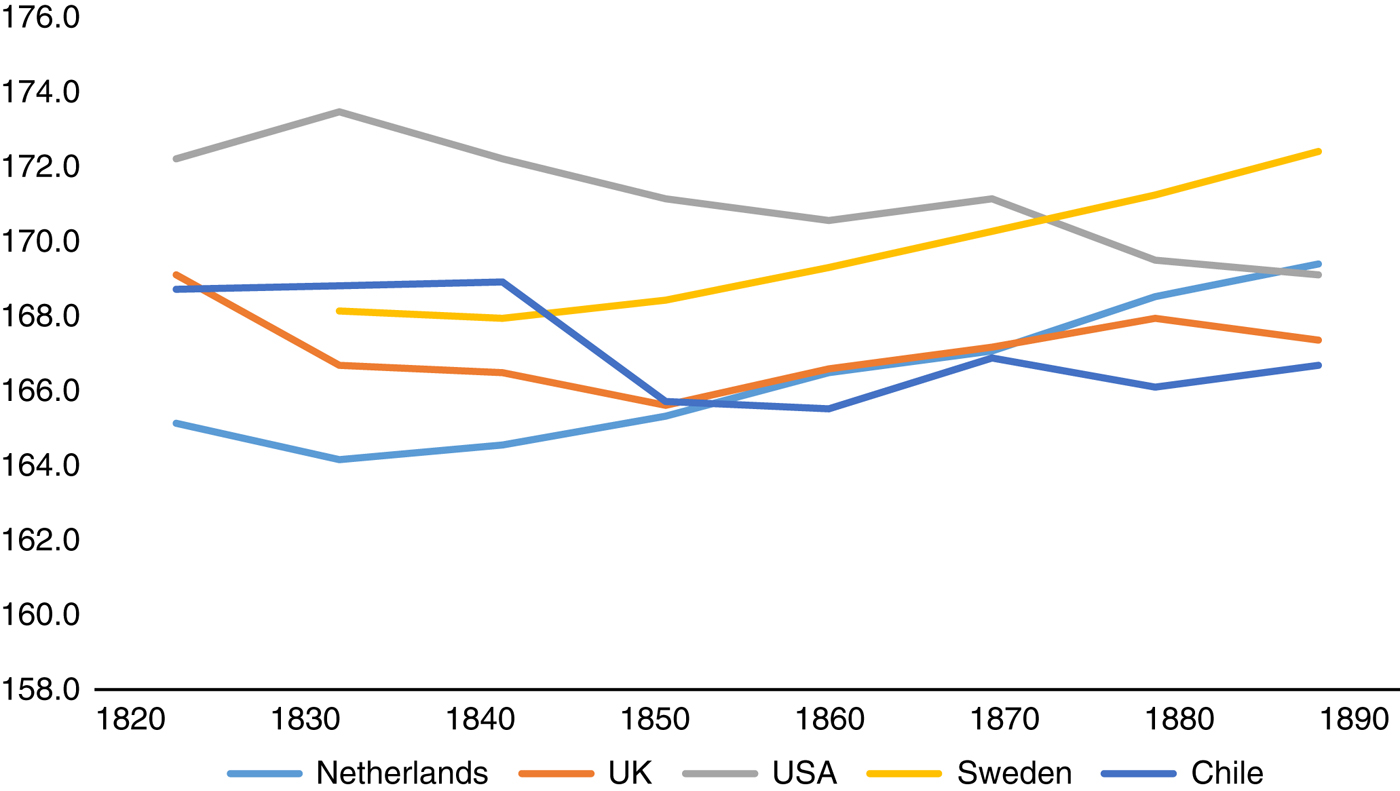
If compared to some of today’s more developed countries, at the beginning of the century Chilean height was well below that of the United States, close to that of the United Kingdom and Sweden, but well above that of the Netherlands. Yet, by the end of the century, the stature of adult male Chileans is the lowest of the sample, falling behind dramatically, in particular after the 1850s. There was, therefore, a profound divergence in the biological standards of living of the Chilean population from the economic leaders of the time (Figures 5 and 6).
Average height across countries. Chile vs. other Latin American countries and Spain
Source: For Chile, our data; for all others, https://www.clio-infra.eu/. The data from this website is mainly based on Baten and Blum (Reference Baten and Blum2014), who derived their data from national authors.

Average height across countries. Chile vs. the United States and European countries
Source: As in Figure 5.

8. CONCLUSIONS
We have provided the first series on adult male height for Chile during the 19th century. It shows that during the 1850s-1860s there was a decline in stature, and that the 1870s-1890s was a period of stagnation in the biological welfare of the population. In contrast, GDP per capita increased nearly 300 per cent between the 1810s and the 1890s. All in all, it seems clear from our anthropometric data that Chilean economic growth during the 19th century, in particular during the 1850s-1890s, did not benefit all sectors of society equally, and that it did not translate into better biological standards of living for most of the population. When we compared the average height of adult males with the evolution of both exports and per capita GDP, we found no similarities for the whole of the 19th century. The second half of the century has to be taken as a negative period for the biological welfare of the bulk of the population. Moreover, in relation to Latin America, the relative position of Chile deteriorated during the second half of the century, while the average height in the country also diverged from the average height in more developed regions.
This may seem puzzling given the copper and nitrate export booms of these decades in Chile. However, many other Latin American countries experienced the same paradox: export and economic growth going hand in hand with a decline or stagnation in male adult height for most of the population (except for the elites). Similarities can be drawn between many of today’s developed countries (e.g. the United States, Britain and the Netherlands) and Chile during the process of industrialisation; when economic growth first accelerated, there was a diminution or stagnation in the physical stature of the population. In the Chilean case, the copper and nitrate export booms did not trigger any structural change in the economy. A confluence of circumstances hindered improvements in the biological welfare of the population, despite economic growth, namely: increasing urbanisation but poor health and sanitary conditions, being a case of economic change prior to the public health revolution of the 20th century; increasing income inequality; and a deterioration in the epidemiological environment (i.e. more outbreaks of smallpox, cholera, typhus, measles and influenza than during the first half of the century, which spread more quickly than before due to increasing urbanisation and better transport networks). All in all, this «Chilean puzzle», like many other «growth puzzles», a term coined in reference to divergences of the secular trend in per capita GDP and physical stature, turned out to be not such a puzzle after all, to use Komlos’ parlance (Reference Komlos1998). We have provided, we believe, a reasonable explanation for this apparent contradiction.
ACKNOWLEDGEMENTS
This article was funded by Fondecyt Regular No. 1180005 and Proyecto Basal USA1498-LM032122. The authors are very grateful to the Departamento Cultural, Histórico y de Extensión del Ejército de Chile (DCHEE), in particular to Major Rodrigo Arredondo, Commander Pedro Hormazábal, Claudia Arancibia, Camila Pesse, Raúl Carrasco, Enrique Lorca, Christian Capstick, Manuel Madrid, and Dora Basoalto. The authors are also grateful to Katharine Wilson, Ara Murillo, Claudio Robles, Julio Retamal, Ignacio Pérez and Rodrigo Rivero for general advice and support. An earlier version of this paper was presented at the World Economic History Congress, Boston, 2018, and we are grateful to participants’ comments.