
I. INTRODUCTION
High-entropy alloys (HEAs), first introduced by Yeh et al. Reference Yeh, Chen, Lin, Gan, Chin, Shun, Tsau and Chang1 and Cantor et al. Reference Cantor, Chang, Knight and Vincent2 in 2004, have received significant interest recently due to their unique composition and microstructure, and excellent mechanical properties, including high strength and hardness, Reference Ye, Wang, Lu, Liu and Yang3 remarkable structural stability, Reference Wu, Cai, Wang, Si, Zhu, Wang and Hui4 exceptional low-temperature strength, Reference Gludovatz, Hohenwarter, Catoor, Chang, George and Ritchie5,Reference Wu, Bei, Pharr and George6 as well as good wear, corrosion and oxidation resistances. Reference Chuang, Tsai, Wang, Lin and Yeh7–Reference Liu, Wang, Zhang, Tang and Zhang10 HEAs are a new class of materials that are usually composed of five or more than five metallic elements in equimolar or near-equimolar ratios with content ranging from 5 to 35 at.%. Reference Yeh, Chen, Lin, Gan, Chin, Shun, Tsau and Chang1 HEAs may have great potential for functional and structural applications because of their single solid solution structure (face-centered cubic, FCC, body-centered cubic, BCC, or hexagonal close-packed, HCP), severe lattice distortions and sluggish diffusion. Reference Feuerbacher, Heidelmann and Thomas11–Reference Gao, Zhang, Guo, Qiao and Hawk16 Over the past years, a lot of researches have been carried out to describe the microstructure and mechanical properties of various HEA systems. The FCC type of HEAs, represented by equiatomic CoCrFeNiMn that were first reported by Cantor et al., exhibit high thermodynamic stability, good ductility but medium tensile strength. Reference Cantor, Chang, Knight and Vincent2,Reference Liu, Wu, He, Nieh and Lu17,Reference Yao, Pradeep, Tasan and Raabe18 On the contrary, the BCC type of HEAs, such as NbMoTaW Reference Zou, Maiti, Steurer and Spolenak19 and HfNbTiZr, Reference Wu, Cai, Wang, Si, Zhu, Wang and Hui4 shows high hardness and strength.
Right now, there is still limited knowledge about the microstructure features of HEAs due to the fact that the high-entropy solid solutions consist of high contents of multiprincipal elements. It is well known that the deformation mechanisms for conventional alloys can be roughly categorized into two types, either by the slip of dislocations or by twinning. However, due to high chemical disordering of HEAs and lack of thermodynamic and kinetic data for multicomponent systems, a series of fundamental issues of HEAs during plastic deformation are still undefined. Reference Zhang, Zuo, Tang, Gao, Dahmen, Liaw and Lu20 For example, it is uncertain about the differences in microstructural evolution, the plastic-deformation mechanism, and the effect of deformation on the mechanical properties between HEAs and conventional alloys. Recently, the twinning related microstructural evolution in FCC structured CoCrFeNiMn alloy during deformation was observed by Stepanov et al., Reference Stepanov, Tikhonovsky, Yurchenko, Zyabkin, Klimova, Zherebtsov, Efimov and Salishchev21 while the microstructural evolution of BCC structured HEAs during plastic deformation was rarely reported.
The equiatomic five-element HfNbTaTiZr HEA with a single BCC structure, first proposed by Senkov et al., has promising combinations of mechanical properties and oxidation resistance at both room and elevated temperatures. Reference Senkov, Scott, Senkova, Miracle and Woodward22,Reference Senkov, Scott, Senkova, Meisenkothen, Miracle and Woodward23 Thus the HfNbTaTiZr HEA may have great potential applications in aerospace and aircraft industries, which demand new metallic alloys with high-temperature load-bearing structures and thermal protection systems. However, the effects of plastic deformation and annealing on the microstructure of HfNbTaTiZr HEA have only been investigated to a very limited extent. Reference Senkov, Scott, Senkova, Miracle and Woodward22–Reference Senkov and Semiatin24 Senkov and Semiatin investigated the microstructure of a rolled HfNbTaTiZr HEA with 65 and 85% thickness reductions in the as-rolled condition and after annealing at 800, 1000, and 1200 °C. Reference Senkov and Semiatin24 It has been shown that cold rolling resulted in grain elongation and formation of deformation bands. Reference Senkov and Semiatin24 Subsequent annealing at 800 °C after cold-rolling resulted in partial recrystallization and precipitation of second-phase particles in nonrecrystallized regions, and subsequent annealing at 1000 °C after cold rolling resulted in complete recrystallization. Reference Senkov and Semiatin24 It should be noted that further investigation is still needed to explore the deformation mechanisms of HfNbTaTiZr HEA during the overall cold rolling process from low to high thickness reduction and the detailed information about the second-phase particles during subsequent annealing. Therefore, this study was to perform a detailed study on the effects of cold rolling (with thickness reductions of 20, 40, and 60%) and subsequent annealing on the microstructural evolution of an equimolar HfNbTaTiZr HEA.
II. MATERIALS AND METHODS
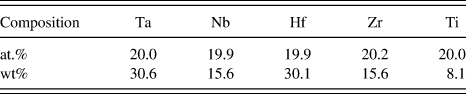
A Hf20Nb20Ta20Ti20Zr20 (at.%) HEA ingot was fabricated by arc melting equimolar mixtures of the corresponding elements, including high-purity tantalum (99.95 wt%), niobium (99.95 wt%), hafnium (99.9 wt%), zirconium (99.9 wt%), and titanium (99.995 wt%) under a vacuum condition. Arc melting of the alloy was conducted on a water-cooled copper plate. The ingot was flipped and re-melted five times to ensure the compositional homogeneity. The prepared spherical cap ingot was about 12 mm in height and 90 mm in diameter with a shiny surface, indicating that oxidation was very limited during the arc melting process. The actual alloy composition determined by inductively coupled plasma-optical emission spectroscopy (Optima 2000DV, Perkin Elmer Inc., Wellesley, Massachusetts) was given in Table I.
Chemical composition of the initial HfNbTaTiZr alloy.

Rectangular samples with a dimension of 30 × 15 × 3 mm (L × W × H) were cut from the ingot by electric discharge machine and then rolled at room temperature with a reduction of 0.3 mm per pass in thickness, to obtain deformed samples with 20, 40, and 60% thickness reductions. In this paper, the samples with 20%, 40%, and 60% reductions are marked as R20, R40, and R60, respectively, and the undeformed sample is marked as R0. Small sections of the sample R60 were encapsulated in quartz tubes backfilled with argon and annealed at 800 and 1000 °C for 2 h, followed by furnace cooling. D/max2550pc x-ray diffractometer (XRD; Rigaku Corporation, Tokyo, Japan) with Cu Kα (k = 0.154 nm) radiation was utilized to identify the crystal structure of the specimens. All the specimens were observed from the transverse direction (TD) on the longitudinal cross-section which is parallel to both the normal direction and the rolling direction (RD) of the alloy. The microstructures of the polished longitudinal cross-sections of the cold-rolled and annealed samples were determined using a scanning electron microscope (SEM) equipped with backscatter-electron, energy-dispersive x-ray spectroscopy (EDS), and electron backscatter diffraction (EBSD) detectors. Transmission electron microscopy (TEM) and scanning TEM studies were performed using a FEI Tecnai G2 F20 microscope (FEI Company, Houston, Texas) equipped with EDS for chemical analysis and high angle annular dark filed (HAADF) detector for Z-contrast imaging. The size of the electron probe for chemical analysis was within 2 nm. The intensity of the HAADF images is approximately proportional to the mean square atomic number (Z), accordingly, images of this type are known as Z-contrast images, Reference Pennycook and Nellist25 by which the area with different elemental distributions in the specimen can be easily discerned. The TEM samples were first cut with a thickness of 0.5 mm from the longitudinal cross-sections and then further mechanically thinned down to 30 μm in thickness. Those strips were glued onto copper rings with a diameter of 3 mm and were finally prepared by low-energy ion milling (30 μA, 5 kV Ar) in a Gatan 691 PIPS (Gatan Inc., Pleasanton, California) system to perforation.
III. RESULTS
A. XRD measurements
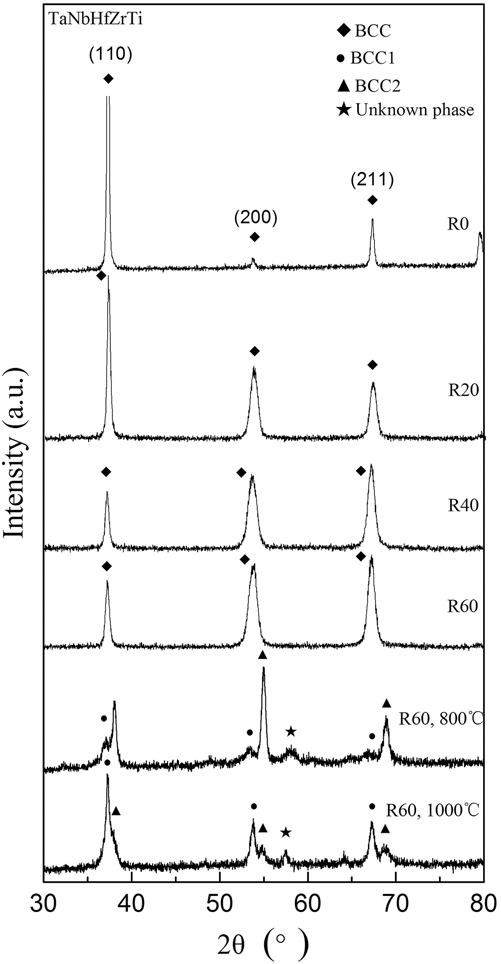
Figure 1 shows the XRD patterns of the undeformed alloy (R0), and the alloys after cold rolling (R20, R40, R60) and subsequent annealing. The undeformed alloy (R0) is found to have a single-phase BCC crystal structure. All the peaks of the alloys after cold rolling with the reductions of 20, 40, and 60% in thickness were indexed to BCC phase, indicating that no phase transformation occurred during cold rolling. It can be seen from Fig. 1 that the strongest intensity occurred at (110) for the undeformed sample, but changed to (200) and (211) for the 60% cold-rolled sample, indicating that the deformation texture was formed during cold rolling. This feature is caused by the fact that during cold rolling, crystallites rotate predominantly along the TD. Reference Li, Godfrey and Liu26,Reference Wert, Liu and Hansen27 In addition, diffraction peak broadening can be observed in the cold-rolled alloys, which can be attributed to grain refinement and the residual stress accumulation during cold rolling.
XRD patterns of the HfNbTaTiZr HEA processed by cold rolling and subsequent annealing.

After the R60 sample was annealed at 800 and 1000 °C for 2 h, the splitting of the BCC phase reflections were observed, which shows that a separation reaction leads to the formation of a structure comprising BCC1 and BCC2 phases with very close lattice parameters. Compared to the R60 sample annealed at 800 °C, the content of the BCC2 phase in the R60 sample annealed at 1000 °C decreases dramatically, while the content of the BCC1 phase increases. It should be noted that another unknown phase with minor content was also formed during the annealing process.
B. Microstructure after cold-rolling
1. EBSD observations
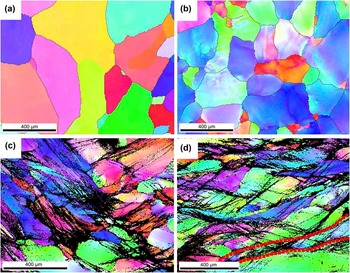
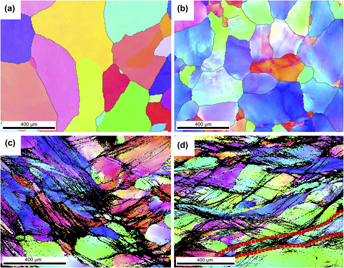
Figures 2(a)–2(d) are the representative EBSD maps of the R0, R20, R40, and R60 samples, respectively. Figure 2(a) shows that the grain shape of the R0 sample is irregular. The average grain size is about 400 μm with the size ranging from ∼30 to ∼450 μm, which was measured from several EBSD maps obtained from different regions of the R0 sample. The grains of the R20 sample [Fig. 2(b)] are slightly deformed, and the crystallographic misorientation as color gradients can be observed in the EBSD map within individual grains. After cold rolling to 40% thickness reduction [Fig. 2(c)], the deformation microbands inside the individual grains are noticeable in the EBSD map as black lines, due to the fact that the crystallographic orientations of the bands are poorly indexed as a result of dislocation accumulation. In comparison to the R40 sample in Fig. 2(c), the grains in the sample after cold rolling to 60% thickness reduction [Fig. 2(d)] are elongated more extensively along the RD and fragmented by the deformation microbands and crossing microshear bands [an example is marked by red dashed lines in Fig. 2(d)].
EBSD maps of the longitudinal cross-section of the alloy processed by cold rolling: (a) R0, (b) R20, (c) R40, and (d) R60.

2. TEM observations
TEM observation confirmed the above described microstructural evolution obtained by EBSD. Figure 3 shows the TEM images of the R0, R20, R40, and R60 samples, respectively. It can be seen from Fig. 3(a) that the R0 sample is relatively “clean”, i.e., without much dislocations and no second phase. The select area electron diffraction (SAED) pattern shown in the up left corner in Fig. 3(a) further confirms the single BCC structure, consistent with the XRD result. The dark stripes in the left of the image are induced by the mechanical stress that was generated during the ion milling process.
Representative bright-field TEM images of the alloy processed by cold rolling: (a) R0, (b) R20, (c) R40, and (d) R60.

Figure 3(b) shows that a high density of the tangled dislocations was developed in the R20 sample. These dislocations, generated by the perceptible plastic deformation, distribute uniformly and show no special pattern. With an increase of the reduction to 40%, lamellar-type microbands were well developed in some areas of the specimen, as shown in Fig. 3(c). The boundaries of the microbands were indicated by white arrows. It can be seen that the width of the microbands is around several hundred nanometers. As the thickness reduction increased to 60%, microbands with much smaller width, namely, thin lath, can be observed everywhere of the specimen, as shown in Fig. 3(d). The width of the thin laths is around tens of nanometers. The boundaries of these laths in the microshear bands delineate an “S”-type appearance. Another main feature in the microstructure of the R60 sample was microshear bands crossing a lamellar structure, as marked by dashed lines in Fig. 3(d). The microshear bands resulted from the shear localization during plastic deformation.
Figure 4 shows bright-field and dark-field TEM images of the R60 sample. It can be seen that the thin lath structure was breakdown into elongated segments, which could be resulted from the formation of transverse dislocation walls [marked by a thin arrow in Fig. 4(b)]. These transverse dislocation walls, defined as “bamboo nodes”, were formed by the accumulation of the dislocations in the lamellar. Reference Yang, Cizek, Hodgson and Wen28 In addition, the laths tend to become constricted at the transverse boundaries [an example is marked by a thick arrow in Fig. 4(b)]. It is worth mentioning that the elongated lath segments could gradually convert to fine subgrains but not evolve through a process of nucleation and growth, and these “bamboo-node” dislocation walls could convert to high-angle grain boundaries, which led to the separation of elongated subgrains with increasing the strain. Reference Yang, Cizek, Hodgson and Wen28
(a) Bright-field and (b) dark-field TEM images of the alloy after cold rolling to 60% reduction, showing that the long laths break down into subgrains.

A small number of the well-defined nanograins were also observed in the R60 sample, as shown in Fig. 5. The corresponding SAED pattern, shown in the inset of Fig. 5, consists of a set of distinctive continuous rings, indicating the existence of highly misoriented grains.
Bright-field TEM image of the well-developed fine (sub-)grains (arrowed) in the alloy after cold rolling to 60% reduction. Inset is the corresponding SAED pattern.

C. Microstructure after cold rolling and subsequent annealing
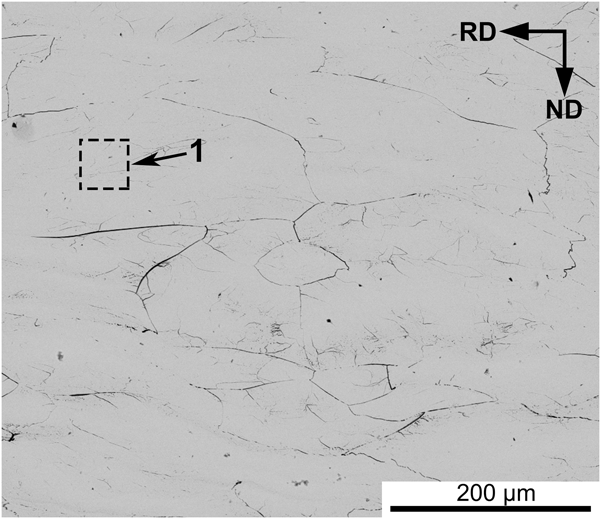
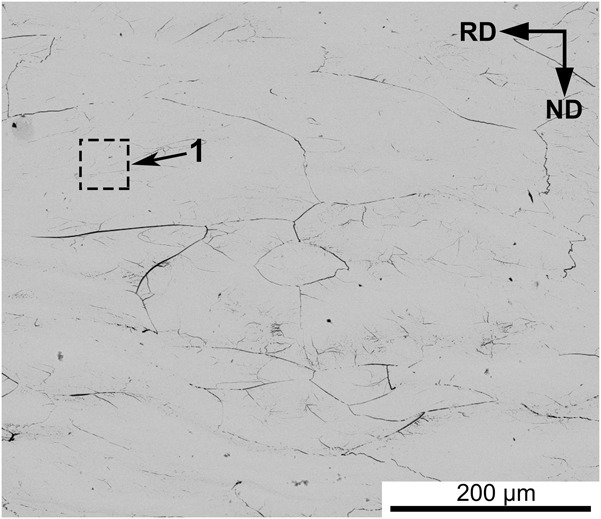
Figure 6 shows a back scattered SEM image of the R60 sample, showing that the grains are deformed and elongated along the RD. EDS analysis on region 1 in Fig. 6 reveals that the composition of grains in the R60 sample corresponds to the average composition of the alloy (Table II). Back scattered SEM image taken from the longitudinal cross-section of the R60 sample after annealing at 800 °C [Fig. 7(a)] for 2 h reveals a nonrecrystallized microstructure with a large number of the second-phase particles distributed randomly in the alloy. A high-magnification image, shown as Fig. 7(b), indicates that two regions, including region 2 with abundant second-phase particles and region 3 with predominant matrix, exist in the alloy. EDS analysis shows that the region 2 is enriched with Ta and Nb, while the chemical composition of the region 3 is close to the average composition of the alloy (Table II). It can be seen from the HADDF image [Fig. 7(c)] that the second-phase particles have an irregular shape with an average size of ∼145 nm. The EDS analysis on region 4 in Fig. 7(c) shows that the second-phase particles are enriched with Ta and Nb, which is close to the chemical composition of the region 2 in Fig. 7(b) (Table II). In addition, the EDS analysis on the region 5 in Fig. 7(c) shows that the interfacial region between the second-phase particles is slightly enriched with Ti, Hf, and Zr (Table II). Taking into account that the x-ray diffraction pattern shows the presence of three phases, it is reasonable to suggest that the matrix and second-phase particles comprise two BCC phases, respectively, and the interfacial region between the second-phase particles comprises the unknown phase, which is due to the fact that both the matrix and the second-phase particles have larger volume fraction than the interfacial region between the second-phase particles [shown in Figs. 7(a) and 7(b)].
Back scattered SEM image from a longitudinal cross-section of the R60 sample.
Chemical compositions (in at.%) of the HfNbTaTiZr alloy after cold rolling to 60% reduction and subsequent annealing.

(a) Back scattered SEM image of the longitudinal cross-section of the alloy after cold rolling to 60% reduction and subsequent annealing at 800 °C for 2 h, showing a nonrecrystallized structure, (b) high-magnification image showing that the second-phase particles distribute randomly, and (c) HADDF image showing the second-phase particles with an irregular shape.

After the R60 sample was annealed at 1000 °C for 2 h, recrystallized grain structure dominates the microstructure, with an average grain size of ∼50 μm [as shown in Fig. 8(a)]. Figure 8(b) reveals the presence of finer sub-grain microstructure inside some grains. In addition, some small sized and volume fractioned precipitates can be observed along the grain boundaries, with a dendritic morphology [Fig. 8(c)]. The EDS analysis (Table II) shows that the precipitates along the grain boundaries [identified as region 6 in Fig. 8(c)] are enriched with Ta and Nb, while the composition of the recrystallized grains [identified as region 7 in Fig. 8(c)] is close to the average composition of the alloy. It is reasonable to conclude that the matrix in Fig. 7(b) (region 3) and the recrystallized grains in Fig. 8(c) (region 7) are of the same phase due to their similar composition, and the second-phase particles in Fig. 7(c) (region 4) and the precipitates in Fig. 8(c) (region 6) are of the same phase due to their similar composition. In view of the increased content of the BCC1 phase and decreased content of the BCC2 phase when the annealing temperature increases from 800 °C to 1000 °C (XRD result in Fig. 1), it is reasonable to deduce that the matrix in Fig. 7(b) and the recrystallized grains in Fig. 8(c) comprise the BCC1 phase, and the second-phase particles in Fig. 7(c) and the precipitates in Fig. 8(c) comprise the BCC2 phase.
Back scattered SEM image of the longitudinal cross-section of the alloy after cold rolling to 60% reduction and subsequent annealing at 1000 °C for 2 h: (a) equiaxed grain structure, (b) sub-grain structure inside the grains, and (c) dendritic precipitates observed along the grain boundaries.

IV. DISCUSSION
A. Microstructural evolution during cold-rolling
In this work, the HfNbTaTiZr alloy remains a stable single BCC structure during cold rolling. Guo et al. Reference Guo, Ng, Lu and Liu29 proposed a physical parameter, defined as valence electron concentration (VEC), as an important factor for BCC versus FCC formation. According to Guo et al., Reference Guo, Ng, Lu and Liu29 a VEC of 8 or more should lead to the formation of a FCC crystal structure while a VEC lower than 6.87 should result in a BCC crystal structure. It can be calculated that the VEC value of HfNbTaTiZr alloy in this work is 4.4, within the range of the VEC for the formation of BCC phase. And the small difference in atomic size between the alloying elements could be a significant reason for favoring the formation of disordered solid solutions and suppressing the formation of intermetallic phase in HEAs. Reference Zhang, Zhou, Lin, Chen and Liaw30,Reference Guo and Liu31
Cold rolling resulted in extensive grain elongation, the formation of deformation microbands within the grains, and the formation of microshear bands. During cold rolling, the dislocation activity dominates the deformation process. The microstructural evolution of high-entropy HfNbTaTiZr alloy can be described as follows: (i) formation of dislocation tangles, (ii) formation of microbands, (iii) formation of thin laths and microshear bands containing thin laths, (iv) the transverse breakdown of the lath to elongated segments, and (v) formation of fine grains with the precursor being the elongated segment.
At low strain, the imposed strain is mainly relaxed by means of dislocation formation. With increasing the strain, microbands are formed and a high density of the dislocations distribute in the microbands. According to Hughes’ dense dislocation walls splitting mechanism for microbands formation, underlying dislocation substructure is the precursor to form the microbands. Reference Hughes32,Reference Hughes and Hansen33 The domain boundaries of the microbands are geometrically necessary boundaries, Reference Hughes, Hansen and Bammann34,Reference Kuhlmann-Wilsdorf and Hansen35 which separate grains into misoriented regions. Microbands are developed from the domain boundaries by a sluggish glide process. It was suggested that the microbands formation resulted from a continuous grain subdivision, analogous to the structure development in some metals, such as pure Ni and Al. Reference Hughes32,Reference Hughes and Hansen33 With increasing the strain, microshear bands were observed. The formation of the thinner laths with an “S” shape in the microshear bands is due to the fact that as the shear localization increased, strain became increasingly concentrated on the sheared region. For BCC metals, the establishment of a new slip system in an already established dislocation structure may result in shear localization with increasing the strain. Reference Li, Godfrey, Meng, Liu and Hansen36 The formation of microshear bands may be beneficial to accelerating the grain refinement process. Reference Xue, Cerreta and Gray37
Meanwhile, the dislocations have a tendency to become arranged in extended dislocation walls during the deformation process. Reference Zhu, Vassel, Brisset, Lu and Lu38 It has been observed that the dislocations within the laths display a tendency to accumulate at some sites to form transverse dislocation walls, which were defined as “bamboo nodes”. It has been suggested by Yang et al. Reference Yang, Cizek, Hodgson and Wen28 that the “bamboo nodes” lead to progressive breakdown of the lath into elongated segments (Fig. 3), and finally the elongated segments transform to roughly equiaxed (sub-)grains through dislocation slip and lattice rotations. Xue and Gray Reference Xue and Gray39 suggested that the driving force of this grain refinement process is mainly promoted by the conjugated shear stress.
B. Microstructural evolution during annealing treatment
Annealing of the R60 sample at 800 °C for 2 h resulted in a complex microstructure consisting (i) the matrix (BCC1 phase), (ii) abundant second-phase particles (BCC2 phase) with an average size of ∼145 nm, and (iii) the interfacial region (unknown phase) between the second-phase particles. However, annealing the R60 sample at 1000 °C for 2 h resulted in a recrystallized microstructure with equiaxial grains (BCC1 phase) and precipitates (BCC2 phase) along the grain boundaries. The temperature effect is typical for conventional single-phase alloys, which can be explained by an increase in the grain nucleation and growth rates. Reference Senkov and Semiatin24
During heat treatment at 800 °C and 1000 °C, a BCC phase separation happened, leading to the formation of two solid solution phases (BCC1 and BCC2) with very close lattice parameters but different compositions. The phase separation phenomenon in this research is similar to the investigation of Afonso et al. Reference Afonso, Ferrandini, Ramirez and Caram40 that under specific aging conditions the Ti–35Nb–7Zr–5Ta alloy underwent coherent spinodal decomposition of the β phase into two solid solutions (Nb-rich β and Ta–Zr-rich β′). It seems that the BCC structure of the HfNbTaTiZr HEA could become a metastable state with increasing the temperature to 800 °C, which was confirmed by the phase separation during annealing at 800 °C. The study of Senkov et al. Reference Senkov and Semiatin24 indicated that the decomposition of the metastable, high-temperature BCC phase in HfNbTaTiZr HEAs occurred during a very slow cooling rate (less than 15 °C/min) during annealing. Thus, the cooling rate during furnace cooling in our experiment is suitable for the decomposition of high-temperature BCC phase. Meanwhile, the sluggish diffusion effect of HEAs may have a positive effect on the precipitation of the second-phase particles (enriched in Ta and Nb) due to the slow diffusion of Ta and Nb. Reference Ye, Wang, Lu, Liu and Yang3,Reference Senkov and Semiatin24 In addition, the cold-rolling process provides a large number of the crystal defects for the nucleation of second-phase particles.
Similarly, the study of Senkov et al. Reference Senkov and Semiatin24 also observed phase separation phenomenon and second-phase particles enriched in Ta and Nb in the cold-rolled HfNbTaTiZr HEA after annealing at 800 °C, and annealing at 1000 °C resulted in a recrystallized microstructure with fine precipitates in the recrystallized grains and along the grain boundaries. However, the work of Senkov et al. Reference Senkov and Semiatin24 indicated that annealing at 800 °C resulted in a partially recrystallized microstructure with recrystallized grains enriched in Hf and Zr, and the alloy comprised a single-phase BCC structure after annealing at 1000 °C. In the present work, annealing at 800 °C resulted in a nonrecrystallized microstructure with second-phase particles distributed randomly and an unknown phase distributed in the interfacial region between the second-phase particles, and the chemical composition of the matrix was close to the average composition of the alloy. The alloy still comprised two BCC solid solution phases after annealing at 1000 °C. The difference might be due to the different initial preparation processes of the alloy (as-cast state in our case and as-homogenized state in the work of Senkov et al., Reference Senkov and Semiatin24 furnace cooling in our case and cooling at a constant rate of 15 °C/min in the work of Senkov et al. Reference Senkov and Semiatin24 ). The formation of the unknown phase can be caused by the fact that metastable phases usually form in regions differing from the nominal composition due to the micro- or even macro-segregation of the as-solidified condition.
Thermodynamic calculation in Ref. Reference Senkov, Senkova and Woodward41 indicated that three phases, including two BCC phases and a HCP phase, existed in the HfNbTaTiZr alloy in the temperature range from 719 °C to 985 °C. Meanwhile, the volume fraction of BCC1 phase (similar composition to the initial alloy) decreased and the volume fraction of BCC2 (enriched with Ta and Nb) and HCP phase (enriched with Hf, Zr and Ti) increased with decreasing the temperature from 985 °C to 719 °C. Reference Senkov, Senkova and Woodward41 Our experimental results partially support the thermodynamic analysis of HfNbTaTiZr alloy. Reference Senkov, Senkova and Woodward41 Three phases, including BCC1, BCC2, and an unknown phase, existed in the alloy with increasing the annealing temperature even to 1000 °C. In addition, with increasing annealing temperature from 800 °C to 1000 °C, the volume fraction of the BCC1 (similar composition to initial alloy) increased, while the volume fractions of BCC2 (enriched with Ta and Nb) and the unknown phase (slightly enriched with Hf, Zr, and Ti) decreased. It is reasonable to deduce that the unknown phase (slightly enriched with Hf, Zr, and Ti) in our experiment might also be the similar HCP phase to that in Ref. Reference Senkov, Senkova and Woodward41, since both phases have the similar chemical composition.
V. CONCLUSIONS
The microstructural evolution of an equiatomic HfNbTaTiZr HEA after cold rolling and subsequent annealing was studied. The TEM observation confirms that the dislocation activity dominates the deformation process at room temperature. A high density of the tangled dislocations were developed after cold rolling for 20% thickness reduction. During further deformation the dislocation density increased and microbands formed. Rolling to a reduction of 60% resulted in the formation of thin laths and microshear bands containing thin laths. The dislocations within the laths show a tendency to accumulate at some sites to form transverse dislocation walls that lead to breakdown of the lath into elongated segments, and finally to roughly equiaxed (sub-)grains through dislocation slip and lattice rotations.
During annealing at temperatures of 800 and 1000 °C, the alloy after cold rolling for 60% thickness reduction underwent BCC phase separation into two BCC solid solutions. With increasing annealing temperature from 800 °C to 1000 °C, the volume fraction of the BCC1 (similar composition to initial alloy) increased, while the volume fraction of BCC2 (enriched in Ta and Nb) decreased.
ACKNOWLEDGMENTS
The financial supports from Fundamental Research Funds for the Central Universities of Central South University, Hunan Provincial National Natural Science Foundation of China (2015JJ2206), and Project of Innovation-driven Plan in Central South University (2015CXS003) are appreciated.