Introduction
Happiness is a fundamental human goal and most people value happiness above material possessions (Diener & Oishi, Reference Diener, Oishi and Columbus2004). Having a positive affect or positive mood, satisfaction with life, quality of life and well-being are terms that have been used to define happiness. Clearly, there are distinct differences between these constructs but there is also a great deal of overlap (Kashdan et al. Reference Kashdan, Biswas-Diener and King2008), including similar associations with health and social outcomes (Steptoe et al. Reference Steptoe, Dockray and Wardle2009). The construct of well-being is considered to have a hedonic and a eudaemonic component. Hedonic well-being includes an affective component (feeling happy) and satisfaction with life (Kahneman et al. Reference Kahneman, Diener and Schwarz1999). Eudaemonic well-being, on the other hand, comprises of self-efficacy, the experience of personal growth and fulfilment, social belongingness and contribution to society (Waterman, Reference Waterman1993). The focus of this paper will be on happiness in the context of hedonic well-being.
Happiness is associated with reduced mortality in both healthy and diseased populations (Childa & Steptoe, Reference Childa and Steptoe2008) and it contributes to resilience, which reduces the risk of psychological and physical health problems. Happiness does not simply reflect an absence of depression or anxiety but it is an independent predictor of health outcomes even after neurotic symptoms have been taken into account (Weich et al. Reference Weich, Brugha, King, McManus, Bebbington, Jenkins, Cooper, McBride and Stewart-Brown2011). From an economic perspective, increasing levels of happiness may improve productivity, satisfaction and creativity at work. Therefore, not surprisingly, there has been increasing policy interest in promoting happiness (Bok, Reference Bok2010).
Few studies have examined the relationship between happiness and intellectual ability. Intelligence is related to education and job success (Schmidt & Hunter, Reference Schmidt and Hunter2004; Deary et al. Reference Deary, Strand, Smith and Fernandes2007), which suggests that people with higher intelligent quotient (IQ) might be happier. However, many studies have failed to demonstrate such an association (Washburne, Reference Washburne1941; Wessman & Ricks, Reference Wessman and Ricks1966; Palmore & Luikart, Reference Palmore and Luikart1972; Bray & Howard, Reference Bray, Howard, Bond and Rosen1980; Watten et al. Reference Watten, Myhrer and Swersen1995), possibly reflecting methodological problems such as a small or selective sample, or the use of inappropriate measures of happiness or intellectual ability. Given the discrepant findings, and methodological limitations of previous studies, there is a need to clarify whether a relationship between intellectual ability and happiness exists in a large nationally representative sample and the nature of any social and clinical determinants that may confound or mediate this relationship.
Variables of interest that are associated with both lower levels of happiness and lower IQ include: socio-economic disadvantage, e.g. lower income, fewer educational qualifications and unemployment (Watten et al. Reference Watten, Myhrer and Swersen1995; Batty et al. Reference Batty, Der, Macintyre and Deary2006; Hassiotis et al. Reference Hassiotis, Strydom, Hall, Ali, Lawrence-Smith, Meltzer, Head and Bebbington2008, Emerson et al. Reference Emerson, Einfeld and Stancliff2010); less social participation (Graney, Reference Graney1975; Kurland et al. Reference Kurland, Gill, Patrick, Larson and Phelan2006); having a small support network (Seltzer et al. Reference Seltzer, Floyd, Greenberg, Lounds, Lindstrom and Hong2005; Chan & Lee, Reference Chan and Lee2006); and needing assistance with activities of daily living (ADLs) (Kurland et al. Reference Kurland, Gill, Patrick, Larson and Phelan2006). Clinical variables of interest are neurotic symptoms and self-reported physical health. People with lower IQ are more likely to have neurotic symptoms (Seltzer et al. Reference Seltzer, Floyd, Greenberg, Lounds, Lindstrom and Hong2005; Hassiotis et al. Reference Hassiotis, Strydom, Hall, Ali, Lawrence-Smith, Meltzer, Head and Bebbington2008), and neurotic and depressive symptoms are negatively correlated with happiness (Jorm & Duncan-Jones, Reference Jorm and Duncan-Jones1990). Better self-reported health is associated with happiness (Subramanian et al. Reference Subramanian, Kim and Kawachi2005; Angner et al. Reference Angner, Ray, Saag and Allison2009) and people with lower IQ are more likely to have poorer health outcomes (Calvin et al. Reference Calvin, Deary, Fenton, Roberts, Der, Leckenby and Batty2011) and a poorer perception of their health on self-reported ratings (Seltzer et al. Reference Seltzer, Floyd, Greenberg, Lounds, Lindstrom and Hong2005).
Aims and objectives
Data from the 2007 Adult Psychiatric Morbidity Survey (McManus et al. Reference McManus, Meltzer, Brugha, Bebbington and Jenkins2009) were used to investigate whether IQ is associated with happiness. The primary hypothesis was that happiness would be lowest in the lower IQ groups and highest in the higher IQ groups. If a relationship was found, our objectives were: (1) to investigate whether this relationship was confounded by age, gender and ethnicity; and (2) if no confounding occurred, to explore whether the relationship was mediated by socio-economic and clinical factors and whether these factors vary according to the IQ group.
Method
Design and participants
The 2007 Adult Psychiatric Morbidity Survey (APMS) was conducted by the National Centre for Social Research, in collaboration with the University of Leicester as part of the national programme of surveys of psychiatric morbidity (Jenkins et al. Reference Jenkins, Meltzer, Bebbington, Brugha, Farrell, McManus and Singleton2009). It was designed to be representative of people living in private households in England. Fieldwork was conducted between October 2006 and December 2007. The sampling frame was the Small User Postcode Address File. The Primary Sampling Units were postcode sectors, which contained on average 2550 households. Addresses were initially stratified by region and by manual and non-manual socio-economic groupings. Postal sectors were then sampled from each stratum with a probability proportional to their size, resulting in 519 postal sectors being selected. In households with more than one person aged 16 years or over, one adult was randomly selected for the interview. The survey was conducted using both face-to-face interviews and computer-assisted self-completion interviews. Of those eligible, 57% (n=7461) completed the survey. Of these, 7353 were complete interviews and 50 were partial interviews, leaving a total of 7403 participants. Written informed consent was obtained from the participants.
Measures
A cross-culturally validated and widely used question ‘taking all things together, how would you say you were these days – very happy, fairly happy or not too happy?’ was used to measure happiness (Gallup, Reference Gallup1976). This question has been used in other recent studies (Cooper et al. Reference Cooper, Bebbington, King, Jenkins, Farrell, Brugha, McManus, Stewart and Livingston2011a, Reference Cooper, Bebbington and Livingstonb). Single-item questions measuring happiness have been shown to have good concurrent, convergent and divergent validity and good test–re-test reliability (Abdel-Khalek, Reference Abdel-Khalek2006).
We estimated verbal IQ using the National Adult Reading Test (NART). This is a widely used test and a validated brief measure for people who have English as their first language. The NART is largely unaffected by the presence of mental illness and neurological disorders (Crawford et al. Reference Crawford, Besson, Parker, Sutherland and Keen1987, Reference Crawford, Parker and Besson1988; O'Carroll et al. Reference O'Carroll, Walker, Dunan, Murray, Blackwood, Ebmeier and Goodwin1992). It comprises a list of 50 words and is scored by counting the number of errors made in reading out the words. A total of 531 participants did not complete the NART (e.g. English not their first language, eyesight problems, dyslexia or refusal) and were excluded. We analysed IQ using six groups with a bandwidth of 10 IQ points ranging from 70–79 to 120–129 and also analysed IQ as a continuous measure.
Other measures
Information on age, gender, ethnicity, marital status, employment (ever been employed), attainment of any educational qualifications (yes or no) and equivalized household income (total household income adjusted for the ages and relationships of household member) were collected during the interviews. High income was defined as greater than £29 826, middle income was defined as between £14 057 and £29 826 and low income was defined as less than £14 057.
Social participation was assessed by asking participants whether they were regularly involved with any clubs, organizations or activities such as educational classes, political groups, religious groups or residents' group. We defined high levels of social participation as being involved in three or more clubs or groups. Support networks were assessed by asking participants how many family and friends they felt close to. A good support network was defined as being close to more than three people (Brugha et al. Reference Brugha, Morgan, Bebbington, Jenkins, Lewis, Farrell and Meltzer2003).
Dependency in ADLs was determined by whether assistance was required with seven ADLs: personal care, medical care, preparing meals, mobility, shopping, housework, practical tasks such as decorating, dealing with paperwork and managing money (Brewin & Wing, Reference Brewin and Wing1989). We defined ADL-dependency as requiring help with one or more ADLs.
Participants were asked whether they had experienced life events such as a serious injury or assault, death of a close member of the family or friend, sexual abuse and violence at work or home (Brugha et al. Reference Brugha, Bebbington, Tennant and Hurry1985). As the experience of life events was common, we defined traumatic events as experiencing four or more life events.
In addition, clinical variables were also assessed. General health was assessed by asking people to indicate their perception of their health status on a five-point scale ranging from excellent to poor (Baron-Epel, Reference Baron-Epel and Anderson2004). This is a commonly used measure that has good reliability and is able to consistently predict survival and mortality in longitudinal studies (Lundberg & Munderbacka, Reference Lundberg and Manderbacka1996; Idler & Benyamini, Reference Idler and Benyamini1997). We categorized the responses into those reporting poor health and those reporting fair to excellent health.
The Clinical Interview Schedule – Revised (CIS-R) was used as a measure of neurotic symptoms (Lewis et al. Reference Lewis, Pelosi, Araya and Dunn1992), which includes questions on 14 types of symptom groups such as sleep disturbance, irritability, worries concerning health, and depressive and anxiety symptoms. CIS-R scores at and above and below a cut-off of 12 (corresponding to the clinical threshold for common mental disorders) were used to indicate a high or low number of neurotic symptoms.
Statistical analysis
The survey data were weighted to represent the English population by taking account of non-response, different sized households, the different characteristics of responding and non-responding households, and age, gender and region. More details are available in the main APMS 2007 report (McManus et al. Reference McManus, Meltzer, Brugha, Bebbington and Jenkins2009). The SPSS (version 17.0; SPSS, Inc., USA) ‘complex samples’ command was used for the statistical analyses, which allows for the use of clustered data modified by probability weights.
In order to validate our use of a single-item measure of happiness, we compared this item with three other items considered to measure hedonic well-being (Weich et al. Reference Weich, Brugha, King, McManus, Bebbington, Jenkins, Cooper, McBride and Stewart-Brown2011). These items assessed how much of the time, in the past 4 weeks, the participants felt: calm and peaceful; full of life; and had lots of energy. The responses to each item were recorded on a three-point scale. Spearman's rank correlation was used to compare the degree of correlation between the happiness item and the other three items, and between happiness and a composite scale containing all four items (a continuous scale).
We examined the relationship between happiness and the six IQ groups, and the relationship between social and clinical factors with both happiness and IQ, using the χ2 test. Data are presented as actual numbers and weighted percentages. Due to multiple significance testing, only results with a p value below 0.01 were considered to be significant. To further validate our happiness item, we examined the relationship between IQ groups and the three hedonic items described above.
Ordinal regression was used to examine the association between happiness (as the dependent variable) and IQ (as a categorical independent variable). Age, gender and ethnicity were then added to this model to explore whether there was confounding. Subsequently, each social and clinical variable was added separately to this ‘confounding’ model to investigate changes in the happiness–IQ relationship. The data are presented as odds ratios and 95% confidence intervals (CIs). To explore whether the social and clinical variables were acting as mediators we followed the approach described by Baron & Kenny (Reference Baron and Kenny1986) using the continuous form of IQ. Initially, an ordinal regression model was fitted containing IQ, age, gender and ethnicity with happiness as the dependent variable; the regression coefficient of IQ was noted. Then, separately the social and clinical variables were added and the new IQ coefficient stored. From this, the percentage reduction in the original coefficient could be calculated, which may be viewed as the degree of mediation. Bias-corrected CIs were calculated using the bootstrap, which is a re-sampling method commonly used to estimate standard errors and calculate CIs (Efron & Tibshirani, Reference Efron and Tibshirani1994).
Results
Validation of the happiness item with other happiness questions
The happiness item was moderately correlated with the three other items measuring hedonic happiness (see Supplementary Table S1) and strongly correlated with a composite scale that included all four items (correlation coefficient 0.70, p < 0.001). This suggests that our single measure of happiness has good convergent validity with other items measuring happiness.
Characteristics of the participants
A total of 6870 respondents completed the NART and the measure of happiness and they were included in the analysis. The mean IQ in the sample was 102.4 (s.d. = 17.2). The mean IQ for those reporting to be ‘very happy’ was 103.3 (40.2% of the sample; s.d. = 17.0); for those reporting to be ‘fairly happy’ it was 102.1 (52.4% of the sample; s.d. = 17.0), and 100.2 for those reporting ‘not too happy’ (7.4% of the sample; s.d. = 18.9). Participants in the highest IQ band (120–129) formed the highest proportion of the ‘very happy’ group (43.4%) and participants in the lowest IQ band (70–79) formed the highest proportion of the ‘not too happy’ group (11.5%). The results suggest that ‘being very happy’ increases with increasing levels of IQ (see Fig. 1; χ2 = 35.3, p = 0.001). The three other items measuring hedonic well-being (feeling calm and peaceful, having lots of energy and feeling full of life) also improved with increasing levels of IQ (see Supplementary Table S2).
Levels of happiness in different intelligent quotient (IQ) groups.

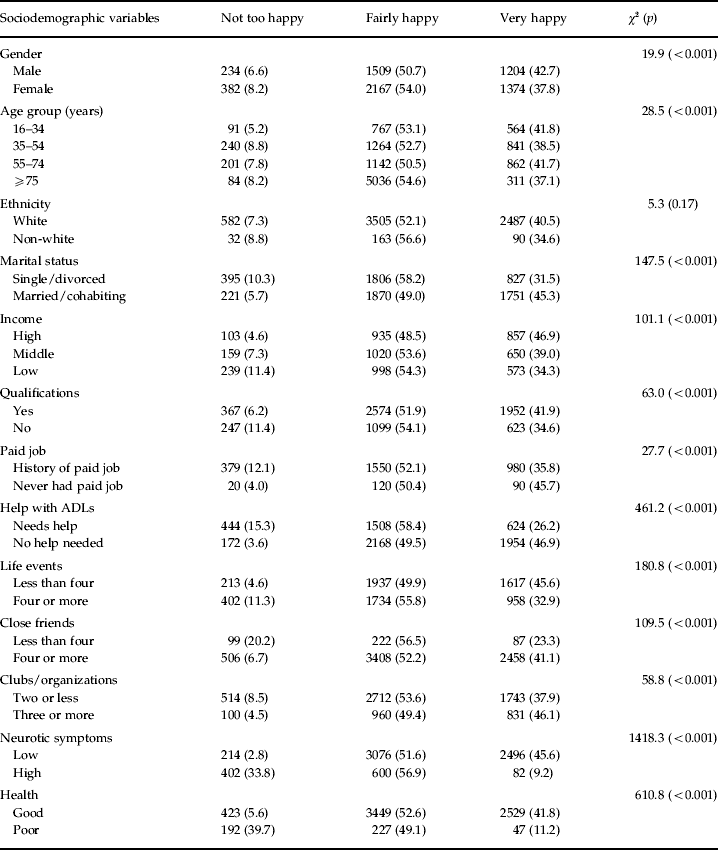
Happiness is associated with gender, marital status, income, qualifications, life events, social network size, social participation, health and neurotic symptoms. Participants who were more likely to be very happy were male, married or cohabiting, have a higher income and qualifications, have fewer life events, a larger social network, higher levels of social participation, better self-reported health and fewer neurotic symptoms (Table 1). The 16–34 and 55–54 years age groups were more likely to report being very happy compared with other age groups. A history of not being in employment was related to being very happy.
Relationship between happiness and sociodemographic variables
ADLs, Activities of daily living.
Data are given as number of participants (%).
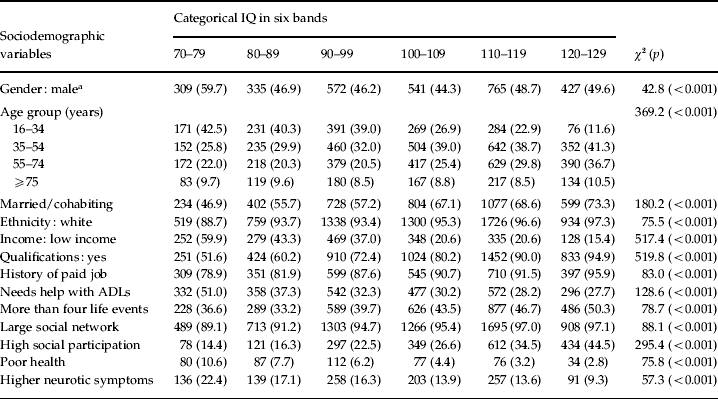
Table 2 shows the distribution of sociodemographic and clinical variables across the six IQ groups (results for continuous IQ were similar). In the lowest IQ group, there was a relatively higher proportion of 16- to 34-year-olds, males and participants from non-white ethnic backgrounds. This proportion decreases with increasing IQ groups. In general, indicators suggesting higher levels of socio-economic disadvantage were associated with the lowest IQ groups. Participants in the highest IQ group were more likely to be married and have educational qualifications, more likely to have a larger support network and have higher levels of social participation. They were less likely to have lower incomes and need assistance with their ADLs. However, they were more likely to report that they had experienced four or more traumatic events. The highest IQ group also had the lowest proportion of people with self-reported health problems and neurotic symptoms compared with the lowest IQ group.
Sociodemographic and clinical factors and their association with IQ group
IQ, Intelligence quotient; ADLs, activities of daily living.
Data are given as number of participants (%).
a Reference group = females.
Multivariate analysis
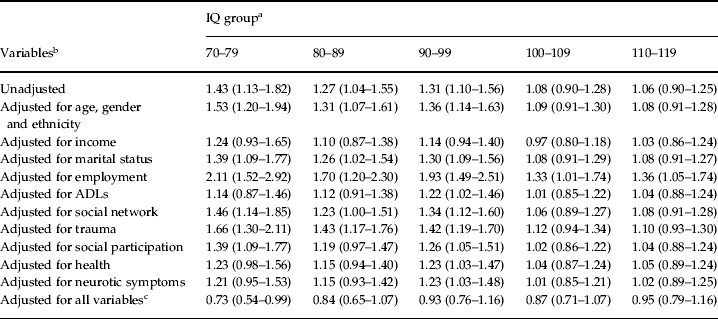
Initially ordinal regression analysis was carried out with categorical IQ and happiness as the dependent variable (Table 3). The highest IQ group (120–129) was used as the reference group. The highest IQ group was more likely to be very happy compared with the three lowest IQ groups. Gender, age and ethnicity did not confound the relationship between IQ and happiness (odds ratios changed little and did not cross one). The association was attenuated after income was entered into the model and therefore income was a full mediator of this relationship. For the 70–79 and 80–89 IQ groups, ADL dependency, self-reported health and neurotic symptoms also reduced the association and were full mediators in the relationship between these IQ groups and happiness. In addition, social participation and size of support network reduced the relationship in the 80–89 group. Following adjustment of all the main mediators, the relationship between IQ and happiness was attenuated except for the lowest IQ group, which was now found to be more happy than the highest IQ group.
Relationship between categorical IQ and happiness (very happy to not too happy) after controlling for confounders and mediators
Data are given as odds ratio (95% confidence interval).
IQ, Intelligence quotient; ADLs, activities of daily living.
a Reference group = 120–129.
b All the variables have been adjusted for age, gender and ethnicity apart from the unadjusted relationship.
c Adjusted for the variables age, gender and ethnicity and all the variables that explained the relationship between IQ and happiness in at least one of the groups (income, marital status, ADLs, social network, social participation, health and neurotic symptoms).
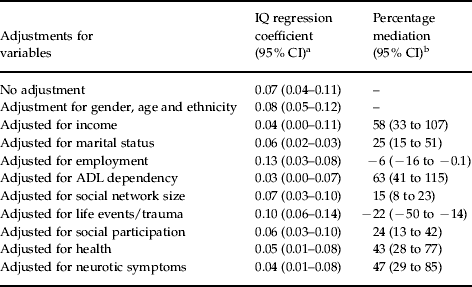
When mediation analysis was performed using the continuous IQ variable, ADL dependency, income, neurotic symptoms and health reduced the regression coefficient for the relationship between IQ and happiness to 50% of its original value (Table 4) and may therefore be considered as strong mediators of the relationship. In particular, ADL dependency was found to have the largest effect. Marital status, social participation and social network size appear to be weak mediators of the relationship. Employment and life events have no mediating effect.
Exploration of the factors that mediate the relationship between IQ (continuous score) and happiness (from very happy to not too happy) using ordinal regression
IQ, Intelligence quotient; CI, confidence interval; ADL, activity of daily living.
a The coefficients represent a 10-unit increase in IQ.
b Based on 1000 bootstrap samples.
Discussion
Main findings
In this large nationally representative study, we found that IQ is associated with self-reported happiness, which provides support for our hypothesis. Levels of happiness were lowest in the lower IQ groups and highest in the higher IQ groups. The lower IQ groups were associated with more socio-economic disadvantage and were more likely to have neurotic symptoms and report poorer health. Lower income, higher ADL dependency, poorer self-reported health and higher neurotic symptoms were strong mediators of the relationship between IQ and happiness and reduced the strength of the relationship by 50%. Higher ADL dependency was found to have the largest effect.
Our results are similar to Sigelman's study (Sigelman, Reference Sigelman1981), which was also a population-based study. However, there was no discussion about the role of potential mediators in the relationship between happiness and IQ, and this is where our study provides new insight. We defined several of the variables associated with both IQ and happiness as mediators rather than confounders because for a variable to be a true confounder it must not be on the causal pathway between IQ and happiness. Our argument for including self-reported health and neurotic symptoms as mediators rather than confounders is due to the association of IQ with poor health outcomes including higher levels of anxiety and depressive symptoms (e.g. Gale et al. Reference Gale, Hatch, Batty and Dreary2009). One study (Gottfredson & Deary, Reference Gottfredson and Deary2004) suggests that people with lower IQ are more likely to experience health problems because of a reduced propensity to learn, reason and problem-solve, and because of difficulties in adhering to complex treatments, which often require following detailed instructions, and self-monitoring.
Strengths and limitations
The large representative sample makes the findings generalizable and relevant to average households in England. The use of a single question to measure happiness is easier for people with lower IQ to understand compared with using a detailed inventory and by asking the participant to rate happiness using their own subjective criteria, it removes the limitations of having a pre-defined concept that may not be shared universally. We have shown that our measure of happiness has sufficient convergent validity as it is correlated with other questions that measure hedonic well-being. Despite this, the subjective nature of the happiness measure may affect its validity and the use of a single-item question may be less valid in those with higher IQ. Daily fluctuations in mood may also influence how people respond to the question.
The NART was used to estimate IQ. It is influenced by level of education and is only suitable for those who have English as their first language. It is therefore likely to underestimate IQ scores in participants whose first language is not English and may explain why participants from non-white ethnic groups had lower IQ scores. In addition, the finding that younger participants aged 16–34 years were more likely to have lower IQ scores suggests that the diverse use of language may increase with age and education. Another limitation of using the NART is that it tends to underestimate the IQ scores of those who have a high or above-average ability, which may explain why extreme IQ scores were not captured. Tests of non-verbal intelligence are less likely to be influenced by language skills and education, and may be a preferable measure of IQ in a population-based sample.
The cross-sectional design prevents us from drawing conclusions about the direction of causality. It is possible that happiness may increase IQ. However, being happier is unlikely to increase the NART IQ score significantly, as it is determined by the ability to pronounce words. Another issue is the temporal relationship between IQ and the mediators. Lower income and poorer education in early life could lead to a poorer performance on the NART. Measures of IQ that examine both verbal and non-verbal performance could provide more clarity. There is also a lack of longitudinal data exploring the relationship between IQ and happiness. One study that examined IQ at two time points (age 11 and 79 years) found that IQ and cognitive changes were not related to life satisfaction (Gow et al. Reference Gow, Whiteman, Pattie, Whalley, Starr and Deary2005). However, changes may have occurred in between these time points.
Implications of findings
This study suggests that IQ is a determinant of happiness, mediated by socio-economic and clinical variables. In particular, people with an IQ between 70 and 89 are more likely to be socially disadvantaged and less happy compared with people with higher IQ. People with an IQ between 70 and 85 are considered to have borderline intellectual impairment and there is evidence that this group has a higher incidence of common mental disorders (Hassiotis et al. Reference Hassiotis, Strydom, Hall, Ali, Lawrence-Smith, Meltzer, Head and Bebbington2008) and suicidal behaviour (Hassiotis et al. Reference Hassiotis, Tanzarella, Bebbington and Cooper2011). Our findings provide evidence for the need to better support this group.
Possible interventions that could benefit people with lower IQ are those that attempt to reduce the social inequalities that are direct mediators of happiness. These may include: increasing income and earning potential by enhancing vocational skills through education and employment schemes; improving physical health (such as targeted health promotion in primary care, provision of ‘accessible’ or easy-to-read information leaflets and assistance with adhering to treatment regimens); improving mental health through proactive detection and treatment in primary and secondary care and possibly focusing on those with milder forms of cognitive and social impairments. In addition, recent findings from the positive psychology literature that psychological interventions can enhance happiness in individuals with normal intellectual functioning (Seligman et al. Reference Seligman, Steen, Park and Peterson2005) may be worth considering in those with lower IQ. There is also some evidence that long-term intensive strategies directed at young children from socially deprived backgrounds, such as the Carolina Abecedarian project, can have long-lasting effects on enhancing IQ and improving academic performance (Campbell et al. Reference Campbell, Ramey, Pungello, Sparling and Miller-Johnson2002). Such interventions are likely to be costly but the initial costs may be offset by future benefits such as a reduced reliance on state benefits and better mental and physical health.
Although this study provides some evidence for the relationship between IQ and happiness, longitudinal studies that examine changes in IQ, sociodemographic factors and happiness in cohorts from early life through to adulthood are required to fully establish the nature of the relationship.
Supplementary material
For supplementary material accompanying this paper visit http://dx.doi.org/10.1017/S0033291712002139.
Acknowledgements
The APMS was commissioned by the National Health Service Information Centre with funding from the UK Department of Health. No funding was received to complete the analysis and interpretation of data for this paper.
Declaration of Interest
None.